
- Institute of Plant Nutrition and Soil Science, Christian Albrechts University, Kiel, Germany
Knowledge concerning apoplastic ion concentrations is important for the understanding of many processes in plant physiology. Ion-sensitive fluorescent probes in combination with quantitative imaging techniques offer opportunities to localize, visualize, and quantify apoplastic ion dynamics in situ. The application of this technique to the leaf apoplast is complicated because of problems associated with dye loading. We demonstrate a more sophisticated dye loading procedure that enables the mapping of spatial apoplastic ion gradients over a period of 3 h. The new technique has been used for the real-time monitoring of pH dynamics within the leaf apoplast in response to NaCl stress encountered by the roots.
Introduction
The apoplast is of major significance for the nutrition of higher plants (Sattelmacher et al., 1998). Knowledge of the apoplastic ion concentrations is necessary for the understanding of many transport processes across the plasma membrane, of membrane potentials, and of cell expansion. The activity of extracellular enzymes, the binding of ligands to receptors, and the wall structure are all likely to be affected by the apoplastic environment, which is known to be a polarized microenvironment for selective ion binding (Grignon and Sentenac, 1991; Canny, 1995; Mühling and Sattelmacher, 1995; Fricker et al., 1999). Because of the quantitative importance of ions and the impact of their apoplastic distribution on metabolic regulation, the localization, and quantification of ions is important for the understanding of the nutritional physiology of higher plants (Grignon et al., 1997).
The combination of ion-sensitive fluorescent probes with quantitative imaging techniques provides opportunities to localize, visualize, and quantify ion dynamics in situ via the technique of ratio imaging (Fricker et al., 1997a, 2008). Use of ratiometric analysis allows high temporal and spatial resolution with a minimum of perturbation to be achieved (Fricker et al., 1999). Although ratio imaging has been successfully employed to measure cytoplasmic calcium and pH in plants (as summarized by Fricker et al., 1994), little information is available on the application of this technique to the measurement of apoplastic ion concentrations (Taylor et al., 1996). The method has however been successfully used to measure apoplastic pH (Hoffmann et al., 1992; Hoffmann and Kosegarten, 1995; Mühling et al., 1995; Taylor et al., 1996; Bibikova et al., 1998; Mühling and Läuchli, 2000; Yu et al., 2001; Pitann et al., 2009) and, to a lesser extent, apoplastic potassium (Mühling and Sattelmacher, 1997; Mühling and Läuchli, 2000), calcium (Mühling et al. 1998), and sodium (Mühling and Läuchli, 2002). To the authors’ knowledge, no ratiometric, non-transgenic in planta measurements are available that show leaf apoplastic ion dynamics by using ratio imaging. This is mainly attributable to problems associated with gaining access to the intact leaf apoplast (Fricker et al., 1994). The major difficulty here remains the development of appropriate loading protocols to introduce the fluorescent ion probe into the apoplast of a living plant without destroying the cell membranes, which in consequence would allow the dye to diffuse into the symplast, leading to an erroneous quantification of cytosolic pH signals. However, in planta analysis is important because it assures that the apoplast operates in a correct physiological context and hence includes the effects of cell–cell interactions and the mechanical, ionic, and physiological effects of the extracellular matrix of cell–wall interactions (Errington et al., 1997; Fricker et al., 1997b).
Here we present a non-invasive approach for loading a fluorescent ion indicator into the leaf apoplast of an intact plant (Vicia faba L.). In combination with camera-based inverse fluorescence microscopy, ratiometric in planta mapping of ion dynamics in various apoplastic components was achieved over a period of hours.
Materials and Methods
Cultivation of Plant Material
Vicia faba L., minor cv. Scirocco (Saaten-Union GmbH, Isernhagen, Germany) was grown under hydroponic culture conditions in a climate chamber (14/10 h day/night; 20/15°C; 50/60% humidity). Seeds were soaked in an aerated CaSO4 solution (0.5 mM) for 1 day at 25°C and subsequently placed into quartz sand moistened with CaSO4 (1 mM). After 7 days of germination, seedlings were transferred to plastic pots containing one-quarter-strength aerated nutrient solution. Following 2 days of cultivation, the concentration of nutrients was increased to half-strength and, after 4 days of cultivation, to full-strength. The nutrient solution had the following composition: 0.1 mM KH2PO4, 1.0 mM K2SO4, 0.2 mM KCl, 2.0 mM Ca(NO3)2, 0.5 mM MgSO4, 60 μM Fe–EDTA, 10 μM H3BO4, 2.0 μM MnSO4, 0.5 μM ZnSO4, 0.2 μM CuSO4, 0.05 μM (NH4)6Mo7O24. The solution was changed every third day to avoid nutrient depletion. After 30 days of plant cultivation, intact growing leaves with an average leaf area of 7 cm2 were sampled for in situ pH recording.
Dye Loading
For the purpose of ratiometric in planta measurements, the fluorescent pH indicator was loaded into the leaf apoplast of an intact plant. For this, the opening of a syringe was carefully pressed onto the abaxial leaf side (no needle was attached on the top of the syringe). By means of gentle pressure, 50 μL of 25 μM Oregon Green 488 dextran (Invitorgen GmbH, Darmstadt, Germany; dissolved in deionized water) were fed into the apoplast, whereby not the complete, but only a small part of the apoplast was loaded. The loading procedure could easily be monitored because the loaded area appeared darker than its surroundings (see Figure A1 in Appendix). In order to avoid measurement artifacts caused by the possible impact of the loading procedure on leaf physiology, images were collected (1) adjacent to the area that had been loaded and (2) at the adaxial leaf side. This was possible since the dye proved to be mobile within the apoplast (described in detail in section Results and Discussion).
Inverse Microscopy Imaging
A Leica inverted microscope (DMI6000B; Leica Microsystems, Wetzlar, Germany) connected to a DFC-camera (DFC 360FX; Leica Microsystems, Wetzlar, Germany) via a 20-fold magnification, 0.4 numerical aperture, dry objective (HCX PL FLUOTAR L, Leica Microsystems, Wetzlar, Germany) was used for image collection. An HXP lamp (HXP Short Arc Lamp; Osram, München, Germany) was used for illumination at excitation wavelengths of (ex) 440/20 and 495/10 nm. Exposure time was 25 mS for both channels. Light intensity and camera gain were coupled for both channels, ensuring identical excitation conditions. Excitation filters were switched by means of a filter wheel. The dye fluorescence at both excitation channels was collected by using a 535/25 nm emission band-pass filter (BP 535/25; ET535/25M; Leica Microsystems, Wetzlar, Germany) and a dichromatic mirror (LP518; dichroit T518DCXR BS, Leica Microsystems, Wetzlar, Germany). Time series were collected with a time interval of 2 or 5 min. During the measurements, leaves were not detached from the plant and the plants were supplied with aerated nutrient solution. The use of microscopy-based techniques for mapping ion concentrations in the leaves of living plants over several hours involves the problem that, from time to time, the specimen shifts out of the focal plane. This can be ascribed to the growth of the stem or the leaf; the latter growth can attain 4–6.25 mm2/h (Dennett et al., 1978). In order to avoid any shifting of the specimen, care must be taken that the region of interest is firmly attached to the measuring device.
Ratiometric Analysis
Fluorescence ratio analysis corrects quantitative fluorescence imaging with regard to artifacts in signal strength associated with sample path length, dye distribution, leakage, and photobleaching (Bright et al., 1989; Gilroy, 1997). As a measure of pH, the fluorescence ratio F495/F440 (Pitann et al., 2009) was obtained by using the pH-sensitive fluophore Oregon Green 488 that is conjugated to 10 kDa dextran. The F440 signal was captured because this fluorescence is almost insensitive to protons, whereas the F495 signal highly depends on protons. An analysis of a time series was carried out by using Leica Application Suite Advanced Fluorescence, (LAS AF software, version 2.3.5, Leica Microsystems, Wetzlar, Germany). Ratio images were calculated on a pixel-by-pixel basis as F495/F440. The background noise values were subtracted at each channel. For pseudo-color display, the ratio was coded by hue on a spectral color scale ranging from purple (no signal), over blue (lowest pH signal; pH 3.9), to pink (highest pH signal; pH 6.3), with the limits being set by an in situ calibration. Ratios below 1.1 (corresponds to pH ≤ 3.9) and above 3.6 (corresponds to pH ≥ 6.3) were not considered, because they proved to lie outside the linear range of the in situ calibration (Figure A2 in Appendix). Quantitative measurements were calculated as the ratio of the mean intensity for user-defined regions of interest (ROIs).
In situ Apoplastic pH Calibration
For converting fluorescence ratio data taken from living plants into apoplastic pH values, an in situ calibration procedure was performed. Hence, 25 μM Oregon Green dye solutions buffered with 100 mM (2-[N-morpholino]ethanesulfonic acid, MES) to a pH ranging from 3 to 7 (steps of 0.5 pH units) were loaded into the leaf apoplast. The Boltzmann fit was chosen for fitting sigmoidal curves to calibration data (Figure A2 in Appendix) as described by Schulte et al. (2006). Fitting was performed by using Origin 7.0 (OriginLab Corp., Northampton, MA, USA).
Confocal Laser Scanning Microscopy
To demonstrate that no Oregon Green 488 dextran had entered the cytosol unintentionally, CLSM-imaging via a Leica TCS SP1 confocal laser scanning system (Leica Microsystems, Wetzlar, Germany) was carried out. For dye excitation, the 488 nm beam line of the Argon laser was chosen. The dye fluorescence was collected by using an emission bandwidth at 514–556 nm (green channel). A planapochromatic objective (HC PL APO CS 10.0 × 0.40; Leica Microsystems, Wetzlar, Germany) was used for image collection. The three-dimensional XYZ-image stack was created on the basis of 30 xy sections. Step size was 2.04 μm.
Gas Exchange and Spad Readings
Gas-exchange parameters such as stomatal conductance to H2O (mol H2O m−2 s−1) were measured with an open-flow gas-exchange system (portable photosynthesis system; LI-COR Biosystems GmbH, Bad Homburg, Germany) with an integrated fluorescence chamber head (LI-COR Biosystems GmbH, Bad Homburg, Germany). Leaves were placed across a 2 × 3 cm leaf cuvette. The conditions for the measurements inside the chamber were equal to the outside conditions in the climate chamber. Light was provided by an LED red light source built into the top of the leaf chamber (100 μmol quanta m−2 s−1) and the CO2 concentration was controlled by a Li-Cor LI-6400 CO2 injection system. Stomatal conductance was calculated by the internal software. The relative chlorophyll concentration of the leaves was measured with a portable chlorophyll meter (SPAD-502, Minolta, Japan). At least fifteen SPAD-502 readings for each leaf were averaged by the internal software of the SPAD-502 meter and were taken as a single data point for each biological replicate.
Leaf Area
Leaf area was calculated by means of measuring the length and maximum breadth of the leaflet, whereas lengths and breadths were converted to area by multiplying their product by 0.764 according the formula given by Dennett et al. (1978). Leaf area (cm2) was chosen as a measure for leaf growth.
Data Evaluation
The t-test and the paired t-test, as outlined by Köhler et al. (1984), were used to test for differences between mean.
Results and Discussion
Dye Loading Procedure
In planta measurements of apoplastic ion dynamics by using microscopy-based ratio analysis require that the ion indicator is inserted into the leaf apoplast of an intact leaf. Traditional dye loading procedures, such as the time-consuming transpiration-driven loading technique via the petiole or the pressure loading technique of cut leaf discs, do not allow the in situ monitoring of ion concentrations over an extended period of time. In both cases, such monitoring is not possible because the leaves are detached from the plant. However, by gently feeding the ion indicator into the leaf apoplast with the above-described method (see section Materials and Methods), the dye can be inserted into an intact plant system. A prerequisite for in situ studies of the apoplastic microenvironment is that the ion indicator is linked to a dextran molecule that avoids compartmentalization of the indicator into the symplast. Inverse fluorescence microscopy images at ex 495 and ex 440 nm (Figure 1) and CLSM images at ex 488 nm (XYZ-image stack; Movie S1 in Supplementary Material) indicate that the dye does not enter the cells. If the dye had entered the tissue unintentionally, then the dye signals would be emitted from the cells. However, the dye signals solely have their origin in the apoplastic space, whereas the tissue appears dark, indicating that no fluorescence signal is emitted from the cells themselves (Figures 1A,B; Movie S1 in Supplementary Material). Immediately after the dye is loaded, the flooded apoplastic area is filled with water. This represents an artificial surrounding for the plant because, under normal physiological conditions, the apoplastic fluid is only a thin film (Felle, 2001). For this reason, measurements should not be started before the water has disappeared through the stomata of the intact leaves. Evidence that the loaded water can exit the plant apoplast is demonstrated in Figure 2 and in Figure A1 in Appendix. The water droplets on the bright-field images in Figures 2B-i and C-i strongly suggest that the water has left the apoplast through the stomata. The corresponding fluorescent images in Figures 2B-ii and C-ii demonstrate that no dye exits the apoplast together with the water droplets. Otherwise, these droplets would appear in pseudo-green when illuminated with ex 495 nm. The finding that the apoplastic space becomes free of excess water is important for the ratio analysis, because (1) the presence of water within the apoplast causes an acute lack of oxygen to which all the involved cells respond and (2) the water would dilute the apoplastic ion concentration (Felle and Hanstein, 2002). Another point that needs to be considered is the potential mechanical stress to which the leaf is exposed during dye loading. Although only small volumes (max. 50 μL/leaf apoplast) are gently fed into a part of the leaf apoplast, the fluid might interact through adhesive forces with the cell walls and plasma membranes and might thus stretch-activate channels that then release ions and organic acids (Felle and Hanstein, 2002). Hence, images are collected (1) at the earliest at 1.5 h after loading and (2) not at the dye-loaded area itself but adjacent to the loaded area. The latter is possible because the dye is mobile within the leaf apoplast of the living plant and is carried to the faces of the leaf edges (Figure 3). The mobility of the dye suggests possible alterations of the initial dye concentration (25 μM) within the apoplast. We have tested whether differences in dye concentration ranging from at least 10–150 μM Oregon Green 488 dextran still produce stable F495/F440 ratios. At all concentrations, the ratios are constant at 2.5 (Table 1). Moreover, changes in dye concentration do not represent a major problem, because differences in local indicator concentrations are corrected by mean of the ratio analysis (Gilroy, 1997).
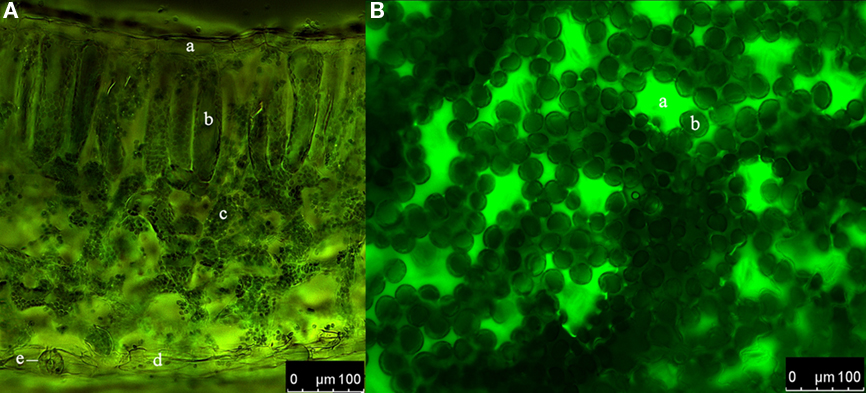
Figure 1. Distribution of the dextran-conjugated dye Oregon Green 488 within the leaf apoplast of Vicia faba L. directly after loading. (A) Cross-section. Overlay of ex 495 nm pseudo-green fluorescence image and ex 440 nm pseudo-red fluorescence image. a, adaxial epidermis cell; b, palisade cell; c, spongy cell; d, abaxial epidermis cell; e, stomatal apparatus. (B) Adaxial leaf face. Pseudo-green fluorescence image at ex 495 nm. a, stomatal cavity; b, palisade cell. Tissue in (A) and (B) appears dark indicating that no fluorescence signals are emitted. This demonstrates that no dye has entered the cells. In contrast, the apoplastic space appears in pseudo-color because of the dye emission.
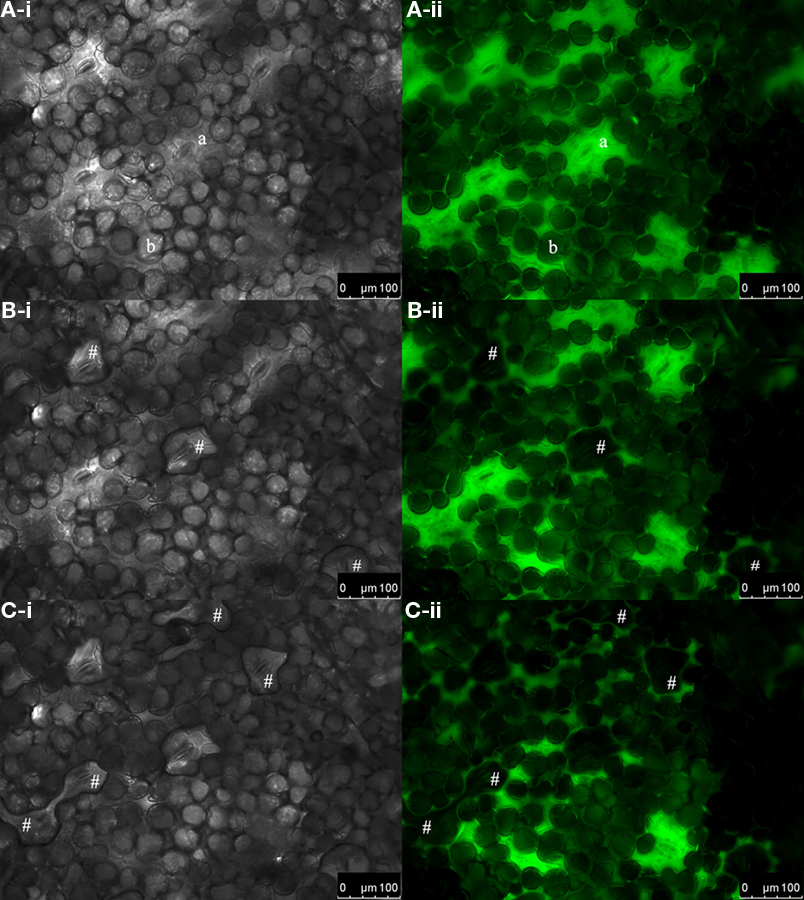
Figure 2. Excessive water exits the apoplast through the stomata. Bright-field images of the adaxial leaf face (gray-scaled; A-i, B-i, and C-i) and corresponding pseudo-green fluorescence images at ex 495 nm (A-ii, B-ii, and C-ii). Images were collected (A) immediately after dye loading and at (B) 2 min and (C) 10 min after loading. (A-i, -ii) Immediately after loading, no water droplets are found to be located onto the stomata. (B-i) Water droplets that had left the apoplast through the stomata 2 min after dye insertion are indicated by #. (B-ii) The corresponding fluorescence image at ex 495 nm reveals that these droplets did not contain any dye, as otherwise fluorescence signals would be emitted at ex 495 nm and appear in pseudo-green. (C-i and C-ii) After 10 min, more water had left the apoplastic space as indicated by #. a, stomatal cavity; b, palisade cell.
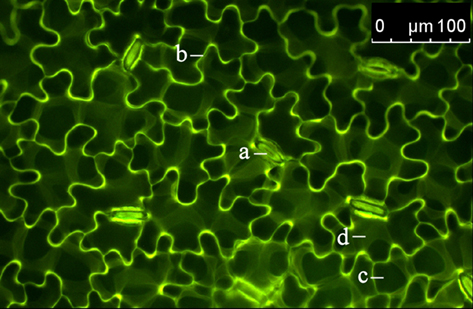
Figure 3. Distribution of the dextran-conjugated dye Oregon Green 488 at 1.5 h after the loading event. Adaxial leaf face. Overlay of pseudo-green fluorescence image at ex 495 nm and pseudo-red fluorescence image at ex 440 nm. Images were collected at the leaf edges adjacent to the area that was loaded with the dye. The detection of dye emission signals at an area that was not loaded with the dye itself indicates that the dye is mobile within the leaf apoplast. This allows apoplastic pH to be measured in areas of the leaf apoplast not affected by the dye loading. a, stomatal apparatus; b, epidermal apoplast; c, palisade cell (dark structure; no dye signal); d, apoplast surrounding palisade mesophyll.
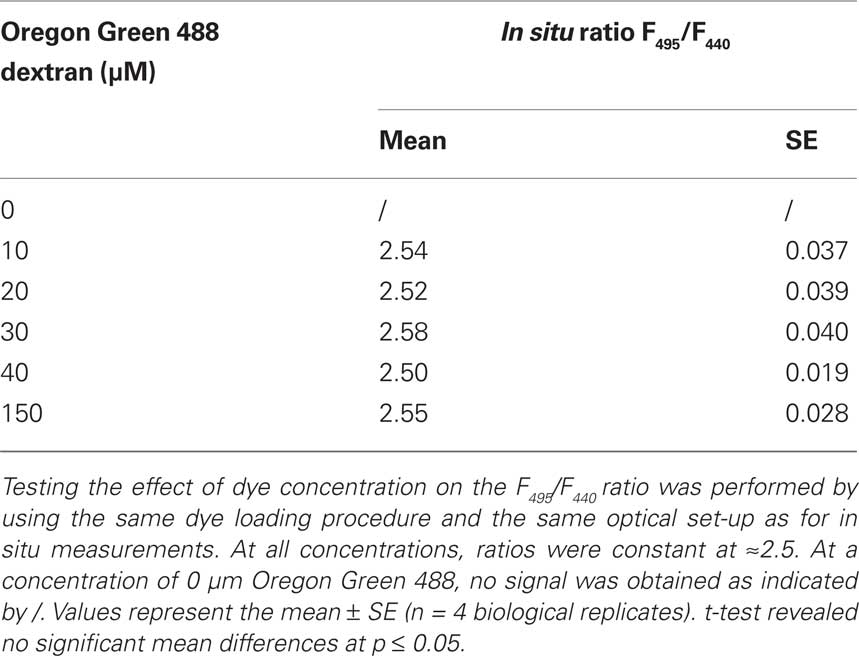
Table 1. Effects of various Oregon Green 488 concentrations on the F495/F440 ratio.
In planta Real-Time Imaging of Leaf Apoplastic pH Dynamics
To demonstrate that the improved dye loading procedure enabled in planta monitoring and the quantification of apoplastic pH dynamics in real-time, an intact Vicia faba leaf was prepared with the pH indicator. Subsequently, the intact leaf was placed on the measuring device. Throughout the experiment, the plant itself was well supplied with aerated nutrient solution. An effect of the leaf apoplastic pH was induced by adding 50 μL of a 10 mM NaCl solution onto the surface of a Vica faba leaf. Within 5 min, leaf pH within the stomatal cavity, the epidermal apoplast, and the apoplast surrounding the palisade tissue transiently increased, whereas the pH within the palisade apoplast became the most alkaline (Figure 4). After 25 min, the pH began to normalize and finally reached the range at which the alkalinzation had started before the leaves were treated with NaCl stress. This time course demonstrated the suitability of this dye loading approach for quantitatively monitoring leaf apoplastic pH dynamics. In general, such monitoring is also possible with ion-sensitive micro-electrodes. However, micro-electrodes take measurements at a single point, i.e., the stomatal cavity, whereas microscopy-based techniques enable quantitative data to be averaged over a larger area of the leaf apoplast. Furthermore, the high resolution of these microscopy-based imaging analyses allows spatial ion gradients to be discriminated in various apoplastic components (Figure 4). Therefore, the informative value of a single measurement now increases since the data provide more information about the spatial concentration and the temporal course of the ion of interest. For this reason, a single measurement enables for a more detailed and accurate detection of the stress responses, which in consequence, facilitates the physiological interpretation of the data.
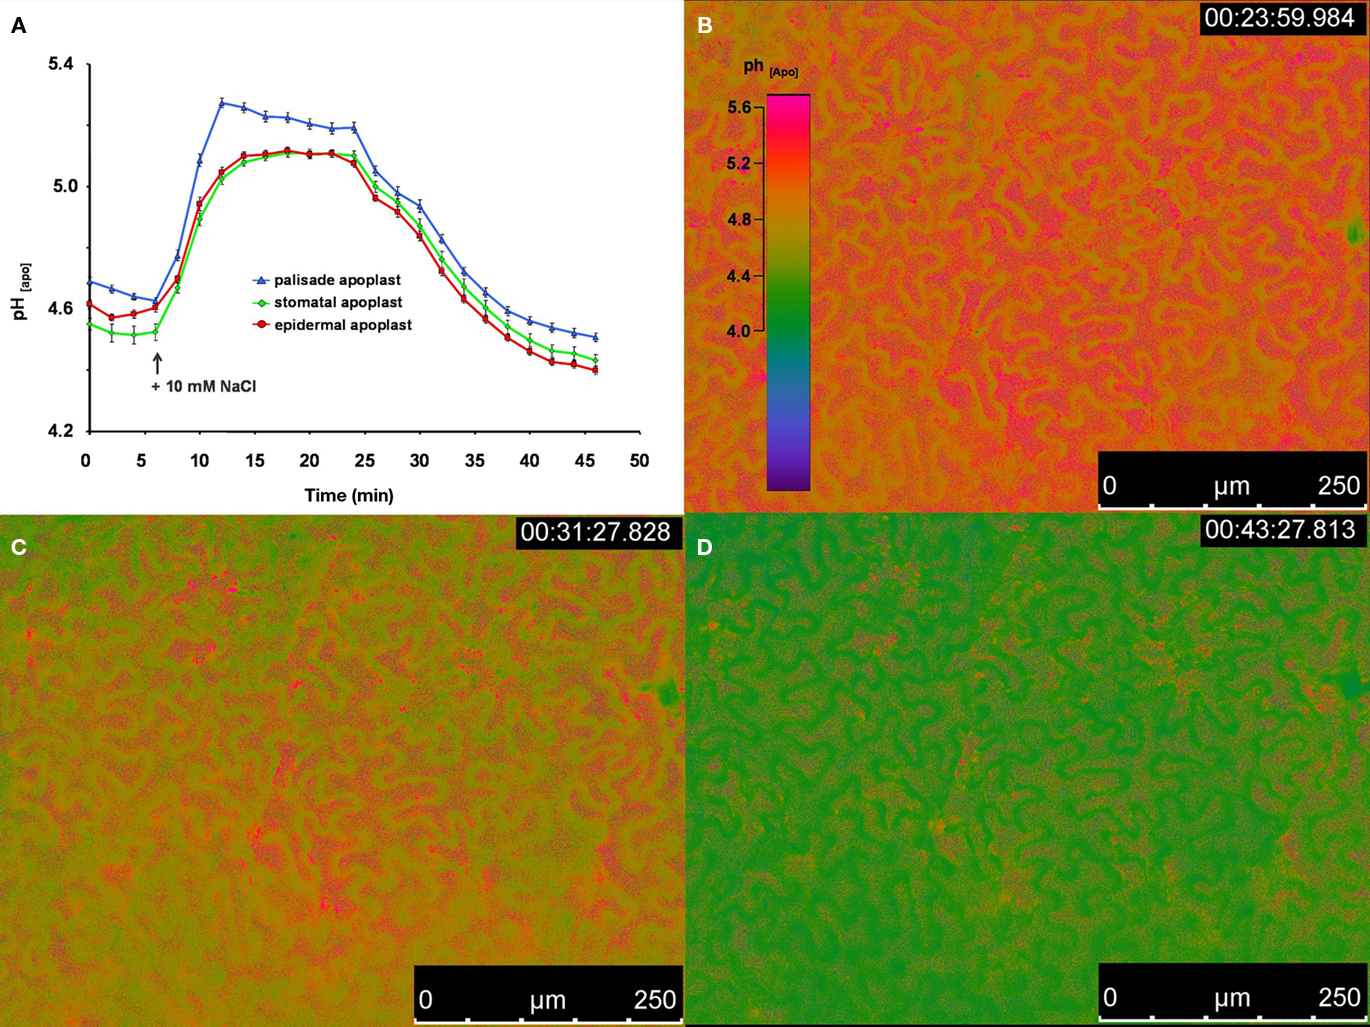
Figure 4. Ratiometric real-time quantitation of leaf apoplastic pH in response to the addition of 50 μL of a 10 mM NaCl solution onto the leaf. (A) pH as recorded at the adaxial face of Vicia faba leaves is plotted over time. Black arrow indicates the time of the addition of the 10 mM NaCl stress stimulus onto the surface of the leaf. Leaf apoplastic pH was discriminated within three apoplastic components, viz. in the stomatal cavity (n = 10 ROI; green kinetic; mean ± SE of ROIs), in the epidermal apoplast (n = 20 ROI; red kinetic; mean ± SE of ROIs) and in the apoplast surrounding the palisade mesophyll (n = 20 ROI; blue kinetic; mean ± SE of ROIs). Ratiometric images (B–D) show the time series of apoplastic leaf pH at (B) 23, (C) 31, and (D) 43 min after measurement had started (time of image acquisition is presented in the upper right corner of the ratio images). Ratios were color-coded on a spectral color scale (see lookup-table as inset in B). Representative kinetics of five equivalent recordings of plants gained from independent experiments.
In a second experiment, we demonstrated that the new dye loading procedure also enabled in planta monitoring of leaf apoplastic pH dynamics in response to a NaCl stress treatment applied to the roots. NaCl was added to the nutrient solution yielding a concentration of 20 mM (Figure 5). The pH transiently increased over a period ranging from 60 to 70 min, with an alkalinization occurring in the three apoplastic compartments, viz. the stomatal cavity, the epidermal apoplast, and the palisade apoplast, starting circa 20 min after NaCl was added to the roots. Similar to the transient alkalinization described in Figure 4A, the pH was the most alkaline within the apoplast built by the palisade tissue. To the authors’ knowledge, this is the first time that a physiological stress response that was induced by adding NaCl to the roots has been ratiometrically monitored within the intact leaf apoplast in a resolution that allows spatial ion gradients to be discriminated in various apoplastic components over a period of 3 h in planta.

Figure 5. Ratiometric real-time quantitation of spatial leaf apoplastic pH gradients in response to 20 mM NaCl stress added to the roots. (A) Leaf apoplastic pH response was discriminated within three apoplastic components, viz. in the stomatal cavitiy (n = 9 ROI; green kinetic; mean ± SE of ROIs), in the epidermal apoplast (n = 20 ROI; red kinetic; mean ± SE of ROIs) and in the apoplast surrounding the palisade mesophyll (n = 20 ROI; blue kinetic; mean ± SE of ROIs). Black arrow indicates the time of the addition of the 20 mM NaCl stress stimulus into the nutrient solution. Ratiometric images (B–E) show the time series of apoplastic leaf pH at (B) 25, (C) 50, (D) 110 min, and (E) 170 min after measurement had started (time of image acquisition is presented in the upper right corner). Ratios were color-coded on a spectral color scale (see lookup-table as inset in B). The ratio images under the most alkaline conditions suggest that fluorescent signals come directly from the palisade cells as indicated by the # in (D). This phenomenon is explained in section “Discussion.” Representative kinetics of four equivalent recordings of plants gained from independent experiments.
The pseudo-color ratios presented in Figures 4 and 5 require additional comment. The ratio images at the most alkaline conditions suggest that fluorescent signals come directly from within the palisade cells (indicated by # in Figure 5D). This implies that, in addition to the apoplastic pH signals, cytosolic pH signals have been quantified erroneously. Such an idea can however be rejected for several reasons. (1) A XYZ-image stack showing the leaf apoplastic space that was labeled with Oregon Green 488 dextran was created using CLSM. Dye excitation with an Argon laser line at 488 nm (Movie S1 in Supplementary Material) clearly demonstrated that the dye signals were solely emitted from the apoplast. The mesophyll cells appeared dark, providing evidence that no dye had unintentionally entered the cells. Thus the appearance of cytosolic or cellular pH signals can be rebutted. (2) The pH probe is covalently linked to a 10 kDa dextran, which would require pressure microinjection for loading into the cytoplasm (Fricker et al., 1999). (3) The cytosolic pH is known to be around 7.2 (Schwarzländer et al., 2008; D’Onofrio and Lindberg, 2009), whereas the quantified pH-values shown in Figures 4A and 5A do not exceed a value of pH 5.4 and 5.6, respectively. (4) Even supposing the dye had entered the cytosol unintentionally, the apoplastic pH response shown in Figures 4 and 5 could not drop back to its initial level at pH 4.2, because the cytosol never reaches such an acid milieu. Nevertheless, why do the ratio images at the most alkaline conditions suggest that fluorescent signals come directly from within the palisade cells (indicated by # in Figure 5D)? Immediately after dye was loaded into the apoplast, the inserted water exits the leaf through the stomata (shown in Figure 2). However, the dye has been demonstrated to remain within the apoplast (Figures 2A-ii, B-ii, and C-ii). We presume that the dye is dissolved within the apoplastic fluid, which is a thin film that is attached to the surface of the cells (Felle and Hanstein, 2002). Consequently, the fluorescent dye is closely attached around the palisade cells, thus, light that is emitted by the dye mimics the shape of the cells. However, in response to a physiological alkalinization of the apoplastic fluid that surrounds the palisade cells, the intensity of the emitted light raises, because the emission triggered by the F495 channel increases with decreasing [H+]. This strong F495 fluorescence erroneously conveys (see above) the impression that these signals arise within the cell (indicated by # in Figure 5D).
Potential artifacts
Several potential artifacts might occur during ratio imaging experiments and, if not considered, might introduce errors in quantitation. A point that needs to be considered during imaging is the level of background signals, viz. autofluorescence coming from the measuring devices (i.e., lens elements), the specimen (i.e., cell wall or chloroplasts), the shot noise associated with sampling of the signal (Fricker et al., 1997b, 2001), and the noise arising from residual light in the laboratory (i.e., computer LEDs, monitor screens). For the testing of the level of autofluorescence, the specimen without the dye is illuminated (background signal intensity) and compared with the specimen plus dye (total signal intensity). Only negligible noise has been detected (0.1% of the weakest fluorescence signals and 0.03‰ of the strongest; Figure 6). The background noise values are subtracted at each channel. In addition to the occurrence of background fluorescence, confirmation is required that the NaCl molecules themselves do not influence the F495/F440 ratio and thus the quantification. Such an effect might occur because the NaCl that is added to the nutrient solution might be transported through the xylem into the leaf apoplast where it might interact with the fluorophore. In order to exclude such an effect, we have demonstrated that NaCl concentrations ranging from 0 to 125 mM do not affect the Oregon Green 488 ratio (Figure 7). Moreover, we have tested whether the presence of NaCl within the leaf apoplast increases background noise signal intensity when illuminated with ex 495 and ex 440 nm. After the loading of NaCl solution directly into the leaf apoplast, no additional unspecific noise signals have been detected (Figure A3 in Appendix). Another problem relates to the physiological response that the excitation or emission wavelengths used for imaging might trigger in the specimen (Fricker et al., 1994). To check whether the illumination regime itself influences the apoplastic pH, a time series of ex 495 and ex 440 nm images has been collected. No effects on apoplastic pH have been detected (Figure 8) supporting the proposal that the transient pH increases demonstrated in Figures 4 and 5 are solely attributable to the salt treatment. Furthermore, the dye loading procedure represents a potential event of (local) mechanical stress and the presence of the dye itself within the apoplast might have an impact on the apoplastic space. Hence, leaf growth, stomatal conductance, and chlorophyll concentrations have been compared in loaded leaves and in leaves not loaded with ion indicator (control leaves). None of the tested parameters is influenced (Figure 9). The monitoring of the physiological ion dynamics as demonstrated in Figure 5 requires 3 h. Altogether, 36 fluorescence images at each channel have been captured at an exposure time of 25 mS/image, yielding in an accumulated exposure time of 1800 mS. Obviously, a probe is required that is not prone to (photo-)bleaching. Fortunately, dextran-linked Oregon Green 488 is extremely photostable under circumstances of up to 2.4 × 10⁵ mS of continuous F495-light exposure (Figure 10).
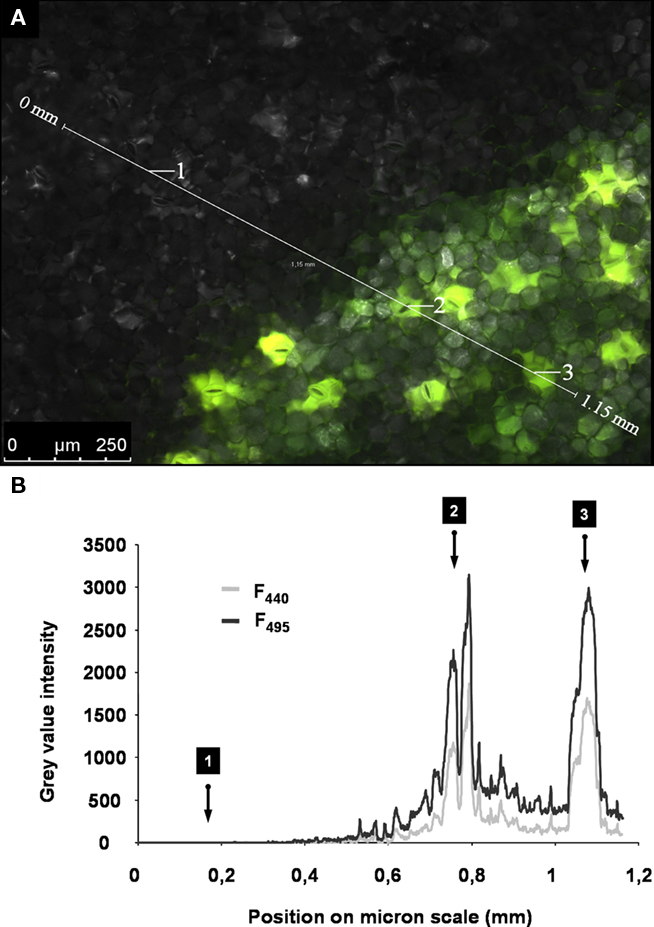
Figure 6. Specific dye signals versus unspecific noise signals. (A) Adaxial leaf face. Overlay of ex 495 nm pseudo-green fluorescence image, ex 440 nm pseudo-red fluorescence image, and the corresponding bright-field image (gray-scaled). The apoplast was partially loaded with the dye (lower right part of the image). Dye-loaded areas appear light green when illuminated, because pseudo-red and pseudo-green are mixed within the overlay. The gray area was not loaded with the dye (upper left part of the image). Such a specimen represents a suitable object to compare the amount of unspecific signals (noise) to specific signals being emitted from the dye. The intensity of gray values was chosen as a measure for signal intensity. A profile of the gray-value intensity was taken from the area tagged with the scale bar (1.15 mm length; white line in A) and is presented in (B). This profile is displayed for both fluorescence excitation channels (ex 495 and ex 440 nm). Negligible signals were emitted from the area of the leaf without dye (i.e., detail 1). The signals were much higher in the dye-loaded areas (i.e., detail 2 and 3; in both cases, signal intensity at stomatal cavity).
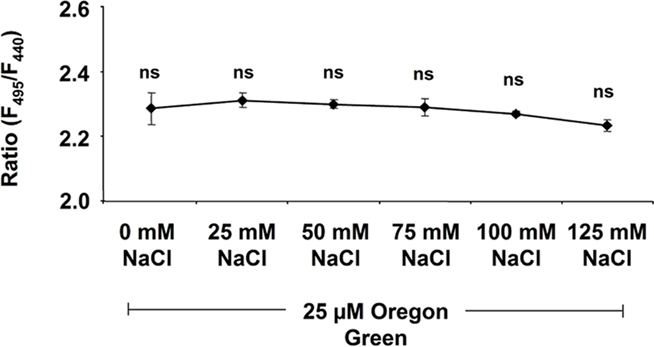
Figure 7. Dependency of the Oregon Green 488 F495/F440 ratio on NaCl. Ratios are displayed against NaCl concentration. NaCl ranging from 0 to 125 mM was mixed into the dye solution (25 μM Oregon Green). Ratios were stable and thus not affected by NaCl. Values represent the mean ± SE (n = 4 biological replicates). t-Test revealed no significant mean differences at p ≤ 0.05.
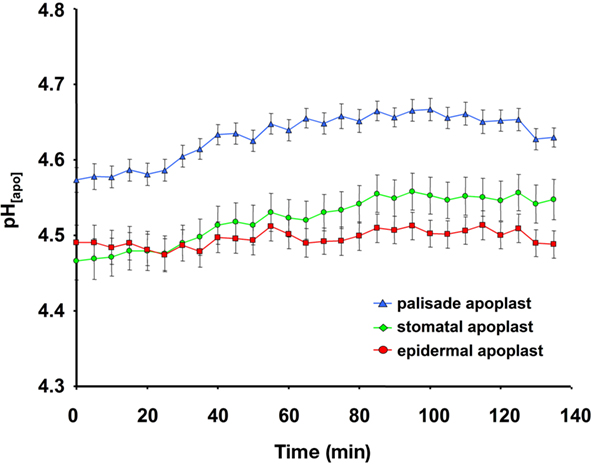
Figure 8. Ratiometric real-time quantitation of leaf apoplastic pH in response to the given illumination regime used for inverse microscopy image acquisition. pH as recorded at the adaxial face of Vicia faba leaves is plotted over time. Leaf apoplastic pH was discriminated within three apoplastic components, viz. in the stomatal cavity (n = 6 ROI; green kinetic; mean ± SE of ROIs), in the epidermal apoplast (n = 20 ROI; red kinetic; mean ± SE of ROIs) and in the apoplast surrounding the palisade mesophyll (n = 20 ROI; blue kinetic; mean ± SE of ROIs). No effects on apoplastic pH were detected that were attributable to the illumination of the specimen with the excitation or emission wavelengths used for imaging. Representative kinetics of four equivalent recordings of plants gained from independent experiments.
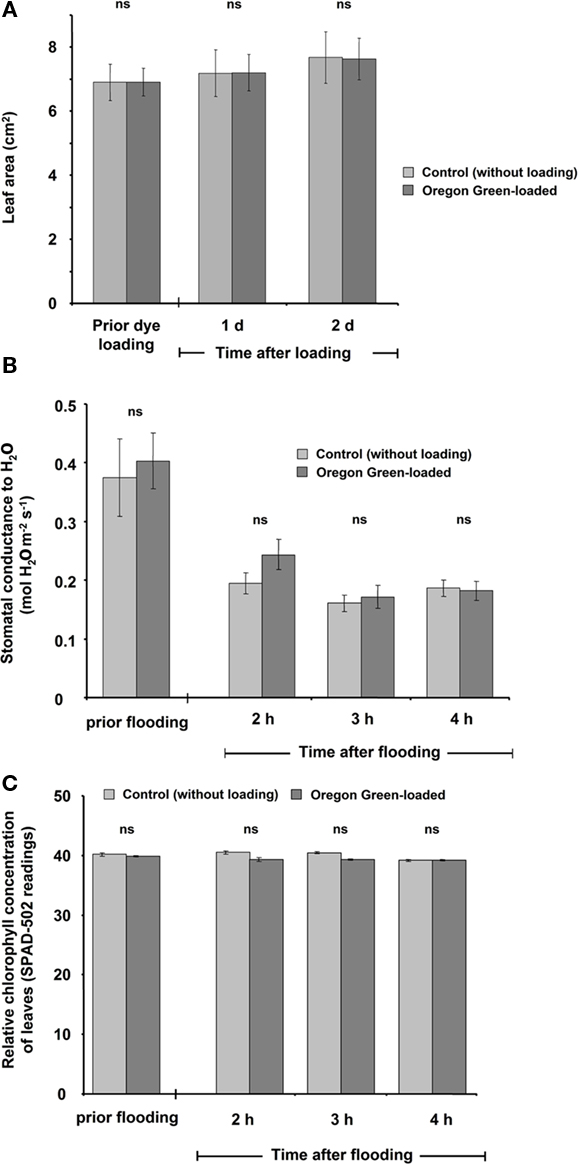
Figure 9. Leaf growth (A), stomatal conductance (B), and relative chlorophyll concentration (C) as influenced by the dye and the loading procedure. To test whether these parameters were affected, a paripinnate leaf was used. One leaflet was loaded with the dye, whereas the second was not loaded with the dye and was used as control. Leaves were tested (A) prior to loading and at 1 and 2 days after loading or (B,C) prior to loading and 2, 3, and 4 h after loading. The parameters were not influenced by the presence of the dye or the loading procedure. The data are mean of four biological replicates gained from independent experiments ± SE. Paired t-test revealed no significant (ns) mean differences at p ≤ 0.05.
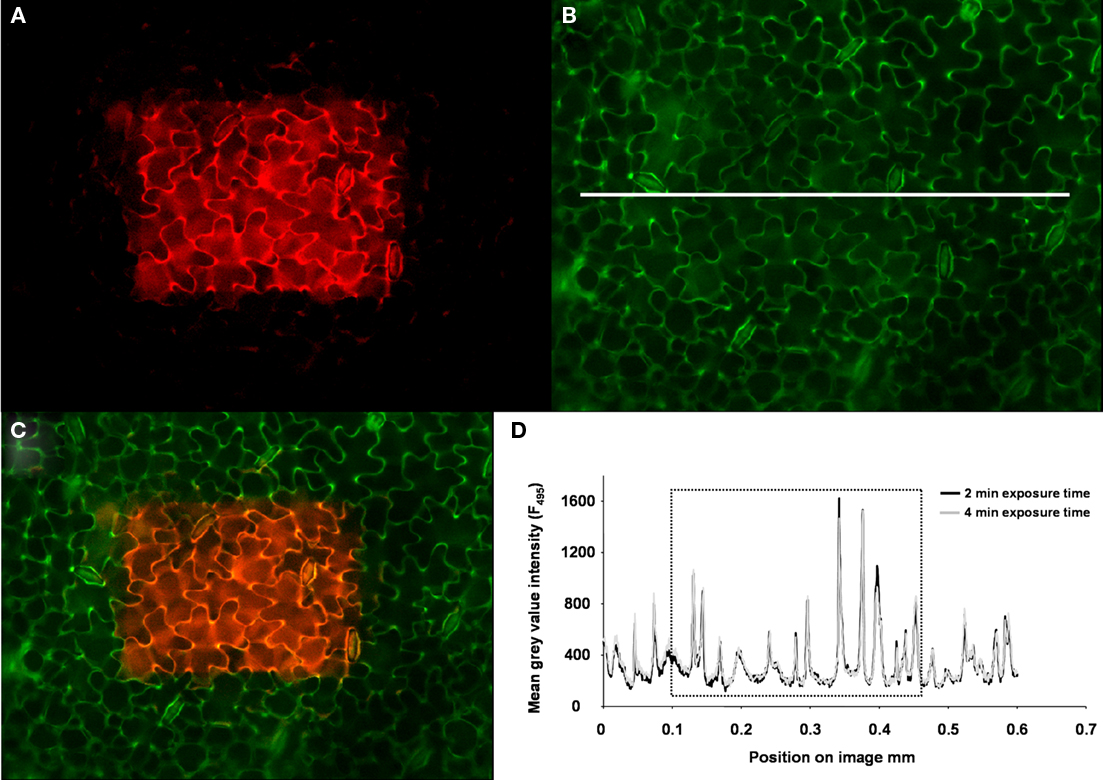
Figure 10. Photostability of the fluorescent ion indicator. (A) To test whether the dye was prone to bleaching, a selected area in the middle of the specimen (presented in pseudo-red) was continuously excited by 495 nm illumination over a period of 2 min. The outer edges of the specimen were not illuminated because the field diaphragm foreclosed the illumination of this area, thus representing the control area of the leaf (control area = dark area within the image). (B) After 2 min continuous excitation, the field diaphragm was opened for collecting an image at ex 495 nm (exposure time was 25 mS). The image is presented in pseudo-green and contains the part of the specimen that was continuously illuminated plus the adjacent edges of the specimen that were not exposed to the continuous illumination at ex 495 (control). Image (C) presents the merged overlay of (A, B). The pseudo-orange area (mixing pseudo-red and pseudo-green yields orange) represents the part of the leaf with the possibly bleached dye, whereas the pseudo-green area represents the control part of the leaf. Image (B) was used to create a profile of the gray-value intensity from the area tagged by the white line as a measure for the dye signal intensity after 2 min of continuous excitation at 495 nm (dark-gray profile) and after 4 min of continuous excitation (light-gray profile). The gray-value intensity profiles are presented in (D). The dotted rectangle in (D) flags the gray-value intensity from the region that was exposed to continuous illumination. The gray-value intensity outside of the rectangle represents the control values. A comparison of the signal intensities between the possibly bleached part of the specimen and the control reveals that no dye-bleaching had actually occurred after 2 min of continuous illumination. This was also confirmed after 4 min.
Conclusion
Our new dye loading procedure has been demonstrated to be suitable for ratiometric in planta mapping and the quantification of apoplastic pH dynamics. The spatial resolution of the microscopy-based imaging allows the discrimination of spatial gradients within the leaf apoplastic ion milieu. The more sophisticated dye loading procedure in combination with camera-assisted ratio imaging enables the real-time mapping of spatial apoplastic ion gradients over a period of 3 h in situ. Moreover, we have used this technique to monitor leaf apoplastic pH dynamics in response to NaCl stress events.
Conflict of Interest Statement
The authors declare that the research was conducted in the absence of any commercial or financial relationships that could be construed as a potential conflict of interest.
Acknowledgments
Christoph-Martin Geilfus is the grateful recipient of a grant from the Friedrich-Ebert-Foundation. We thank Dr. Christoph Plieth (Center of Biochemistry and Molecular Biology, University of Kiel) for giving advice with regard to fitting calibration data to a sigmoidal Boltzmann fit and for providing help with CLSM-imaging. Many thanks are also due to Christina Neuhaus for giving critical comments on the manuscript.
Supplementary Material
The Movies S1 for this article can be found online at http://www.frontiersin.org/plant_nutrition/10.3389/fpls.2011.00013/abstract/
Video S1|Confocal XYZ-image stack showing abaxial leaf apoplast of Vicia faba as labeled with Oregon Green 488 dextran. Excitation with an Argon laser line at 488 nm; emission at 514–556 nm (green channel); Leica TCS SP confocal laser scanning system; HC PL APO CS 10.0 × 0.40 planapochromatic objective. Dye signals are emitted from the apoplast (green color), whereas the mesophyll cells appear dark. This establishes that no Oregon Green 488 dextran had entered the cytosol unintentionally, as otherwise signals would be detectable from the cells.
References
Bibikova, T. N., Jacob, T., Dahse, I., and Gilroy, S. (1998). Localized changes in apoplastic and cytoplasmic pH are associated with root hair development in Arabidopsis thaliana. Development 125, 2925–2934.
Bright, G. R., Fisher, G. W., Rogowska, J., and Taylor, L. D. (1989). Fluorescence ratio imaging microscopy. Meth. Cell Biol. 30, 157–192.
Canny, M. J. (1995). Apoplastic water and solute movement: new roles for an old space. Annu. Rev. Plant Physiol. Plant Mol. Biol. 46, 215–236.
Dennett, M. D., Auld, B. A., and Elston, J. (1978). A description of leaf growth in Vicia faba L. Ann. Bot. 42, 223–232.
D’Onofrio, C., and Lindberg, S. (2009). Sodium induces simultaneous changes in cytosolic calcium and pH in salt-tolerant quince protoplasts. J. Plant Physiol. 166, 1755–1763.
Errington, R. J., Fricker, M. D., Wood, J. L., Hall, A. C., and White, N. S. (1997). Four-dimensional imaging of living chondrocytes in cartilage using confocal microscopy: a pragmatic approach. Am. J. Physiol. Cell Physiol. 272, C1040–C1051.
Felle, H. H., and Hanstein, S. (2002). The apoplastic pH of the substomatal cavity of Vicia faba leaves and its regulation responding to different stress factors. J. Exp. Bot. 53, 73–82.
Fricker, M. D., Chow, C. M., Errington, R. J., May, M., Mellor, J., Meyer, A. J., Tlalka, M., Vaux, D. J., Wood, J., and White, N. S. (1997a). Quantitative imaging of intact cells and tissues by multi-dimensional confocal fluorescence microscopy. Exp. Biol. 2, 1–23.
Fricker, M. D., Errington, R. J., Wood, J. L., Tlalka, M., May, M., and White, N. S. (1997b). “Quantitative confocal fluorescence measurements in living tissues,” in Signal Transduction - Single Cell Research, eds B. Van Duijn and A. Wiltnik (Heidelberg: Springer-Verlag), 569–596.
Fricker, M. D., Lee, J. A., Bebber, D. P., Tlalka, M., Hynes, J., Darrah, P. R., Watkinson, S. C., and Boddy, L. (2008). Imaging complex nutrient dynamics in mycelial networks. J. Microsc. 231, 317–331.
Fricker, M. D., Parsons, A., Tlalka, M., Blancaflor, E., Gilroy, S., Meyer, A., and Plieth, C. (2001). “Fluorescent probes for living plant cells,” in Plant Cell Biology: A Practical Approach, 2nd Edn, eds C. Hawes and B. Satiat-Jeunemaitre (Oxford: University Press), 35–84.
Fricker, M. D., Plieth, C., Knight, H., Blancaflor, E., Knight, M. R., White, N. S., and Gilroy, S. (1999). “Fluorescent and luminescent techniques to probe ion activities in living plant cells,” in Fluorescent and luminescent probes, ed. W. T. Mason (London: Academic Press), 569–596.
Fricker, M. D., Tlalka, M., Ermantraut, J., Obermeyer, G., Dewey, M., Gurr, S., Patrick, J., and White, N. S. (1994). Confocal fluorescence ratio imaging of ion activities in plant cells. Scanning Microsc. 8, 391–405.
Gilroy, S. (1997). Fluorescence microscopy of living plant cells. Annu. Rev. Plant Physiol. Plant Mol. Biol. 48, 165–190.
Grignon, C., and Sentenac, H. (1991). pH and ionic conditions in the apoplast. Annu. Rev. Plant Physiol. Plant Mol. Biol. 42, 103–128.
Grignon, N., Halpern, S., Jeusset, J., Briançon, C., and Fragu, P. (1997). Localization of chemical elements and isotopes in the leaf of soybean (Glycine max) by secondary ion mass spectrometry microscopy: critical choice of sample preparation procedure. J. Microsc. 186, 51–66.
Hoffmann, B., and Kosegarten, H. (1995). FITC-dextran for measuring apoplast pH and apoplastic pH gradients between various cell types in sunflower leaves. Physiol. Plant 3, 327–335.
Hoffmann, B., Plänker, R., and Mengel, K. (1992). Measurements of pH in the apoplast of sunflower leaves by means of fluorescence. Physiol. Plant 84, 146–153.
Köhler, W., Schachtel, G., and Voleske, P. (1984). Einführung in die Statistik für Biologen und Agrarwissenschaftler. Berlin: Springer.
Mühling, K. H., and Läuchli, A. (2000). Light-induced pH and K+ changes in the apoplast of intact leaves. Planta 212, 9–15.
Mühling, K. H., and Läuchli, A. (2002). Determination of apoplastic Na+ in intact leaves of cotton by in vivo fluorescence ratio imaging. Funct. Plant Biol. 29, 1491–1499.
Mühling, K. H., Plieth, C., Hansen, U. P., and Sattelmacher, B. (1995). Apoplastic pH of intact leaves of Vicia faba as influenced by light. J. Exp. Bot. 46, 377–382.
Mühling, K. H., and Sattelmacher, B. (1995). Apoplastic ion concentration of intact leaves of field bean (Vicia faba) as influenced by ammonium and nitrate nutrition. J. Plant Physiol. 147, 81–86.
Mühling, K. H., and Sattelmacher, B. (1997). Determination of apoplastic K+ in intact leaves by ratio imaging of PBFI fluorescence. J. Exp. Bot. 48, 1609–1614.
Mühling, K. H., Wimmer, M., and Goldbach, H. E. (1998). Apoplastic and membrane-associated Ca2+ in leaves and roots as affected by boron deficiency. Physiol. Plant 102, 179–184.
Pitann, B., Kranz, T., and Mühling, K. H. (2009). The apoplastic pH and its significance in adaptation to salinity in maize (Zea mays L.): comparison of fluorescence microscopy and pH-sensitive microelectrodes. Plant Sci. 176, 497–504.
Sattelmacher, B., Mühling, K. H., and Pennewiß, K. (1998). The apoplast – its significance for the nutrition of higher plants. J. Plant Nutr. Soil Sci. 161, 485–498.
Schulte, A., Lorenzen, I., Böttcher, M., and Plieth, C. (2006). A novel fluorescent pH probe for expression in plants. Plant Methods 2, 7.
Schwarzländer, M., Fricker, M. D., Müller, C., Marty, L., Brach, T., Novak, J., Sweetlove, L. J., Hell, R., and Meyer, A. J. (2008). Confocal imaging of glutathione redox potential in living plant cells. J. Microsc. 231, 299–316.
Taylor, D. P., Slattery, J., and Leopold, A. C. (1996). Apoplastic pH in corn root gravitropism: a laser scanning confocal microscopy measurement. Physiol. Plant 97, 35–38.
Keywords: apoplastic pH, live cell imaging, apoplastic ions, abiotic stress, salinity, pH regulation, fluorescence ratio imaging
Citation: Geilfus CM and Mühling KH (2011) Real-time imaging of leaf apoplastic pH dynamics in response to NaCl stress. Front. Plant Sci. 2:13. doi: 10.3389/fpls.2011.00013
Received: 02 March 2011;
Accepted: 16 April 2011;
Published online: 02 May 2011.
Edited by:
Jan Kofod Schjoerring, University of Copenhagen, DenmarkReviewed by:
Doug Van Hoewyk, Coastal Carolina University, USAAlexander Schulz, University of Copenhagen, Denmark
Copyright: © 2011 Geilfus and Muehling. This is an open-access article subject to a non-exclusive license between the authors and Frontiers Media SA, which permits use, distribution and reproduction in other forums, provided the original authors and source are credited and other Frontiers conditions are complied with.
*Correspondence: Karl H. Mühling, Institute of Plant Nutrition and Soil Science, Christian Albrechts University, Hermann-Rodewald-Str. 2, 24118 Kiel, Germany. e-mail: khmuehling@plantnutrition.uni-kiel.de