 Eli Carlisle
 Chris Yarnes
 Michael D. Toney
 Arnold J. Bloom
- 1Department of Plant Sciences, University of California, Davis, CA, USA
- 2Department of Chemistry, University of California, Davis, CA, USA
Stable 15N isotopes have been used to examine movement of nitrogen (N) through various pools of the global N cycle. A central reaction in the cycle involves the reduction of nitrate (NO−3) to nitrite (NO−2) catalyzed by nitrate reductase (NR). Discrimination against 15N by NR is a major determinant of isotopic differences among N pools. Here, we measured in vitro 15N discrimination by several NRs purified from plants, fungi, and a bacterium to determine the intrinsic 15N discrimination by the enzyme and to evaluate the validity of measurements made using 15N-enriched NO−3. Observed NR isotope discrimination ranged from 22 to 32‰ (kinetic isotope effects of 1.022–1.032) among the different isozymes at natural abundance 15N (0.37%). As the fractional 15N content of substrate NO−3 increased from natural abundance, the product 15N fraction deviated significantly from that expected based on substrate enrichment and 15N discrimination measured at natural abundance. Additionally, isotopic discrimination by denitrifying bacteria used to reduce NO−3 and NO−2 in some protocols became a greater source of error as 15N enrichment increased. We briefly discuss potential causes of the experimental artifacts with enriched 15N and recommend against the use of highly enriched 15N tracers to study N discrimination in plants or soils.
Introduction
Nitrogen (N) is a key limiting resource in many ecosystems, and so N biogeochemical cycles—particularly the processes of organismal N uptake and assimilation—are of great importance (Epstein and Bloom, 2005). The main N source for most plants is soil inorganic N in the forms of nitrate (NO−3) and ammonium (NH+4) ions dissolved in the soil solution. A primary pathway through which inorganic N is converted into organic N is NO−3 assimilation via the biochemical pathway involving the sequential reactions catalyzed by the enzymes nitrate reductase (NR), nitrite reductase (NiR), glutamine synthetase (GS), and glutamate synthase (GOGAT). Reduction of NO−3 to NO−2 via NR is the rate limiting step in this pathway (Robinson et al., 1998; Evans, 2001), and thus the behavior of NR is central to biogeochemical plant-soil interactions as well as to internal plant N cycling (Tcherkez and Farquhar, 2006).
Eukaryotic NRs are members of the sulfite oxidase family of molybdoenzymes. They are found in three forms that use different reductants: an NADH-specific form typically found in higher plants and algae, an NAD(P)H-bispecific form found in higher plants, algae, and fungi, and an NADPH-specific form found only in fungi. All three forms are similar in overall composition (Campbell, 1999; Fischer et al., 2005) and require multimerization for full function, typically as either homodimers or homotetramers (Campbell, 1999; Barbier and Campbell, 2005). Each subunit contains one each of three cofactors: a flavin adenine dinucelotide (FAD), a heme-Fe, and a Mo-molybdopterin (Mo-MPT) cofactor (Campbell, 1999).
Prokaryotic NRs are unrelated to the eukaryotic NRs. They are members of the DMSO (dimethylsulfoxide) reductase family of molybdoenzymes and have an assimilatory (Nas) and two dissimilatory forms. The dissimilatory forms include a membrane-bound respiratory form (Nar) and a periplasmic form (Nap) (Moreno-Vivián et al., 1999). All prokaryotic forms, like all eukaryotic forms, have Mo as a key component of the cofactor that reduces NO−3. In prokaryotic NRs, however, the Mo is bound to a bis-molybdopterin guanine dinucleotide (MGD) rather than the MPT found in eukaryotes (Berks et al., 1995). The MGD molecule differs from the MPT molecule by the linkage of a guanine monophosphate (GMP) to the phosphate group of MPT (Temple and Rajagopalan, 2000). All prokaryotic NRs are heterotrimeric: they are composed of a Mo-MGD cofactor, a iron-sulfur (FeS) center, and either (a) FAD, (b) cytochrome b prosthetic, or (c) cytochrome c group in the Nas, Nap, or Nar forms, respectively (Moreno-Vivián et al., 1999). The prokaryotic NRs use a variety of electron donors, including ferrodoxin, flavodoxin, and NADH for the Nas enzyme, quinones for the Nap enzymes, and quinols for the Nar enzymes.
Stable N isotopes (15N and 14N) are a standard method for examining N cycling and transformations on many scales, ranging from global biogeochemical N cycles (Shearer and Kohl, 1986; Schlesinger, 1997; Amundson et al., 2003) to mechanistic enzyme studies (Cleland, 2005). Two approaches are common, natural abundance and 15N-enriched. In the first approach, one monitors how the natural abundance 15N/14N ratio of various compounds in a pathway differs from a reference, typically that of atmospheric N2 gas (0.37% 15N). An advantage of the natural abundance approach is that no additional N need be added that might perturb the experimental system. For example, inorganic N (e.g., NO−3), if added above background levels, can inhibit N2-fixation or alter N transformations and assimilation (Sprent, 1979).
In the second approach, one employs a 15N-enriched reactant as a tracer and monitors δ15N differences through various N pools (Hauck and Bremner, 1976; Androsoff et al., 1995). Slight differences in substrate 15N content and variability introduced through mixing and fractionation of different N pools in the soil and the plant are overwhelmed by the tracer signal. This approach is not typically used to examine enzymatic isotope fractionation. Regardless of the experimental approach, a key assumption is that 15N behaves identically to 14N in biological systems except for the differences due to mass (Hauck and Bremner, 1976).
When environmental or substrate concentrations of NO−3 are limiting, little to no discrimination against the 15N isotope is observed during NO−3 assimilation (Kolb and Evans, 2003). Discrimination against the 15N isotope has been demonstrated to occur only when the NO−3 concentration exceeds plant needs or uptake ability. The key to understanding these observations is that isotopic discrimination is only detected to the extent that both isotopic species are equilibrated between the plant and the environment during the course of the measurement (Kolb and Evans, 2003). In such cases, plant NR has typically been cited as discriminating against 15N by 15‰ when the enzyme is supplied adequate amounts of NO−3 substrate containing N isotopes at natural abundance (i.e., product NO−2 is depleted in 15N relative to substrate NO−3 by 15 parts per 1000; Mariotti et al., 1982; Ledgard et al., 1985; Evans et al., 1996; Tcherkez and Farquhar, 2006). Nonetheless, reported values for NR 15N discrimination vary from 5 to 30‰ (Schmidt and Medina, 1991; Granger et al., 2004; Needoba et al., 2004; Tcherkez and Farquhar, 2006).
Previously, we obtained significantly different results for the rate of NO−3 assimilation in plant shoots when using 14N or 15N as a tracer (Bloom et al., 2010). Arabidopsis, grown under ambient CO2 concentrations with natural abundance NO−3 nutrition and pulsed with 25% enriched 15NO−3, demonstrated 20–30% less NO−3 assimilation than Arabidopsis grown on 99% enriched 15NO−3 and pulsed with natural abundance NO−3. In wheat, these experimental protocols resulted in similar trends (Bloom et al., 2010). These differences in assimilation rates may have been confounded by artifacts of the isotope measurements by the isotope ratio mass spectrometer (IRMS).
In this study, we examined how NR discrimination varies among different organisms, and determined whether 15N enrichment of substrate NO−3 affects the measurement of NR discrimination, which may have caused the unusual results in our previous work (Bloom et al., 2010). We conducted in vitro experiments on five purified NRs from plants, fungi, and a bacterium to address two hypotheses: (1) natural abundance 15N discrimination is similar among NRs; (2) substrate NO−3 15N-enrichment affects instrumental analysis of samples and the estimation of 15N discrimination.
Materials and Methods
We measured 15N-isotope discrimination by commercial preparations of five different nitrate reductases. Four of these enzymes are assimilatory nitrate reductases including that from Arabidopsis thaliana (AtNaR2 NADH:nitrate reductase E.C. 1.7.1.1), Aspergillus niger (NAD(P)H:nitrate reductase E.C. 1.7.1.2), Pichia angusta (YNaR1 NAD(P)H:nitrate reductase E.C. 1.7.1.2), and Zea mays (maize; NADH:nitrate reductase E.C. 1.7.1.1); these were assessed using similar protocols. The fifth is a prokaryotic NR (Escherichia coli, cytochrome:nitrate reductase E.C. 1.9.6.1), which is a dissimilatory reductase (Nar form); this enzyme required a different experimental protocol. The maize, Aspergillus, and E. coli enzymes are isolated from the native organisms, while the Arabidopsis and yeast enzymes are recombinant enzymes expressed in the yeast Pichia pastoris. The Aspergillus and E. coli enzymes were purchased from Sigma, and the rest were purchased from NECi (nitrate.com; also see Barbier et al., 2004). We were unable to detect any nitrate or nitrite in the enzyme preparations (Miranda et al., 2001).
Assimilatory Nitrate Reductases
One unit of enzyme activity is defined as the amount of NR that is capable of catalyzing the conversion of 1 μmol nitrate to nitrite per minute at optimal pH and temperature. Assimilatory nitrate reductase analyses were carried out by reconstituting the freeze-dried Arabidopsis, yeast, and maize enzymes in 25 mM potassium phosphate, 0.1 mM Na2EDTA, pH 7.5, at 22–25°C, to a final concentration of 1 unit/mL. For the Aspergillus enzyme, a 100 mM potassium phosphate buffer, 0.1 mM Na2EDTA, pH 7.5 was used. The NR Km for NO−3 in Arabidopsis and maize ranges from 15 to 40 μM (Su et al., 1997; Campbell, 1999), 199 μM for Aspergillus (Gilliam et al., 1993), and 470 μM for the dissimilatory NR in E. coli (Adams and Mortenson, 1982). There is no information for the specific yeast NR used in our study, but NRs from other genera of yeast have a Km ranging from 110 (Hipkin et al., 1986) to 740 μM (Morozkina et al., 2005).
The enzyme reaction solution contained 1 unit (1 mL) of reconstituted NR, 165 mL of additional phosphate buffer (pH 7.5), and 70 μmol of NADH or NADPH for the plant and fungal enzymes, respectively. Additionally, the Aspergillus solution contained 4 μmol of FAD. After mixing, 10 mL of solution was added to each of 16 sterile 15 mL centrifuge tubes. One mL of KNO3 solution (0.2 M KNO3) was then added to each centrifuge tube, and the tubes were placed into a water bath at 30°C (25°C for Aspergillus) for 30 min. The use of 0.2 mmol of KNO3 in the reaction tubes was calculated to provide a surplus of NO−3 for the enzymatic reaction, while minimizing the possibility that residual NO−3 might saturate the mass spectrometer detectors. Therefore, the enzyme reactions were not necessarily operating under NO−3 saturating conditions. The KNO3 was enriched with different levels of 15N from natural abundance to >99 atom % 15N to examine how substrate 15N enrichment influences the estimation of NR 15N discrimination using an IRMS. At the end of the incubation, samples were placed into 20 mL scintillation vials. The reaction was halted by adding 0.25 mL of 1 M HCl and swirling the vials (decreasing pH to below 4). After 1 min, 40 μL of 10 M KOH were added to the solution, raising its pH to 10–12 to prevent oxidation of NO−2 to NO−3. Concentrations of NO−2 and NO−3 were determined using the Griess reaction (Miranda et al., 2001).
Dissimilatory Nitrate Reductase
The reaction catalyzed by dissimilatory E. coli NR requires reducing conditions. The enzyme was reconstituted in 2 mL of cold degassed deionized water and added to 55 mL of degassed buffer (0.125 M MOPS, pH 7.0) containing 30 mg benzyl viologen (BV; 1,1′-Dibenzyl-4,4′-bipyridinium dichloride, Sigma) as an electron donor. Ten milliliter of buffer/enzyme solution were added to 15 mL centrifuge tubes containing 0.2 mmoles of KNO3 of various 15N enrichments and 0.25 mL of a sodium dithionite/sodium bicarbonate solution (500 mg of each added to 50 mL degassed DI H2O) to maintain reducing conditions. If the blue color of the reduced BV dye started to fade, additional dithionite solution was added to the vial. The vials were incubated in a water bath at 30°C for 90 min. To stop the reaction, vials were shaken vigorously to oxidize the BV. At the end of the incubation, 75 μl of 10 N NaOH was added to each tube to minimize conversion of NO−2 to NO−3.
Preparation of Bacterial Cultures for Headspace N2O Analysis
For all forms of the NR enzyme, we analyzed the 15N isotope composition of the headspace N2O produced through bacterial denitrification of NO−3 and NO−2. Bacterial cultures and solutions were prepared as in Böhlke et al. (2007). The bacterial cultures used in this study were Stenotrophomonas nitritireducens (ATCC# BAA-12) and Pseudomonas chlororaphis (ATCC# 43928), both of which were obtained from the American Type Culture Collection (www.atcc.org). Both species lack the enzymatic ability to reduce N2O to N2. S. nitritireducens is limited to reducing NO−2, while P. chlororaphis is capable of reducing both NO−3 and NO−2 to N2O. This specificity allowed a sequential reduction of our experimental samples to estimate the 15N concentrations of the NO−3 and NO−2 independently.
The denitrifying bacteria were streaked on tryptic soy agar (TSA) plates composed of TSA (40 g/L) and tryptic soy broth (TSB; 10 g/L) for S. nitritireducens, and TSA (40 g/L) and KNO3 (1 g/L) for P. chlororaphis. The TSA plates for the S. nitritireducens cultures were prepared with 10 mM Na2WO4 to minimize any potential NO−3 reduction (Nielsen et al., 2004). Both cultures were grown aerobically at 22–24°C. After 5–7 days, bacterial colonies were streaked onto a second plate. If re-plated more than 2 or 3 times, higher background levels of N2O were observed for both bacteria. Therefore, all N2O analyses were made using colonies from the second plate; additional analyses required starting the process over from the original frozen aliquot.
Individual S. nitritireducens colonies were transferred 4–5 days after streaking to sterile 50 mL centrifuge tubes with 35 mL of a growth medium containing TSB solution (15.0 g/L), (NH4)2SO4 (0.25 g/L), and KH2PO4 (2.45 g/L). Tubes were capped leaving an air headspace and agitated on a reciprocal shaker for 1–2 days at 22°C. The tubes were opened daily to allow for aerobic growth. The contents of the centrifuge tubes were combined and an antifoaming agent was added, 2–3 drops of Antifoam B (Sigma) per 105 mL solution. Four milliliter of the combined solution were pipetted into each 20 mL vial, which was capped with a septum and crimped, and then placed on a manifold that purged the vials with N2 gas for 4 h to remove any residual oxygen, CO2, and N2O. The contents of these vials were used for 15N analysis of NO−2, as well as for providing substrate for the NO−3 reducing P. chlororaphis cultures.
Pseudomonas chlororaphis cultures were used to inoculate a starter tube containing 1.5 mL of TSB solution (30 g/L), KNO3 (1 g/L), and (NH4)2SO4 (0.066 g/L), which was placed on a reciprocal shaker for 1 day. TSB solution (400 mL) was added to a 500 mL media bottle, which was inoculated with the contents of the starter tube and sealed tightly. The media bottle was placed on the reciprocal shaker, and the bacteria were allowed to grow for 6–10 days under anaerobic conditions. At the end of the 6–10 days, the solution was centrifuged (10 min at 20°C and 6500 rpm). The supernatant was decanted into a large beaker and the pellets remaining in the centrifuge tubes were resuspended in 60 mL of the supernatant solution. An antifoam agent—one drop of Antifoam B (Sigma) per 60 mL—was added and the concentrated bacterial solution was mixed thoroughly. Two milliliter of this solution were pipetted into each 20 mL headspace vial, capped with a septum and crimped, and then purged for 4 h on the manifold system with N2 gas. The manifold system was carefully sterilized between sample sets.
Bacterial NO−2 and NO−3 Reduction to N2O
Solutions from the enzyme reaction were added to the purged S. nitritireducens vials to determine the 15N enrichment of N2O derived from NO−2. The amount of solution added to the vial was determined by the concentration of the NO−2 in the solution. A target value of 0.025 μmol of NO−2 were added to each vial. This corresponded to volumes ranging from 0.25 to 1.5 mL depending on the enzyme. The vials were then placed on a reciprocal shaker for 24 h. At the end of 24 h, a sample was removed from the vial using a gas-tight syringe and injected into a vial containing P. chlororaphis. Again, a volume of solution equivalent to 0.025 μmol of NO−3 was added to the vials (volumes ranged from 25–200 μL). Amounts of N added to all samples were matched to ensure that the samples remained in the linear range of the detectors in the IRMS. The P. chlororaphis vials were placed on the reciprocal shaker.
Once the subsample had been removed from the vials containing S. nitritireducens, and after 24 h incubation for the P. chlororaphis vials, 0.2 mL of 10 M NaOH were added to both sets of vials killing the bacteria and removing any residual headspace CO2. All vials were then taken to the UC Davis Stable Isotope Facility where they were analyzed for [N2O] and 15N (ThermoFinnigan GasBench + PreCon trace gas concentration system interfaced to a ThermoScientific Delta V Plus IRMS, Bremen, Germany). To control for potential contamination, blanks (including bacterial solution alone and with DDI water), natural abundance NO−2 and NO−3 samples, and appropriately 15N-enriched NO−2 and NO−3 standards, were included in each sample run. The blanks also allowed us to correct for any N2O derived from residual NO−3 remaining in the P. chlororaphis solution and instrumental leaks. Samples of the enzyme reaction solution were also tested for inorganic N contamination and found not to contain detectable amounts. No remaining inorganic N was found in the spent nutrient solution after the bacterial incubations. Thus, conversion of the NO−3 and NO−2 to N2O was complete and quantitative.
Analysis of 15N
We defined 45R and 46R as the ratios of measured ion peak areas [45R = (m/z 45)/(m/z 44), and 46R = (m/z 46)/(m/z 44)]. 15R or the ratio of 15N/14N of the N2O headspace was determined as:
where 17R (17O/16O) is fixed at the isotopic oxygen signature of ambient N2O (17R = 0.00038855; Kaiser et al., 2003). 15R may equivalently be determined using 46R as described in Stevens and Laughlin (1998):
where 18R (18O/16O) is fixed at the isotopic oxygen signature of N2O (δ18O = 44.62 and 18R = 0.0020947; Kaiser et al., 2003).
Isotope analyses are often expressed in terms of either δ15N or atom % 15N. δ15N is expressed as the per mil difference between the 15N/14N ratio of a sample relative to the primary reference material for nitrogen, atmospheric N2(“Air,” 0‰):
For all analyses, initial measurements are made relative to a working reference gas of the same species (i.e., N2O, N2), co-measured during analysis. Subsequently, all measurements were corrected using working standards previously calibrated to the following standard reference materials IAEA-N1, IAEA-N2, IAEA-N3, USGS-40, and USGS-41.
There are, however, no internationally accepted reference standards for N2O at high 15N enrichments and, because of this, we compared the 15N/14N ratio of the sample N2O to the 15N/14N ratio of the substrate NO−3 as determined by the quantitative combustion of substrate NO−3 to N2 (Stickrod and Marshall, 2000; See Supplemental Table 1) via a PDZ Europa ANCA-GSL Elemental Analyzer interfaced to a PDZ Europa 20-20 IRMS (Sercon Ltd., Cheshire, UK) according to:
This approach minimizes the impact of absolute errors in calibration because only differences between the substrate and product are considered, and the δ notation is very sensitive to large absolute differences between the sample and reference ratios (Fry, 2006). Also, in order to examine the performance of the bacterial reduction method at high levels of 15N enrichment, we calculated the atom % 15N from the atomic ratios, 15R:
Alternatively, the atom % 15N could be determined from the molecular ratios (e.g., 45R and 46R) as outlined in Stevens and Laughlin (1998).
The kinetic isotope effect (KIE) for a chemical reaction is the relative reactivity of molecules labeled with different isotopes (Farquhar et al., 1989). Data for competitive KIE experiments is generally taken at different values of fractional reaction of the initial substrate and fitted to Equation (6a), where f is fractional conversion of the initial substrate, R0 is the isotopic ratio of the initial substrate (equal to the isotopic ratio of the product at 100% conversion), and Rf is the isotopic ratio of the product at fractional reaction f. Here, because all reactions were halted at very low conversions of the initial NO−3 (0.5% maximal conversion), the KIE is well approximated by the molar 15N/14N ratio of the initial nitrate substrate to the nitrite product (Equation (6b); Bigeleisen and Wolfsberg, 1958):
Therefore, the KIE is related to the measured isotopic discrimination (Δ) by
Alternatively, it can be derived by the following equation (Evans, 2001):
where δ15N0 and δ15Nf are the 15N content of the initial substrate and the product at fractional reaction f, respectively. Enzyme discrimination data will be presented using the Δ notation for the remainder of this paper.
The bacterial reduction method was compared with a chemical reduction method to examine potential bacterial discrimination against 15N during the reduction of NO−2 to N2O. For the chemical reduction, we used sulfamic acid to reduce NO−2 to N2O (Granger and Sigman, 2009). As a result of this reaction, the solution NO−2 supplies one of the N atoms in the N2O molecule, while sulfamic acid supplies the other (Granger and Sigman, 2009). No remaining NO−3 was observed in the samples after the reduction.
Statistical Analysis
The experiments were formulated as a randomized complete block design. Blocks were represented by the enzyme batch to control for inter-batch variation in enzyme activity and purity. Depending on the particular enzyme, a single batch of enzyme was used to produce from one to three repetitions of each 15NO3 concentration to NO−2. A linear mixed effects model (PROC MIXED, SAS 9.1, Cary, NC, USA) was used to analyze the data.
Results
NR discrimination at natural abundance ranged (mean ± SE) from 22.5 ± 0.8‰ for Arabidopsis to 31.6 ± 2.3‰ for E. coli (Table 1). Interestingly, the two recombinant NRs (Arabidopsis and yeast) had the lowest discrimination among the enzymes. The average discrimination for the non-recombinant assimilatory eukaryotic NRs was 29.4 ± 0.4‰, significantly greater (p < 0.0001) than the average of 22.8 ± 0.5‰ for the recombinant NRs. The isotope discriminations of the maize and E. coli enzymes were significantly greater than that of the enzymes from Arabidopsis (p = 0.0171 and p = 0.0052, respectively) and yeast (p = 0.0254 and p = 0.0052, respectively). The KIEs had similar values among all species (Table 2) at natural abundance 15N.
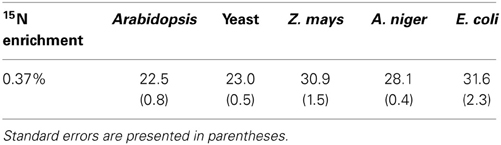
Table 1. Observed 15N natural abundance isotope discrimination (Δ in ‰, n = 6–10) for the five tested NRs.
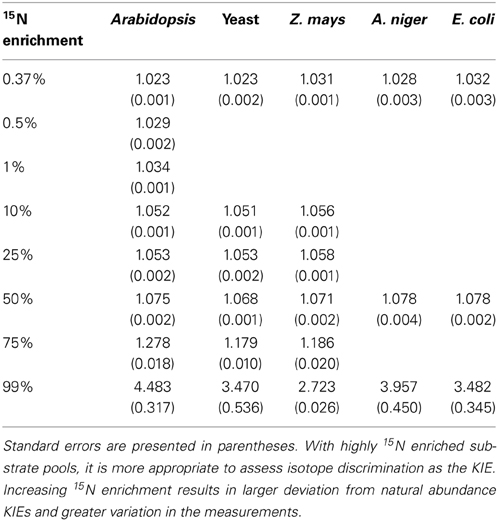
Table 2. Kinetic isotope effects (KIEs) for the five tested NRs.
There was no significant difference between the values obtained via the chemical and bacterial reduction methods (Figure 1; p = 0.5633), although the data from the chemical reduction method tended to be closer to the expected 15N enrichment at high 15N enrichments.
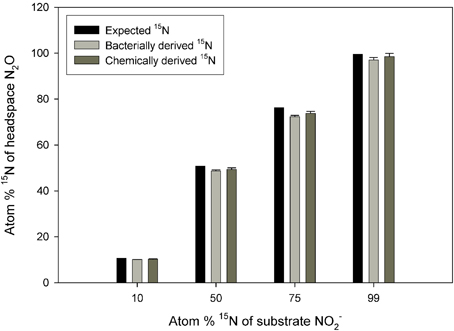
Figure 1. Observed 15N concentration in N2O across a range of substrate 15N enrichments. The N2O was produced from reduction of NO−2 to N2O via S. nitritireducens cultures (bacterially derived) or via sulfamic acid (chemically derived). Also plotted are the expected 15N concentrations. The bacterial and chemical data were calculated using Equation (5), and both approaches used the same NO−2 substrate. The expected plot assumes a constant 15N discrimination of −29.44‰. Error bars represent the standard errors of the means (n = 5).
Observed KIEs (R0/Rf) increased with increasing substrate 15N enrichment for all enzymes (p < 0.001; Figure 2, Table 2), particularly above 50 atom % 15N. The Arabidopsis enzyme showed the greatest deviation from expected, but all enzymes produced significantly less 15N-NO−2 than expected at 15N enrichments above 50 atom % (p < 0.001).
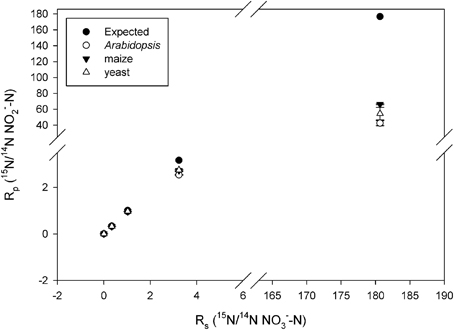
Figure 2. Plot of Rp (ratio of 15N/14N of the product NO−2) vs. Rs (ratio of the 15N/14N of the substrate NO−3) produced by the listed nitrate reductases (NR) when measured at natural abundance, 25, 50, 75, and 99 atom % 15N. Error bars represent the standard error of the means (n = 5–9). The expected plot was produced assuming that the NR KIEs (i.e., discrimination) were constant at 1.030.
Discussion
Natural Abundance
The results show that 15N discrimination in the NR-catalyzed reaction is similar across eukaryotic NRs, particularly among non-recombinant NRs. All NRs had 15N discrimination falling between 22 and 32‰ (corresponding to KIEs of 1.023 and 1.033, respectively; Table 2). This is higher than the 15‰ typically cited in the literature (e.g., Robinson, 2001; Werner and Schmidt, 2002). The relatively high 15N discrimination observed here may partially derive from differences in how the measurements were made. Other work has generally focused on in vivo discrimination (e.g., Mariotti et al., 1982) or in vitro experiments using isolated organelles or cytosolic fractions (e.g., Ledgard et al., 1985). In vitro experiments with purified enzymes typically produce greater isotopic discrimination than experiments with cellular organelles, multiple enzymes, or whole organisms because additional factors diminish 15N discrimination as the catalytic system becomes more complex (Werner and Schmidt, 2002). We performed in vitro assays using purified NRs and electron donors, providing unlimited substrate, and operating under optimal conditions to prevent subsequent conversion of the product NO−2. Olleros-Izard (1983: cited in Schmidt and Medina, 1991) used a similar approach with purified corn NR and observed a discrimination of 30‰, which agrees with our values for non-recombinant enzymes. Karsh et al. (2012) using purified enzymes and the bacterial reduction method found that the assimilatory NR from A. niger discriminated against 15NO−3 by 26.6 ± 0.2‰ (Karsh et al., 2012), again a value similar to ours.
The four assimilatory eukaryotic NRs (Arabidopsis, yeast, maize, and A. niger) are structurally similar, although the two recombinant enzymes (Arabidopsis and yeast) lack a portion of the complete native enzyme. For example, the recombinant Arabidopsis NR, which is natively homotetrameric, is missing in three of its four subunits the Mo-MPT cofactor, and thus the NO−3 reducing site (Skipper et al., 2001). Such differences in structure may account for the lower 15N discrimination observed in the recombinant NRs than in the maize and A. niger enzymes (Table 1). Some of the observed difference between the Arabidopsis and maize NRs may be due to differences between monocot and eudicot NRs; however, there is no published evidence for this possibility. Differences in glycosylation between native enzymes and recombinant enzymes expressed in P. pastoris also might affect enzymatic activity and possibly isotope discrimination (e.g., Henriksson et al., 2003).
Despite the structural disparity (Moreno-Vivián et al., 1999) between the eukaryotic and prokaryotic NRs, the E. coli NR did not grossly differ in NR 15N discrimination from the other NRs tested.
The electron donor did not strongly affect 15N discrimination. The plant-derived NRs (Arabidopsis and maize) used NADH as an electron donor, while the fungal NRs used NADPH. The similar level of discrimination that we found despite the difference donors supports the hypothesis that substantial structural differences among the eukaryotic enzymes are largely localized to the FAD binding domain (Campbell, 1999; Karsh et al., 2012). The dissimilatory E. coli NR used BV as an artificial electron donor, which provides electrons to the Mo-MGD cofactor directly, in contrast to the biological donor quinol, which provides electrons through the FeS or cytochrome c cofactors. No studies have measured the effects of the biological electron donor on 15N discrimination in nitrate reduction in prokaryotes, and it is not clear whether the use of a different electron donor would affect 15N discrimination. Nonetheless, use of an artificial electron donor (e.g., methyl viologen) rather than NADH had little to no influence on eukaryotic NR 15N discrimination (Karsh et al., 2012).
Estimation of NR Discrimination Using Enriched 15N
The systematic and large deviation from expected values of the KIEs at high 15N enrichment (particularly >50 atom %; Figure 2) cannot derive from substrate dependent changes in the rate limiting nature of N-O bond cleavage because the observed KIEs are greater than their theoretical limits (Tcherkez and Farquhar, 2006). Our measurements at high 15N enrichment were affected by artifacts. Similar artifacts may have affected the 15N pulse labeling experiment in our previous work (Bloom et al., 2010). The following discusses some of these potential artifacts.
First, although the sequential bacterial reduction method to assess 15N discrimination at natural abundance 15N worked very well, we observed increasingly large standard errors and anomalously low 15N enrichment in the N2O derived from NO−3 reduction by P. chlororaphis as 15N NO−3 enrichment increased (Supplemental Table 2). At enrichments of 99 atom %, the N2O derived from the NO−2 was substantially more enriched in 15N than the N2O derived from NO−3 (97.6 vs. 58.3 atom % 15N; Supplemental Table 2). If we used a different NO−3 reducing bacterium, Pseudomonas aureofaciens (Sigman et al., 2001), the observed differences were even larger (97.6 vs. 7.9 atom %; Supplemental Table 2). By contrast, S. nitritireducens produced N2O from NO−2 with 15N enrichment comparable to that produced via chemical reduction (Figure 1). These results suggest that the sequential bacterial reduction method should be limited to 15N enrichments of less than 10 atom %. The reason for the variation among the bacterial strains is not clear, although ages of the bacterial strains or possible bacterial contamination may play a role. NO−3 concentrations in the spent bacterial reduction solutions contained no measurable NO−3 after reduction, so the reaction was apparently quantitative (data not shown).
Second, instrument performance and the mathematical models currently available for the calculation of 15N in N2O at high levels of 15N enrichment are likely responsible for some of the observed variation. Using an IRMS rather than using an elemental analyzer coupled with a mass spectrometer contributed to the observed error, particularly at 15N enrichments greater than 50%, however, the use of the IRMS was necessary to measure NR discrimination at natural abundance 15N concentrations. High enrichments of 15N lead to problems with IRMS collector saturation, and we could not measure the 44 peak necessary for the calculation of the mass ratios.
The results from highly 15N enriched substrates presented here illustrate a more general methodological issue regarding stable N isotopes: one should avoid the use of highly 15N enriched substrates in discrimination studies, particularly if small experimental changes in 15N concentration are expected. High 15N enrichments exacerbate methodological difficulties in sample preparation, measurement, and instrument calibration. This ultimately increases the final experimental error and unnecessarily confounds experimental outcomes.
Indeed, the problems in the use of highly enriched 15N encountered here may affect measurements at larger scales. For example, it is common in agricultural field studies to use enriched 15N as a tracer for the cycling of N among different soil pools. Experiments conducted using enriched 15N tracers consistently estimate lower N cycling rates than those conducted using natural abundance or non-isotopic methods (e.g., Hauck and Bremner, 1976; Androsoff et al., 1995; Ladha et al., 2005). Other factors beyond the measurement issues described above certainly play a role in the observed differences among these approaches, but artifacts linked to the use of high 15N enrichments such as those observed here may contribute to these differences.
In conclusion, despite the use of different (i.e., natural and artificial) electron donors, NR 15N discrimination at natural abundance levels of 15N varied between 22 to 32‰ among four assimilatory eukaryotic NRs as well as a prokaryotic dissimilatory NR. These discriminations are similar to those observed or reported in other recent studies (Tcherkez and Farquhar, 2006; Karsh et al., 2012). Difficulties encountered using heavily 15N-enriched samples demonstrate the undesirability of protocols requiring such labeling for the measurement of enzyme isotope discrimination.
Conflict of Interest Statement
The authors declare that the research was conducted in the absence of any commercial or financial relationships that could be construed as a potential conflict of interest.
Acknowledgments
This work was supported by NSF-IOS-08-18435, NSF-IOS-13-58675, and the National Research Initiative Competitive Grant 2008-35100-04459 from the USDA National Institute of Food and Agriculture. We would like to thank Hsien Easlon for his comments and critical review and Joy Mathews for her assistance with the instrumentation. Finally we would like to thank two anonymous reviewers for their critical reviews of the manuscript. No conflict of interest, financial or otherwise, exists for any of the authors.
Supplementary Material
The Supplementary Material for this article can be found online at: http://www.frontiersin.org/Journal/10.3389/fpls.2014.00317/abstract
References
Adams, M. W. W., and Mortenson, L. E. (1982). The effect of cyanide and ferricyanide on the activity of the dissimilatory nitrate reductase of Escherichia coli. J. Biol. Chem. 257, 1791–1799.
Amundson, R., Austin, A. T., Schuur, E. A. G., Yoo, K., Matzek, V., Kendall, C., et al. (2003). Global patterns of the isotopic composition of soil and plant nitrogen. Glob. Biogeochem. Cycles 17, 1031. doi: 10.1029/2002GB001903
Androsoff, G. L., van Kessel, C., and Pennock, D. J. (1995). Landscape-scale estimates of dinitrogen fixation by Pisum sativum by nitrogen-15 natural abundance and enriched isotope dilution. Biol. Fertil. Soils 20, 33–40. doi: 10.1007/BF00307838
Barbier, G. G., and Campbell, W. H. (2005). Viscosity effects on eukaryotic nitrate reductase activity. J. Biol. Chem. 280, 26049–26054. doi: 10.1074/jbc.M409694200
Barbier, G. G., Joshi, J. C., Campbell, E. R., and Campbell, W. H. (2004). Purification and biochemical characterization of simplified eukaryotic nitrate reductase expressed in Pichia pastoris. Protein Expr. Purif. 37, 61–71. doi: 10.1016/j.pep.2004.05.021
Berks, B. C., Ferguson, S. J., Moir, J. W. B., and Richardson, D. J. (1995). Enzymes and associated electron transport systems that catalyse the respiratory reduction of nitrogen oxides and oxyanions. Biochim. Biophys. Acta 1232, 97–173. doi: 10.1016/0005-2728(95)00092-5
Bigeleisen, J., and Wolfsberg, M. (1958). “Theoretical and experimental aspects of isotope effects in chemical kinetics,” in Advances in Chemical Physics, Vol. 1, eds I. Prigogine and P. Debye (Hoboken, NJ: John Wiley and Sons, Inc), 15–76.
Bloom, A. J., Burger, M., Asensio, J. S. R., and Cousins, A. B. (2010). Carbon dioxide enrichment inhibits nitrate assimilation in wheat and Arabidopsis. Science 238, 899–903. doi: 10.1126/science.1186440
Böhlke, J. K., Smith, R. L., and Hannon, J. E. (2007). Isotopic analysis of N and O in nitrite and nitrate by sequential selective bacterial reduction to N2O. Anal. Chem. 79, 5888–5895. doi: 10.1021/ac070176k
Campbell, W. H. (1999). Nitrate reductase structure, function and regulation: bridging the gap between biochemistry and physiology. Annu. Rev. Plant Physiol. Plant Mol. Biol. 50, 277–303. doi: 10.1146/annurev.arplant.50.1.277
Cleland, W. W. (2005). The use of isotope effects to determine enzyme mechanisms. Arch. Biochem. Biophys. 433, 2–12. doi: 10.1016/j.abb.2004.08.027
Epstein, E., and Bloom, A. J. (2005). Mineral Nutrition of Plants: Principles and Perspectives, 2nd Edn. Sunderland, MA: Sinauer Associates.
Evans, R. D. (2001). Physiological mechanisms influencing plant nitrogen isotope composition. Trends Plant Sci. 6, 121–126. doi: 10.1016/S1360-1385(01)01889-1
Evans, R. D., Bloom, A. J., Sukrapanna, S. S., and Ehlringer, J. R. (1996). Nitrogen isotope composition of tomato (Lycopersicon esculentum Mill. cv. T-5) grown under ammonium or nitrate nutrition. Plant Cell Environ. 19, 1317–1323. doi: 10.1111/j.1365-3040.1996.tb00010.x
Farquhar, G. D., Ehleringer, J. R., and Hubick, K. T. (1989). Carbon isotope discrimination and photosynthesis. Annu. Rev. Plant Physiol. Plant Mol. Biol. 40, 503–537. doi: 10.1146/annurev.pp.40.060189.002443
Fischer, K., Barbier, G. G., Hecht, H. J., Mendel, R. R., Campbell, W. H., and Schwarz, G. (2005). Structural basis of eukaryotic nitrate reduction: crystal structure of the nitrate reductase active site. Plant Cell 17, 1167–1179. doi: 10.1105/tpc.104.029694
Gilliam, M. B., Sherman, M. P., Griscavage, J. M., and Ignarro, L. J. (1993). A spectrophotometric assay for nitrate using NADPH oxidation by Aspergillus nitrate reductase. Anal. Biochem. 212, 359–365. doi: 10.1006/abio.1993.1341
Granger, J., and Sigman, D. (2009). Removal of nitrite with sulfamic acid for nitrate N and O isotope analysis with the denitrifier method. Rapid Commun. Mass Spectrom. 23, 3753–3762. doi: 10.1002/rcm.4307
Granger, J., Sigman, D. M., Needoba, J. A., and Harrison, P. J. (2004). Coupled nitrogen and oxygen isotope fractionation of nitrate during assimilation by cultures of marine phytoplankton. Limnol. Oceanogr. 49, 1763–1773. doi: 10.4319/lo.2004.49.5.1763
Hauck, R. D., and Bremner, J. M. (1976). Use of tracers for soil and fertilizer nitrogen research. Adv. Agron. 28, 219–266. doi: 10.1016/S0065-2113(08)60556-8
Henriksson, H., Denman, S. E., Campuzano, I. D. G., Ademark, P., Master, E. R., Teeri, T. T., et al. (2003). N-linked glycosylation of native and recombinant cauliflower xyloglucan endotransglycosylase 16A. Biochem. J. 375, 61–73. doi: 10.1042/BJ20030485
Hipkin, C. R., Ali, A. H., and Cannons, A. (1986). Structure and properties of assimilatory nitrate reductase from the yeast Candida nitratophila. J. Gen. Microbiol. 132, 1997–2003. doi: 10.1099/00221287-132-7-1997
Kaiser, J., Rockmann, T., and Brenninkmeijer, C. A. M. (2003). Complete and accurate mass spectrometric isotope analysis of tropospheric nitrous oxide. J. Geophys. Res. 108, 1–17. doi: 10.1029/2003JD003613
Karsh, K. L., Granger, J. L., Kritee, K., and Sigman, D. M. (2012). Eukaryotic assimilatory nitrate reductase fractionates N and O isotopes with a ratio near unity. Environ. Sci. Technol. 46, 5727–5735. doi: 10.1021/es204593q
Kolb, K. J., and Evans, R. D. (2003). Influence of nitrogen source and concentration on nitrogen isotopic discrimination in two barley genotypes (Hordeum vulgare L.). Plant Cell Environ. 26, 1431–1440. doi: 10.1046/j.1365-3040.2003.01066.x
Ladha, J. K., Pathak, H., Krupnik, T. J., Six, J., and van Kessel, C. (2005). Efficiency of fertilizer nitrogen in cereal production: retrospects and prospects. Adv. Agron. 87, 85–156. doi: 10.1016/S0065-2113(05)87003-8
Ledgard, S. F., Woo, K. C., and Bergersen, F. J. (1985). Isotopic fractionation during reduction of nitrate and nitrite by extracts of spinach leaves. Aust. J. Plant Physiol. 12, 631–640. doi: 10.1071/PP9850631
Mariotti, A., Mariotti, F., Champigny, M.-L., Amarger, N., and Moyse, A. (1982). Nitrogen isotope fractionation associated with nitrate reductase activity and uptake of NO−3 by Pearl Millet. Plant Physiol. 69, 880–884. doi: 10.1104/pp.69.4.880
Miranda, K. M., Espey, M. G., and Wink, D. A. (2001). A rapid, simple spectrophotometric method for simultaneous detection of nitrate and nitrite. Nitric Oxide 5, 62–71. doi: 10.1006/niox.2000.0319
Moreno-Vivián, C., Cabello, P., Martínez-Luque, M., Blasco, R., and Castillo, F. (1999). Prokaryotic nitrate reduction: molecular properties and functional distinction among bacterial nitrate reductases. J. Bacteriol. 181, 6573–6584.
Morozkina, E. V., Nosikov, A. N., Zvyagilskaya, R. A., and L'Vov, N. P. (2005). Isloation purification, and characterization of nitrate reductase from a salt-tolerant Rhodotorula glutinis yeast strain grown in the presence of tungsten. Biochemistry (Mosc.) 70, 809–814. doi: 10.1007/s10541-005-0188-y
Needoba, J. A., Sigman, D. M., and Harrison, P. J. (2004). The mechanism of isotope fractionation during algal nitrate assimilation as illuminated by the 15N/14N of intracellular nitrate. J. Phycol. 40, 517–522. doi: 10.1111/j.1529-8817.2004.03172.x
Nielsen, M., Larsen, L. H., Jetten, M. S. M., and Revsbech, N. P. (2004). Bacterium-based NO−2 biosensor for environmental applications. Appl. Environ. Microbiol. 70, 6551–6558. doi: 10.1128/AEM.70.11.6551-6558.2004
Olleros-Izard, T. (1983). Kinetische Isotopeneffekte der Arginase und Nitratreduktase Reaktion: Ein Betrag zur Aufklärung der Entsprechenden Reaktionmechanismen. Ph.D. thesis, Technischen Universität München, Freising-Weihenstephan.
Robinson, D. (2001). δ15N as an integrator of the nitrogen cycle. Trends Ecol. Evol. 16, 153–162. doi: 10.1016/S0169-5347(00)02098-X
Robinson, D., Handley, L. L., and Scrimgeour, C. M. (1998). A theory for 15N/14N fractionation in nitrate-grown vascular plants. Planta 205, 397–406. doi: 10.1007/s004250050336
Schlesinger, W. H. (1997). Biogeochemistry: An Analysis of Global Change. San Diego, CA: Academic Press.
Schmidt, H. L., and Medina, R. (1991). Possibilities and scope of the double isotope effect method in the elucidation of mechanisms of enzyme catalyzed reactions. Isotopenpraxis 27, 1–4. doi: 10.1080/10256019108622450
Shearer, G., and Kohl, D. H. (1986). N2-fixation in field settings: estimations based on natural 15N abundance. Aust. J. Plant Physiol. 13, 699–756.
Sigman, D. M., Casciotti, K. L., Andreani, M., Barford, C. M., Galanter, M., and Bohlke, J. K. (2001). A bacterial method for the nitrogen isotopic analysis of nitrate in seawater and freshwater. Anal. Chem. 73, 4145–4153. doi: 10.1021/ac010088e
Skipper, L., Campbell, W. H., Mertens, J. A., and Lowe, D. J. (2001). Pre-steady state kinetic analysis of recombinant Arabidopsis NADH:nitrate reductase: rate-limiting processes in catalysis. J. Biol. Chem. 276, 26995–27002. doi: 10.1074/jbc.M100356200
Stevens, R. J., and Laughlin, R. J. (1998). Measurement of nitrous oxide and di-nitrogen emissions from agricultural soils. Nutr. Cycling Agroecosyst. 52, 131–139. doi: 10.1023/A:1009715807023
Stickrod, R. D. 2nd., and Marshall, J. D. (2000). On-line nitrate-δ15N extracted from groundwater determined by continuous-flow elemental analyzer/isotope ratio mass spectrometry. Rapid Commun. Mass Spectrom. 14, 1266–1268. doi: 10.1002/1097-0231(20000730)14:14<1266::AID-RCM21>3.0.CO;2-R
Su, W., Mertens, J. A., Kanamaru, K., Campbell, W. H., and Crawford, N. M. (1997). Analysis of wild-type and mutant plant nitrate reductase expressed in the methylotrophic yeast Pichia pastoris. Plant Physiol. 115, 1135–1143. doi: 10.1104/pp.115.3.1135
Tcherkez, G., and Farquhar, G. D. (2006). Isotopic fractionation by plant nitrate reductase, twenty years later. Funct. Plant Biol. 33, 531–537. doi: 10.1071/FP05284
Temple, C. A., and Rajagopalan, K. V. (2000). Mechanism of assembly of the bis(molybdopterin guanine dinucleotide) molybdenum cofactor in Rhodobacter sphaeroides dimethyl sulfoxide reductase. J. Biol. Chem. 275, 40202–40210. doi: 10.1074/jbc.M007407200
Keywords: nitrate reductase, 15N discrimination, natural abundance, enriched 15N, plant, fungi, bacteria, kinetic isotope effect
Citation: Carlisle E, Yarnes C, Toney MD and Bloom AJ (2014) Nitrate reductase 15N discrimination in Arabidopsis thaliana, Zea mays, Aspergillus niger, Pichea angusta, and Escherichia coli. Front. Plant Sci. 5:317. doi: 10.3389/fpls.2014.00317
Received: 29 January 2014; Accepted: 15 June 2014;
Published online: 02 July 2014.
Edited by:
Cristina Cruz, Faculty of Sciences of the University of Lisbon, PortugalReviewed by:
Adrian Hegeman, University of Minnesota–Twin Cities, USAUener Kolukisaoglu, University of Tuebingen, Germany
Copyright © 2014 Carlisle, Yarnes, Toney and Bloom. This is an open-access article distributed under the terms of the Creative Commons Attribution License (CC BY). The use, distribution or reproduction in other forums is permitted, provided the original author(s) or licensor are credited and that the original publication in this journal is cited, in accordance with accepted academic practice. No use, distribution or reproduction is permitted which does not comply with these terms.
*Correspondence: Arnold J. Bloom, Department of Plant Sciences, University of California, One Shields Avenue, Davis, CA 95776, USA e-mail: ajbloom@ucdavis.edu
†Present address: Eli Carlisle, Department of Land, Air, and Water Resources, University of California, Davis, USA