 Yang Yang
 Rolf T. W. Siegwolf
 Christian Körner
- 1Key Laboratory for Plant Diversity and Biogeography of East Asia, Kunming Institute of Botany, Chinese Academy of Sciences, Kunming, China
- 2Institute of Botany, University of Basel, Basel, Switzerland
- 3Lab for Atmospheric Chemistry, Paul Scherrer Institute, Villigen, Switzerland
Stable carbon and nitrogen isotope signals in plant tissues integrate plant-environment interactions over long periods. In this study, we hypothesized that humid alpine life conditions are narrowing the scope for significant deviations from common carbon, water and nitrogen relations as captured by stable isotope signals. We explored the variation in δ13C and δ15N in 32 plant species from tissue type to ecosystem scale across a suite of locations at c. Two thousand five hundred meter elevation in the Swiss Alps. Foliar δ13C and δ15N varied among species by about 3–4‰ and 7–8‰ respectively. However, there was no overall difference in means of δ13C and δ15N for species sampled in different plant communities or when bulk plant dry matter harvests of different plant communities were compared. δ13C was found to be highly species specific, so that the ranking among species was mostly maintained across 11 habitats. However, δ15N varied significantly from place to place in all species (a range of 2.7‰) except in Fabaceae (Trifolium alpinum) and Juncaceae (Luzula lutea). There was also a substantial variation among individuals of the same species collected next to each other. No difference was found in foliar δ15N of non-legumes, which were either collected next to or away from the most common legume, T. alpinum. δ15N data place Cyperaceae and Juncaceae, just like Fabaceae, in a low discrimination category, well separated from other families. Soil δ15N was higher than in plants and increased with soil depth. The results indicate a high functional diversity in alpine plants that is similar to that reported for low elevation plants. We conclude that the surprisingly high variation in δ13C and δ15N signals in the studied high elevation plants is largely species specific (genetic) and insensitive to obvious environmental cues.
Introduction
Based on the correlation between the discrimination of the heavy 13C isotope during CO2 gas exchange and habitat conditions, δ13C has become an important ecological index of plant carbon and water relations and photosynthesis performance (Dawson et al., 2002). In C3 plants, 13C discrimination can be altered by the combined effect of stomatal control and the activity of the carboxylating enzyme, Rubisco, both under either genetic or environmental control (Geber and Dawson, 1990; Vitousek et al., 1990; Guehl et al., 1995). δ15N signals in plant tissues have been shown to reflect the dominant way of N acquisition by plants, with the degree of symbiotical N2 fixation and mycorrhizal associations (e.g., ectomycorrhizal and arbuscular mycorrhizal species) contributing most to the variation in 15N abundance in plants (Evans, 2001; Dawson et al., 2002; Craine et al., 2009). In addition, the δ15N signal in plant tissues is also related to the N-forms available in the soil, which reflects the isotopic fractionations during biogeochemical processes (Högberg, 1997).
High elevation alpine habitats are characterized by cold climate, low partial pressure of ambient CO2, and N limitation of growth (Körner, 2003), all likely to affect δ13C and δ15N in characteristic ways. For instance, a cross-cutting trend associated with increasing elevation in humid regions (tested for large enough ranges of elevation) is a reduction of the discrimination against 13C, interpreted as an increased efficiency of carbon capture in high elevation plants (Körner et al., 1988, 1991). More recent broad samplings of congeneric species revealed that the reduced over all 13C discrimination with elevation is associated with atmospheric pressure (its various side effects) and is not related to reduced temperature (Zhu et al., 2010; Zhou et al., 2011), matching results of earlier gas exchange works that showed that temperature exerts minor influences on carbon uptake in alpine plants (Körner, 1982; Körner and Diemer, 1987). Seeming deviations from this pattern had been reported when elevational gradients were confounded with moisture gradients or when the elevational gradients explored were too narrow so that local peculiarities of soil conditions or in genotype overtopped the elevation signal (Körner, 2007). On the other hand, a wider range of interspecific foliar δ15N was observed in cold ecosystem (e.g., arctic tundra) compared to other ranges in warmer region (Nadelhoffer et al., 1996; Craine et al., 2009). In alpine ecosystems, microclimate and biota are characterized by small-scale variability over very short distances related to topography (Scherrer and Körner, 2010). These topography-related patterns at high elevation can also produce considerable variations in soil moisture and nutrient availability, impacting plant performance and community composition (Körner, 2003). The influence of topography on the distribution of plant species (May and Webber, 1982), on the above-ground and below-ground productivity (Billings and Bliss, 1959) and on nitrogen cycling (Fisk et al., 1998) have been well demonstrated in different alpine sites.
An assessment of δ13C in forb and grass species from similar elevations (4100–4700 m) in New Guinea, the Venezuelan Andes, Mt. Kenya, and the northwestern Argentinean Andes, showed very similar δ13C values despite a decline in precipitation from >3000 mm a-1 (δ13C: -25.9‰) to 300 mm a-1 (δ13C: -26.3‰), thus revealing no differentiation by water relations (as captured by 13C signals) within such high elevation habitats (Körner et al., 1991). Additionally, δ13C in herbaceous plants along sharp moisture gradients in an Andean semi-desert in northwestern Argentina at 4200 m elevation exhibited no significant change from moist to dry sites (Körner, 2003). Such data suggest that stomatal responses to drought did not significantly affect δ13C even in alpine semi-deserts, presumably because wide plant spacing is balancing reduced precipitation, so that physiological responses to water availability did not restrict CO2 uptake per unit leaf area. Different species sampled from one common location were found to retain the δ13C signal they exhibit at separate locations, suggesting a strong genotypic influence on δ13C (Körner et al., 1991).
Similarly, it was found that foliar δ15N signals in co-occurring species varied with a constant rank across sites of varying N availability in a dry meadow community in the Rocky Mountains, suggesting a fixed partitioning of soil N and N utilization among these alpine plant species, regardless of habitats (Miller and Bowman, 2002). These findings suggest that δ15N signals have a strong genotypic component as well. Since foliar δ15N in non-N2-fixing species is tracking isotopic ratios of soil resources, several biological processes, such as mycorrhizal symbioses (Schmidt and Stewart, 2003) or horizontal transfer by mycorrhiza from N2-fixing species (Schulze et al., 1991) can influence 15N signals. It is well documented that non-N2-fixing plants may obtain N from N2-fixing plants via mycorrhizal connections and/or other ways (Johansen et al., 1993). The strong influence of N2-fixing plants on adjacent non-N2-fixing plants was evidenced recently for subtropical savannas in southern Texas (Bai et al., 2009) and steppe ecosystems in northern Mongolia (Casper et al., 2012).
Very cold environments do not preclude symbiotic N2-fixation, and so far, all legumes tested at high elevation were found to perform symbiotic N2-fixation (Wojciechowski and Heimbrook, 1984; Arnone, 1999; Jocot et al., 2000; Körner, 2003). This also holds for subarctic environments (Chapin et al., 1992). In fact, the relative contribution of symbiotically fixed N2 may even increase with elevation. Bowman et al. (1996) reported three species of Trifolium (Fabaceae) obtained a high proportion of their N from N2 fixation and played an important role in N cycling in the alpine site of Niwot Ridge in the Rocky Mountains. There are also other symbiotic N2 fixing associations in alpine vegetation, for example, actinomycorrhizal ones by Dryas species and subalpine Alnus (Körner, 2003; Hiltbrunner et al., 2014).
The primary objective of this study was to separate potential phenotypic (environment induced) from genotypic (phylogenetic) causes of carbon and nitrogen isotopic composition of plant species at high elevations. We (1) hypothesized that the variation in isotope discrimination is largely genotypic, given the supposed uniformity of the physical environmental conditions. Given the overall humid conditions in the test region (annual precipitation sums average at c. 1900 mm, Inauen et al., 2013) and the high elevation (c. 2430–2500 m), we (2) hypothesized that the balance of carbon and water relations as expressed in δ13C will result in a narrow signal range, at high absolute signals compared to low elevation, due to the 25% reduced atmospheric pressure. Based on previous studies, we (3) expected to find substantial differences in δ15N between legumes and non-legumes, and between early and late successional plant communities, but little additional variation within those categories, given the otherwise common life conditions. In addition, we (4) expected a strong influence of legumes on the δ15N signals of their non-legume neighbors. Finally, we had a methodological aim: we wanted to identify variation (and its causes) that may also influence the outcome of random sampling of isotope signals such as for instance from herbaria, where no information on site conditions, neighborhood, replication and often no choice in tissue is given. We, thus, systematically explored the influence of tissue type, variation among individuals sampled from the very same location, variation across species in interaction with different sites, community means for different community types, bulk biomass, and soil organic matter (SOM).
Hence, as a methodological task, this field study was also designed to provide some guidance on how to treat and interpret the variation in isotopic signals to be expected in studies based on archive material from alpine terrain. Isotopic signals may vary with the type and age of plant tissue sampled (Yoneyama and Ohtani, 1983; Högberg, 1997; Evans, 2001). Therefore, we explored organ specificity of isotopic signals in both C and N in alpine taxa from our test region. This may also contribute to the understanding of the causes of signal variations, that is, the responsible metabolic processes during dry matter allocation (Dawson et al., 2002).
Materials and Methods
Sampling Sites
Samples were collected in the vicinity of the ALPFOR Research Station (http://pages.unibas.ch/botschoen/alpfor/) at Furka pass (Swiss Central Alps) in locations between 2430 and 2500 m a.s.l. in the upper Reuss catchment (46°34′N, 08°25′E) in July 2012. In 2012, snowmelt started in early to mid June and the season ended with plant senescence between early and mid September.
The mean temperatures in June, July, August, and September were 4.9, 7.7, 6.9, 3.6°C during the last 3 years, with ca. 7.3°C during July 2012 when this field survey was conducted; and mean soil temperatures in 10 cm depth are 4 K warmer than air temperature (unpublished data of the ALPFOR station, E. Hiltbrunner personal communication). Annual precipitation varies around 1900 mm, with ca. 500 mm falling during the growing season (mid June to mid September), always exceeding evapotranspiration (Inauen et al., 2013). Soils under the vegetation examined are acidic (pH 3.1–4.1; Supplementary Table S1), rich in organic material, and mostly deeply weathered, with a high water holding capacity (alpine brownearth; van den Bergh et al., 2013). The flora of this region is among the richest in the Alps (Hefel and Stöcklin, 2010). More than half of the Swiss alpine angiosperm plant species (301 species) occur within ca. 1 km around the research station as a result of mixed geology, including both, carbonate-rich and siliceous bedrock.
Plant, Soil and Biomass Sampling
In this project we adopted a ‘quasi-common-garden’ approach, by sampling the same species or individuals of the same species from homogenous sampling plots at different positions (horizontal transect of ca. 2 km) in an alpine landscape. This way, we can exclude significant environmental variation within a given sampling plot, cover a spectrum of different plant communities (including the same target species) at otherwise minor climatic and moisture contrasts among plots, and account for potential genotypic variation and legume-neigbourhood effects. In contrast to classical common gardens, the plants sampled were not transplanted but had a long history of in situ interaction with other plants, soil, and microbes (mycorrhizae), while belonging to the same metapopulation.
Samples were largely collected next to six permanent plots maintained by the ALPFOR research station (Figure 1), three types of which were chosen that encompass typical plant communities such as Nardus-rich heathland (P1.1 and P1.2), Festuca violacea meadows (P4.1 and P4.2) and snowbed communities (P8.1 and P8.2; Supplementary Table S1). In each of these sampling locations, leaf samples from different species, soil samples from different soil depths and samples of different types of plant tissue were collected (see below).
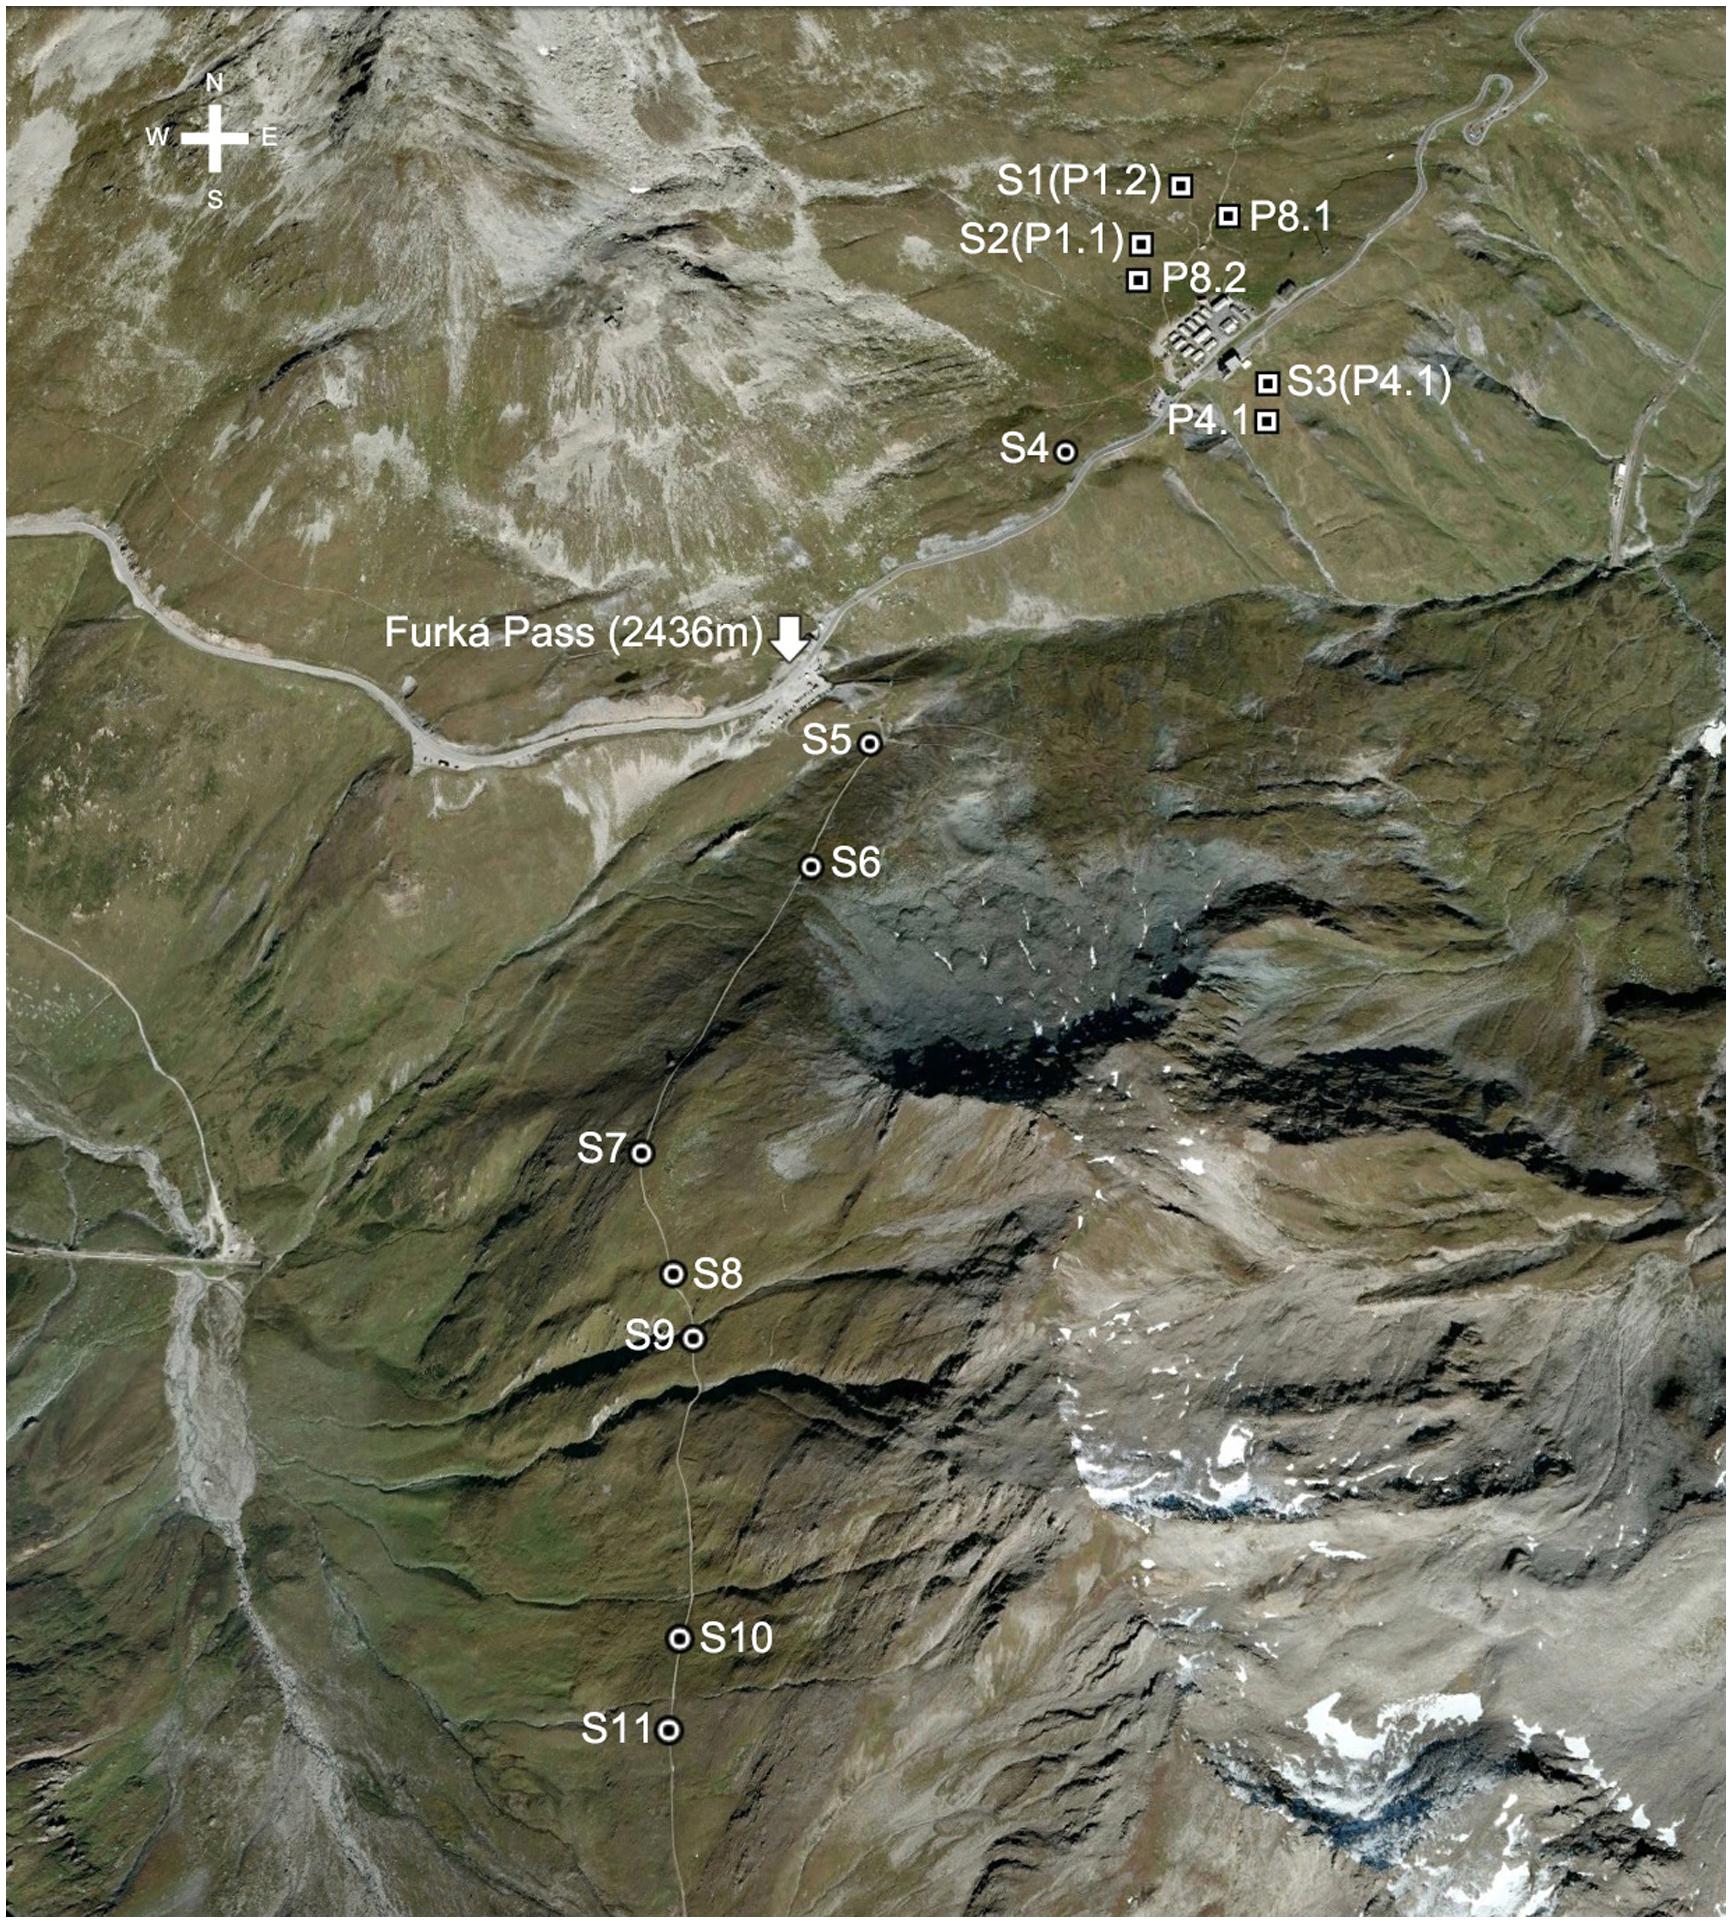
FIGURE 1. Location of sampling sites (S, circles) near Furka Pass, Swiss Central Alps at 2430–2500 m and six permanent plots (P, squares) near the ALPFOR research station [adapted from Google Earth (version 7.1.2.2041)].
In addition to the plot-based sampling, 4–6 common species, i.e., one sedge (Carex sempervirens), one rush (Luzula lutea), one legume (Trifolium alpinum), two forbs (Geum montanum, Homogyne alpina), and one grass (Poa alpina) were collected from 6 to 8 additional sites along a ca. 2 km transect across varied alpine terrain in the same region (locations S1–S11, Figure 1), including three of the permanent plot locations (P1.1, P1.2, and P4.1; Supplementary Table S1). We arrived at 8–11 sites that had 4–6 of the species in common.
For foliar sampling, 3–5 healthy and green leaves from each of 3–5 (mostly 5) individuals per plant species were collected from a sampling location. In general, the species sampled were representative and important for each studied plant community (Supplementary Table S2). To minimize the possible impact of rhizobium-fixed N2 on foliar isotopic signatures, samples were collected at least 1 m away from legumes (mostly T. alpinum and rarely T. thalii). In order to investigate the impact of N2-fixing species on foliar 15N of adjacent non-N2-fixing species, leaves of three individuals of each of 6–8 non-N2-fixing species were collected in plots P1.1 and P1.2, co-occurring near (<10 cm) a patch of one common legume (T. alpinum). Except when we studied individuals, we pooled leaves for each species from each sampling location (foliage from 5 different individuals).
For bulk plant dry matter and soil samples, two subplots (25 × 25 cm) were used at the edge of each of the permanent plots. On each subplot, plants were clipped to 1 cm above ground, leaving the bottom moss layer untouched. Above-ground dry matter was then sorted into live (biomass), standing dead (necromass) and litter fractions. From the same subplot, a central soil core was extracted down to 30 cm depth using a 2.5 cm diameter metal corer. For each soil profile, segments at depths down to 2.5, 5, 10, 15, 20, 25, and 30 cm were bagged separately. The soil samples were sieved (<1 mm) after roots had been removed.
Sampling of Different Organs within One Species
To assess the C and N isotopic compositions of different organs within a species, we have chosen four common species in the study region (i.e., C. foetida, C. sempervirens, Nardus stricta, and T. alpinum) and collected three individuals from each species close to plot P8.2. For each plant individual, different organs including terminal (older) and lower (younger) parts of green leaves (in case of T. alpinum, these were leaf petiole and leaf blade instead), dead leaves, flowering stalks, fruit heads, seeds and roots were collected.
13C and 15N Analysis
Except when we studied different organs or bulk biomass, the study was based on green leaves. All samples were dried at 80°C. The oven dry material was ground with a steel ball mill. Samples of 2–3 mg were then weighed into tin capsule. Dried and sieved (<1 mm) soil samples were ground manually with a mortar, and 4–5 mg was weighed into tin capsule.
The isotopic signature (13C and15N) of plant and soil materials were determined using an isotope ratio mass spectrometer (Delta S, Finnigan Mat, Bremen). Isotope ratios were calculated as:
where Rsample and Rstandard are the 13C/12C or 15N/14N molar abundance ratios of samples, with the internationally accepted standard (V-PDB) and the free atmosphere (15N), serving as references.
Data Analysis
Differences in δ13C and δ15N among different organs within one plant species were examined using one-way ANOVA. Differences in δ13C and δ15N values between any two organs were examined using post hoc multiple comparison (LSD). Differences in δ13C and δ15N among species co-occurring in P1.1 and P1.2 in the Nardus heathland were examined using one-way ANOVA. Differences among mean values of foliar δ13C and δ15N of species in Cyperaceae (C. sempervirens, C. curvula), Juncaceae (L. lutea) and Fabaceae (T. alpinum) and species of other families co-occurring in P1.1 and P1.2 were examined using the Independent Samples Test. Difference in mean amplitude of δ13C and δ15N values for all examined species between P1.1 and P1.2 was examined using the Independent Samples Test. Difference in mean values of foliar δ13C and δ15N for the sampling sites at the six permanent plots, and among the 8 or 11 sites sampled along the transect, were examined using one-way ANOVA. The difference in foliar δ13C and δ15N between any two sites of the transect was examined using post hoc multiple comparison (LSD). For comparing differences in values of foliar δ13C and δ15N of non-N2-fixing species near and away from legumes (T. alpinum), data of foliar δ15N and δ13C in three individuals of each non-N2-fixing species was averaged for both positions and tested using the Independent Samples Test. Data for bulk community dry matter and each depth of the soil profile from different permanent plots but belonging to the same type of plant community were combined because signals between the two samples within a plot varied similarly than among plots yielding four replicates per habitat type. Then differences in bulk community dry matter were examined across the three types of communities using one-way ANOVA. Differences in δ13C and δ15N values of bulk green biomass and means for all species studied individually either with or without legumes in each plant community were examined using one-way ANOVA and post hoc multiple comparison (LSD). Differences in soil δ13C and δ15N were examined across the three plant community types and the different soil depths using the general linear model (GLM) procedure. These analyses were done using the SPSS package (Version 20, SPSS, Chicago).
Results
Intra-Plant (Tissue) Variation in δ13C and δ15N
Overall, no statistically significant organ effect on δ13C was found in C. foetida (p = 0.26) and C. sempervirens (p = 0.48), although, some post hoc pairwise tests for individual organ types showed a difference in C. foetida (Figure 2). However, the organ effect on δ13C was significant in N. stricta (p < 0.001), and marginally significant in T. alpinum (p = 0.07), with fruits, seeds, roots, and flowering stalks generally less negative than green foliage (Figure 2). No statistically significant organ effect in δ15N was found in the four studied plant species, but again, pairwise tests revealed some significant contrasts (Figure 2). For δ15N, there was a trend for roots being different from the rest, but with no clear direction (and no such trend in Trifolium). The range among different means for different organs in the same species varied from 0.5 to 2.5‰ in δ13C, and from 2 to 4.5‰ in δ15N, hence can be substantial, and for each species, the difference in δ15N between green leaves and other organs was wider than in δ13C (Figure 2). In the following we will report green leaf data only.
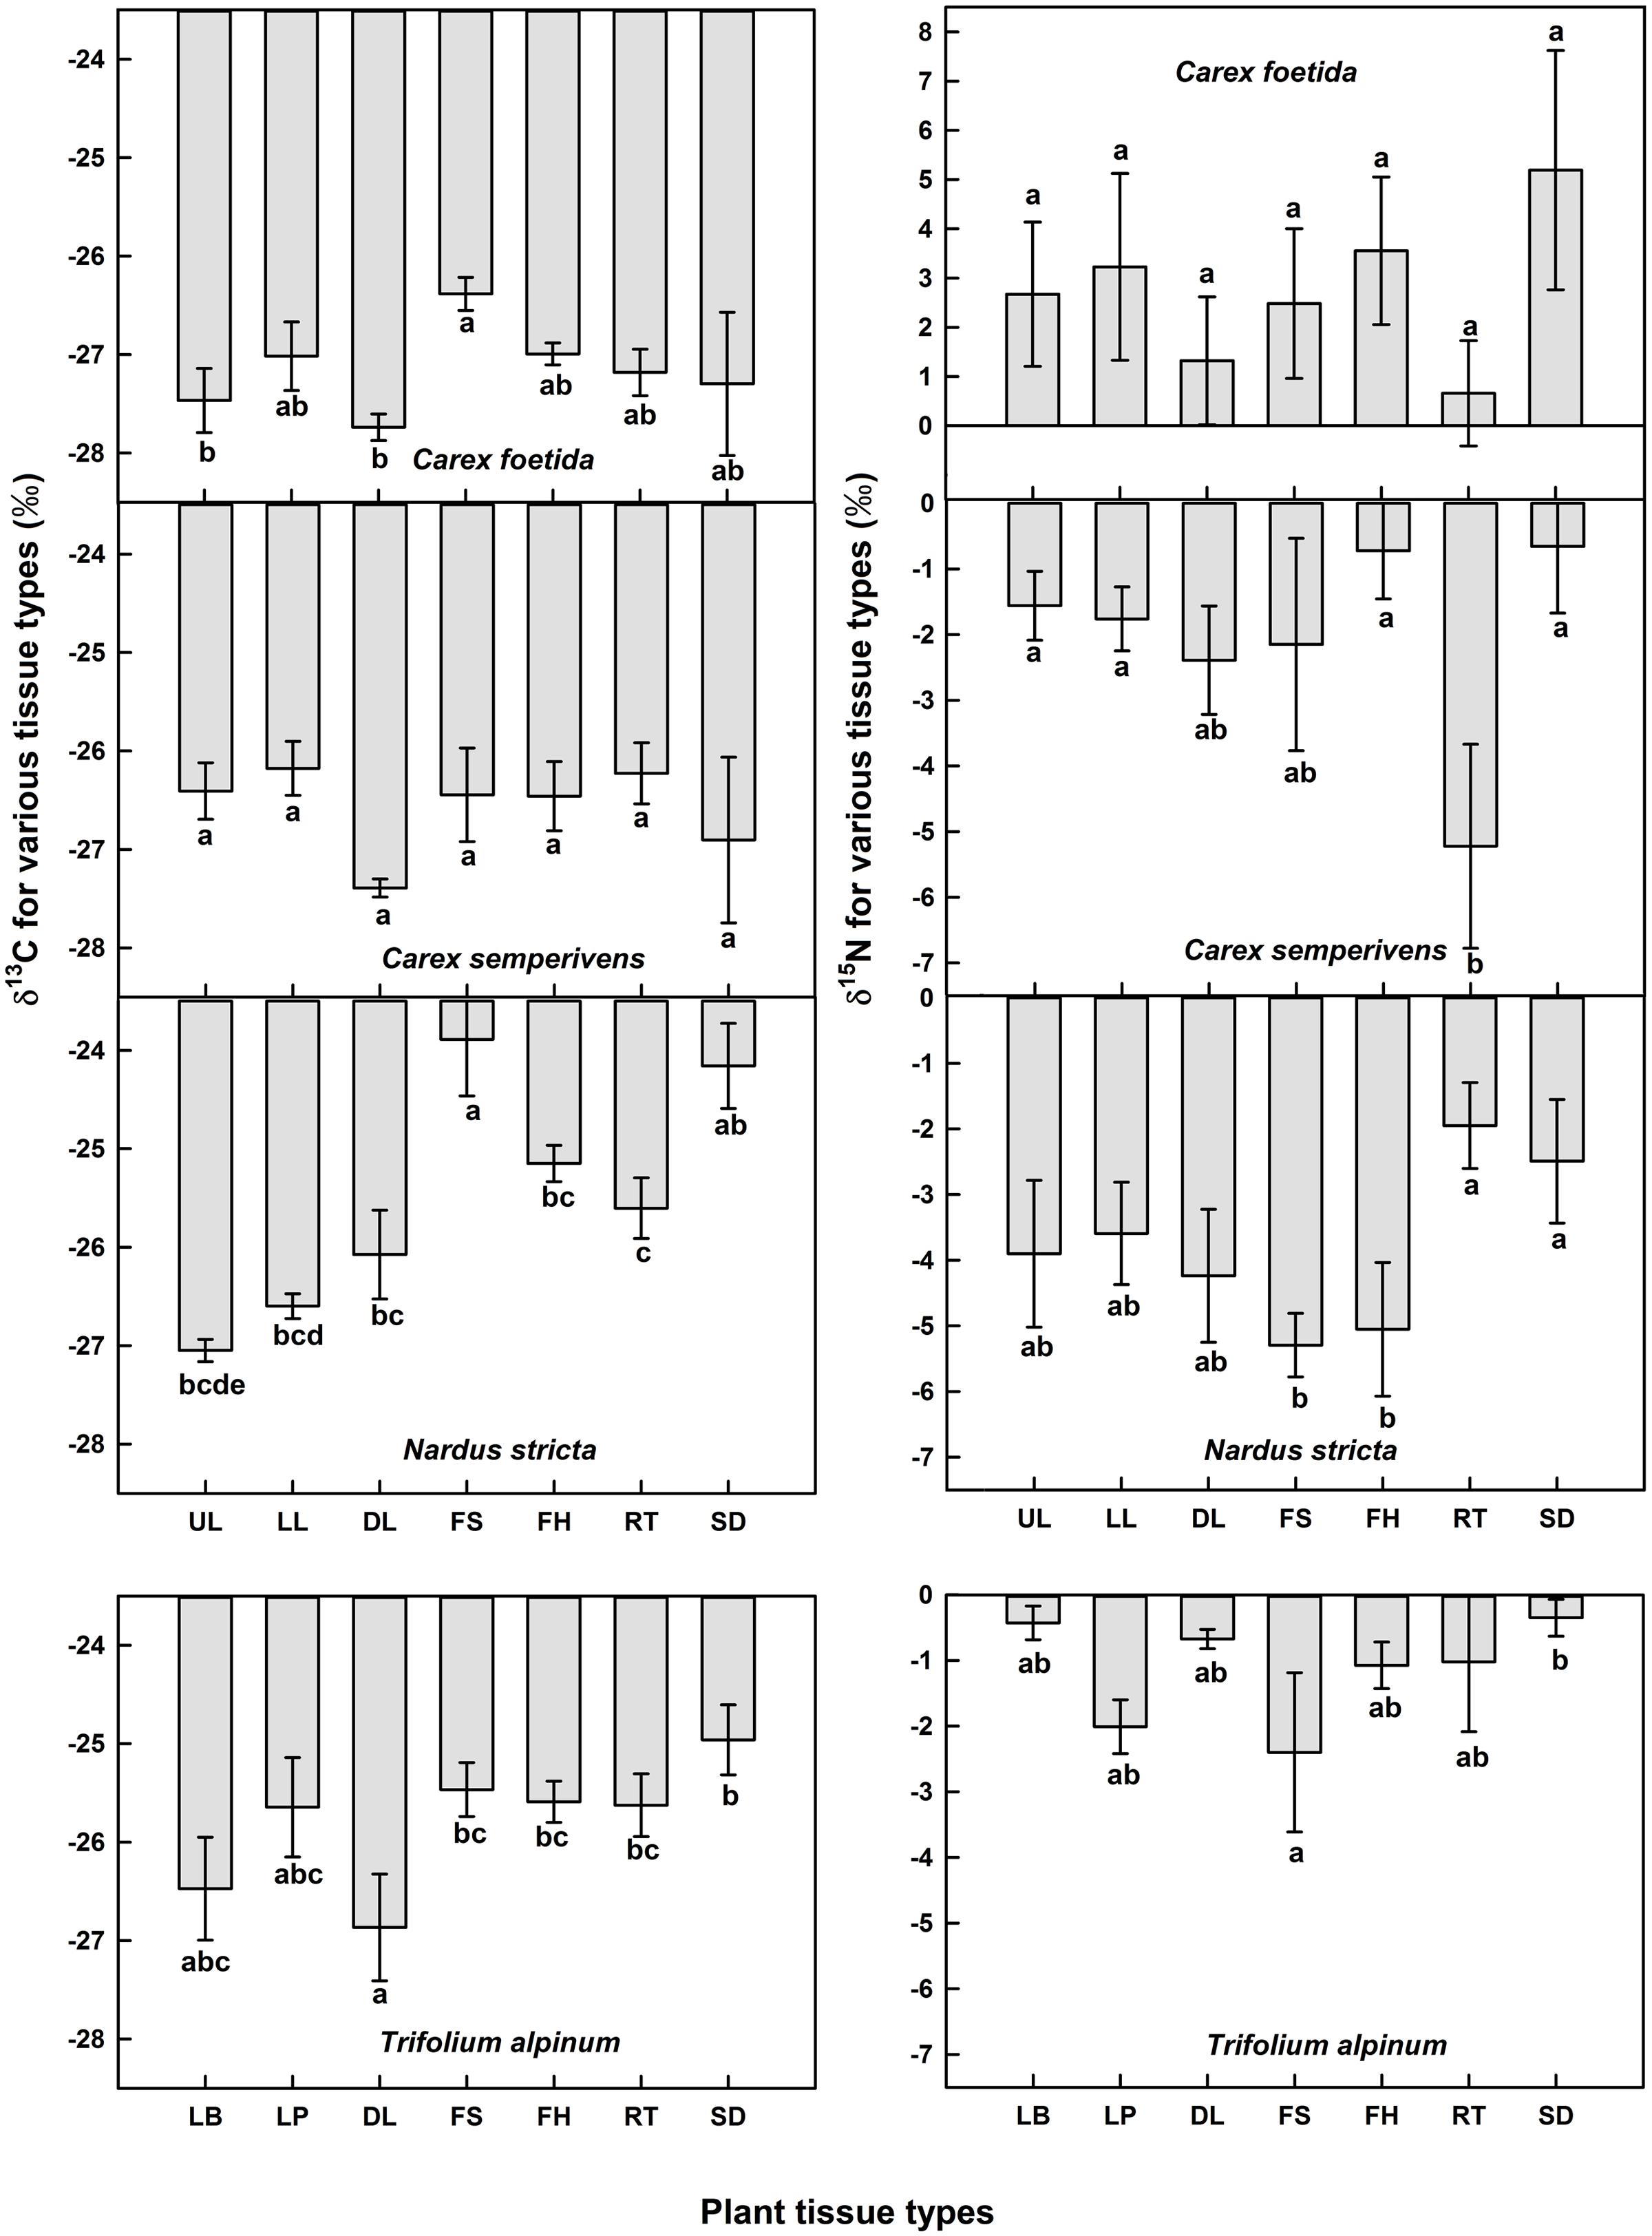
FIGURE 2. Means of δ13C and δ15N signals in different organs in Carex foetida, C. semperivens, Nardus stricta, and Trifolium alpinum (mean ± SE, n = 3 individuals). UL, upper leaf parts; LL, lower leaf parts; DL, dead leaves; FS, flowering stalks; FH, fruit heads; RT, roots; SD, seeds. For T. alpinum, LB, leaf blades; LP, leaf petioles. Bars with different letters indicate significantly different means (p < 0.05, pairwise post hoc t-test).
Local Intra-Specific (Individualistic) Variation in Foliar δ13C and δ15N
In green leaves of 7–9 species, there was a consistent intra-specific variation in δ13C of ca. 1.0‰ among three individuals grown next to each other (Figure 3). That variation was consistent across two different test sites (P1.1 and P1.2) in the Nardus heathland. The single highest deviation in δ13C signals among the three tested individuals per location was 1.6 and 1.5‰, with a mean range size (amplitude) for all examined species of 1.1 and 0.9‰ for P1.1 and P1.2, respectively. In δ15N signals, consistent across sites, one individual may differ from another one sampled at the same location (separated by a few centimeters) by up to 1.5 and 2.1‰, with a mean amplitude among three individuals of 1.1 and 1.3‰ for P1.1 and P1.2, respectively (Figure 3). However, no significant difference was found in mean amplitude of δ13C and δ15N values for all examined species between P1.1 and P1.2.
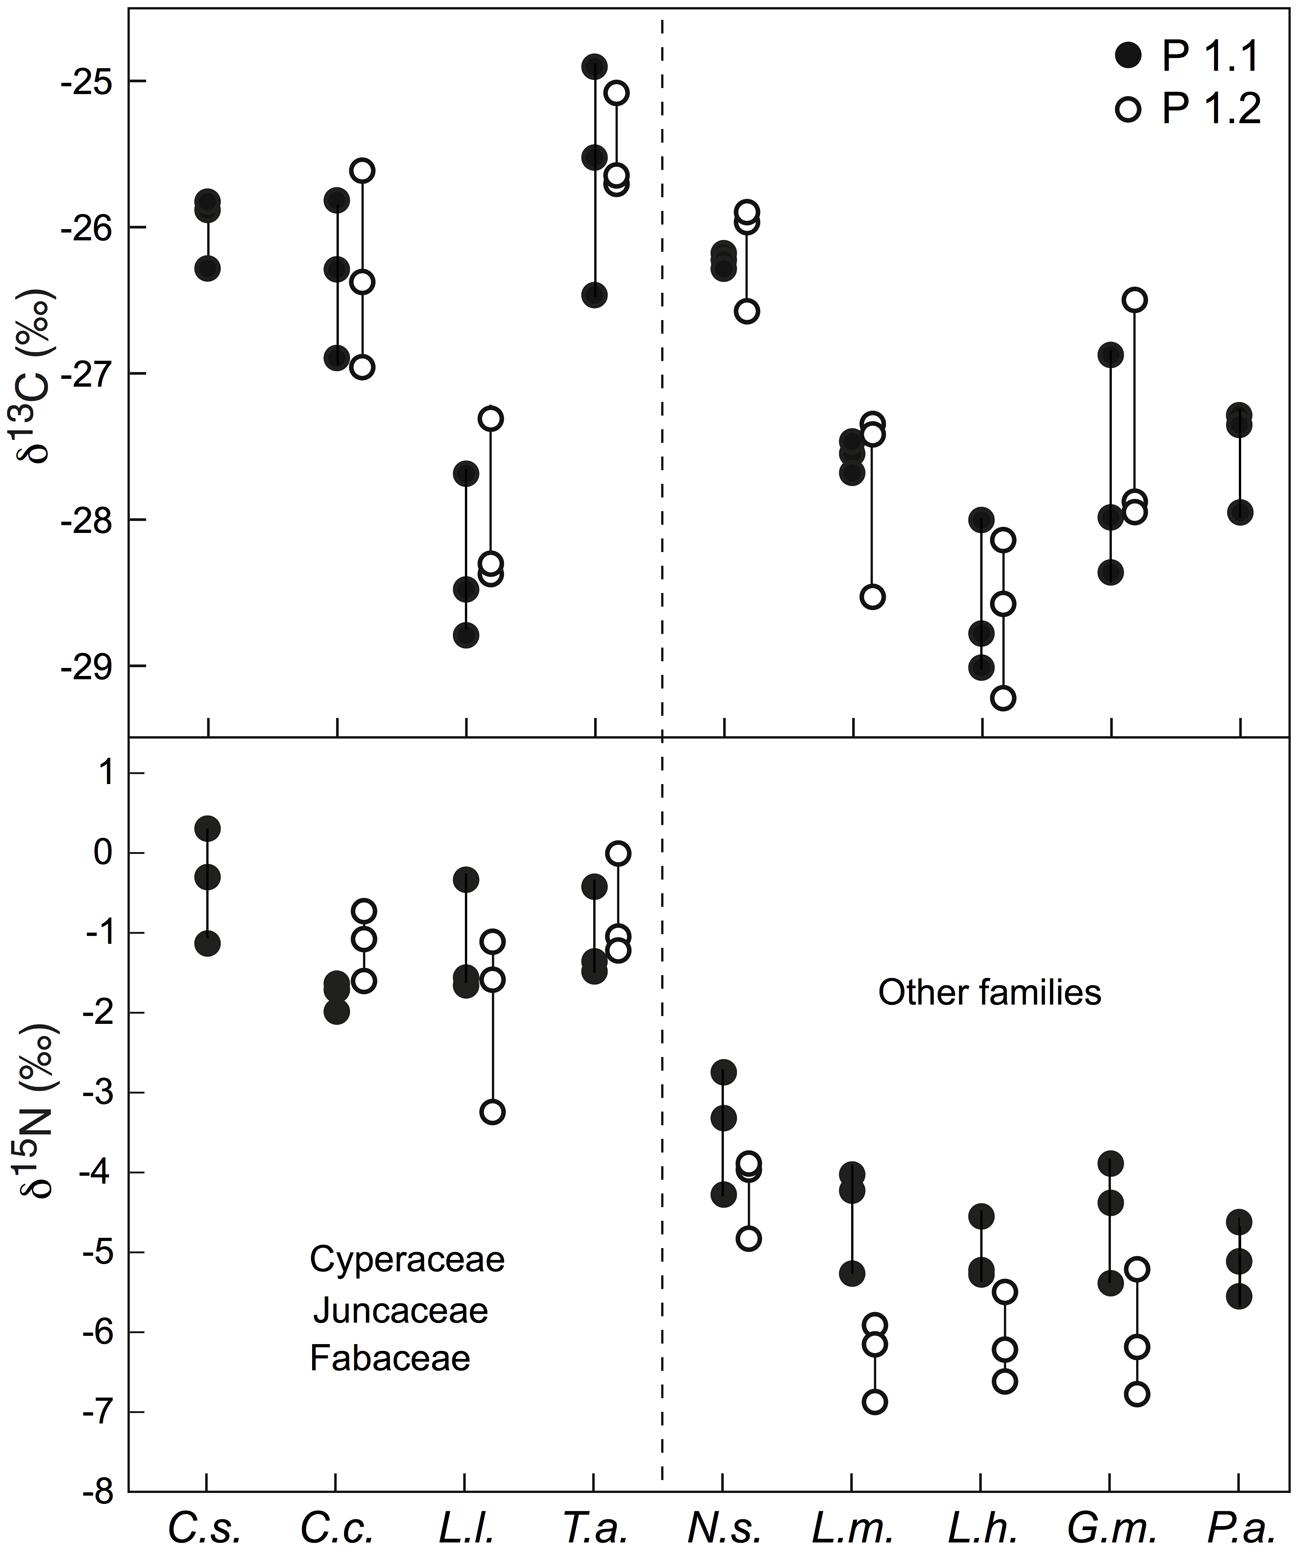
FIGURE 3. Intra-specific variation in δ13C and δ15N among three individuals growing next to each other for nine or seven species sampled at two sites (P1.1 and P1.2). Each point represents a mixed signal from several leaves for one individual. The species effect across this set of species (based on values for three individuals per species) was significant in both plots at p < 0.01 for both δ13C and δ15N. Cs, Carex sempervirens; Cc, Carex curvula; Ll, Luzula lutea; Ta, Trifolium alpinum; Ns, Nardus stricta; Lm, Ligusticum mutellina; Lh, Leontodon helveticus; Gm, Geum montanum; Pa, Potentilla aurea.
Intra-Specific Variation of δ13C and δ15N Across Different Sites
No significant difference in foliar δ13C and δ15N was found across all 11 sites where the four species P. alpina, Geum montanum, Homogyne alpina, and L. lutea jointly occurred (mean for five individuals per site; Figure 4). When site effects were tested site by site, foliar δ13C at site S11 (a steep meadow close to a glacier fore-field) showed significantly (or marginally significantly) less negative signals than site S1, S2, and S3 (Figure 4). Additionally, foliar δ13C at site S5 were marginally less negative than foliar δ13C at site S3. Also foliar δ15N made site S11 special, as leaves had significantly (marginally significantly) more negative δ15N than these collected in sites S2, S3, S4, and S6 (Figure 4). Similarly, no overall differences in species-specific foliar δ13C and δ15N were found across those eight sites where the same six species co-occurred (i.e., P. alpina, G. montanum, H. alpinum, L. lutea, T. alpinum, C. semperivens). Tested site-by-site, similar differences emerged as for the four-species-comparison reported above.
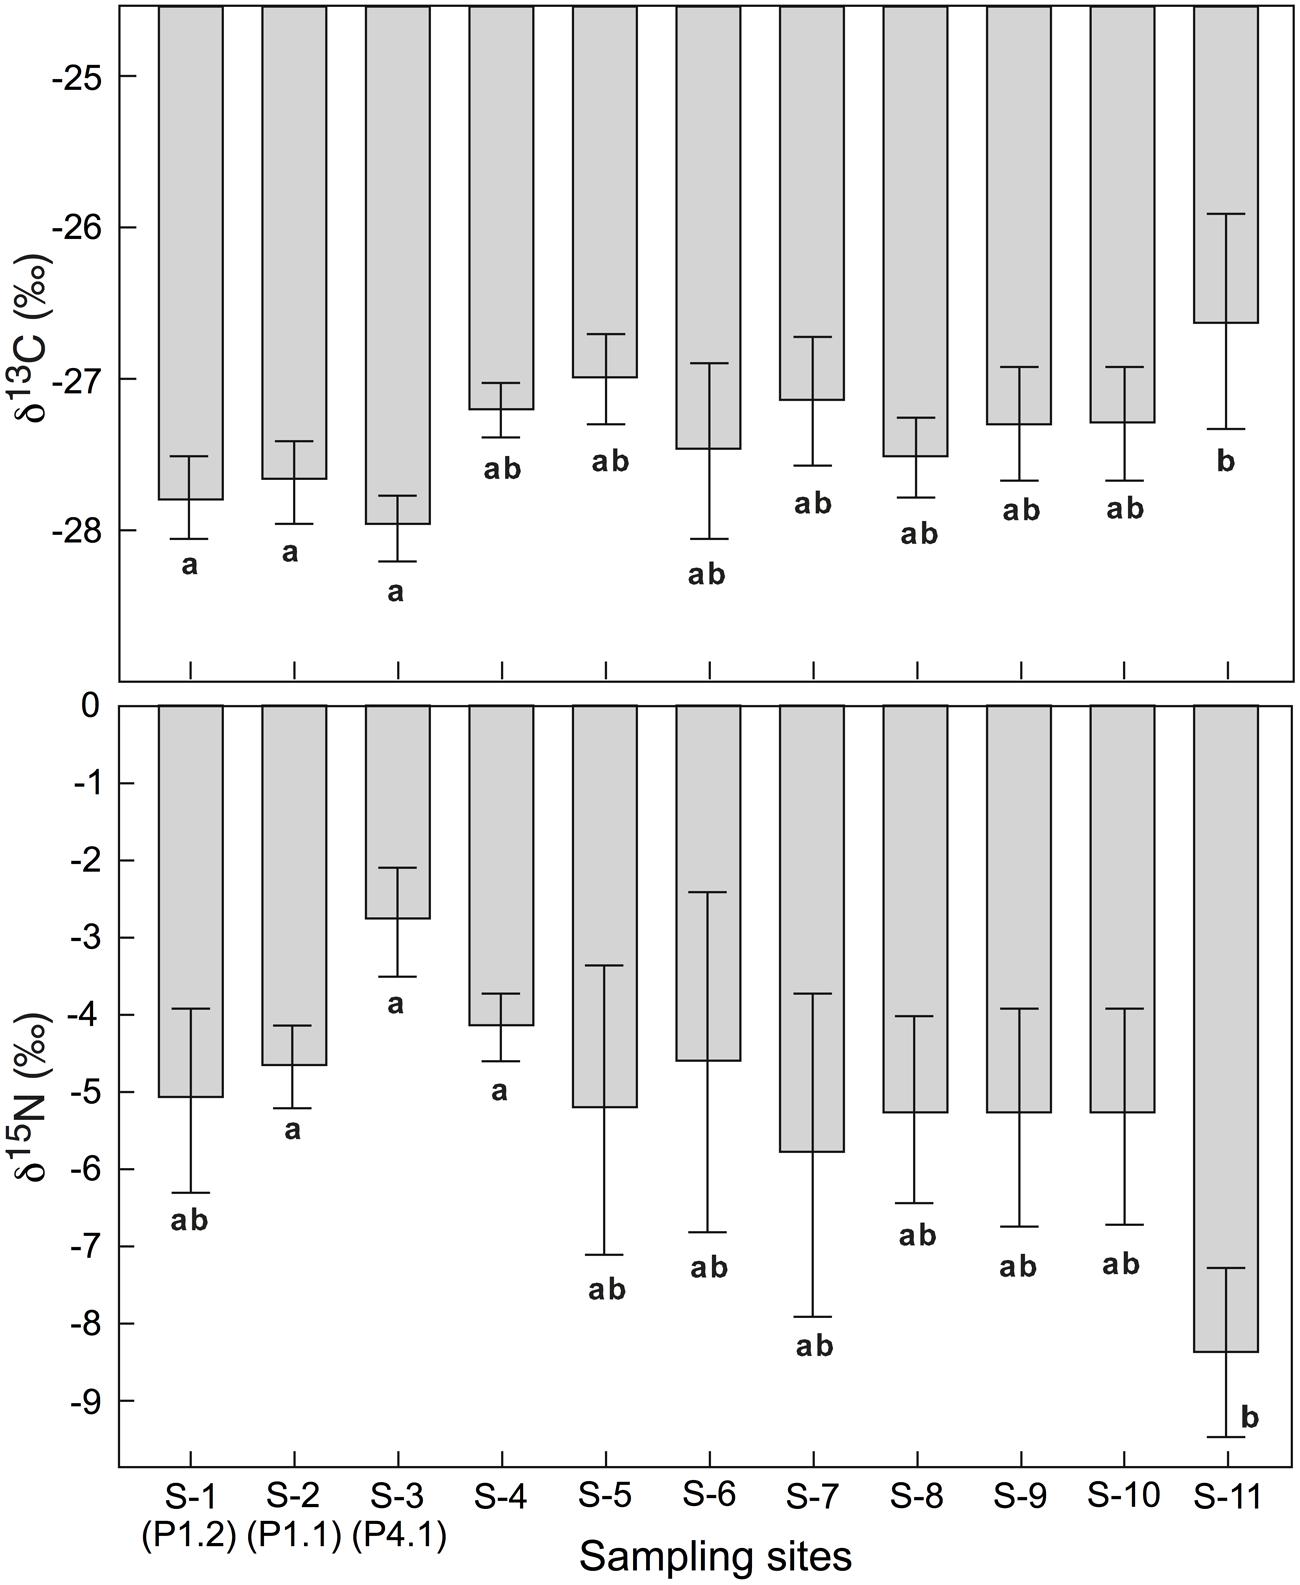
FIGURE 4. Means of foliar δ13C and δ15N for four co-occurring alpine plant species in all 11 sites (mean ± SE). There was no overall site effect across all sites. But means for some individual sites differed (different letters indicate significant differences at p < 0.05).
In δ13C, Trifolium and Carex were consistently less negative than Geum, Poa, and Luzula, with Homogyne, in contrast, changing from -29‰ at S1 to -25‰ at S11 (Figure 5). In δ15N, Trifolium, Carex, and Luzula were consistently less negative than Geum, Poa, and Homogyne. However, the difference from one location to the other may reach 2.7‰ (3.8‰ in Homogyne) in these species, except for Trifolium and Luzula, which hardly varied (Figure 5). Disregarding Homogyne, the mean site to site variation in the remaining four species was >0.5 and <1‰, with most of the variance produced by site 11 (mean ± SD of five individuals for the eight sites for each species, Carex -0.4 ± 3.0‰; Trifolium 1.6 ± 0.9‰; Luzula -2.6 ± 1.4‰; Poa -3.8 ± 2.1‰; Geum -6.7 ± 2.4‰; Homogyne -6.5 ± 2.2‰). Similarly, four out of the seven species co-occurring in both sampling plots in the Nardus heathland showed significant (or marginally significant) differences in δ15N between P1.1 and P1.2 (C. curvula: t = -2.325, p = 0.081; Ligusticum mutellina: t = 3.373, p < 0.05; Leontodon helveticus: t = 2.724, p = 0.053; G. montanum: t = 2.367, p = 0.077). However, no difference was found in foliar δ13C between P1.1 and P1.2. Therefore, the intra-specific amplitude of changes between locations (P1.1 and P1.2) was wider for foliar δ15N than for foliar δ13C, in particular for species classified as ‘other families’ (Figure 3).
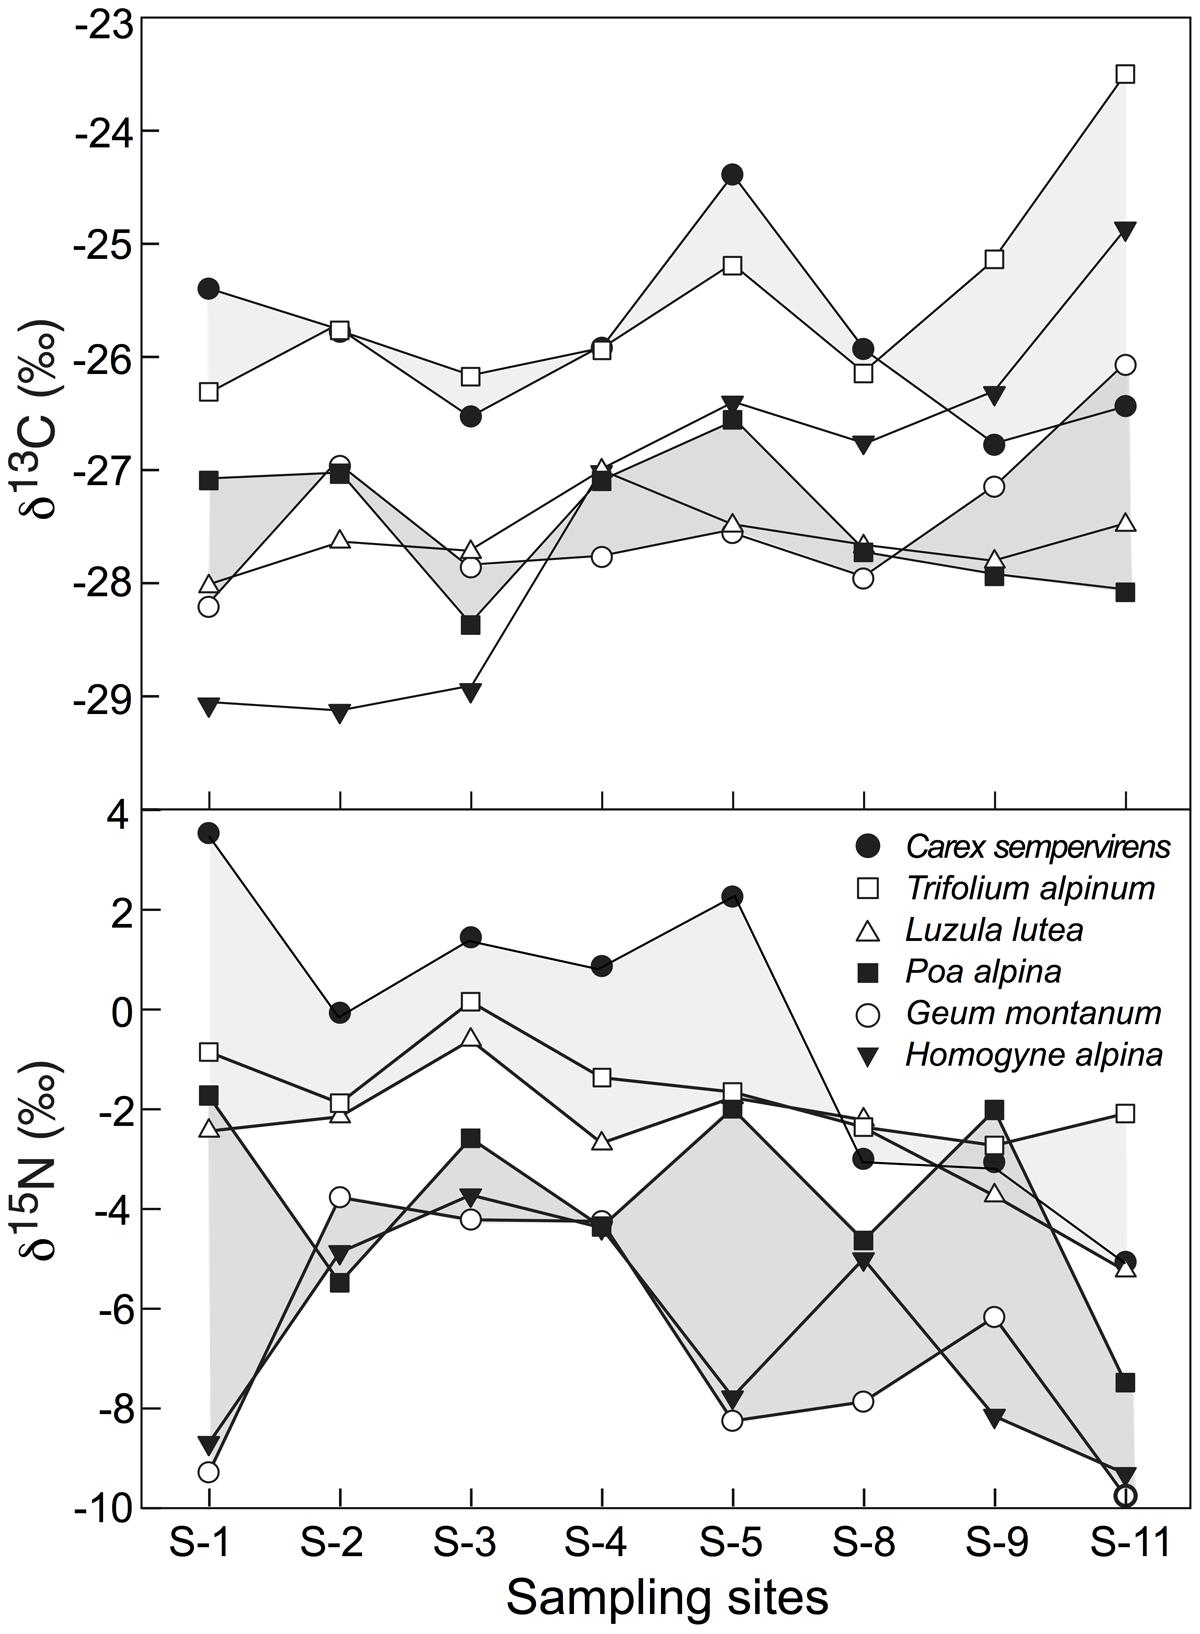
FIGURE 5. Inter-specific variation in foliar δ13C and δ15N in six alpine species common to eight sites spread over a 2 km transect at c. 2430–2500 m elevation (Figure 1), with each point representing the pooled signal for several leaves sampled from 5 individuals per species and site. Shades are visualizing distinct high or low signal groups, with δ13C in Homogyne not matching any group.
Inter-Specific Variation in Foliar δ13C and δ15N
Overall, the δ13C values of co-occurring species in the three alpine plant communities tested varied from -25.5‰ to -29.5‰, with mean signal ranges per community of around 3.2, 3.8, and 4.4‰ for the Nardus-rich heathland (plots P1.1 and P1.2), the F. violacea meadow (plots P4.1 and P4.2) and the snow-bed community (plot P8.1 and P8.2), respectively (Figure 6). Variation in δ15N within each community was even wider (Figure 6). In alpine Nardus-rich heathland, the δ15N values ranged from 1.4‰ (T. alpinum) to -6.9‰ (Leucanthemum alpina), a range of 8.3‰. After excluding data of Trifolium, sedges and rushes, the δ15N value of co-occurring species in this plant community still ranged from about -6.9 to -0.6‰. For the F. violacea rich meadows, the amplitude covered a range in δ15N of 7.3‰ irrespective of whether data of Trifolium, sedges and rushes were excluded or not. For the snow-bed community, the amplitude was similar at 7‰ (6‰ when data of Trifolium, sedges and rushes were excluded). The δ15N values of most forbs and grasses were lower (more negative) and varied more widely than those in sedges (C. curvula, C. foetida, C. sempervirens), rushes (Juncus trifidus, L. lutea), and legumes (T. alpinum, T. thalii; Figure 6). Similarly, significant differences in δ13C and δ15N were found among species occurring in both Nardus heathland plots (p < 0.001 for both isotopes), with higher mean values of δ13C and δ15N in Cyperaceae (C. sempervirens, C. curvula), Juncaceae (L. lutea), and Fabaceae (T. alpinum) than species in other families (p < 0.001 for δ13C both plots; p < 0.001 in P1.1 and p = 0.086 in P1.2 for δ15N; Figure 3).
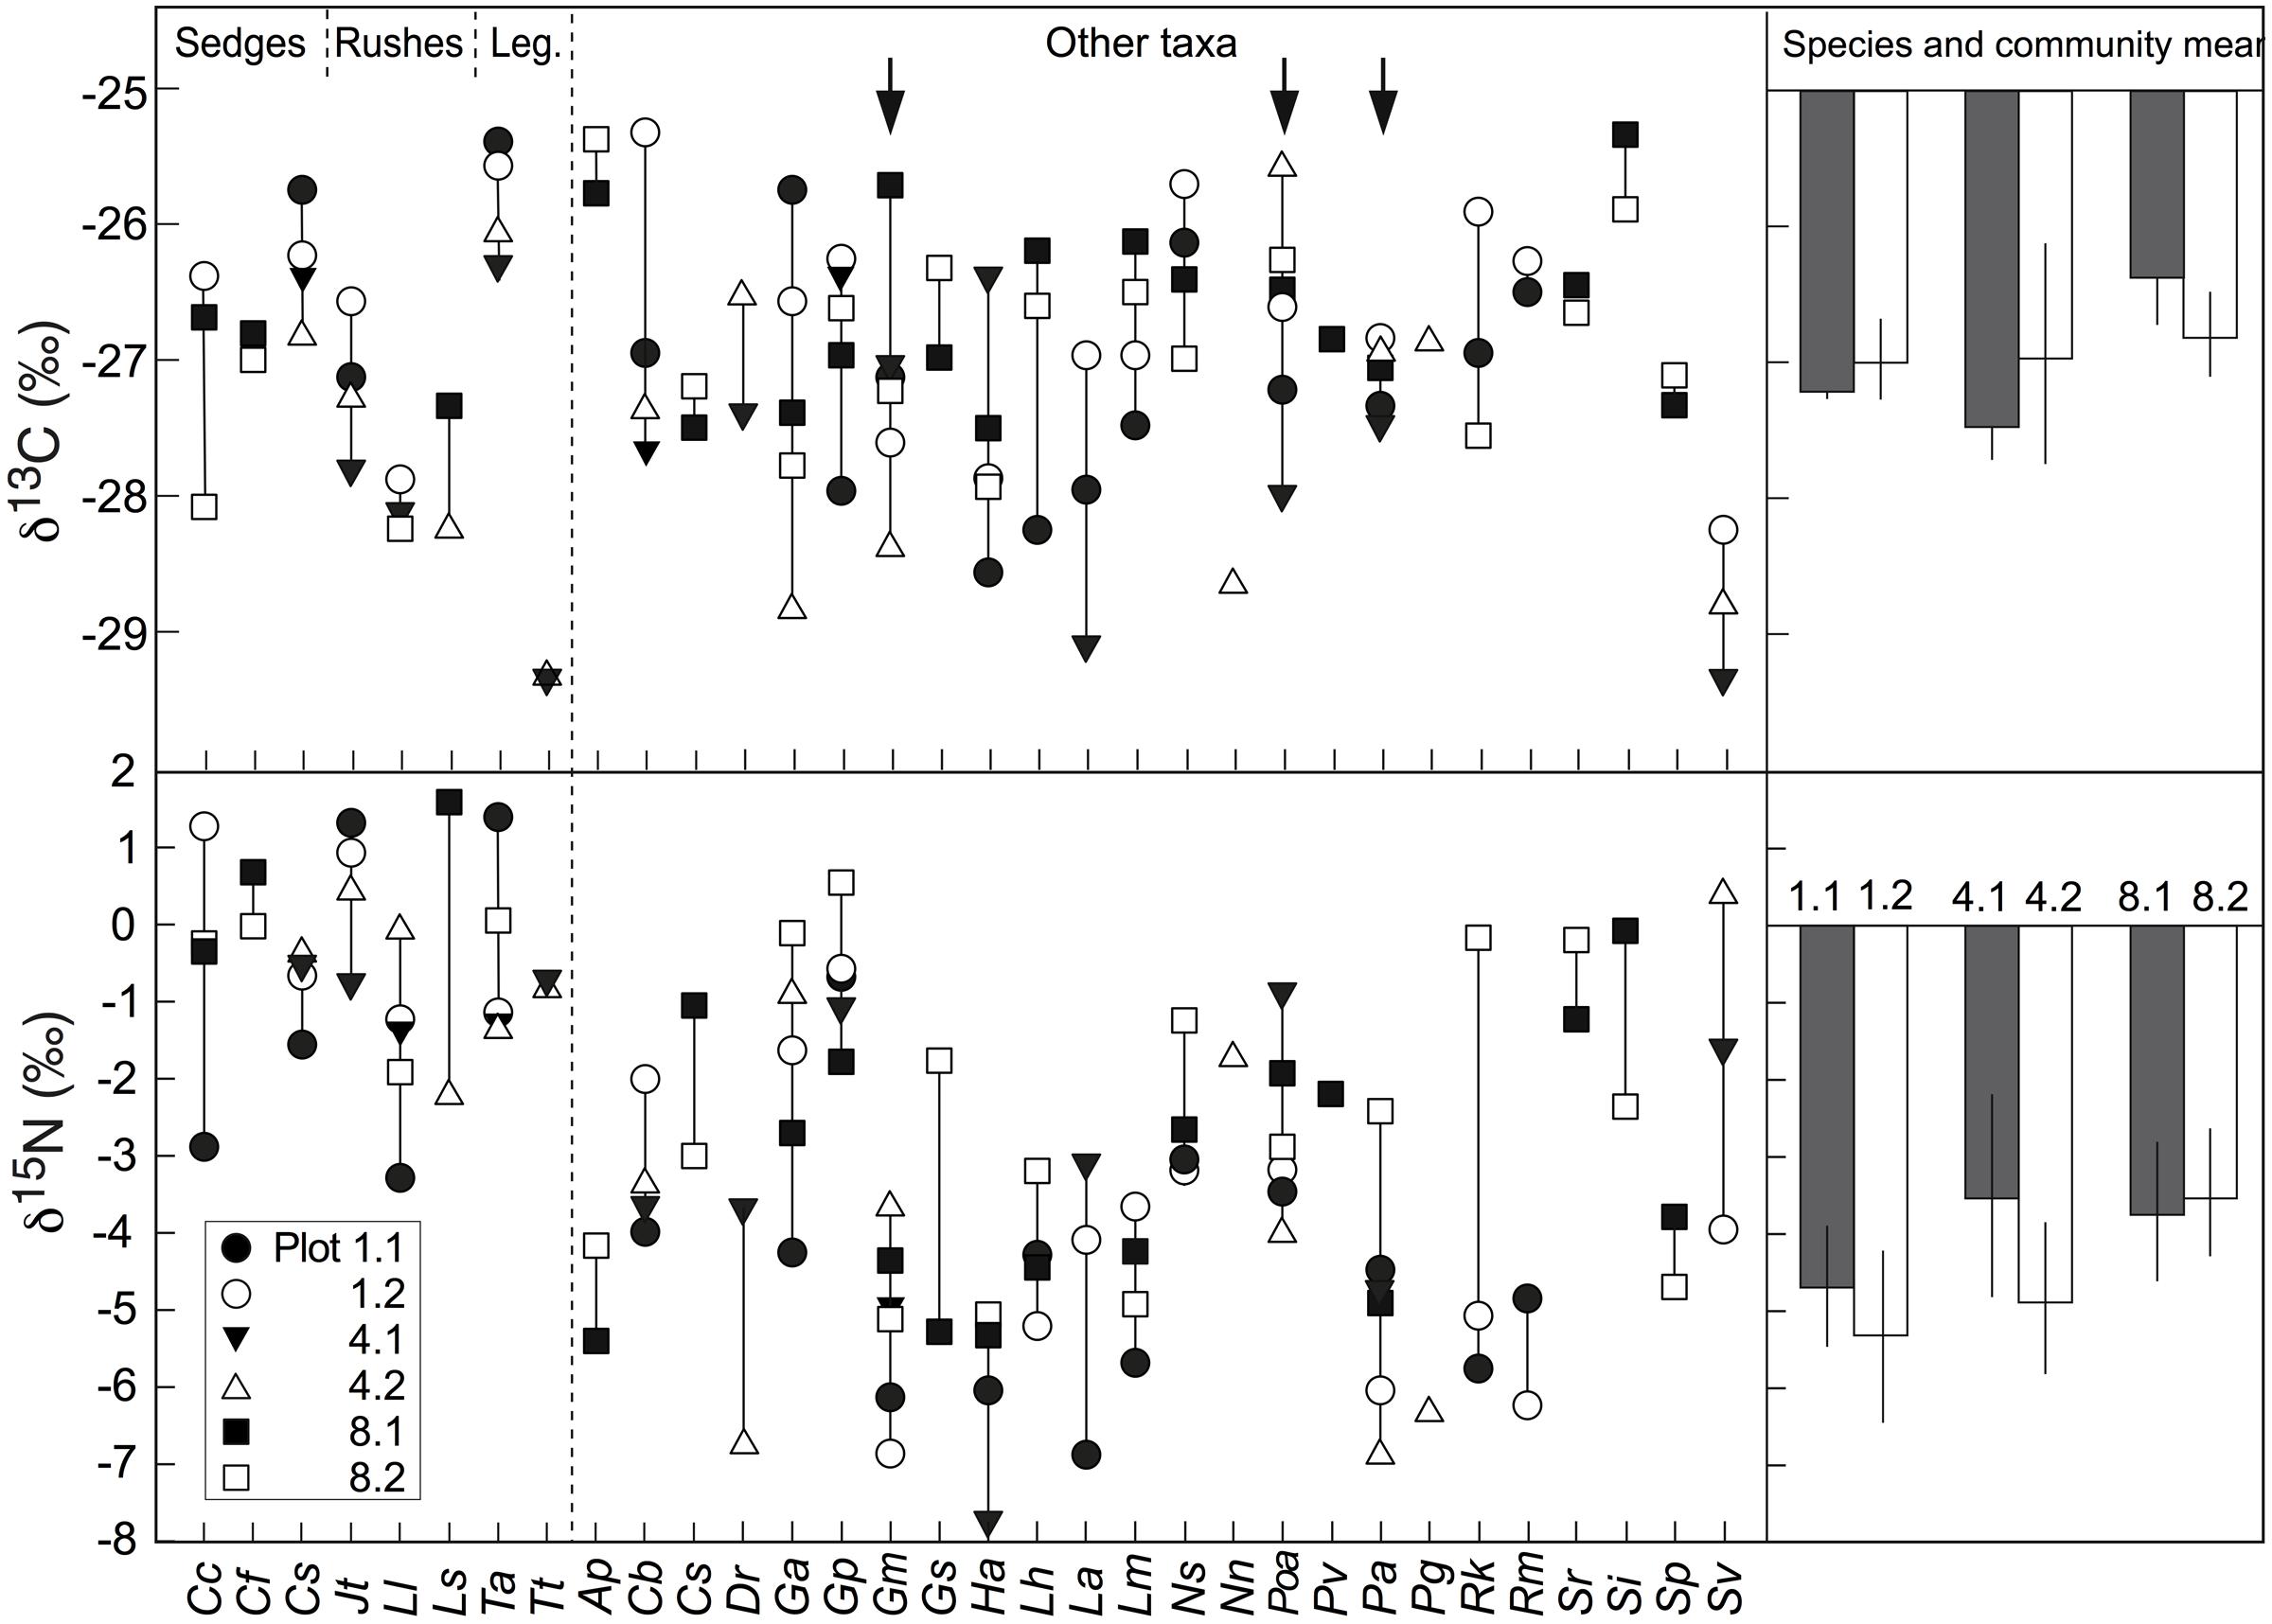
FIGURE 6. Left: interspecific variation in the natural abundance of δ13C and δ15N signals in alpine plant species from six different plant communities (five individuals per species and plot). Arrows indicate three species that occurred at all six permanent plots. Sedges include: Cc, Carex curvula; Cf, Carex foetida and Cs, Carex sempervirens; Rushes include: Jt, Juncus trifidus; Ll; Luzula lutea and LS, Luzula sudetica; Legumes include: Ta, Trifolium alpinum and Tt, Trifolium thalii (see Supplementary Table S2 for the full name of the rest plant species collected in each plot); Right: means of δ13C and δ15N in three species occurred at all six permanent plots (mean ± SE, n = 3 species). Bars with different color means different plots. None of the means of δ13C and δ15N differed significantly among the six plots (p > 0.6).
Of the forbs, three species (G. montanum, P. alpina, Potentilla aurea) were studied in all six permanent plots and did not reveal any spatial pattern of δ13C and δ15N, but as a group, the three species were significantly different in their δ15N signature from either Trifolium or sedges/rushes and the combined legume/sedge/rush signal obtained from the same sampling locations. No significant differences in δ13C and δ15N were observed across all six plots and communities co-composed by these three species (Figure 6).
The foliar δ15N and %N were not correlated (r2 = 0.011, p = 0.297) when compared across all sites and species. However, these two parameters were marginally correlated when data of Trifolium, sedges and rushes were removed from the analysis (r2 = 0.050, p = 0.051).
Effect of Legume Neighborhood on Foliar δ15N
δ15N for 6–8 species either growing next to or away from T. alpinum showed no significant difference (-3.24‰ with and -3.95‰ without Trifolium at plot P1.1 and -4.30‰ with and -3.18‰ without Trifolium at plot P1.2; Supplementary Table S3). The results did not differ when δ15N values of sedges (C. curvula and C. sempervirens) and the rush (L. lutea) were removed from the data set (Supplementary Table S3).
Signals in Bulk Plant Dry Matter in Different Plant Communities
No significant difference was found in δ13C and δ15N between live (green) plant material (biomass), necromass and litter across the three studied plant communities (Figure 7). When samples in bulk green biomass were compared with the unweighted (disregarding species abundance) mean of the species sampled in each community for δ13C and δ15N (Figure 6), either with or without legumes in each studied community, no significant difference in δ13C among communities was found (Figure 7). However, δ15N in bulk biomass was 2–3‰ more negative than the corresponding means calculated from the species data (Figure 7), indicating that species with more negative δ15N contributed over-proportionally to total biomass (e.g., grasses and snowbed herbs, all operating at quite negative δ15N).
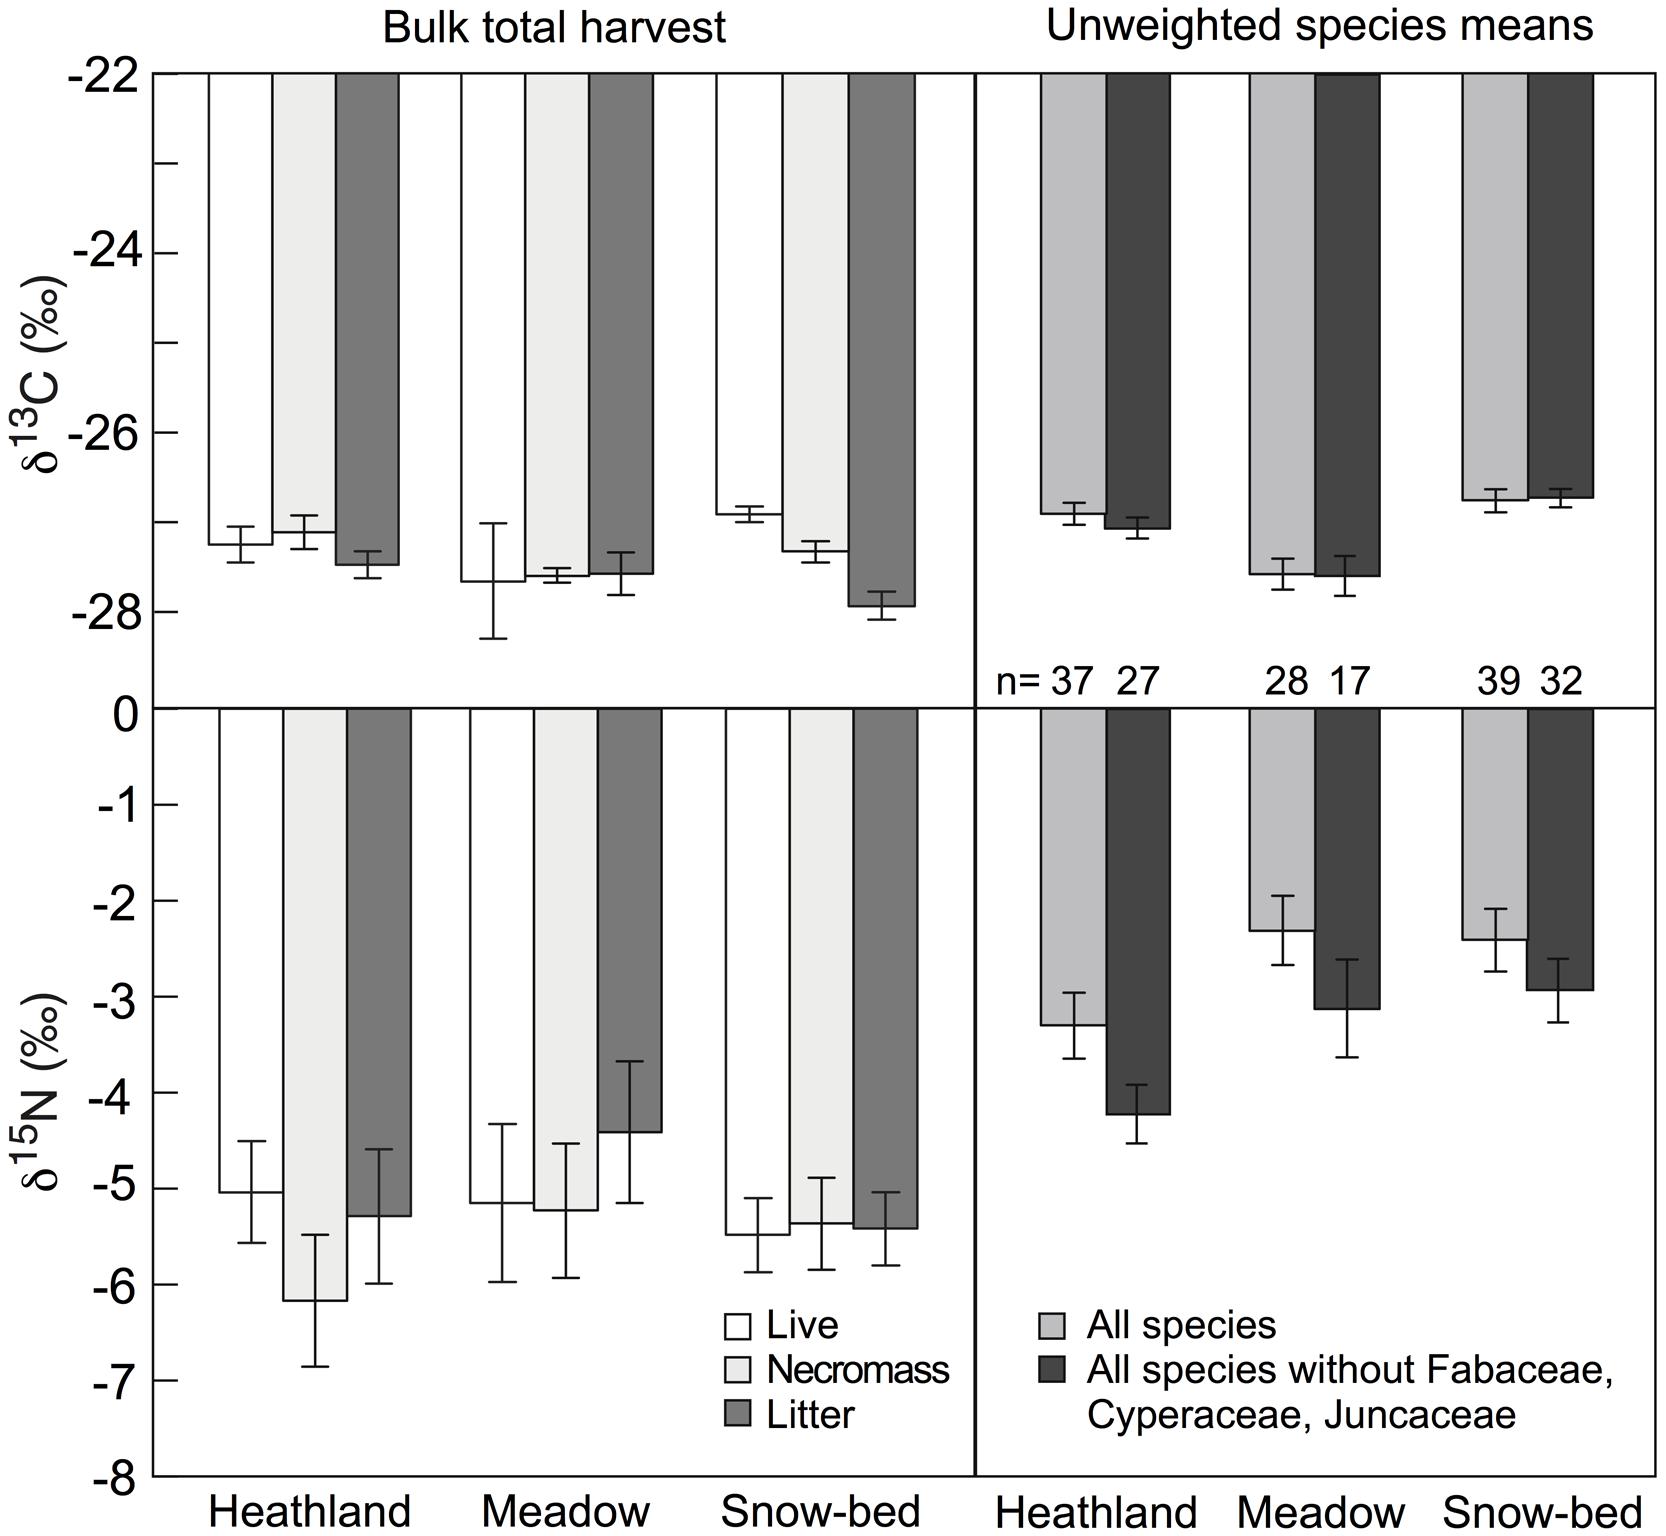
FIGURE 7. Left: means of δ13C and δ15N signals in different types of bulk plant dry matter fractions in Nardus heath, Festuca meadow, and snow-bed communities (mean ± SE, n = 4 harvested sub-plots per community type). None of the means of δ13C (live: F = 0.9, p = 0.427; necromass: F = 3.1, p = 0.095; litter; F = 1.6, p = 0.246) and δ15N (live: F = 0.1, p = 0.866; necromass: F = 0.6, p = 0.547; litter: F = 0.7, P = 0.5) differed significantly from each other. Right: means of δ13C and δ15N in green leaves for all species studied individually (see Figure 6), with (gray) and without (black) Fabaceae, Cyperaceae, and Juncaceae (the individual signal is for one species, so the replicated unit is the species in this case).
Soils Under Different Plant Communities
The δ13C signal in soil organic carbon showed significantly higher (less negative) values than the bulk litter fraction in the heathland (p < 0.001), the meadow (p = 0.001) and the snowbed (p = 0.017) communities, thus did not mirror the mean litter signal. There was no significant effect of soil depth on δ13C (Figure 8). Also soil δ15N was much higher than the values for most plant species’ tissue and for bulk dry matter of each plot studied. In contrast to δ13C, δ15N increased significantly with soil depth at all sites (Figure 8, with a vertical range of about 4‰, offering a wide spectrum of isotopically different soil N sources for different plant species). Overall, no difference in soil δ15N was found across the three types of plant communities. However, the soil δ15N in the heath community (plots P1.1 and P1.2) was marginally higher than that in the meadow community (plot P4.1 and P4.2; p = 0.051).
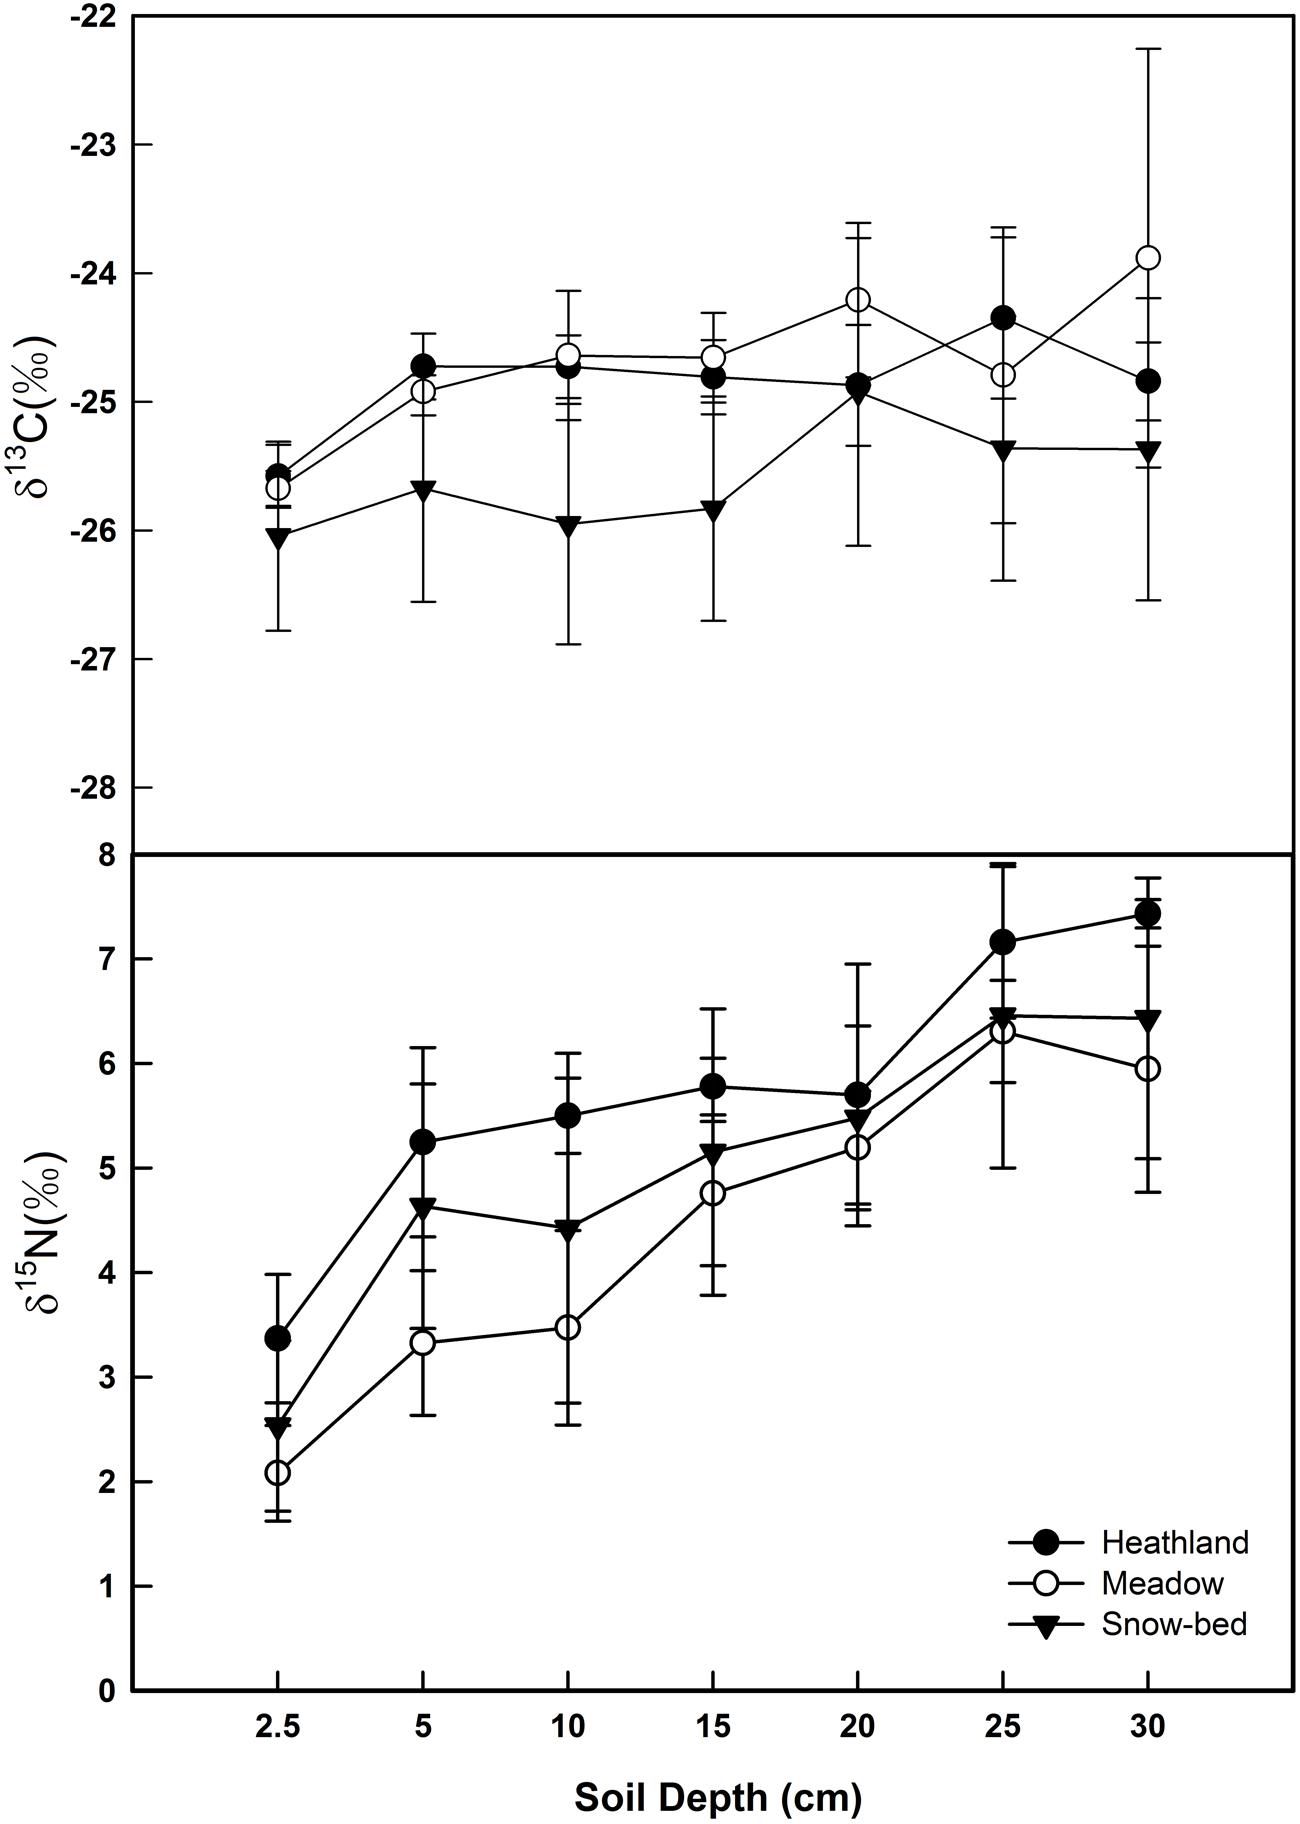
FIGURE 8. Soil profiles of δ13C and δ15N in the three alpine plant communities (mean ± SE, n = 4 soil samples per community type). While no significant effects of soil depth on δ13C, δ15N increased significantly with soil depth (p < 0.001).
Discussion
To our knowledge, no systematic study has been conducted in alpine terrain to separate environmental from phylogenetic C and N stable isotope signals of plant species. In order to explain phenotypic signals, we examined δ13C and δ15N in plants in three different plant communities and in a number of different habitats related to topography in the central Alps. By examining δ13C and δ15N values in different tissue types as well as bulk community biomass, we were able to illustrate the full spectrum of sources of isotopic variation. Since we conducted this survey in an alpine landscape on well developed soils with no biologically relevant variation in moisture availability, the substantial signal variation at all organizational levels, except the ecosystem/community level, came at a surprise.
Overall, the mean intra-species variation in δ13C of ca. 1.1‰ (extreme 1.6‰) and the mean variation among tissue types of ca. 1.2‰ (extreme 3.2‰), together exert a largely unexplained ‘noise’ that calls for broad and highly replicated sampling for obtaining a species-specific and/or habitat-specific, representative signal. The intraspecific variation in δ15N was almost twice as large as that in δ13C. The δ13C and δ15N signals in the species examined, varied strongly among all plant families, and inconsistently with sampling location, but the rank order among species was retained across sites with only few exceptions (i.e., was predominantly genotypic). In the following we will discuss the intra- and inter-specific variation in isotope signals in this alpine environment.
Intra-Plant, Tissue-Specific Signals
At intra-plant level, two (Nardus stricta and Trifolium alpinum) out of the four species explored for all major tissue (organ) types showed significant variation in δ13C values across different organs (mostly around 1‰). Substantial variation in δ13C in different parts of plants was reported in previous studies (O’Leary, 1981; Yoneyama and Ohtani, 1983; Saranga et al., 1999; Chevillat et al., 2005). Hence, uncontrolled tissue type would add up to 1.0–3.0‰ of deviation from means for different organs in C. sempervirens and N. stricta. For N. stricta and T. alpinum, less negative δ13C values in stalks, seeds, fruit heads and roots compared to green leaves match the trends compiled for non-leaf tissue (O’Leary, 1981). The enrichment of δ13C in roots relative to foliage suggests an isotopic fractionation between foliage and roots (Hobbie et al., 2002). In legumes, CO2 fixation driven by PEP carboxylase in active nodules, roots, seeds, and other tissue (Coker and Schubert, 1981) may lead to the less negative δ13C values. However, we have no good explanation for the δ13C enrichment of autotrophic versus heterotrophic tissues in N. stricta. Perhaps, this is related to the seasonal timing of the respective C uptake or to specific turnover of reserves. Similarly, δ15N varied substantially among the tissues of the tested plant individuals, mostly by >2‰. Such tissue-specific differences in δ15N and the often diverging signals in roots have been reported before by Evans (2001), hence, alpine species make no exception. 15N discrimination during reallocation of N is one plausible explanation (Evans, 2001).
Intra-Specific, Individualistic Signals
The data we presented fall in two categories: individuals sampled at the same spot, often not further apart than a few centimeters, versus groups (means) of five individuals sampled along a several km transect with locations separated by at least 50 m distance. For differences in δ13C between individuals growing next to each other, we have no other explanation than individualistic (genotypic) differences in gas exchange traits, given the consistently high soil moisture and the same climatic conditions. However, for δ15N, the remarkable intra-specific (individualistic) variability may reflect the heterogeneity of substrate and/or rooting patterns, or differences in mycorrhization (Craine et al., 2009). For intra-specific variation across different sites, mixed leaf samples from single plant individuals, growing next to each other may differ in δ13C by as much as different tissues on the same plant do (ca. 1‰) with the variation nearly twice as large in δ15N. Hence, the local plant to plant variation was nearly as high as that among the means for micro-populations of five individuals per site, across the 8–11, widely spaced sites (disregarding Homogyne that varies more with site). Possible causes for the twice as large variation in δ15N among these sites could be different N-availability, uptake of different N forms (i.e., NO3- and NH4+) or mycorrhization (Miller and Bowman, 2002). In habitats where nitrogen is limiting, plants will acquire nitrogen largely from mycorrhizae. Mycorrhization is known to alter plant δ15N (Högberg, 1997; Evans, 2001; Craine et al., 2009).
The exceptional values obtained for the means of five individuals per species on site S11 (a steep mountain pasture) may be related to the frequent presence of sheep (personal observation), with significantly less negative δ13C and more negative δ15N than in all other sites. In montane riparian habitats in the Rocky Mountains, browsing of Salix by elk significantly increased leaf δ13C, perhaps due to the shift in root to shoot ratio (Alstad et al., 1999). In addition, browsing or grazing can also change plant δ13C by affecting per unit leaf area water loss (lower LAI but more intense gas exchange; Kielland and Bryant, 1998). Since carbohydrate reserves tend to be enriched in 13C relative to fresh photo assimilates, their allocation to with-season re-growth after grazing may have contributed to these signals. Also, better N-nutrition might increase the efficiency of C fixation. Similar to our signals, a grazed grassland community in the Yellowstone National Park showed reduced plant δ15N (isotopically lighter soil NO3- may constitute a more important N resource for plants in grazed areas; Frank and Evans, 1997).
Inter-Specific Variation
Inter-specific variation in δ13C (on top of intra-species and tissue-specific variation as discussed above) is very large, causing the actual signals obtained for a given plant community and elevation to strongly depend on the species included, sample replication per species and tissue type. For archive-based assessments of environmental signals for a given type of ecosystem, this requires a multi-species approach (presumably > 30 species) to overcome the random nature of such vouchers with regard to individuals, tissue quality and potential micro-habitat effects.
In this study, the difference in foliar δ13C among co-occurring plant species within each studied community falls in the 2–5‰ range in foliar δ13C for terrestrial plant communities composed of C3 species reported by O’Leary (1981). Given the high rainfall regime and well developed soils at our test sites, all plants were well supplied with moisture. Hence, the differences among species should largely reflect genotypic signals (Dawson et al., 2002). Several genotypic factors such as leaf mesophyll thickness and CO2 uptake efficiency have been related to foliar δ13C through their influence on factors such as leaf boundary layer resistance, diffusive conductance (i.e., stomatal and intercellular resistance) and mesophyll resistance to CO2 uptake (Körner et al., 1988, 1991; Geber and Dawson, 1990; Vitousek et al., 1990).
It is interesting that foliar δ13C in the legume T. alpinum and the sedge C. sempervirens showed consistently higher (less negative) values than the other four species tested across eight sites. Legumes can perform dark fixation of CO2 in root nodules by PEP carboxylase (Coker and Schubert, 1981), which hardly discriminates against 13C (Estep et al., 1978), thus leading to less negative δ13C signal in legumes (Yoneyama and Ohtani, 1983). The high nitrogen concentration may also facilitate higher carboxylation capacity relative to stomatal conductance and may, thus, further contribute to the less negative δ13C signal in Trifolium. The special position of Cyperaceae and Juncaceae in terms of δ13C among other taxa is difficult to explain. Körner et al. (1991) suggested that species with large below-ground biomass, such as Ranunculus glacialis and Oxyria digyna showed less discrimination than those with very small below ground components like Arabis alpina. C. sempervirens is among the most strongly and deeply rooted species of the five studied species and had less negative δ13C values than other species (L. uzula lutea, P. alpina, and G. montanum). Again, this could be related to a greater contribution of 13C enriched carbohydrate reserves to the rapid formation of new leaves after snow melt. Forthcoming study may now be needed to examine the seasonal course of carbon isotope discrimination in alpine plant species to evaluate changes in gas exchange process in response to biotic and abiotic factors.
At species level, we also observed a wide interspecific variation in foliar δ15N (ca. 7–8‰) within each studied community. Similar ranges in foliar δ15N were reported for arctic tundra communities in Alaska and Swedish Lapland (Michelsen et al., 1996; Nadelhoffer et al., 1996), while foliar δ15N of species in temperate and tropical regions typically differ by less than 5‰ for a given site (Garten, 1993; Nadelhoffer and Fry, 1994). According to Craine et al. (2009), the variation in foliar δ15N in cold ecosystems with mean annual temperatures of around 0°C would be even wider (ca. 15‰) when foliar δ15N data for some coniferous species were included. In the Rocky Mountains of Colorado, Miller and Bowman (2002) explained the difference in δ15N by the species-specific ability to absorb NH4+, NO3- or organic N (e.g., glycine). Low (very negative) foliar δ15N occurred in shallow rooted ericaceous species (Vaccinium, Empetrum, and Ledum), while high (less negative or even positive) values occurred in deeply rooted sedges (Eriophorum and Carex) in arctic tundra, where δ15N in soil was found to increase with soil depth (Nadelhoffer et al., 1996; Welker et al., 2003) as was found in our survey. Therefore, besides mycorrhization, the differences in rooting depth and/or age of organic N-sources may be another explanation for the great variation in foliar δ15N we found.
The rank order of foliar δ15N of six species that co-occur at one common site was largely maintained across sites. A similar consistent ranking of foliar δ15N among plant species and plant groups was reported for an alpine dry meadow and an arctic tundra ecosystem (Nadelhoffer et al., 1996; Miller and Bowman, 2002) suggesting persistent genetic differences with respect to N utilization of these species, regardless of overall N availability and site characteristics (Miller and Bowman, 2002). Legume species have generally higher δ15N value (close to zero) than non-N2-fixing plants, because of the small isotopic fractionation during fixation of atmospheric N2 by rhizobia (Rennie et al., 1978). Cyperaceae and Juncaceae always showed very high δ15N values as well. Species of these families seem to profit from their capacity of accessing very stable forms of 15N-enriched organic N in the soil (Körner, 2003). Surprisingly, Cyperaceae and Juncaceae do not differ from Fabaceae and, thus, these three families form a clearly distinct cluster of taxa separated from the rest of all other taxa.
For non-N2-fixing species, the correlation between foliar %N and δ15N was only marginally significant. Similar correlations were found at global to regional scales (Craine et al., 2009) including some low-N, primary successional sites in Hawaii (Vitousek et al., 1990), Zambia (Högberg and Alexander, 1995), and Alaska (Schulze et al., 1994; Hobbie et al., 2000). These correlations were suggested to reflect response to soil N availability, in either mycorrhizal N-uptake, a reduced fraction of mycorrhizal N transferred to plants or both (Hobbie et al., 2000). No such correlation was seen in N2-fixing plants, which presumably rely less on mycorrhizal derived N.
Legume Effect on Non-Legumes
The presence of legumes may influence the availability and isotopic signature of N in the soil in their vicinity, producing δ15N signals in adjacent non-N2-fixing plants (Bai et al., 2009; Casper et al., 2012). In our study, the δ15N of T. alpinum was significantly higher than in non-N2-fixing plants (except for Cyperaceae and Juncaceae). Yet, we see no significant differences in δ15N between non-N2-fixing plants close to and away from N2-fixing T. alpinum, which is puzzling. We attribute this to two facts: (1) the unknown past location of legume individuals in these communities (random historical legume presence influencing N in SOM), and (2) the legume signal matches with that of the most abundant sedges, the neighborhood of which no species can avoid in this environment. Similarly, N2-fixing Acacia tortilis in savanna regions was found to exert no influence on adjacent non-N2-fixing plants (Handley et al., 1994), although the reasons might be different.
Community Means and Soil Signals
Under natural non-alpine conditions, foliar δ13C was suggested to be largely related to soil moisture gradients (O’Leary, 1981), but the high elevation mosaic of life conditions does not exert such effects, not even in semi-arid mountains (see Introduction). Further, it is known that plants from alpine elevations usually have less negative δ13C than lowland taxa, largely a response to reduced atmospheric pressure (Körner et al., 1991; Zhu et al., 2010; Zhou et al., 2011), provided comparisons are not confounded by moisture stress at lower elevation. All the sampling sites of our study were open habitats without substantial gradients in elevation or moisture, which explains the lack of a significant site difference in δ13C signals at the community level.
The overall mean δ13C of -26.15‰ is slightly less negative as one would expect from the ca. 2500 m elevation a.s.l., a mean lowland signal of -28.8‰ (Körner et al., 1988) and a 1.2‰ mean change per 1000 m of elevation that emerged from earlier works. Assuming lowland reference data are for 100 m a.s.l. the expected drop in fractionation during leaf gas exchange to our mean site elevation by 2.9‰ would lead to a mean δ13C of -25.7‰. That is quite close to the -26.15‰, and thus, within the precision of such surveys. The elevational adjustment of leaf gas exchange to reduced partial pressure of CO2 is very species-specific (Körner and Diemer, 1987) and, thus, the species selected will influence the mean δ13C signal for a given elevation.
The less negative δ13C in SOM suggests that ‘lighter’ carbon was recycled faster, with the remaining SOM becoming δ13C-richer than the organic debris that entered the SOM pool. Similar increases in δ13C of SOM with soil depth relative to that of the litter layer were reported in forest ecosystem (Boström et al., 2007). The increased contribution of microbially derived C to SOM with depth was suggested to be the most likely mechanism accounting for this change (Ehleringer et al., 2000; Boström et al., 2007). This local shift in SOM δ13C is not in conflict with an overall correlation of soil and plant signals as was shown for an elevational gradient in Papua New Guinea (soil data by Bird et al., 1994; plant data in Körner, 2003).
A depth-related increase in 15N concentration in soils has been observed in forest, grassland and tundra ecosystems (Nadelhoffer and Fry, 1994; Nadelhoffer et al., 1996; Högberg, 1997). The discrimination against 15N during mineralization produces δ15N-enriched organic residues, and, unlike δ13C signals in SOM, these residues appear to constitute a greater fraction at greater soil depth (Nadelhoffer and Fry, 1994; Nadelhoffer et al., 1996; Högberg, 1997). We found that most plant species were depleted in 15N more than even the uppermost (0–2.5 cm) soils in all studied communities, matching observations from deciduous forest, coniferous temperate forest, alpine dry meadow and arctic tundra community (Garten, 1993; Nadelhoffer et al., 1996; Miller and Bowman, 2002). Compared to bulk soil, foliar litter and fine root litter are generally depleted in 15N, whereas sporocaps of mycorrhizal fungi are often enriched in 15N. Therefore, inputs of 15N-depleted root litter and 15N-enriched mycorrhizal fungi at depth could result in soil being substantially enriched in 15N relative to surface litter. Moreover, the common practice of sieving soil prior to sampling may preferentially remove root litter, potentially increasing the perceived contribution of fungal litter to total soil N and could therefore potentially influence the nitrogen isotope profile in soil (Hobbie et al., 2000). On the other hand, the partial conversion of nitrate during denitrification could strongly influence soil 15N by creating a pool of 15N-enriched nitrate that could be subsequently reassimilated by the microbial community, and ultimately increase soil δ15N (Hobbie et al., 2000). Therefore, the preferential uptake/microbial release of 15N-depleted inorganic N fractions and fractionation during internal N translocation have been offered as explanations (Högberg, 1997; Hobbie et al., 2000).
Conclusion
We found a much wider spectrum of δ13C and δ15N signals in herbaceous and graminoid plant tissues than would be expected from the common (and harsh) environmental conditions the target plants species experience. The observed signal variation cannot or not obviously be attributed to the variation in growth conditions. The negligible influence of both, topography and the proximity of N2-fixing legumes, further suggest that δ13C and δ15N signals in the studied alpine plant communities varied for largely genotypic reasons and/or – in the case of 15N – for reasons related to species-specific plant-microbe/fungus interactions. We joining Högberg et al. (2005) in considering mycorrhizae as part of the autotrophic system, hence in the natural setting employed here, the term ‘genotypic’ includes species or genotype specific mycorrhization, particularly with regard to 15N signals. While the significant inter-specific differences of foliar δ15N within a community, most likely reflect access to different soil N sources, the variation in δ13C must reflect inherently different discrimination regimes (both physical and biochemical) in leaves during photosynthesis. These large and consistent inter-specific differences in stable isotope signatures among such herbaceous alpine plant species underline that elevational trends in stable isotope signals either need to be studied within a taxon [e.g., congeneric comparisons such as those by Zhu et al. (2010) and Zhou et al. (2011), or they must rely on a broad sample of species that covers the genetic signal diversity].
Sampling different tissue types will, on average, add at least another 1–2‰ of ‘noise’ (less in δ13C, more in δ15N), similar to the range of variation among individuals of the same species growing next to each other. Combined, our findings evidence that alpine plant species have evolved rather diverse means for acquiring and using CO2 and nitrogen. Moreover, the fairly consistent rank order of species in both, foliar 13C and 15N across different habitats, suggests that these traits are fixed and likely contribute to the functionality of alpine plant species diversity, very similar to what had been reported recently for sand dunes (Bermudez and Retuerto, 2014). At ecosystem scale, the high δ15N signal in the often dominant alpine Cyperaceae and Juncaceae (δ15N similar to legumes), does impose a significant isotopic fingerprint on the ecosystem N cycle, thus, masking isotopic legume neighborhood effects on non-N2-fixing taxa.
Author Contributions
CK conceived and designed the work. YY performed work and analyzed the data. YY and CK wrote the manuscript. RS provided editorial advice on work and writing of the manuscript.
Conflict of Interest Statement
The authors declare that the research was conducted in the absence of any commercial or financial relationships that could be construed as a potential conflict of interest.
Acknowledgments
We thank the ALPFOR research station for logistic support and E. Hiltbrunner for her advice and help during bulk biomass and soil sampling, L. Streule for help with sample processing in the lab, and A. Kahmen for helpful comments to the manuscript. YY received support by the overseas exchange program from Chinese Academy of Sciences (No. 147-2010).
Supplementary Material
The Supplementary Material for this article can be found online at: http://journal.frontiersin.org/article/10.3389/fpls.2015.00423/abstract
References
Alstad, K. P., Welker, J. M., Williams, S. A., and Trilica, M. J. (1999). Carbon and water relations of Salix monticola in response to winter browsing and changes in surface water hydrology: an isotopic study using δ13C and δ18O. Oecologia 20, 375–385. doi: 10.1007/s004420050870
Arnone, J. A. (1999). Symbiotic N2 fixation in a high alpine grassland: effects of four growing seasons of elevated CO2. Funct. Ecol. 13, 383–387. doi: 10.1046/j.1365-2435.1999.00325.x
Bai, E., Boutton, T. W., Liu, F., Wu, X. B., Archer, S. R., and Hallmark, C. T. (2009). Spatial variation of the stable nitrogen isotope ratio of woody plants along a topoedaphic gradient in a subtropical savanna. Oecologia 159, 493–503. doi: 10.1007/s00442-008-1246-0
Bermudez, R., and Retuerto, R. (2014). Together but different: co-occurring dune plant species differ in their water- and nitrogen-use strategies. Oecologia 174, 651–663. doi: 10.1007/s00442-013-2820-7
Billings, W. D., and Bliss, L. C. (1959). An alpine snowbank environment and its effect on vegetation, plant development, and productivity. Ecology 40, 389–397. doi: 10.2307/1929755
Bird, M. I., Haberle, S. G., and Chivas, A. R. (1994). Effect of altitude on the carbon-isotope composition of forest and grassland soil from Papua New Guinea. Global Biogeochem. Cycles 8, 13–22. doi: 10.1029/93GB03487
Boström, B., Comstedt, D., and Ekblad, A. (2007). Isotope fractionation and 13C enrichment in soil profiles during the decomposition of soil organic matter. Oecologia 153, 89–98. doi: 10.1007/s00442-007-0700-8
Bowman, W. D., Schardt, J. C., and Schmidt, S. K. (1996). Symbiotic N2-fixation in alpine tundra: ecosystem input and variation in fixation rates among communities. Oecologia 108, 345–350. doi: 10.1007/BF003x34660
Casper, B. B., Goldman, R., Lkhagva, A., Helliker, B. R., Plante, A. F., Spence, L. A., et al. (2012). Legumes mitigate ecological consequences of a topographic gradient in a northern Mongolian steppe. Oecologia 169, 85–94. doi: 10.1007/s00442-011-2183-x
Chapin, D. M., Bliss, L. C., and Bledsoe, L. J. (1992). “Nitrogen fixation in arctic plant communities,” in Arctic Ecosystems in a Changing Climate: an Ecophysiological Perspective, eds F. S. Chapin III, R. Jeffries, J. F. Reynolds, G. R. Shaver and J. Svoboda (New York: Academic Press), 301–319. doi: 10.1016/B978-0-12-168250-7.50020-1
Chevillat, V. S., Siegwolf, R. T. W., Pepin, S., and Körner, C. (2005). Tissue-specific variation of delta 13-C in mature canopy in a temperate forest in central Europe. Basic Appl. Ecol. 6, 519–534. doi: 10.1016/j.baae.2005.04.008
Coker, G. T., and Schubert, K. R. (1981). Carbon dioxide fixation in soybean roots and nodules I. Characterization and comparison with N2 fixation and composition of xylem exudate during early nodule development. Plant Physiol. 67, 691–696. doi: 10.1104/pp.67.4.691
Craine, J. M., Elmore, A. J., Aidar, M. P. M., Bustamante, M., Dawson, T. E., Hobbie, E. A., et al. (2009). Global patterns of foliar nitrogen isotopes and their relationships with climate, mycorrhizal fungi, foliar nutrient concentrations, and nitrogen availability. New Phytol. 183, 980–992. doi: 10.1111/j.1469-8137.2009.02917.x
Dawson, T. E., Mambelli, S., Plamboeck, A. H., Templer, P. H., and Tu, K. P. (2002). Stable isotopes in plant ecology. Annu. Rev. Ecol. Syst. 33, 507–559. doi: 10.1146/annurev.Ecolsys.33.020602.095451
Ehleringer, J. R., Buchmann, N., and Flanagan, L. B. (2000). Carbon isotope ratio in belowground carbon cycle processes. Ecol. Appl. 10, 412–422. doi: 10.1890/1051-0761(2000)010[0412:CIRIBC]2.0.CO;2
Estep, M. F., Tabita, F. R., Parker, P. L., and Baalen, C. V. (1978). Carbon isotope fractionation by ribulose 1,5-biphosphate carboxylase from various organisms. Plant Physiol. 61, 680–687. doi: 10.1104/pp.61.4.680
Evans, D. R. (2001). Physiological mechanisms influencing plant nitrogen isotope composition. Trends Plant Sci. 6, 121–126. doi: 10.1016/S1360-1385(01)01889-1
Fisk, M. C., Schmidt, S. K., and Seastedt, T. R. (1998). Topographic patterns of above- and belowground production and nitrogen cycling in Alpine Tundra. Ecology 79, 2253–2266. doi: 10.1890/0012-9658(1998)079[2253:TPOAAB]2.0.CO;2
Frank, D. A., and Evans, D. R. (1997). Effects of native grazers on grassland N cycling Yellowstone National Park. Ecology 78, 2238–2248. doi: 10.1890/0012-9658(1997)078[2238:EONGOG]2.0.CO;2
Garten, C. T. (1993). Variation in foliar 15N abundance and the availability of soil nitrogen on Walker Branch Water-shed. Ecology 74, 2098–2113. doi: 10.2307/1940855
Geber, M. A., and Dawson, T. E. (1990). Genetic variation in and covariation between leaf gas exchange, morphology, and development in Polygonum arenastrum, an annual plant. Oecologia 85, 53–58. doi: 10.1007/BF00319396
Guehl, J. M., Fort, C., and Ferhi, A. (1995). Differential response of leaf conductance, carbon isotope discrimination and water-use efficiency to nitrogen deficiency in maritime pine and pedunculate oak plants. New Phytol. 131, 149–157. doi: 10.1111/j.1469-8137.1995.tb05716.x
Handley, L. L., Odee, D., and Scrimgeour, C. M. (1994). δ15N and δ13C patterns in savanna vegetation: dependence on water availability and disturbance. Funct. Ecol. 8, 306–314. doi: 10.2307/2389823
Hiltbrunner, E., Aerts, R., Bühlmann, T., Huss-Danell, K., Magnusson, B., Myrold, D., et al. (2014). Ecological consequences of the expansion of N2-fixing plants in cold biomes. Oecologia 176, 11–24. doi: 10.1007/s00442-014-2991-x
Hobbie, E. A., Macko, S. A., and Williams, M. (2000). Correlations between foliar δ15 N and nitrogen concentrations may indicate plant-mycorrhizal interactions. Oecologia 122, 273–283. doi: 10.1007/PL00008856
Hobbie, E. A., Tingey, D. T., Rygiewicz, P. T., Johnson, M. G., and Olszyk, D. M. (2002). Contributions of current year photosynthate to fine roots estimated using a 13C-depleted CO2 source. Plant Soil 247, 233–242. doi: 10.1023/A:1021580232181
Högberg, P. (1997). 15N natural abundance in soil-plant system. New Phytol. 137, 179–203. doi: 10.1046/j.1469-8137.1997.00808.x
Högberg, P., and Alexander, I. J. (1995). Role of root symbioses in African woodland and forest: evidence from 15N abundance and foliar analysis. J. Ecol. 83, 217–224. doi: 10.2307/2261560
Högberg, P., Nordgren, A., Högberg, M. N., Ottosson-Löfvenius, M., Bhupinderpal-Singh, Olsson, P., et al. (2005). “Fractional contributions by autotrophic and heterotrophic respiration to soil-surface CO2 efflux in boreal forests,” in The Carbon Balance of Forest Biomes, eds H. Griffiths and P. G. Jarvis (NY: Taylor & Francis), 251–267.
Inauen, N., Körner, C., and Hiltbrunner, E. (2013). Hydrological consequences of declining land use and elevated CO2 in alpine grassland. J. Ecol. 101, 86–96. doi: 10.1111/1365-2745.12029
Jocot, K. A., Lüscher, A., Nösberger, J., and Hartwig, U. A. (2000). Symbiotic N2 fixation of various legume species along an altitudinal gradient in the Swiss Alps. Soil Biol. Biochem. 32, 1043–1052. doi: 10.1016/S0038-0717(00)00012-2
Johansen, A., Jakobsen, I., and Jensen, E. S. (1993). External hyphae of vesicular-arbuscular mycorrhizal fungi associated with Trifolium subterraneum L. 3. Hyphal transport of 32P and 15N. New Phytol. 124, 61–68. doi: 10.1111/j.1469-8137.1993.tb03797.x
Kielland, K., and Bryant, J. P. (1998). Moose herbivory in taiga: effects on biogeochemistry and vegetation dynamics in primary succession. Oikos 82, 377–383. doi: 10.2307/3546979
Körner, C. (1982). CO2 exchange in the alpine sedge Carex curvula as influenced by canopy structure, light and temperature. Oecologia 53, 98–104. doi: 10.1007/BF00377142
Körner, C. (2003). Alpine Plant Life, 2nd Edn. Berlin: Springer Verlag. doi: 10.1007/978-3-642-18970-8
Körner, C. (2007). The use of “altitude” in ecological research. Trends Ecol. Evol. 22, 569–574. doi: 10.1016/j.tree.2007.09.006
Körner, C., and Diemer, M. (1987). In situ photosynthetic responses to light, temperature and carbon dioxide in herbaceous plants from low and high altitude. Funct. Ecol. 1, 179–194. doi: 10.2307/2389420
Körner, C., Farquhar, G. D., and Roksandic, Z. (1988). A global survey of carbon isotope discrimination in plants from high altitude. Oecologia 74, 623–632. doi: 10.1007/BF00380063
Körner, C., Farquhar, G. D., and Wong, S. C. (1991). Carbon isotope discrimination by plant follows latitudinal and altitudinal trends. Oecologia 88, 30–40. doi: 10.1007/BF00328400
May, D. E., and Webber, P. J. (1982). “Spatial and temporal variation of the vegetation and its productivity on Niwot Ridge, Colorado,” in Ecological Studies of the Colorado Alpine: a Festschrift for John W. Marr. Occasional Paper Number 37, ed. J. C. Halfpenny (Boulder, CO: Institute of Arctic and Alpine Research, University of Colorado), 35–62.
Michelsen, A., Schmidt, I. K., Jonasson, S., Quarmby, C., and Sleep, D. (1996). Leaf N-15 abundance of subarctic plants provides field evidence that ericoid, ectomycorrhizal and non- and arbuscular mycorrhizal species access different sources of soil nitrogen. Oecologia 105, 53–63. doi: 10.1007/BF00328791
Miller, A. E., and Bowman, W. D. (2002). Variation in nitrogen-15 natural abundance and nitrogen uptake traits among co-occurring alpine species: do species partition by nitrogen form? Oecologia 130, 609–616. doi: 10.1007/s00442-001-0838-8
Nadelhoffer, K. J., and Fry, B. (1994). “Nitrogen isotope studies in forest ecosystems,” in Stable Isotopes in Ecology, eds K. Lajtha and R. Michener (Oxford: Blackwell), 22–44.
Nadelhoffer, K., Shaver, G., Fry, B., Giblin, A., Johnson, L., and Mckane, R. (1996). 15N natural abundance and N use by tundra plants. Oecologia 107, 386–394. doi: 10.1007/BF00328456
O’Leary, M. H. (1981). Carbon isotope fractionation in plants. Phytochemistry 20, 553–567. doi: 10.1016/0031-9422(81)85134-5
Rennie, R. J., Rennie, D. A., and Fried, M. (1978). “Concepts of 15N usage in dinitrogen fixation studies,” in Isotopes in Biological Dinitrogen Fixation (Vienna: IAEA), 107–130.
Saranga, Y., Flash, I., Paterson, A. H., and Yakir, D. (1999). Carbon isotope ratio in cotton varies with growth stage and plant organ. Plant Sci. 142, 47–56. doi: 10.1016/S0168-9452(99)00004-7
Scherrer, D., and Körner, C. (2010). Infra-red thermometry of alpine landscapes challenges climatic warming projections. Global Change Biol. 16, 2602–2613. doi: 10.1111/j.1365-2486.2009.02122.x
Schmidt, S., and Stewart, G. R. (2003). δ15N values of tropical savanna and monsoon forest species reflect root specialisations and soil nitrogen status. Oecologia 134, 569–577. doi: 10.1007/s00442-002-1150-y
Schulze, E. D., Chapin, F. S. III, and Gebauer, G. (1994). Nitrogen nutrition and isotope differences among life forms at the northern treeline of Alaska. Oecologia 100, 406–412. doi: 10.1007/BF00317862
Schulze, E. D., Gebauer, G., Ziegler, H., and Lange, O. L. (1991). Estimates of nitrogen fixation by trees on an aridity gradient in Namibia. Oecologia 88, 451–455. doi: 10.1007/BF00317592
van den Bergh, T., Inauen, N., Hiltbrunner, E., and Körner, C. (2013). Climate and plant cover co-determine the elevational reduction in evapotranspiration in the Swiss Alps. J. Hydrol. 500, 75–83. doi: 10.1016/j.jhydrol.2013.07.013
Vitousek, P. M., Field, C. B., and Matson, P. A. (1990). Variation in foliar δ13C in Hawaiian Metrosideros polymorpha: a case of internal resistance? Oecologia 84, 362–370. doi: 10.1007/BF00329760
Welker, J. M., Jonsdottir, I. S., and Fahnestock, J. T. (2003). Leaf isotopic (delta C-13 and delta N-15) and nitrogen contents of Carex plants along the Eurasian Coastal Arctic: results from the Northeast Passage expedition. Polar Biol. 27, 29–37. doi: 10.1007/s00300-003-0562-4
Wojciechowski, M. F., and Heimbrook, M. E. (1984). Dinitrogen fixation in the alpine tundra, Niwot Ridge, Front Range, Colorado. Arct. Alp. Res. 16, 1–10. doi: 10.2307/1551166
Yoneyama, T., and Ohtani, T. (1983). Variations of natural 13C abundances in Leguminous plants. Plant Cell Physiol. 24, 971–977.
Zhou, Y. C., Fan, J. W., Zhang, W. Y., Harris, W., Zhong, H. P., Hu, Z. M., et al. (2011). Factors influencing altitudinal patterns of C3 plant foliar carbon isotope compostion of grasslands on the Qinghai-Tibet Plateau China. Alp. Bot. 121, 79–90. doi: 10.1007/s00035-011-0093-5
Keywords: biodiversity, carbon, nitrogen, N2 fixation, soil, stable isotope
Citation: Yang Y, Siegwolf RTW and Körner C (2015) Species specific and environment induced variation of δ13C and δ15N in alpine plants. Front. Plant Sci. 6:423. doi: 10.3389/fpls.2015.00423
Received: 13 February 2015; Accepted: 25 May 2015;
Published online: 05 June 2015
Edited by:
Sergio Rossi, Université du Québec à Chicoutimi, CanadaReviewed by:
José Ignacio Querejeta, Centro de Edafología y Biología Aplicada del Segura, Consejo Superior de Investigaciones Científicas, SpainRossella Guerrieri, University of New Hampshire, USA
Copyright © 2015 Yang, Siegwolf and Körner. This is an open-access article distributed under the terms of the Creative Commons Attribution License (CC BY). The use, distribution or reproduction in other forums is permitted, provided the original author(s) or licensor are credited and that the original publication in this journal is cited, in accordance with accepted academic practice. No use, distribution or reproduction is permitted which does not comply with these terms.
*Correspondence: Yang Yang, Key Laboratory for Plant Diversity and Biogeography of East Asia, Kunming Institute of Botany, Chinese Academy of Sciences, Kunming, Yunnan 650204, China, yangyang@mail.kib.ac.cn