 Mohammad R. Hossain
 George W. Bassel
 Jeremy Pritchard2
- 1Department of Genetics and Plant Breeding, Bangladesh Agricultural University, Mymensingh, Bangladesh
- 2School of Biosciences, University of Birmingham, Birmingham, UK
Stress responsive gene expression is commonly profiled in a comparative manner involving different stress conditions or genotypes with contrasting reputation of tolerance/resistance. In contrast, this research exploited a wide natural variation in terms of taxonomy, origin and salt sensitivity in eight genotypes of rice to identify the trait specific patterns of gene expression under salt stress. Genome wide transcptomic responses were interrogated by the weighted continuous morpho-physiological trait responses using modified Significance Analysis of Microarrays. More number of genes was found to be differentially expressed under salt stressed compared to that of under unstressed conditions. Higher numbers of genes were observed to be differentially expressed for the traits shoot Na+/K+, shoot Na+, root K+, biomass and shoot Cl−, respectively. The results identified around 60 genes to be involved in Na+, K+, and anion homeostasis, transport, and transmembrane activity under stressed conditions. Gene Ontology (GO) enrichment analysis identified 1.36% (578 genes) of the entire transcriptome to be involved in the major molecular functions such as signal transduction (>150 genes), transcription factor (81 genes), and translation factor activity (62 genes) etc., under salt stress. Chromosomal mapping of the genes suggests that majority of the genes are located on chromosomes 1, 2, 3, 6, and 7. The gene network analysis showed that the transcription factors and translation initiation factors formed the major gene networks and are mostly active in nucleus, cytoplasm and mitochondria whereas the membrane and vesicle bound proteins formed a secondary network active in plasma membrane and vacuoles. The novel genes and the genes with unknown functions thus identified provide picture of a synergistic salinity response representing the potentially fundamental mechanisms that are active in the wide natural genetic background of rice and will be of greater use once their roles are functionally verified.
Introduction
Abiotic stresses greatly reduce agricultural productivity worldwide. The yield of rice, one of the major food crops that feed the world, can be reduced by up to 50% making it highly sensitive to soil salinity. Salinity causes accumulation of excess Na+ and Cl− in the shoot which is detrimental for plant nutrition and exerts osmotic stress and ionic toxicity that ultimately restricts plant growth (Munns et al., 2006; Flowers and Colmer, 2008; Munns and Tester, 2008). Salinity tolerance, a complex trait both physiologically and genetically, requires a wide range of physiological and biochemical responses by activating a complex network of genes upon exposure to stress (Cotsaftis et al., 2011; Wu et al., 2013). However, the naturally occurring genetic variation across rice varieties, cultivars, landraces and wild species provides the advantage to identify factors such as genes, proteins and metabolites which can be utilized by conventional breeding and genetic engineering technologies for improvement of crops' tolerance to stresses (Langridge and Fleury, 2011; Horie and Karahara, 2012).
The advances in the high throughput multi-omics techniques along with the progress made in the ever spreading arena of bioinformatics, have given rise to the system biology approaches (Duque et al., 2013). This allows the investigation of the natural genotypic variation holistically to gain deeper biological insight on how the plant functions as a whole by discovering the putative functions of genes, proteins and metabolites in a specific biological context by dissecting the complex regulatory networks of genes, proteins, and metabolites associated with stress adaptation and tolerance (Mochida and Shinozaki, 2011; Shelden and Roessner, 2013).
Recently, there has been a substantial advancements in the technology of whole genome transcriptomic profiling and a number of crop species such as Arabidopsis (Kumari et al., 2008), barley (Close and Wanamaker, 2004), maize (Wang et al., 2003), and wheat (Clarke and Rahman, 2005) etc., have been studied extensively. In rice, several microarray platforms were used such as cDNA microarrays (Ueda et al., 2006), NSF 45 K 70-mer oligo microarrays (Senadheera et al., 2009), Affymetrix gene chips (Walia et al., 2005; Walia and Wilson, 2007, 2009; Cotsaftis et al., 2011) and Agilent 44 k microarray (Aya et al., 2011) to study the response of plants toward stresses at transcritpome level.
Stress responsive transcripts, in most of the cases, are usually identified based on comparative and differential transcriptomic expression analysis in two to four genotypes showing extremely contrasting levels of tolerance which results in the findings being genotype specific. This ceases the opportunity to analyze the gradient of transcriptomic responses in diverse genotypes at a time and to correlate those with the changes in morpho-physiological responses to identify the significant transcripts and hence, the molecular functions and biological processes that are operating in species level as adaptive mechanisms (Feder and Walser, 2005; Hossain et al., 2015b). The recent advent of powerful and holistic analytical approaches of system biology such as the Significance Analysis of Microarrays (SAM) offer unique possibility in this regard. And such approaches of correlating the transcriptomic and morpho-physiological responses in a wide genetic background of rice under salt stress are yet to be explored.
SAM was first successfully used to identify the significant changes in transcriptional responses in human lymphoblastoid cells under ionizing radiation with a much lower estimated FDR (12%), compared to the higher FDRs (60–84%) of other conventional methods of analysis (Tusher et al., 2001). This study used a slightly modified version of SAM to suit it with the objective of analyzing the gradient of salinity induced transcriptomic and morpho-physiological responses in diverse genotypes of rice. To achieve this diversity, eight rice genotypes were used that are of diverse geographical origins and belong to different sub-species groups (such as indica, japonica, and wild species), different cultivar groups (such as landraces, cultivars, and high yielding varieties) with a reputation of different levels of tolerance to salinity stress (such as susceptible, moderately tolerant, and highly tolerant). Agilent's 44 k oligo-microarrays were used as it provided less expensive yet reasonably sensitive profiling of the genome-wide transcriptional responses of such higher number of samples.
Thus, a modified SAM approach is used to interrogate the patterns of variation in gene expressions by the gradient of responses in morpho-physiological traits in a wide genetic background of rice represented by eight diverse (in terms of taxonomy, origin and salt sensitivity) genotypes in a way to identify the significant transcripts that is relative to the changes in a particular morpho-physiological trait under salt stress. These identified trait specific salinity induced transcripts are discussed along with their complex regulatory networks and the major biological processes and molecular functions that are operating in the wide genetic background of rice as adaptive mechanisms to cope with the stressed environments.
Materials and Methods
Plant Materials
Eight rice genotypes (Table 1) consisting of landraces, cultivars, high yielding varieties (HYVs) and wild species and taxonomically belonging to three different rice sub-species groups namely, Indica, Japonica, and wild species, having diverse geographical origin and showing different levels of tolerance to salt stress were obtained from the International Rice Gene Bank Centre (IRGC) of the International Rice Research Institute (IRRI).
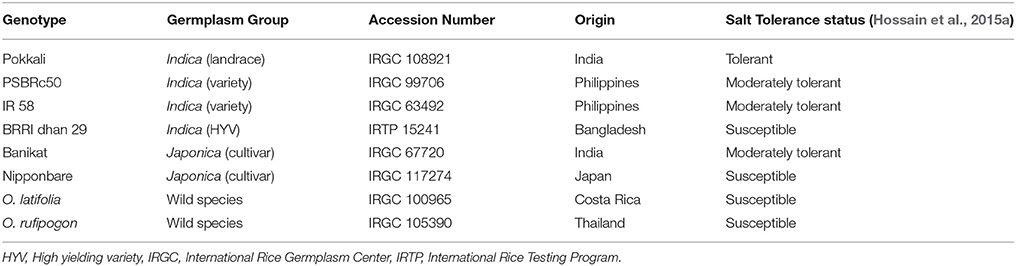
Table 1. List of diverse rice genotypes along with their sup-species levels, origins, and reputation of salt stress used for trait specific expression profiling of salinity induced transcripts by modified Significance Analysis of Microarrays (SAM).
Hydroponic Culture Conditions and Salinity Treatments
Plants were grown twice maintaining the same environmental conditions in growth room. In the first growing, the seedlings in the flasks were challenged with 80 mM NaCl at 14 days after seedling emergence (DAE) and the data for the 14 morpho-physiological traits were collected within the next 7 days. The details of the traits (names of the traits are shown in Figure 1) can be found in Hossain et al. (2015a). In the second growing, 120 mM NaCl stress was used and total RNA from the whole seedlings was extracted after 48 h of stressed period (i.e., at 16 DAE) for whole genome transcriptome profiling. The details of the plant growth conditions, salinity treatments, and the collection of morpho-physiological data can be found in Hossain et al. (2015a).
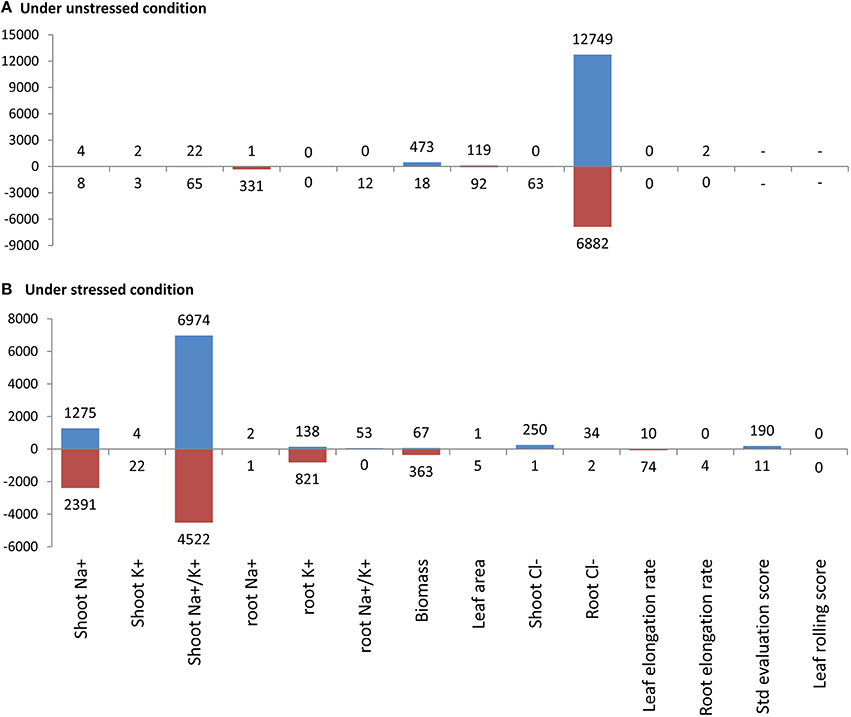
Figure 1. Number of significant positively (blue bars) and negatively (red bars) expressed probes for each of the 14 morpho-physiological traits in the eight rice genotypes representing wide natural variation under unstressed (A) and stressed (B) conditions as determined by the modified SAM approach. The complete lists of the significant probes along with the corresponding fold score (d), q-value and functional annotation can be found in Tables S1a–n, S2a–n.
Extraction and Quality Assessment of Total RNA
The total RNA was extracted from the 16 days old seedlings using the QIAGEN RNeasy Plant Mini Kit. For seedlings weighing more than the recommended amount of starting material (100 mg), the sections of root, stem, and leaves were used to represent the whole seedlings. Each sample from each individual seedling represented a replicate. The freshly harvested samples were snap frozen in liquid nitrogen and were immediately ground to a fine powder with pre-chilled mortar and pestle. The RNA was purified using an RNeasy spin column and an on-column DNase treatment. The total RNA was eluted in 30 μl of RNase free water and was immediately aliquoted and stored in a −70°C freezer. Only the eluted total RNA having the 260/280 and 260/230 ratios around 2.0 (as quantified by Nanodrop ND-1000 VIS spectrophotometer v. 3.2.1) and having the RNA integrity (RIN) value >7.0 (as detected by the Agilent 2100 bioanalyser using the RNA 6000 Nano Labchip kit) were used hybridization.
Microarray Hybridization, Feature Extraction, and Rice Genome Array
The 48 extracted RNA samples were then prepared for microarray hybridization in the Genomics Services Facility of the University of Birmingham where cDNA synthesis, preparation of One-Color Spike-Mix, Cy3 labeling, microarray hybridization on Agilent 4 × 44 K rice oligo microarrays, scanning and feature extraction was carried out using Agilent's one color Quick Amp labeling kit (v.6.5, May 2010). The array represented about 43,803 rice genes with one 60-mer oligonucleotide probe representing each and consists of 32,325 probes corresponding to RAP loci with full-length representative cDNA, 6943 probes to RAP loci with EST support, 2612 probes to gene predicted loci and control probes including false positives and non-rice sequences etc. All microarray data of this work is available from the NCBI-GEO website (http://www.ncbi.nlm.nih.gov/geo/) under GEO Series entry GSE79043.
Modified Significance Analysis of Microarrays (SAM)
The significance analysis of microarrays (http://statweb.stanford.edu/~tibs/SAM/) was used to identify the salinity induced, trait specific significant transcripts in diverse rice genotypes. The basic principle of SAM includes scoring each of the transcripts based on the changes in both gene expression and response variable. And it uses repeated permutations of the data to determine if the change in the expression of any gene is significantly related to the changes in response variable.
This study adopted a little modification as it analyzed the control and treated data separately. Unlike the unstressed condition, the stressed condition rendered substantial amount of variation in both gene expression and morpho-physiological trait responses in the eight diverse rice genotypes. So, it was only sensible to analyze the treated data separately (which otherwise is analyzed together in a mono-genotypic study) allowing SAM to identify the stress inducible significant transcripts.
For a particular trait (e.g., for shoot Na) under stress condition, firstly the pre-processed (quantile normalized and log2 transformed) gene expression data of all the treated samples is arranged in a single spreadsheet (transcripts in rows; genotypes in column). The names of the samples (such as genotype-1, replication-1) in column heads are replaced by their corresponding trait responses which is weighted to a scale of 0 to 1. The SAM program is then ran using the response type as “quantitative” based on 100 permutations using SAM version 4.0 software. The significant genes (relative to shoot Na, in this instance) are selected based on the combined criteria of ≤ 5% FDR and ≥2-fold score. To analyze the same for the rest of the traits, the sample names in the original spreadsheet is replaced by the weighted ranks (0–1) of the trait in question. Further details of the SAM procedure used in this study can be found in Hossain (2014) and in SAM manual.
Gene Ontology (GO) Enrichment Analysis
The list of significant positively and negatively expressed genes were subjected to GO analysis using the AgriGO web-based tool (Du et al., 2010), available from http://bioinfo.cau.edu.cn/agriGO/index.php. Singular Enrichment Analysis (SEA) (Huang et al., 2009) was used to identify the biological processes or the molecular functions that are significantly enriched by the identified positively or negatively expressed genes for each of the traits. “Rice TIGR gene model” were used as reference during SEA.
Mapping of the Genes on Chromosomes and the Regulatory Network of Genes
The list of probes was mapped in the 12 chromosomes of rice using the Chromosome Map Tool (http://viewer.shigen.info/oryzavw/maptool/MapTool.do) of GRAMENE genome browser database. The interactions between all the significant probes, as determined by SEA, were determined using the “The Rice Interactions Viewer” web based tool version Interactome 2.0 developed by the Bio-Analytic Resource- the BAR that queries a database of 37472 predicted and 430 confirmed Rice interacting proteins (http://bar.utoronto.ca/welcome.htm). Prior to using the “Rice Interactions Viewer,” the RAP-DB gene Ids (e.g., Os06g0699400) were converted into MSU (TIGR) ID (e.g., LOC_Os06g48590) using the RiceXPro: Global gene expression profile web based tool (as shown in Table S4d).
Results and Discussion
The gene expression data of eight rice genotypes were interrogated with their morpho-physiological data using modified SAM approach to identify the trait specific gene expression pattern in the wide genotypic background of rice under both stressed and unstressed conditions for each of the 14 morpho-physiological traits. The detailed morpho-physiological data (not shown here) are published as a separate article (Hossain et al., 2015a).
Globally, More Genes are Expressed under Salt Stress
In general, higher numbers of probes were found to be significantly expressed, both positively and negatively for most of the important salinity tolerance related traits viz., shoot Na+, shoot Na+/K+, Biomass, root K+, and shoot Cl− under salt stress compared to that of unstressed conditions (Figure 1; Tables S1, S2). For example, 1275 and 2391 probes were positively and negatively expressed, respectively for shoot Na+, the single most important parameter to study salinity tolerance, under stressed condition compared to only 4 and 8 probes being positively and negatively expressed, respectively under unstressed conditions. Interestingly a very high number of genes were negatively expressed under stressed conditions, compared to that of under unstressed condition, for the trait “biomass” (Figure 1; Tables S1g, S2g, S3). All these probably indicate that plants deploy their adaptive mechanism by differentially activating a large number of genes under stressed conditions which otherwise is not activated constitutively.
Nonetheless, it is to keep in mind that these results are obtained by studying the RNA extracted from the whole seedling. And as gene expression, recently, is known to vary depending on cell or tissue types which can even be in opposite directions in some cases (Taylor-Teeples et al., 2011; Otsuki et al., 2014), verification of expression of all the identified genes in each cell or tissue types via in situ analysis will be helpful in revealing their exact roles in salinity tolerance mechanism.
Genes Involved in Ion Homeostasis and Transport
Lists of significant genes were mined manually to identify the putative genes that might be involved in ion transport with particular attention being given to the genes that were found to be significant for shoot Na and shoot Na/K. In total, 60 genes were found to be involved in ion homeostasis and transport processes (Table 2). Among the genes involved in sodium homeostasis, the notables are Na+/H+ exchangers such as Os09g0286400, Os05g0382200, Os11g0648000, and Os12g0641100 and potassium transport related genes such as Os03g0656500, Os07g0102100, Os03g0337500, Os01g0932500, Os02g0519100, Os03g0575200, and Os04g0682800 etc. Genes for other cations such as Ca2+, Mg2+ and anions such as ammonium, nitrate, sulfate, and phosphate were also significantly expressed under salt stress.
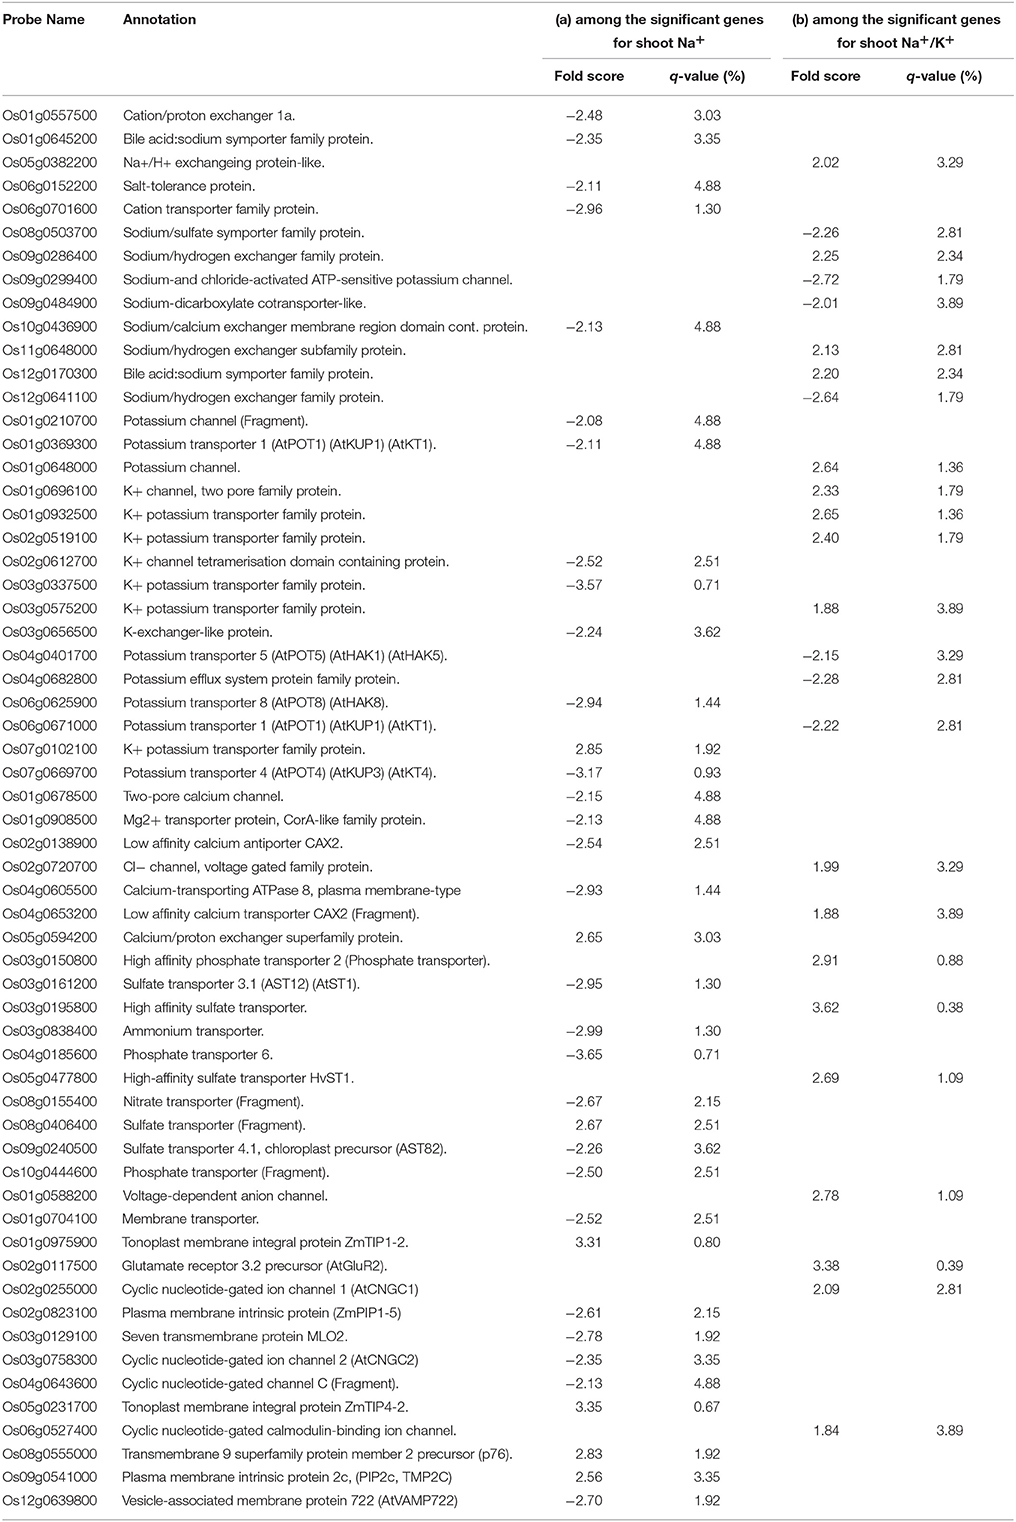
Table 2. Lists of genes (among the significant genes for (a) shoot Na+ and (b) shoot Na+/K+) involved in ion homeostasis and transports under salinity stress in wide natural variation of rice genotypes.
Several membrane intrinsic and ion channel related genes having putative roles in ion homeostasis were also found to be significantly expressed e.g., aquaporin (Os09g0541000); membrane transporter (Os01g0704100), tonoplast integral protein (Os01g0975900, Os05g0231700); vesicle associated membrane protein (Os12g0639800), and ion channels (Os04g0643600, Os06g0527400, Os02g0255000, Os03g0758300, Os02g0117500, and Os01g0588200) etc. The cation transporter family protein (Os06g0701600) and cation/proton exchanger (Os01g0557500) are found to be negatively expressed for shoot Na.
Around 15 genes such as Os01g0290800, Os01g0356000, Os01g0609200, Os01g0609300, Os01g0966100 etc., were found to be involved in ABC transport (not shown in table). The ABC-transporter proteins are believed to transport various substrates such as ions, amino acids, sugars and peptides across cellular membranes besides their role in detoxification, plant growth and developmental processes (Martinoia et al., 2002; Davidson et al., 2008). In yeast, ABC transporters are found to be involved in cation homeostasis but their role in plants is yet to be identified (Rea, 1999; Kang et al., 2010).
Global Regulation of Biological Processes (BP) under Salt Stress
More biological processes (BP) are significantly enriched by the induced genes (Table 3; Tables S4b,c) compared to that of by the constitutive genes (Tables S5b,c) as determined by the Singular Enrichment Analysis (SEA). Under unstressed conditions, no BPs were significantly enriched by the genes that are expressed for shoot Na+ and shoot Na+/K+ (Table S5b1), whereas most of the BPs were enriched by the genes that are expressed for these tissue ion traits under stressed conditions (Table 3; Table S4b1). This clearly shows that salt stress activates a series of genes which enrich different BPs in response to the stress across the range of genotypes. The major BPs that are activated under stressed conditions are Apoptosis, Stress Response, Signaling process, Transport, Metabolic and Catabolic process, Cellular, and Developmental processes etc (Table 3). The role of individual genes is not described in detail in this section, instead is discussed according to the molecular functions enriched by these genes in the next section.
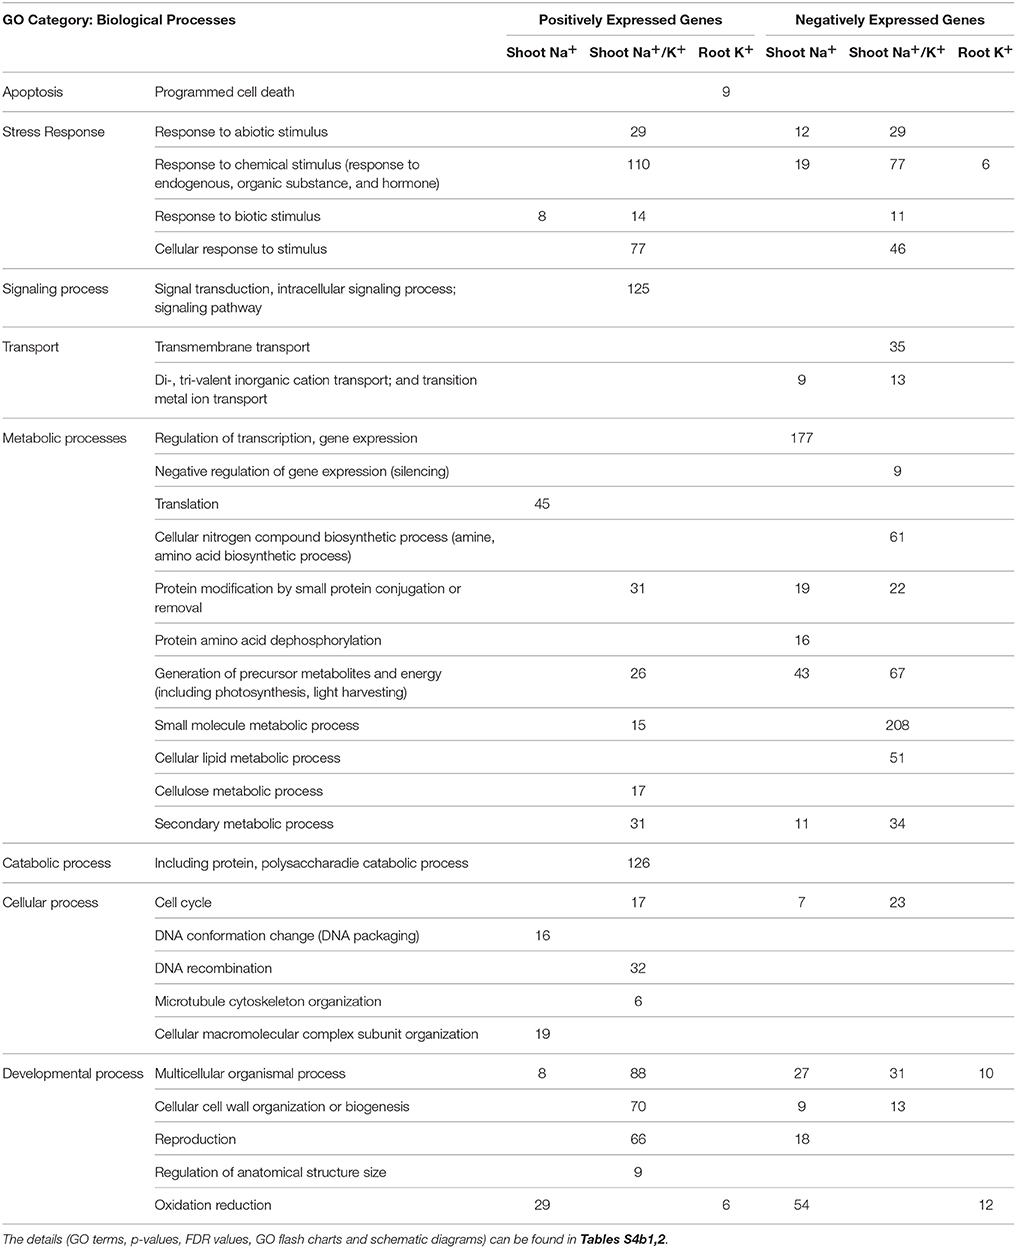
Table 3. List of significant GO categories of biological process under stressed condition for significant positively and negatively expressed genes for different morpho-physiological traits as determined by Singular Enrichment Analysis.
Global Regulation of Molecular Functions (MF) under Salt Stress
Salt stress significantly enriches more molecular functions (MF) in the wide genetic background of rice compared to unstressed conditions as determined by the SEA (Table 4; Tables S4a,c, S5a,c). Significant positively and negatively expressed transcripts under salt stress enriched a number of MFs that includes signal transducer activity, transcription, and translation factory activity, serine hydrolase and metalloexopeptidase activity etc., (Table 4). The individual genes of important molecular functions are discussed below and the detailed discussion of all MFs can be found in Hossain (2014).
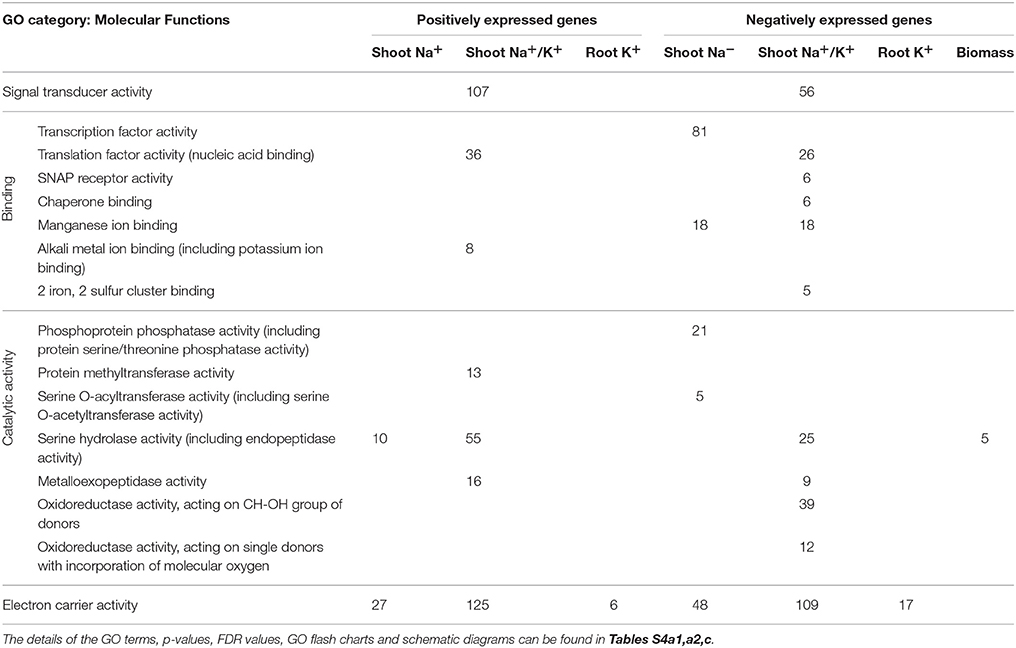
Table 4. List of significant GO categories of molecular function under stressed condition for significant positively and negatively expressed genes for different morpho-physiological traits as determined by Singular Enrichment Analysis.
Signal Transducer Activity
Stress is first sensed by the receptors in membranes, which then generates secondary signal messengers like calcium, reactive oxygen species, kinases, and phosphates followed by the activation of transcription factor genes that eventually coordinates the plant's adaptive biochemical and physiological responses (Huang et al., 2012; Proietti et al., 2013). This study indentified 107 up-regulated and 54 down-regulated transcripts that are involved in signaling (Table 5).
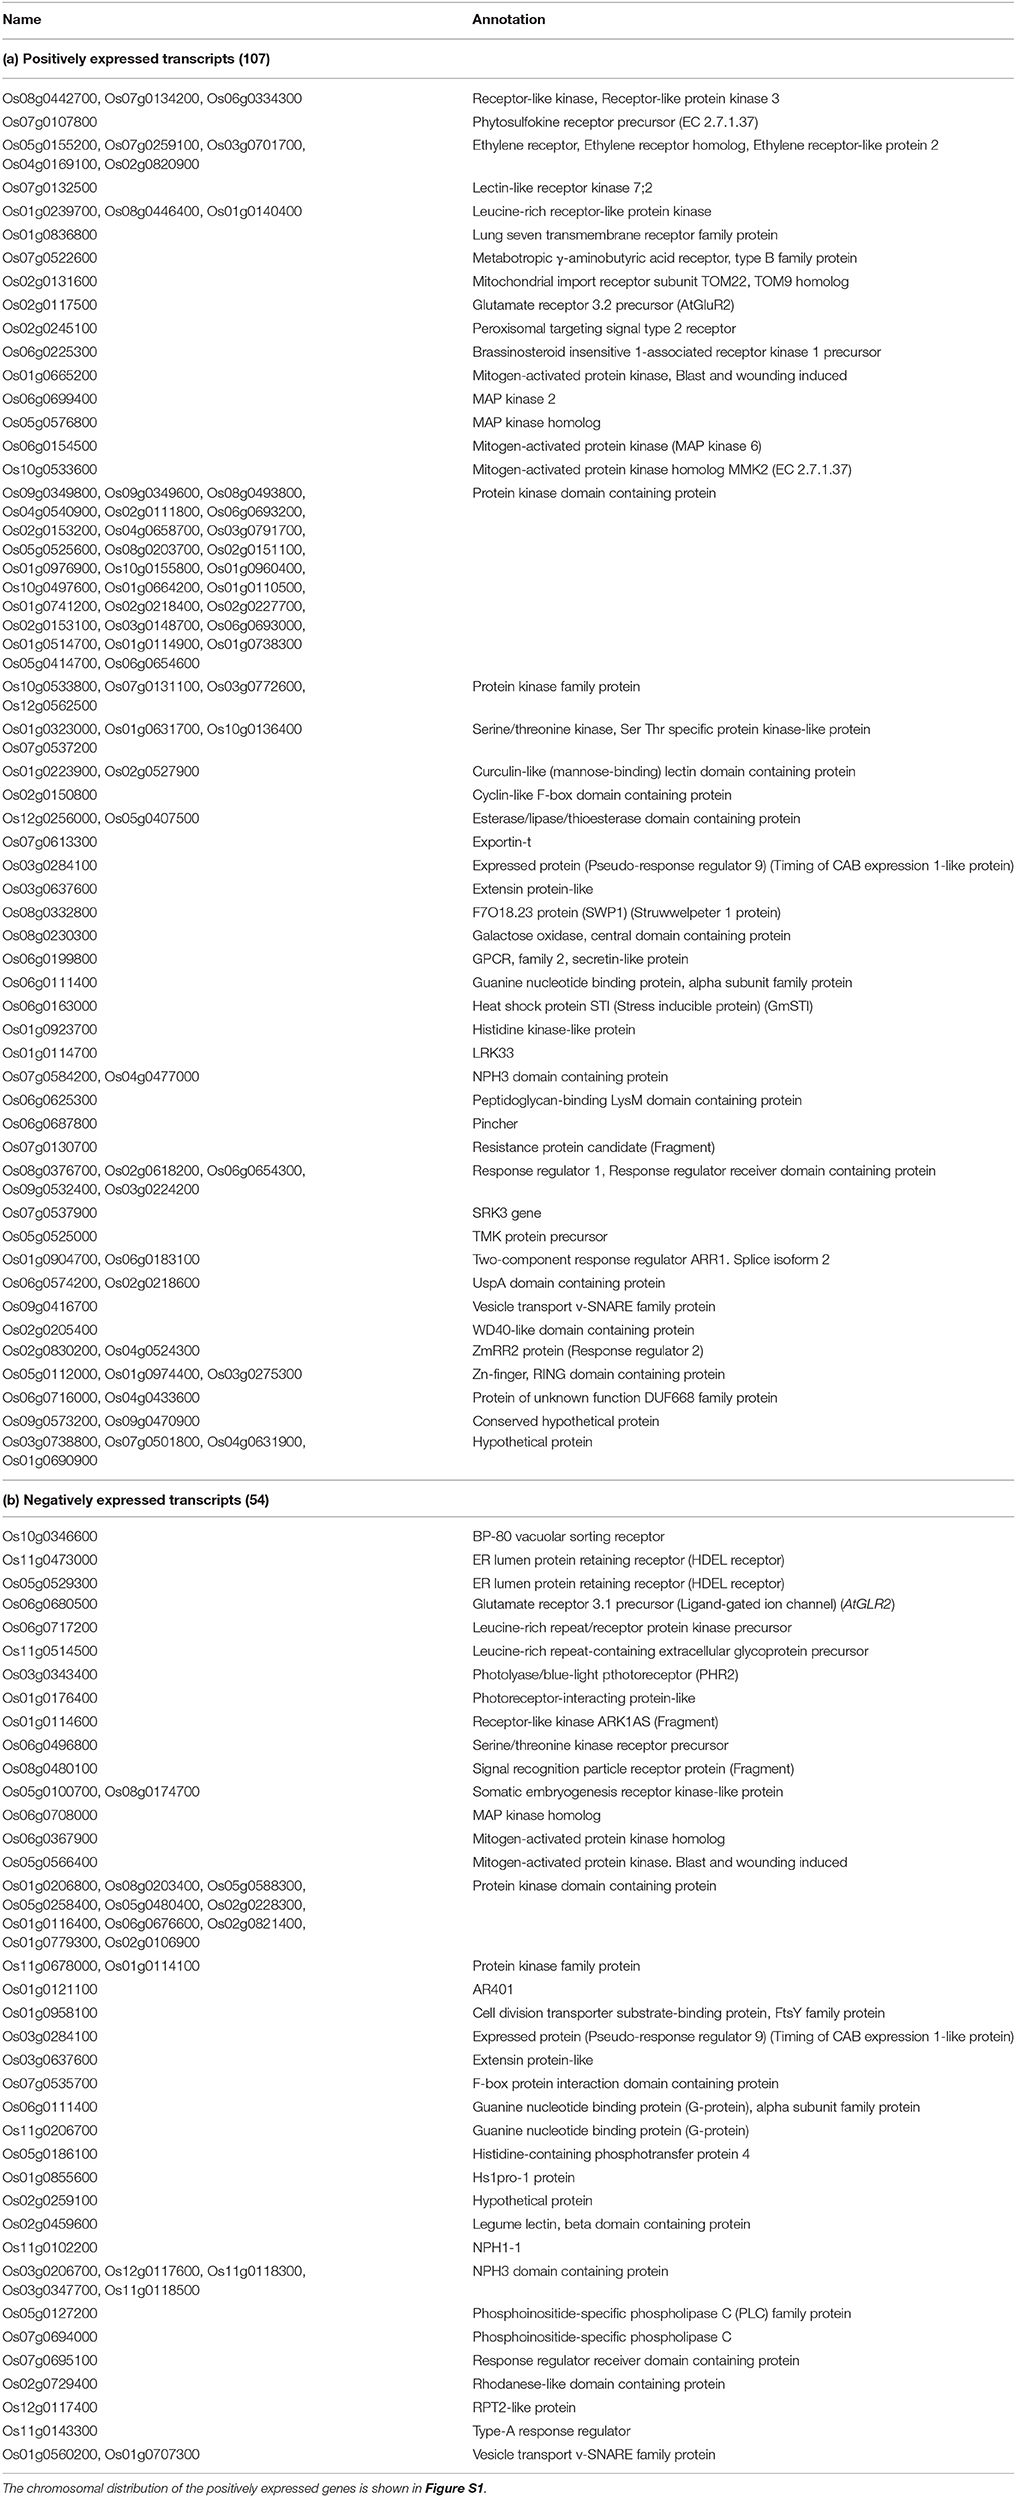
Table 5. Lists of positively (a) and negatively (b) expressed significant transcripts (for shoot Na+/K+) that are involved in the Molecular Function “Signal transducer activity” as determined by the Singular Enrichment Analysis (SEA).
Transcripts of three receptor like kinases (RLK) such as Os08g0442700, Os07g0134200, and Os06g0334300 are up-regulated. RLKs are known to play roles in stress defense by sensing the extracellular signals and activating downstream pathways by phosphorylating target proteins (Marshall et al., 2012; Tanaka et al., 2012). Very recently, in rice, a putative RLK gene, OsSIK1, with extracellular leucine-rich repeats (Ouyang et al., 2010) and a cysteine-rich repeat (CRR) RLK sub-family gene, ARCK1 (Tanaka et al., 2012) was reported to be induced by salt and drought stresses.
Transcripts of 5 Ethylene receptor genes such as Os05g0155200, Os07g0259100, Os03g0701700, Os04g0169100, and Os02g0820900 were found to be positively expressed under salt stress. The role of ethylene in salt stress response is reported to be equivocal (Achard et al., 2006) and In tobacco, an ethylene receptor gene, NTHK1 was reported to promote leaf growth (Cao et al., 2006), which demonstrated the significance of these ethylene receptor genes to be studied further in determining their role in salt tolerance.
Among the leucine-rich repeat containing transcripts, three (Os01g0239700, Os08g0446400, and Os01g0140400) and two (Os06g0717200 and Os11g0514500) were found to be negatively regulated in this study, respectively. Cheng et al. (2009) reported a leucine-rich-repeat type receptor-like protein kinase, OsRPK1 to be induced by multiple stresses in plasma membrane of cortex cells in rice roots and Lorenzo et al. (2009) reported an increase in expression of leucine-rich gene, Srlk in Medicago truncatula roots upon exposure to salt stress. The Srlk gene also had a homolog, Os05g0414700, which was also found to be positively expressed in this study.
Protein kinases regulate the phosphorylation and dephosphorylation of other proteins and play a crucial role in stress signal transduction. To date, several plant protein kinases, particularly the mitogen-activated protein (MAPK/MPK) kinase are reported to be activated by osmotic stress (Fujita et al., 2006; Sinha et al., 2011). Five MAP kinases including MAP kinase 2 (Os06g0699400), 6 (Os06g0154500) and MAPK homolog MMK2 (Os10g0533600) were positively regulated and three MAP kinases (Os06g0708000, Os06g0367900, and Os05g0566400) are negatively expressed in wide natural rice variation (Table 5). In addition, Serine/threonine protein kinases have also been known to be involved in multi-stress tolerance in plants (Zhao et al., 2009). Among the serine/threonine kinases, four (Os01g0323000, Os01g0631700, Os10g0136400, and Os07g0537200) was positively expressed and only one (Os06g0496800) was found to be negatively regulated. At least, 33 and 13 protein kinase domain containing proteins were found to be positively and negatively expressed in the wide natural variation of rice genotypes.
Among the many other positively expressed transcripts, notable are heat shock protein, mannose binding, extensins, histidin kinases, NPH3 domain containing protein, and Zn-finger domain containing proteins. These transcripts were found to be located in all the chromosomes except in chromosome 11 and chromosomes 1, 2, 6, and 7 contained most of the genes (Figure S1).
Transcription Factor (TF) Activity
The rice genome is known to have 1772 TFs that generally falls under the family of WRKY, DREB, CBF, MYB, bZIP, ERF, zinc-finger, helix-loop-helix, and NAC (Sreenivasulu and Miranda, 2004; Duque et al., 2013). Of the negatively expressed transcripts for shoot Na+/K+, 81 transcripts were found to significantly enrich the “Transcription factor activity” (Table 6 and Table S4a2). The four bZip family TFs (Os01g0542700 encoding OsbZIP4, Os03g0770000 encoding OsbZIP32, Os08g0543900 encoding OsbZIP68, and Os11g0154800) that were found to be salt responsive in this study have not been reported before. Some of the identified salt and drought responsive bZIP proteins are OzBZ8 (Mukherjee et al., 2006), OsbZIP15 (Zou et al., 2008), OsbZIP23 (Xiang et al., 2008), OsbZIP46 (Tang et al., 2012), OzAREB1 (Jin et al., 2010), and OsbZIP16 (Chen et al., 2012).
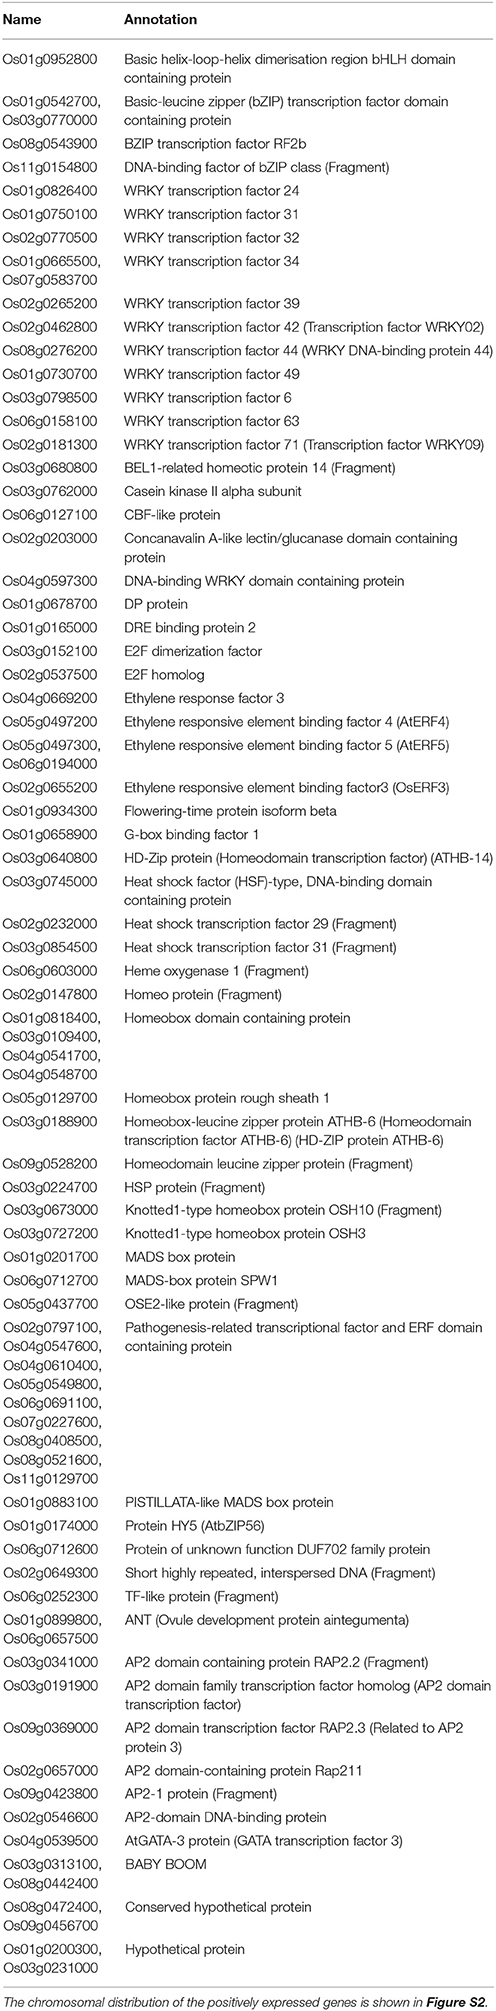
Table 6. Lists of significant transcripts (for shoot Na+/K+) that are involved in transcription factor activity as determined by the Singular Enrichment Analysis (SEA).
Among the 70 identified WRKY genes in rice and Arabidopsis (Goff et al., 2002; Dong et al., 2003), transcripts of 12 TFs were found to be salt stress responsive in this study (Table 6 and Table S4a2). Of these, OsWRKY6 (Os03g0798500) and OsWRKY42 (Os02g0462800) were found to be low phosphorus (Chen et al., 2009) and low boron (Kasajima et al., 2010) responsive, OsWRKY24 (Os01g0826400) stress responsive (Wei et al., 2013); OsWRKY34 (Os01g0665500 and Os07g0583700) cold responsive (Zou et al., 2010); OsWRKY34 (Os02g0265200) heat responsive; all in Arabidopsis (Li et al., 2010). However, the TFs WRKY31 (Os01g0750100), WRKY32 (Os02g0770500), WRKY44 (Os08g0276200), WRKY49 (Os01g0730700), WRKY63 (Os06g0158100), and WRKY71 (Os02g0181300) were not reported earlier.
The other important TFs found to be salt responsive in this study include CBF like protein, E2F protein, ethylene responsive TFs, heat shock, and MADS-box proteins and AP2 domain containing proteins (Table 6 and Table S4a2). Chromosome 1, 2, and 3 contain most of the genes while no genes were located in chromosome 10 and 12 (Figure S2). Some of these TFs are reported to play roles in abiotic and biotic stress tolerance in rice and other crops; however, a detailed investigation of the previously unidentified TFs will provide valuable information in explaining salinity tolerance mechanisms in rice.
Translation Factor Activity
The regulation of translation, that facilitates the selective synthesis of required proteins, is one of the versatile strategies plants have evolved to cope with the environmental stresses. Generally, in eukaryotes, eukaryotic initiation factor (eIF4E) recognizes the 5′-cap structure of mRNAs to begin the canonical cap-dependent translation. The eIF4G and eIF4A then interacts with eIF4E to form the eIF4F (cap-binding complex) and the factors eIF4B, eIF3, eIF1, and eIF1A are subsequently recruited that ultimately regulates translation (Echevarría-Zomeño et al., 2013). Under stresses, the eukaryotic cells usually inhibit this translation initiation that affects the activity of initiation factor eIF2 and eIF4E, a mechanism mainly unknown in plants (Wek et al., 2006; Muñoz and Castellano, 2012). In this study, among the significantly positively and negatively expressed genes, 36 and 26 genes, respectively were found to enrich the translation factor activity (Table 7, Table S4a2; Figure S3).
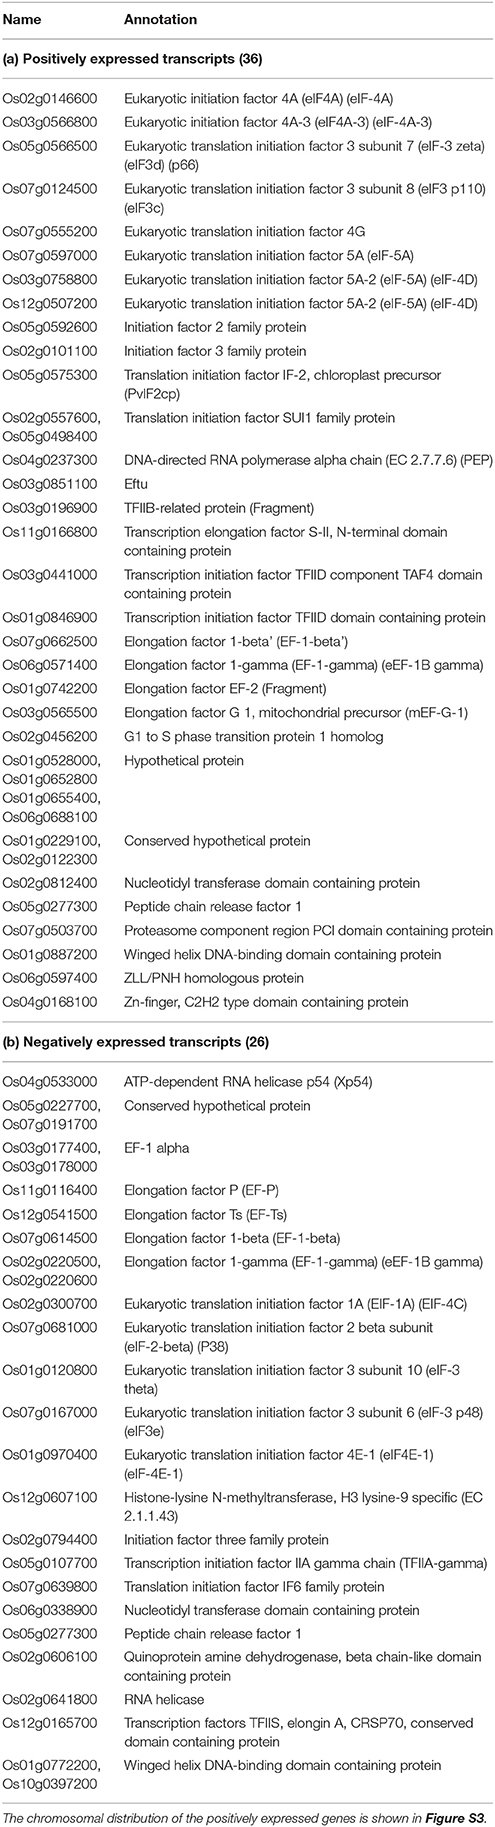
Table 7. Lists of positively (a) and negatively (b) expressed transcripts (for shoot Na+/K+) that significantly enriched the translation factor activity in wide natural variation of rice genotypes.
Among the up-regulated genes the most noticeable fall under the category of translation initiation factors such as Os02g0146600 (eIF4A), Os03g0566800 (eIF4A-3), Os05g0566500 (eIF-3 zeta), Os07g0124500 (eIF3 p110), Os07g0555200 (eIF4G), Os07g0597000 (eIF-5A), Os03g0758800, and Os12g0507200 (eIF-5A) (eIF-4D), Os05g0592600 (eIF 2 family protein), Os02g0101100 (eIF 3 family protein) and Os02g0557600, and Os05g0498400 (IF SUI1 family protein); transcription elongation factors such as Os03g0196900 (TFIIB), Os11g0166800 (TFS-II), Os03g0441000 and Os01g0846900 (TFIID), Os07g0662500 (EF-1-beta'), Os06g0571400 (EF-1-gamma), Os01g0742200 (EF-2), and Os03g0565500(mEF-G-1) etc.
Several elongation factors e.g., Os03g0177400 and Os03g0178000 (EF-1 α), Os11g0116400 (EF-P), Os12g0541500 (EF-Ts), Os07g0614500 (EF-1-beta), and Os02g0220500 and Os02g0220600 (EF-1-gamma) etc., and several translation initiation factors e.g., Os02g0300700 (EIF-1A), Os07g0681000 (eIF-2-beta) (P38), Os01g0120800 (eIF-3 theta), Os07g0167000 (eIF-3 p48), Os01g0970400 (eIF4E-1), Os02g0794400 (IF-3 family protein), Os05g0107700 (TFIIA-gamma), and Os07g0639800 (IF6 family protein) etc., were also found to be negatively expressed.
SNAP Receptor and Chaperone Activity
SNAP receptor activity is regulated by a super family of proteins known as SNAREs [soluble N-ethylmaleimide-sensitive factor (NSF) attachment protein receptors] that act as a marker to identify a membrane and selectively interact with SNAREs on other membrane surfaces to mediate membrane fusion thus providing a continuous flux of membranes via transport vesicles. This vesicle traffic is believed to be involved in cell homeostasis, growth, and development of plants (Tyrrell et al., 2007; Kim and Brandizzi, 2012). In this study, among the genes that are negatively expressed for shoot Na/K, six genes that significantly enriched the SNAP receptor activity in wide rice genotypes under salt stress were identified (Table S4a2). The bet like SNARE- AtBS14a (Os02g0820700 and Os08g0563300) that were found to be significant was reported to control cell growth in Arabidopsis (Tai and Banfield, 2001). The syntaxin identified is AtSYP52 (encoded by Os02g0119400) was very recently described to act as t-SNARE when distributed in membrane TGN/PVC and plays a putative inhibitory role when present on the tonoplast in Arabidopsis (Benedictis et al., 2013). Another syntexin, OSM1/SYP61, was also reported to be involved in osmotic stress tolerance in Arabidopsis (Zhu et al., 2002). However, three other syntexins encoded by Os07g0164300, Os01g0254900, and Os06g0168500 that were found to be significant in this study might be novel syntexin and it would be of interest to know their specific role in future.
Chaperones are proteins involved in non-covalent folding or unfolding of other proteins and are believed to be expressed in response to high temperature and other cellular stresses. Yamada et al. (2002) identified a cytosolic chaperonin-containing TCP-1α (CCTα) homolog that displayed enhanced salt tolerance in the mangrove plant, Bruguiera sexangula. In this study, six transcripts that significantly enriched chaperone binding activity under salt stress were identified. These are GrpE type 2 (Os08g0338700), GrpE protein family protein (Os04g0431100 and Os09g0284400), DRF2 (Os12g0456200) and one protein of unknown function (Os12g0456200) and another conserved hypothetical protein (Table S4a2).
Interacting Network of Genes under Salt Stress
The interactive networks analysis of all the significant genes (in total 578), as determined by SEA, revealed two networks (Figure 2). In the larger network, LOC_Os03g08050 (Os03g0177400) seemed to be the central protein which encodes for “Protein elongation factor (EF-1 alpha).” Most of the proteins in this network seem to be localized mainly in nucleus (blue), cytoplasm (pink), and mitochondria (light blue) and encode mainly for the translation factors such as LOC_Os02g56740 (protein translation initiation factor eIF-2B subunit epsilon, LOC_Os05g51500 (protein eukaryotic translation initiation factor 5B), LOC_Os07g44620 (protein eukaryotic translation initiation factor 6), LOC_Os05g41900 (protein translation initiation factor SUI1), LOC_Os02g19770 (protein eukaryotic translation initiation factor 1A), LOC_Os07g36940 (protein eukaryotic translation initiation factor 4G) etc., and transcription factors such as LOC_Os06g14190 (protein NF-X1-type zinc finger protein). On the contrary, only a few proteins are located in the chloroplast (green) and plasma membrane (brown) and vacuole (yellow). The proteins localized in the chloroplast (green) are mainly catalytic proteins such as LOC_Os12g13390 (protein aspartyl aminopeptidase, putative), LOC_Os01g13190 (protein histidinol dehydrogenase, chloroplast precursor), LOC_Os02g10120 (protein lipoxygenase) and LOC_Os07g42180 (protein exportin 1). Proteins expressed in the vacuole includes LOC_Os06g23160 (protein bacterial transferase hexapeptide domain containing protein), LOC_Os01g12870 (protein eukaryotic translation initiation factor 3 subunit E-interacting protein), and LOC_Os02g39350 (protein eukaryotic translation initiation factor 2A) etc.
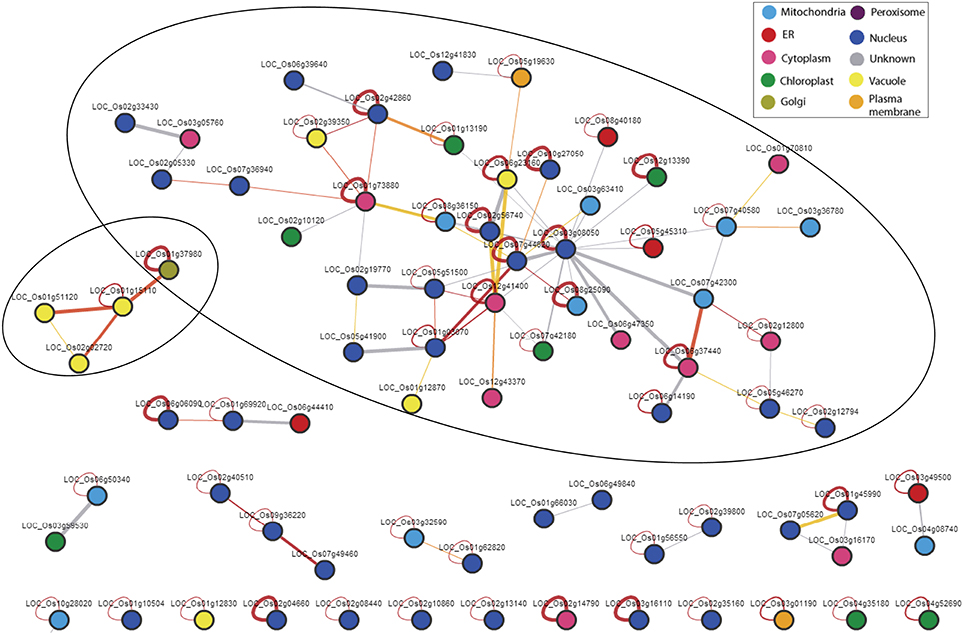
Figure 2. Regulatory networks of all the 578 genes that significantly enriched the molecular functional categories under salt stress in wide natural variation of rice genotypes. The web based tool “Rice Interactions Viewer” (http://bar.utoronto.ca/interactions/cgi-bin/rice_interactions_viewer.cgi) were used to predict the interactions.
In the smaller network, all the proteins are SNAREs type proteins (SNAP receptor activity) with three localized in the vacuole encoding syntaxin (LOC_Os01g15110), vesicle transport v-SNARE protein (LOC_Os01g51120), and SNARE domain containing protein (LOC_Os02g02720) and one localized in the plasma membrane encoding vesicle transport v-SNARE protein (LOC_Os01g37980).
These finding probably points toward the hypothesis that in the wide natural gene pool, transcription and translation factor genes are the main regulators under salt stress and these genes are probably the initial defense response that co-regulates in an interactive manner which ultimately cascades to induce the downstream genes that are essential for adaptation to environmental stresses.
Conclusion
The genes that are identified here provide a synergistic global salinity response picture representing the mechanisms that are active in the wide natural variation of rice genotypes which may not be referred back to individual genotypes in the context of this study (as gene expression responses of all the genotypes were analyzed together) but might be of interest to look at their specific role in individual rice genotypes in future. Besides, the gene expression profile of these genes in different cell or tissue types may also needed to be studied in a way to verify the pathways they are involved in via in situ analysis that will help to better understand their roles in salinity tolerance mechanism. Nonetheless, the products of these genes may hold the key to the evolutionary adaptive mechanism to cope with saline environments. Several of the identified genes were reported before either in rice or in other crop species, however, the novel genes and the genes with unknown function may enhance our understanding of stress adaptation once the role of these genes are functionally verified.
Author Contributions
MH, GB, JP, and BF jointly conceptualized and designed the project. MH has conducted all experiments, generated, and analyzed the data and prepared the draft script. GS helped in lab work, analysis and in finalizing the draft. JP, GB, and BL supervised the work, interpreted the results, and finalized the manuscript.
Conflict of Interest Statement
The authors declare that the research was conducted in the absence of any commercial or financial relationships that could be construed as a potential conflict of interest.
Acknowledgments
This research and MRH was sponsored by The Commonwealth Scholarship Commission in the United Kingdom. GWB was supported by BBSRC grants BB/L010232/1, BB/J017604/1 and BB/N009754/1. We thank Dr. Glenn Gregorio and Flora de Guzman (IRRI) for providing the rice seeds and Dr. Gillian Kingston (Facility for Environmental Nanoscience Analysis and Characterization, the University of Birmingham, UK) for technical assistance with the ion analysis and the Genomic Services Facility team of the University of Birmingham, UK for their support during the entire processes of microarray experiment.
Supplementary Material
The Supplementary Material for this article can be found online at: http://journal.frontiersin.org/article/10.3389/fpls.2016.00567
Figure S1. The chromosomal distribution of the 107 positively expressed genes across the 12 chromosomes that significantly enriched the “signal transducer activity.” The chromosome map is obtained by submitting the list of genes to the web based “Chromosome Map Tool” http://viewer.shigen.info/oryzavw/maptool/MapTool.do (see Materials and Methods Section for details).
Figure S2. The chromosomal distribution of the 81 negatively expressed genes across the 12 chromosomes that significantly enriched the “transcription factor activity”.
Figure S3. The chromosomal distribution of the 36 positively (A) and 26 negatively (B) expressed genes for shoot Na/K that significantly enriched translation factor activity in wide natural rice genotypes under salt stress.
Table S1. (a–n) Positively and negatively regulated significant probes for each of the 14 morpho-physiological traits in the eight rice genotypes representing wide natural variation in terms of salinity tolerance and genetic diversity under unstressed condition determined by Significance Analysis of Microarrays (SAM). Significant probes were selected based on the criteria of FDR <5% (q-value) and fold score >2.0 (d) and are presented along with the corresponding Locus ID and annotation.
Table S2. (a–n) Positively and negatively regulated significant probes for each of the 14 morpho-physiological traits in the eight rice genotypes representing wide natural variation in terms of salinity tolerance and genetic diversity under stressed condition determined by Significance Analysis of Microarrays (SAM). Significant probes were selected based on the criteria of FDR <5% (q-value) and fold score >2.0 (d) and are presented along with the corresponding Locus ID and annotation.
Table S3. Lists of probes along with the corresponding functional annotation and fold scores that commonly regulated for the trait Biomass under unstressed and stressed conditions in wide natural variation of rice genotypes.
Table S4. Lists of significant GO categories of molecular functions and biological processes along with GO terms, p-values, FDR values, GO flash charts and schematic diagrams under unstressed condition for differentially regulated (positive and negative) genes for different morpho-physiological traits (determined by SEA analysis).
Table S5. Lists of significant GO categories of molecular functions and biological processes along with GO terms, p-values, FDR values, GO flash charts and schematic diagrams under stressed condition for differentially regulated (positive and negative) genes for different morpho-physiological traits (determined by SEA analysis).
References
Achard, P., Cheng, H., De Grauwe, L., Decat, J., Schoutteten, H., Moritz, T., et al. (2006). Integration of plant responses to environmentally activated phytohormonal signals. Science 311, 91–94. doi: 10.1126/science.1118642
Aya, K., Suzuki, G., Suwabe, K., Hobo, T., Takahashi, H., Shiono, K., et al. (2011). Comprehensive network analysis of anther-expressed genes in rice by the combination of 33 laser microdissection and 143 spatiotemporal microarrays. PLoS ONE 6:e26162. doi: 10.1371/journal.pone.0026162
Benedictis, M., Bleve, G., Faraco, M., Stigliano, E., Grieco, F., Piro, G., et al. (2013). AtSYP51/52 functions diverge in the post-golgi traffic and differently affect vacuolar sorting. Mol. Plant 6, 916–930. doi: 10.1093/mp/sss117
Cao, W. H., Liu, J., Zhou, Q. Y., Cao, Y. R., Zheng, S. F., Du, B. X., et al. (2006). Expression of tobacco ethylene receptor NTHK1 alters plant responses to salt stress. Plant Cell Environ. 29, 1210–1219. doi: 10.1111/j.1365-3040.2006.01501.x
Chen, H., Chen, W., Zhou, J. L., He, H., Chen, L. B., Chen, H. D., et al. (2012). Basic leucine zipper transcription factor OsbZIP16 positively regulates drought resistance in rice. Plant Sci. 193, 8–17. doi: 10.1016/j.plantsci.2012.05.003
Chen, Y. F., Li, L. Q., Xu, Q., Kong, Y. H., Wang, H., and Wu, W. H. (2009). The WRKY6 transcription factor modulates PHOSPHATE1 expression in response to low Pi stress in Arabidopsis. Plant Cell 21, 3554–3566. doi: 10.1105/tpc.108.064980
Cheng, Y., Qi, Y., Zhu, Q., Chen, X., Wang, N., Zhao, X., et al. (2009). New changes in the plasma-membrane-associated proteome of rice roots under salt stress. Proteomics 9, 3100–3114. doi: 10.1002/pmic.200800340
Clarke, B., and Rahman, S. (2005). A microarray analysis of wheat grain hardness. Theor. Appl. Genet. 110, 1259–1267. doi: 10.1007/s00122-005-1962-3
Close, T. J., and Wanamaker, S. I. (2004). A new resource for cereal genomics: 22K barley GeneChip comes of age. Plant Physiol. 134, 960–968. doi: 10.1104/pp.103.034462
Cotsaftis, O., Plett, D., Johnson, A. A. T., Walia, H., Wilson, C., Ismail, A. M., et al. (2011). Root-specific transcript profiling of contrasting rice genotypes in response to salinity stress. Mol. Plant 4, 25–41. doi: 10.1093/mp/ssq056
Davidson, A. L., Dassa, E., Orelle, C., and Chen, J. (2008). Structure, function, and evolution of bacterial ATP-binding cassette systems. Microbiol. Mol. Biol. R. 72, 317–364. doi: 10.1128/MMBR.00031-07
Dong, J., Chen, C., and Chen, Z. (2003). Expression profiles of the Arabidopsis WRKY gene superfamily during plant defense response. Plant Mol. Biol. 51, 21–37. doi: 10.1023/A:1020780022549
Du, Z., Zhou, X., Ling, Y., Zhang, Z. H., and Su, Z. (2010). agriGO: a GO analysis toolkit for the agricultural community. Nucleic Acids Res. 38, W64–W70. doi: 10.1093/nar/gkq310
Duque, A. S., Almeida, A. M., De Silva, A. B., Da Silva, J. M., Farinha, A. P., Santos, D., et al. (2013). “Abiotic stress responses in plants: unraveling the complexity of genes and networks to survive,” in Abiotic Stress - Plant Responses and Applications in Agriculture, eds K. Vahdati and C. Leslie (Rijeka: InTech), 3–23. doi: 10.5772/52779
Echevarría-Zomeño, S., Yángüez, E., Fernández-Bautista, N., Castro-Sanz, A., Ferrando, A., and Castellano, M. (2013). Regulation of translation initiation under biotic and abiotic stresses. Int. J. Mol. Sci. 14, 4670–4683. doi: 10.3390/ijms14034670
Feder, M. E., and Walser, J. C. (2005). The biological limitations of transcriptomics in elucidating stress and stress responses. J. Evol. Biol. 18, 901–910. doi: 10.1111/j.1420-9101.2005.00921.x
Flowers, T. J., and Colmer, T. D. (2008). Salinity tolerance in halophytes. New Phytol. 179, 945–963. doi: 10.1111/j.1469-8137.2008.02531.x
Fujita, M., Fujita, Y., Noutoshi, Y., Takahashi, F., Narusaka, Y., Yamaguchi-Shinozaki, K., et al. (2006). Crosstalk between abiotic and biotic stress responses: a current view from the points of convergence in the stress signaling networks. Curr. Opin. Plant Biol. 9, 436–442. doi: 10.1016/j.pbi.2006.05.014
Goff, S. A., Ricke, D., Lan, T. H., Presting, G., Wang, R., Dunn, M., et al. (2002). A draft sequence of the rice genome (Oryza sativa L. ssp. Japonica). Science 296, 92–100. doi: 10.1126/science.1068275
Horie, T., and Karahara, I. (2012). Salinity tolerance mechanisms in glycophytes: an overview with the central focus on rice plants. Rice 5:11. doi: 10.1186/1939-8433-5-11
Hossain, M. R., Pritchard, J., and Ford-Lloyd, B. V. (2015a). Qualitative and quantitative variation in the mechanisms of salinity tolerance determined by multivariate assessment of diverse rice (Oryza sativa L.) genotypes. Plant Genet. Resour. 1, 1–10. doi: 10.1017/S1479262115000118
Hossain, M. R., Vickers, L., Sharma, G., Livermore, T., Pritchrad, J., and Ford-Lloyd, B. (2015b). “Salinity tolerance in plants: insights from transcriptomics studies,” in Managing Salt Tolerance in Plants: Molecular and Genomic Perspectives, eds S. H. Wani and M. A. Hossain (CRC Press: Taylor & Francis Group), 407–426.
Hossain, M. R. (2014). Salinity Tolerance and Transcriptomics in Rice. Ph.D. Thesis, University of Birmingham. Available online at: http://etheses.bham.ac.uk/5092/
Huang, D. W., Sherman, B. T., and Lempicki, R. A. (2009). Bioinformatics enrichment tools: paths toward the comprehensive functional analysis of large gene lists. Nucleic Acids Res. 37, 1–13. doi: 10.1093/nar/gkn923
Huang, G. T., Ma, S. L., Bai, L. P., Zhang, L., Ma, H., Jia, P., et al. (2012). Signal transduction during cold, salt, and drought stresses in plants. Mole. Biol. Rep. 39, 969–987. doi: 10.1007/s11033-011-0823-1
Jin, X. F., Xiong, A. S., Peng, R. H., Liu, J. G., Gao, F., Chen, J. M., et al. (2010). OsAREB1, an ABRE-binding protein responding to ABA and glucose, has multiple functions in Arabidopsis. BMB Rep. 43, 34–39. doi: 10.5483/BMBRep.2010.43.1.034
Kang, J., Hwang, J. U., Lee, M., Kim, Y. Y., Assmann, S. M., Martinoia, E., et al. (2010). PDR-type ABC transporter mediates cellular uptake of the phytohormone abscisic acid. Proc. Natl. Aca. Sci. U.S.A. 107, 2355–2360. doi: 10.1073/pnas.0909222107
Kasajima, I., Ide, Y., Hirai, M. Y., and Fujiwara, T. (2010). WRKY6 is involved in the response to boron deficiency in Arabidopsis thaliana. Physiol. Plant. 139, 80–92. doi: 10.1111/j.1399-3054.2010.01349.x
Kim, S. J., and Brandizzi, F. (2012). News and views into the SNARE complexity in Arabidopsis. Front. Plant. Sci. 3:28. doi: 10.3389/fpls.2012.00028
Kumari, M., Taylor, G. J., and Deyholos, M. K. (2008). Transcriptomic responses to aluminum stress in roots of Arabidopsis thaliana. Mol. Genet. Genom. 279, 339–357. doi: 10.1007/s10142-008-0088-5
Langridge, P., and Fleury, D. (2011). Making the most of ‘omics’ for crop breeding. Trends Biotechnol. 29, 33–40. doi: 10.1016/j.tibtech.2010.09.006
Li, S., Zhou, X., Chen, L., Huang, W., and Yu, D. (2010). Functional characterization of Arabidopsis thaliana WRKY39 in heat stress. Mol. Cells 29, 475–483. doi: 10.1007/s10059-010-0059-2
Lorenzo, L., Merchan, F., Laporte, P., Thompson, R., Clarke, J., Sousa, C., et al. (2009). A novel plant leucine-rich repeat receptor kinase regulates the response of Medicago truncatula roots to salt stress. Plant Cell 21, 668–680. doi: 10.1105/tpc.108.059576
Marshall, A., Aalen, R. B., Audenaert, D., Beeckman, T., Broadley, M. R., Butenko, M. A., et al. (2012). Tackling drought stress: receptor-Like kinases present new approaches. Plant Cell 24, 2262–2278. doi: 10.1105/tpc.112.096677
Martinoia, E., Klein, M., Geisler, M., Bovet, L., Forestier, C., Kolukisaoglu, U., et al. (2002). Multifunctionality of plant ABC transporters–more than just detoxifiers. Planta 214, 345–355. doi: 10.1007/s004250100661
Mochida, K., and Shinozaki, K. (2011). Advances in omics and bioinformatics tools for systems analyses of plant functions. Plant Cell Physiol. 52, 2017–2038. doi: 10.1093/pcp/pcr153
Mukherjee, K., Choudhury, A., Gupta, B., Gupta, S., and Sengupta, D. (2006). An ABRE-binding factor, OSBZ8, is highly expressed in salt tolerant cultivars than in salt sensitive cultivars of Indica rice. BMC Plant Biol. 6:18. doi: 10.1186/1471-2229-6-18
Munns, R., James, R. A., and Lauchli, A. (2006). Approaches to increasing the salt tolerance of wheat and other cereals. J. Exp. Bot. 57, 1025–1043. doi: 10.1093/jxb/erj100
Munns, R., and Tester, M. (2008). Mechanisms of salinity tolerance. Annu. Rev. Plant Biol. 59, 651–681. doi: 10.1146/annurev.arplant.59.032607.092911
Muñoz, A., and Castellano, M. M. (2012). Regulation of translation initiation under abiotic stress conditions in plants: is it a conserved or not so conserved process among eukaryotes? Comp. Func. Genom. 2012:406357. doi: 10.1155/2012/406357
Otsuki, L., Cheetham, S. W., and Brand, A. H. (2014). Freedom of expression: cell-type-specific gene profiling. Wiley Interdiscip. Rev. Dev. Biol. 3, 429–443. doi: 10.1002/wdev.149
Ouyang, S. Q., Liu, Y. F., Liu, P., Lei, G., He, S. J., Ma, B., et al. (2010). Receptor-like kinase OsSIK1 improves drought and salt stress tolerance in rice (Oryza sativa) plants. Plant J. 62, 316–329. doi: 10.1111/j.1365-313X.2010.04146.x
Proietti, S., Bertini, L., Timperio, A. M., Zolla, L., Caporale, C., and Caruso, C. (2013). Crosstalk between salicylic acid and jasmonate in Arabidopsis investigated by an integrated proteomic and transcriptomic approach. Mol. Biosyst. 9, 1169–1187. doi: 10.1039/c3mb25569g
Rea, P. A. (1999). MRP subfamily ABC transporters from plants and yeast. J. Exp. Bot. 50, 895–913. doi: 10.1093/jxb
Senadheera, P., Singh, R. K., and Maathuis, F. J. M. (2009). Differentially expressed membrane transporters in rice roots may contribute to cultivar dependent salt tolerance. J. Exp. Bot. 60, 2553–2563. doi: 10.1093/jxb/erp099
Shelden, M. C., and Roessner, U. (2013). Advances in functional genomics for investigating salinity stress tolerance mechanisms in cereals. Front. Plant. Sci. 4:123. doi: 10.3389/fpls.2013.00123
Sinha, A. K., Jaggi, M., Raghuram, B., and Tuteja, N. (2011). Mitogen-activated protein kinase signaling in plants under abiotic stress. Plant Signal. Behav. 6, 196–203. doi: 10.4161/psb.6.2.14701
Sreenivasulu, N., and Miranda, M. (2004). Transcriptome changes in foxtail millet genotypes at high salinity: identification and characterization of a PHGPX gene specifically up-regulated by NaCl in a salt-tolerant line. J. Plant Physiol. 161, 467–477. doi: 10.1078/0176-1617-01112
Tai, W. C., and Banfield, D. K. (2001). AtBS14a and AtBS14b, two Bet1/Sft1-like SNAREs from Arabidopsis thaliana that complement mutations in the yeast SFT1 gene. FEBS Lett. 500, 177–182. doi: 10.1016/S0014-5793(01)02599-6
Tanaka, H., Osakabe, Y., Katsura, S., Mizuno, S., Maruyama, K., Kusakabe, K., et al. (2012). Abiotic stress-inducible receptor-like kinases negatively control ABA signaling in Arabidopsis. Plant J. 70, 599–613. doi: 10.1111/j.1365-313X.2012.04901.x
Tang, N., Zhang, H., Li, X. H., Xiao, J. H., and Xiong, L. Z. (2012). Constitutive activation of transcription factor OsbZIP46 improves drought tolerance in rice. Plant Physiol. 158, 1755–1768. doi: 10.1104/pp.111
Taylor-Teeples, M., Ron, M., and Brady, S. M. (2011). Novel biological insights revealed from cell type-specific expression profiling. Curr. Opin. Plant Biol. 14, 601–607. doi: 10.1016/j.pbi.2011.05.007
Tusher, V. G., Tibshirani, R., and Chu, G. (2001). Significance analysis of microarrays applied to the ionizing radiation response. Proc. Natl. Acad. Sci. U.S.A. 98, 5116–5121. doi: 10.1073/pnas.091062498
Tyrrell, M., Campanoni, P., Sutter, J. U., Pratelli, R., Paneque, M., Sokolovski, S., et al. (2007). Selective targeting of plasma membrane and tonoplast traffic by inhibitory (dominant-negative) SNARE fragments. Plant J. 51, 1099–1115. doi: 10.1111/j.1365-313X.2007.03206.x
Ueda, A., Kathiresan, A., Bennett, J., and Takabe, T. (2006). Comparative transcriptome analyses of barley and rice under salt stress. Theor. Appl. Genet. 112, 1286–1294. doi: 10.1007/s00122-006-0231-4
Walia, H., and Wilson, C. (2007). Genome-wide transcriptional analysis of salinity stressed Japonica and Indica rice genotypes during panicle initiation stage. Plant Mol. Biol. 63, 609–623. doi: 10.1007/s11103-006-9112-0
Walia, H., and Wilson, C. (2009). Comparing genomic expression patterns across plant species reveals highly diverged transcriptional dynamics in response to salt stress. BMC Genomics 10:398. doi: 10.1104/pp.105.065961
Walia, H., Wilson, C., Condamine, P., Liu, X., Ismail, A. M., Zeng, L., et al. (2005). Comparative transcriptional profiling of two contrasting rice genotypes under salinity stress during the vegetative growth stage. Plant Physiol. 139, 822–835. doi: 10.1104/pp.105.065961
Wang, H., Miyazaki, S., Kawai, K., Deyholos, M., Galbraith, D. W., and Bohnert, H. J. (2003). Temporal progression of gene expression responses to salt shock in maize roots. Plant. Mol. Biol. 52, 873–891. doi: 10.1023/A:1025029026375
Wei, T., Ou, B., Li, J., Zhao, Y., Guo, D., Zhu, Y., et al. (2013). Transcriptional profiling of rice early response to magnaporthe oryzae identified OsWRKYs as important regulators in rice blast resistance. PLoS ONE 8:e59720. doi: 10.1371/journal.pone.0059720
Wek, R. C., Jiang, H. Y., and Anthony, T. G. (2006). Coping with stress: eIF2 kinases and translational control. Biochem. Soc. Trans. 34, 7–11. doi: 10.1042/BST0340007
Wu, D., Cai, S., Chen, M., Ye, L., Chen, Z., Zhang, H., et al. (2013). Tissue metabolic responses to salt stress in wild and cultivated barley. PLoS ONE 8:e55431. doi: 10.1371/journal.pone.0055431
Xiang, Y., Tang, N., Du, H., Ye, H. Y., and Xiong, L. Z. (2008). Characterization of OsbZIP23 as a key player of the basic leucine zipper transcription factor family for conferring abscisic acid sensitivity and salinity and drought tolerance in rice. Plant Physiol. 148, 1938–1952. doi: 10.1104/pp.108.128199
Yamada, A., Sekiguchi, M., Mimura, T., and Ozeki, Y. (2002). The role of plant CCTα in salt- and osmotic-stress tolerance. Plant Cell Physiol. 43, 1043–1048. doi: 10.1093/pcp/pcf120
Zhao, J., Sun, Z., Zheng, J., Guo, X., Dong, Z., Huai, J., et al. (2009). Cloning and characterization of a novel CBL-interacting protein kinase from maize. Plant Mol. Biol. 69, 661–674. doi: 10.1007/s11103-008-9445-y
Zhu, J., Gong, Z., Zhang, C., Song, C. P., Damsz, B., Inan, G., et al. (2002). OSM1/SYP61: a syntaxin protein in Arabidopsis controls abscisic acid-mediated and non-abscisic acid-mediated responses to abiotic stress. Plant Cell 14, 3009–3028. doi: 10.1093/jxb/erq204
Zou, C. S., Jiang, W. B., and Yu, D. Q. (2010). Male gametophyte-specific WRKY34 transcription factor mediates cold sensitivity of mature pollen in Arabidopsis. J. Exp. Bot. 61, 3901–3914. doi: 10.1093/jxb/erq204
Keywords: transcriptomics, significance analysis of microarrays (SAM), rice, salt tolerance, gene ontology enrichment, regulatory network
Citation: Hossain MR, Bassel GW, Pritchard J, Sharma GP and Ford-Lloyd BV (2016) Trait Specific Expression Profiling of Salt Stress Responsive Genes in Diverse Rice Genotypes as Determined by Modified Significance Analysis of Microarrays. Front. Plant Sci. 7:567. doi: 10.3389/fpls.2016.00567
Received: 29 December 2015; Accepted: 12 April 2016;
Published: 03 May 2016.
Edited by:
Shabir Hussain Wani, Sher-e-Kashmir University of Agricultural Sciences & Technology of Kashmir, IndiaReviewed by:
Taras P. Pasternak, Institut für Biologie II, GermanyTofazzal Islam, Bangabandhu Sheikh Mujibur Rahman Agricultural University, Bangladesh
Copyright © 2016 Hossain, Bassel, Pritchard, Sharma and Ford-Lloyd. This is an open-access article distributed under the terms of the Creative Commons Attribution License (CC BY). The use, distribution or reproduction in other forums is permitted, provided the original author(s) or licensor are credited and that the original publication in this journal is cited, in accordance with accepted academic practice. No use, distribution or reproduction is permitted which does not comply with these terms.
*Correspondence: Mohammad R. Hossain, m.r.hossain@bau.edu.bd