 Dany P. Moualeu-Ngangue
 Tsu-Wei Chen
 Hartmut Stützel
- 1Vegetable Systems Modelling Section, Institute of Horticultural Production Systems, Leibniz Universität Hannover, Hannover, Germany
- 2UMR759 Laboratoire d'Ecophysiologie des Plantes sous Stress Environnementaux, Institut National de la Recherche Agronomique, Montpellier, France
Water use efficiency (WUE) is considered as a determinant of yield under stress and a component of crop drought resistance. Stomatal behavior regulates both transpiration rate and net assimilation and has been suggested to be crucial for improving crop WUE. In this work, a dynamic model was used to examine the impact of dynamic properties of stomata on WUE. The model includes sub-models of stomatal conductance dynamics, solute accumulation in the mesophyll, mesophyll water content, and water flow to the mesophyll. Using the instantaneous value of stomatal conductance, photosynthesis, and transpiration rate were simulated using a biochemical model and Penman-Monteith equation, respectively. The model was parameterized for a cucumber leaf and model outputs were evaluated using climatic data. Our simulations revealed that WUE was higher on a cloudy than a sunny day. Fast stomatal reaction to light decreased WUE during the period of increasing light (e.g., in the morning) by up to 10.2% and increased WUE during the period of decreasing light (afternoon) by up to 6.25%. Sensitivity of daily WUE to stomatal parameters and mesophyll conductance to CO2 was tested for sunny and cloudy days. Increasing mesophyll conductance to CO2 was more likely to increase WUE for all climatic conditions (up to 5.5% on the sunny day) than modifications of stomatal reaction speed to light and maximum stomatal conductance.
Introduction
Stomata on the leaf surfaces of higher plants control the fluxes of gases between the atmosphere and the leaf mesophyll. Regulation of stomata by guard cells determines the amount of CO2 available for photosynthesis (A) and the amount of water loss through transpiration (E; Lawson et al., 2014). To model the relationship between net assimilation rate and stomatal conductance, several approaches have been developed in the literature. A strong correlation between stomatal conductance and net photosynthesis (Anet) is often observed (Wong et al., 1979; Ball et al., 1987) and modeling this relationship has been attempted (e.g., Hari et al., 1986; Lloyd, 1991; Arneth et al., 2002; Katul et al., 2009; Medlyn et al., 2011; among others; see also Damour et al. (2010) for review of stomatal models). Most of the proposed models of stomata only capture the steady state stomatal conductance, which may occur only exceptionally in natural environments. However, a steady state model is not suitable for evaluating continuous changes in Anet and E which define water use efficiency (WUE; Anet/E, WUE, Hubick et al., 1986).
WUE is one of the traits considered as determinant of yield under water limited conditions and even as a component of crop drought resistance (Blum, 2009). Several studies have reported considerable variations in WUE among crop species (see Ehdaie et al., 1991 and references therein). For steady state conditions, WUE can be determined by gas exchange measurements. However, fluctuations in climatic conditions lead to changes in stomatal conductance and consequently different instantaneous variations of E and Anet. Therefore, WUE varies with fluctuating climate conditions during the course of the day and stomatal behavior. Stomatal behavior is characterized by the speed of aperture/closure and the initial time lag for stomatal response to light stimuli, and related to stomatal morphology, e.g., stomatal size and density (Lawson and Blatt, 2014). For example, modifying stomatal density and stomatal aperture speed might increase chloroplastic CO2 concentration (Cc) and therefore WUE (Merlot et al., 2002; Schlüter et al., 2003; Büssis et al., 2006; Lawson and Blatt, 2014). However, the effect of increasing stomatal density on WUE is still difficult to evaluate and it is still unclear if stomatal speed or stomatal density might be more beneficial for WUE because the magnitude of these effects cannot be easily quantified by experiments. Technically, it is difficult to monitor WUE dynamics due to the variation of stomatal conductance to water vapor (gsw) related to environmental factors. Mathematical modeling of stomatal dynamics was proposed to assess the effects of varying conditions on stomatal behavior (Vialet-Chabrand et al., 2013). The model of Vialet-Chabrand and colleagues includes a steady state target function and parameters quantifying stomatal speed and initial time lag for stomatal response. Replacing the steady state target function by a model of stomatal conductance (e.g., Medlyn et al., 2011) may allow us to quantify the influence of stomatal behavior on Anet and E under fluctuating climatic conditions.
Mesophyll CO2 conductance (gm) is a limiting factor for CO2 diffusion into the chloroplast and represents therefore a limitation for net assimilation with a comparable magnitude with stomatal conductance (Flexas et al., 2008). Although the relationship between gm and WUE under drought stress is still subject to discussion (Hommel et al., 2014), changes in gm were interpreted as adaptation strategy for plants under stress (Warren and Adams, 2006; Aranda et al., 2007). Therefore, genotypes with higher WUE were found to have higher gm. In contrast to stomatal conductance which influences both water loss and carbon gain, the effect of mesophyll conductance might be predomiantly on Anet, thereby, increasing WUE (Flexas et al., 2008).
The aim of this study was to investigate the influence of stomatal behavior and mesophyll CO2 conductance on daily WUE for leaves of a cucumber plant grown under non-stress conditions using a modeling approach. The model includes the Farquhar-von Caemmerer-Berry model of C3 photosynthesis (Farquhar et al., 1980), a steady state target stomata model (Medlyn et al., 2011), dynamics of stomatal reactions to environmental stimuli (Vialet-Chabrand et al., 2013), water transport in the leaf (Guyot et al., 2012; Sack and Scoffoni, 2012; Scoffoni et al., 2012; Caldeira et al., 2014; Tardieu et al., 2015), and a transpiration model (Steppe et al., 2006; Jones, 2013). This model was used to test the following hypotheses: (1) faster stomatal regulation results in a higher WUE, (2) higher stomatal density (quantified by increasing maximum stomatal conductance) leads to a decrease of WUE for all light conditions, and (3) higher mesophyll CO2 conductance increases WUE.
Materials and Methods
Model Description
Variation in mesophyll water content [Wm(t), mol H2O m−2] at time t is modeled as the difference between water influx [Fi(t), mol H2O m−2s−1] and efflux [FO(t), mol H2O m−2s−1]:
At the leaf level, FO(t) can be assumed to equal the transpiration rate [E(t), mol H2O m−2s−1] (Jones, 2013). Fi(t) depends on the difference of water potential between the xylem and the mesophyll (Steppe et al., 2006; Jones, 2013):
where ψx and ψm(t) are the water potentials (MPa) of xylem and mesophyll, respectively, and kx(mol H2O m−2s−1MPa−1) is the xylem and mesophyll, determined by water transport pathways through multiple components, environmental conditions and time of day (Guyot et al., 2012; Sack and Scoffoni, 2012; Scoffoni et al., 2012; Caldeira et al., 2014; Tardieu et al., 2015). For example, the circadian rhythm of hydraulic conductance has a peak in the early morning (Caldeira et al., 2014; Tardieu et al., 2015). The hydraulic conductance kx (mol H2O m−2s−1MPa−1) is modeled as sum of a radiation dependent and a water potential and oscillation dependent component (Caldeira et al., 2014; Tardieu et al., 2015) by:
Where
and
where kx, 0 (g H2O m−2s−1 MPa−1) is the component of xylem hydraulic conductance that depends on irradiance, a and b are empirical constants (g H2O m−2s−1MPa−1). A constant water potential in the xylem sap flow is assumed (ψx = −0.08 MPa). kx, C (g H2O m−2s−1MPa−1) is the oscillation dependent component of the hydraulic conductance. τC = 0.324/15 g H2O m−2s−1 MPa−2 is the sensitivity to the amplitude of ψx, cvf1 = 0.05556 mol g−1 H2O is the conversion factor from g to mole H2O and ψm, r = −0.9 MPa is the mesophyll reference water potential. PPFDlim = 1000 μmol photon m−2 s−1 is the limit PPFD for the plant leaf. Parameters a and b were estimated using the literature (Caldeira et al., 2014; Tardieu et al., 2015). Assuming that the matric and gravitational components of the water potential in the leaf are negligible, ψm(t) can be calculated by the contributions of solute and hydrostatic pressure to water potential, ψs and ψp, respectively:
where Nm (mol solute) is the total amount of dissolved solutes, cvf2 = 55.56 mol L−1 H2O is the conversion factor from liter to mole H2O, R = 8.3145 10−3 L MPa mol−1 K−1 is the gas constant and Tl(t) is the leaf temperature at time t (in K). Wm(t) is the water content in the mesophyll cell at time t (mol H2O m−2). The relationship between hydrostatic pressure and relative cell volume Wm(t)/Wm_max is an approximation deduced from Steudle et al. (1977), where Wm_max is the maximum water content of the mesophyll, Wm(t) is the water content in the mesophyll cell at time t, α (MPa) is the full hydrostatic pressure and ß is a measure of mesophyll elasticity.
Variation of the total amount of dissolved solutes in the mesophyll is given by:
where ci (unit-less) is a factor for ion exchange, and Nxy denotes the solute concentration in the xylem sap (mol solute mol−1 H2O).
The transpiration rate [FO(t), mol m−2s−1] is modeled as a function of leaf temperature (Maes and Steppe, 2012; Jones, 2013; Tardieu et al., 2015):
where ρa = 1.205 103 is air density (g m−3), cp = 1.005 the heat or thermal capacity of air (J g−1 K−1), s is the slope of the curve relating temperature to saturated vapor pressure (kPa K−1), Ta is air temperature (K), λ = 4417 J m−3 is the latent heat of water vaporization, γ = 0.0665 kPa K−1 is the psychrometric constant. rtw = 1/gtw(t) is the total resistance to water vapor transport (s m−2mol−1H2O) and [gtw(t)] is the total conductance to water vapor transport (mol H2O m−2s−1):
where gbw is the boundary layer conductance (mol H2O m−2s−1) and gsw the stomatal conductance to water vapor. δe is the vapor pressure deficit (kPa) defined by:
where hr is the relative humidity of the ambient air (%), a1 = 0.61375 kPa, a2 = 17.502, and a3 = 240°C. The value of −273.16 is required for the conversion from °K to °Celsius. The slope of the curve relating saturated vapor pressure to temperature is therefore defined by:
According to Maes and Steppe (2012) the relation between (Tl − Ta) and raH = 1/gaH, the resistance to diffusive heat transfer to air, is given by:
where Rn (J m−2s−1) is radiation and Gi (J m−2s−1) is soil heat flux which is here assumed to be zero since an individual leaf is considered. The stomatal conductance to water vapor is assumed to be 1.6 times the stomatal conductance to CO2 as usually used in the literature (Medlyn et al., 2002, 2011) where 1.6 is the ratio of the diffusivities of CO2 and water in air. The conductance to diffusive heat transfer to air is related to the boundary layer conductance through the relation gaH = gbH/1.15 where 1.15 is the product of the ratio of the diffusivities of heat and water in the boundary layer (dimensionless). Vialet-Chabrand et al. (2013) proposed a dynamic model to describe the temporal response of stomatal conductance to water vapor, denoted by gsw (mol H2O m−2 s−1) to a change of irradiance over time:
where r0 (mol m−2 s−1) is a parameter describing the initial time lag of gsw after exposure to an environmental stimulus, αg is a time constant (s−1) for increasing or decreasing of gsw and G is the steady-state target value of stomatal conductance to CO2 under the current environmental conditions described by Medlyn et al. (2011) and Chen et al. (2014). Incorporating stomatal response to leaf water potential as presented by Tuzet et al. (2003), the steady state target stomatal conductance G is defined by:
where parameters g0 (mol CO2 m−2s−1) and g1 are species-specific constants of stomatal conductance (for cucumber, 0.009 mol CO2 m−2s−1, and 3.51, respectively, see Chen et al., 2014), Ca is the ambient CO2 concentration at the leaf surface and fψm quantifies the dependency of G to mesophyll water potential (Tuzet et al., 2003). fψm is defined by:
ψr = −0.9 MPa is the reference water potential, sf = 4.9 MPa−1 is an empirical sensitivity parameter of the stomatal reaction to water potential, A (μmol CO2 m−2s−1) is the steady-state net photosynthesis rate, i. e., the minimum of the Rubisco-limited (Ac, μmol CO2 m−2s−1) or RuPB-regeneration-limited (Aj, μmol CO2 m−2s−1) photosynthesis rate (Farquhar et al., 1980):
Here, Γ* is the CO2 compensation point in the absence of dark respiration (43.02 μmol CO2 m−2s−1), Rd is the daytime respiration rate (μmol CO2 m−2s−1), Vcmax (μmol CO2 m−2s−1) is the maximum rate of Rubisco activity at the site of carboxylation, and Km is the effective Michaelis-Menten constant for CO2 assimilation that considers the competitive inhibition by O2 (711 μmol mol−1); J (μmol e−m−2s−1) is the rate of electron transport and Cc (μmol mol−1) is the mole fraction of CO2, which is calculated by:
where gm is mesophyll CO2 conductance (mol CO2 m−2s−1) and Ca is the ambient CO2 concentration (380 μmol mol−1). Therefore, the values of Ac and G are the analytical solutions which satisfy Equations (18–20, 16) at the same time. Replacing Cc from Equation (20) in Equation (18) yields,
As shown by Ögren and Evans (1993), the photosystem II electron transport rate that is used for CO2 fixation and photorespiration, J, is related to the amount of incident photosynthetically active irradiance (Iinc; μmol photons m−2s−1) by:
where Jmax (μmol e− m−2s−1) is the maximum electron transport rate at saturating light levels, θ is a dimensionless convexity factor for the response of J to Iinc, and κ2LL (μmol e− m−2s−1) is the conversion efficiency of Iinc to J at limiting light.
Because Ca, Γ*, and Km are constant, for simplification we set and p2 = Ca + Km. For the sake of simplicity, we also set g0m = g0+gm. Using Equations (18, 20), the steady-state net photosynthesis rate is the solution of the following equation:
where
The RuPB-regeneration-limited photosynthesis rate Aj can be found combining Equations (16, 19, 20), and rearranging the expressions using previous notations and k1 = Ca −Γ* and , it follows that Aj satisfies the following equation:
where
Equations (23, 24) are solved simultaneously in order to determine the value of A. The target photosynthesis rate A always exists since there is always at least one real solution of Equations (23, 24). The current photosynthesis rate is determined from the current stomatal conductance.
Plant Materials for Model Evaluation
Cucumber seeds (Cucumis sativus, cv. Aramon, Rijk Zwaan, De Lier, Netherlands) were sown on 10 June 2014 in rock-wool cubes (36 × 36 × 40 mm) in the greenhouse of the Institute of Horticultural Production Systems, Leibniz Universität Hannover, Germany (52.5°N, 9.7°E). Seven days after sowing, seedlings were transplanted into larger rock-wool cubes (10 × 10 × 6.5 cm) for another 7 days. Plants were cultivated on rock wool slabs (Grodan, Grodania A/S, Hedehusene, Denmark), which were placed on metal gutters. The day/night temperature for heating was set to 22°C day/20°C night. Ventilations opened at 24°C during daytime. Each liter of nutrient solution contained 0.5 g Ferty Basisdünger 2 (Planta GmbH, Regenstauf, Germany, 0.9 mM , 1.5 mM , 2.8 mM K+, 3.0 mM Ca2+, 0.4 mM Mg2+, 0.4 mM H2PO4, as well as adequate amounts of the micronutrients) and extra 0.9 g Ca(NO3)2 was added in the solution (5.5 mM Ca2+ and 11 mM ) after the first fruit set.
Measurements
Sap flow data were collected between 30 and 31 June for model evaluation and between 06 and 07 July 2014 for model validation on a fully expanded leaf of a well-watered cucumber plant. The leaf was located at the upper canopy, positioned toward south-east and not shaded by other leaves. A heat field deformation sensor (HFD) was installed on the petiole of the leaf to monitor the relative water flow through the petiole (Hanssens et al., 2013, 2014) on these days. A quantum sensor (Li190, Li-Cor, Lincoln, USA) of photosynthetically active radiation (PAR) was installed next to the measured leaf in order to capture the PAR intercepted by the leaf. Data of HFD and the quantum sensor were logged every minute. Average air temperature and relative humidity of 12 min in the greenhouse were recorded by sensors installed 2 m above ground, about 2 m from the measured leaf. Leaf temperatures were measured hourly by an infrared camera (E60, FLIR Systems INC, Boston, USA). Leaf water potential (C52-chambers, WESCOR INC, South Logan., USA) and water content were measured every 2 h from 8h00 to 18h00. Since the measurements of water potential and water content were destructive, they were taken on four leaves comparable (leaf age, position, and orientation in the canopy) to the monitored leaf.
Input Data
Climatic data recorded on the 6 and 7 of August 2014, representing a sunny and a cloudy day, respectively (Figure 1), were used as input data. Moreover, to test the effect of rhythmic fluctuation of climatic conditions on WUE, so called “ideal” sunny and cloudy days were simulated. Variation of temperature and radiation during the ideal days was modeled using sinusoidal functions based on Kimball and Bellamy (1986) light and temperature models. The equation defining the light intensity on ideal days is given by:
where Im is the average light intensity during daytime (139 μmol photon m−2 s−1 on the cloudy day, 237 μmol photon m−2 s−1 on the sunny day), Ia (μmol photon m−2 s−1) is the amplitude of the oscillation in light intensity (133.435 on the cloudy day, 137.02 on the sunny day), p is the light fluctuation period and t0 is used to set the initial time point to minimum for the integration. Temperature equations were defined in a similar way and a constant lag of 30 min (observed from recorded data) was kept between light variation and subsequent temperature change. Parameters of the ideal sunny and cloudy days were chosen to ensure that the integrals of radiation and temperature during the sunny day and the cloudy day were equal to the integrals of radiation and temperature on ideal sunny and cloudy days (Figure 1). Using measured data of 06–07/08/2014, a hyperbolic decay function was fitted (r2 = 0.53, P < 0.0001) to describe the relationship between relative humidity and temperature:
which is valid for Ta > 6.3458.
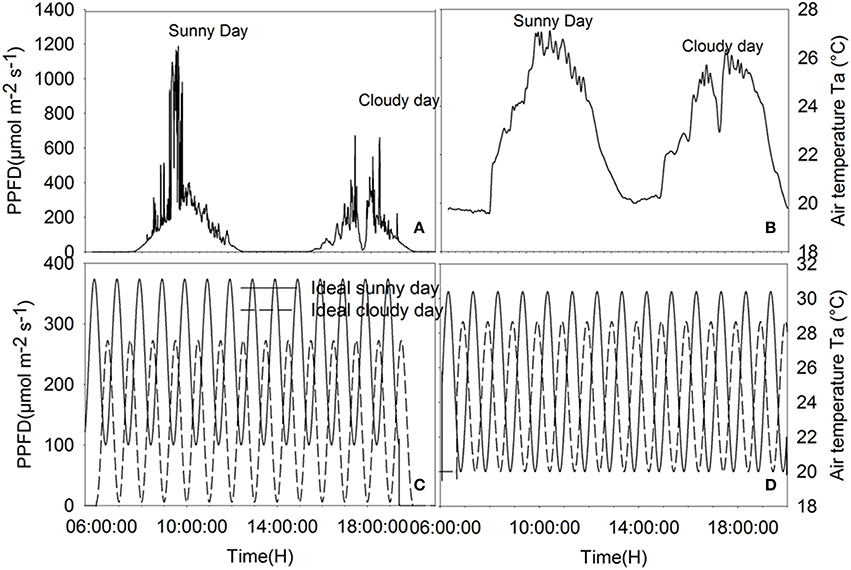
Figure 1. Climatic data of the cloudy, sunny, ideal cloudy, and ideal sunny days. (A) PPFD recorded on 06-07/08/2014, (B) temperature data of recorded on 06-07/08/2014, (C) PPFD on ideal sunny and cloudy days, (D) ambient temperature on ideal cloudy and sunny days. The integral of total radiation and temperature during the sunny and cloudy days are, respectively, equal to the integral of radiation and temperature during the ideal sunny and cloudy days for a solar period of 2, 1 h, 30 and 15 min.
Parameters of the sinusoidal light and temperature models were fitted so that the integrals of radiation and temperature during the sunny and cloudy days were equal to the integrals of radiation and temperature recorded on 6 and 7/08/2014, respectively. Moreover, simulations were also performed with different sinusoidal time periods to estimate the effects of fluctuation frequencies on WUE.
Parameter Fitting
The stomata model was parameterized using measurements with the Li6400-XT portable photosynthesis system (Li-Cor, Lincoln, USA). The leaf was left in darkness for about 30 min, until stomatal conductance was close to zero. Then, PAR was set to 1300 μmol photon m−2 s−1 and values of stomatal conductance were logged every 5 s until reaching stability. With these data, the time constant αg and the initial lag r0 were estimated using Equation (15). Using data of 30–31 July 2014, the limit light intensity for conductivity PPFDlim = 1000 μmol photon m−2 s−1 and the reference mesophyll water potential ψm, r = −0.9 MPa were estimated to agree with the observations. The ideal light and temperature model parameters representing the average and the amplitude of light and temperature per oscillation period were fitted using recorded light and temperature data in Excel. The relationship between hr and Ta was fitted using the software Sigmaplot (version 11.0, Systat software GmbH, Erkrath, Germany).
Sensitivity Analysis
To test our hypotheses, sensitivity of WUE to the time constant for stomata aperture and closure, αg, initial lag for stomatal reaction, r0, maximum stomatal conductance (modeled in g1) and mesophyll CO2 conductance were analyzed. Stomatal behavior parameters were fixed to estimated values for cucumber leaves (αg=4.0516 10−3 s−1, r0 = 2.674 10−3 mol H2O m−2 s−1). Then, r0, was changed to 0.0106, 0.0012, and 0.0002 mol H2O m−2 s−1 and αg was changed decreasingly to 0.00682, 0.00338, 0.00134, and 0.00109 s−1 (values in range of the estimates in Vialet-Chabrand et al. (2013)). In each of these scenarios, WUE was computed per day and per 5 s. The daily WUE was computed as net assimilation integral divided by the transpiration integral in the period from 6:00 a.m. to 20:00 p.m. The maximum stomatal conductance, which should be proportional to stomatal density, increases with g1 in Equation (16). We changed the value of g1 from −40 to 90% and analyzed the impact on the daily WUE. Mesophyll CO2 conductance (gm = 0.3 mol CO2 m−2s−1) was increased from −40 to a 500% to evaluate the effects of gm on WUE.
“Ideal” light and temperature models (Kimball and Bellamy, 1986) were chosen to represent slow and fast light changing scenarios. Ideal day light intensity was defined with sinusoidal fluctuating functions (day length = 15 h, frequency = 2 h−1, 1 h−1, 30 and 15 min−1).
Results
The model describes well the decreasing trend of relative water content during daytime for both the sunny day and the cloudy day (Figure 2). During daytime, the relative water content (RWC) dropped down to 83% on the sunny day and remained at around 92% during the dark period. The diurnal trend of leaf water potential shows a decreasing trend of water potential during the day. The diurnal course of RWC was well reproduced during the first day (data not shown). On the second day, however, a discrepancy was found between observations and estimation in the morning. Overall, a linear relationship (r2 = 0.54, P = 0.0156) was found between observations and simulations. Observed leaf temperature was higher than the simulated values and no linear relationship between observations and simulations was found (r2 = 0.01, P = 0.641; data not shown).
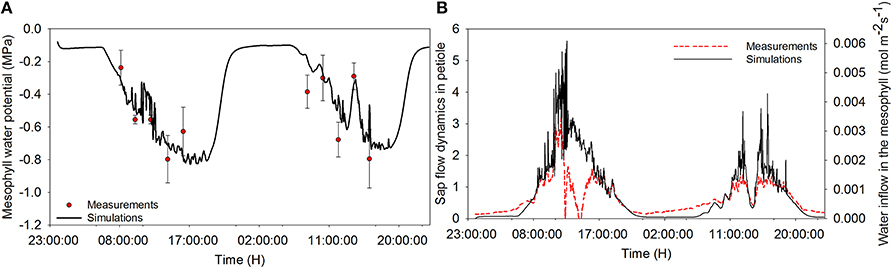
Figure 2. Diurnal time courses of mesophyll water potential (A) and water inflow to the mesophyll (B) and comparison between simulated and measured data during a cloudy (first day) and a sunny day (second day). Dots represent measured data of water potential, and dashed lines represent the sap flow raw data and solid lines are simulations from the model. Climatic data are the two days measurement data presented in Figure 1, and all parameter values are defined in Tables 1, 2.
Table 1. Input and output variables of the model.
Table 2. Model parameters description and estimated values.
Simulations agreed with the observed trend during both the sunny and the cloudy day. Observed raw sap flow data and simulated water inflow in the mesophyll were correlated with r2 = 56%. All fluctuations observed in the sap flow dynamics data were reproduced by the model and the delay observed with respect to irradiance was mimicked, although a discrepancy was observed between simulated and observed sap flow dynamics during the sunny day. As expected, the simulated net assimilation rate, the transpiration rate and stomatal conductance followed the course of the sun (Figures 3A–C). Due to the decrease of ψm during daytime, solute accumulation in the leaf increased during daytime and stabilized during the night (Figure 3D). The model showed a decreasing trend of relative water content during daytime due to transpiration in the presence of irradiance and the circadian clock effects on xylem hydraulic conductivity (data not shown).
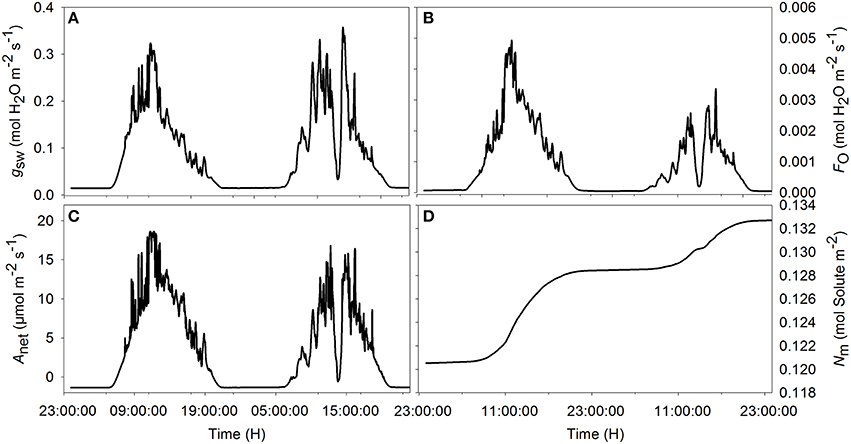
Figure 3. Simulated diurnal time courses of net assimilation Anet (A), stomatal conductance to water vapor gsw (B), transpiration FO (C), and amount of solute in the mesophyll (D) during the sunny (first day) and cloudy day (second day). Climatic data used are from the 2 days of measurement data presented in Figure 1, and all parameter values are defined in Tables 1, 2.
Effects of Stomatal Speed on WUE
Daily WUE was 3.605 and 4.685 mmol CO2 mol−1 H2O and on the sunny and cloudy day, respectively. Initial time lag for stomatal response did not lead to an appreciable change of daily WUE (<0.5%, figure not shown). Increasing the time constant for stomatal response slightly increased WUE in all scenarios (Figure 4). During the cloudy day, an increase of 1.2% in WUE was reached for an increasing stomatal speed by 60% and a light period of 2 h (Figure 4A). The daily WUE increased by 1.46% for the ideal sunny day with a 2 h period of light and temperature fluctuation (Figure 4B).
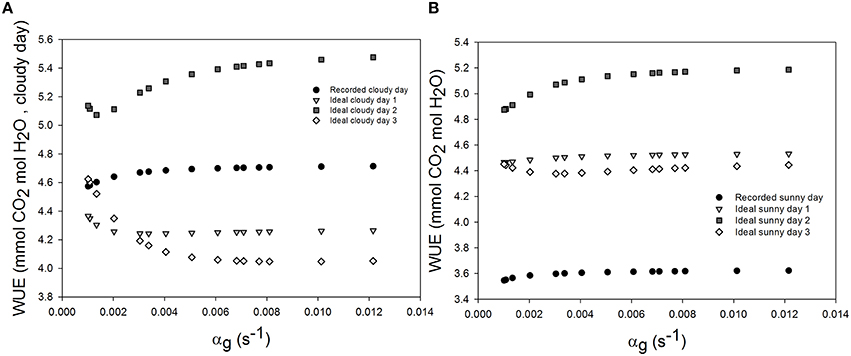
Figure 4. Effect of varying the time constant for stomata response (αg) on daily water use efficiency (WUE) during the sunny day (B), the cloudy day (A), and different ideal sunny (B) and cloudy days (A) scenarios. Simulations were performed per second over 15 h (from 06:00 a.m. to 9:00 p.m.). The speed of stomatal aperture was varied in a set of 15 values and all climatic data were extracted from the 2 days measurement data presented in Figure 1 and ideal sunny and cloudy days scenario. The ideal sunny and cloudy days 1 to 3 corresponds to sinusoidal fluctuation frequency equal to 2 h−1, 1 h−1 and 30 min−1. All other parameter values are defined in Tables 1, 2.
When ambient light drops quickly, stomata with slower opening/closure time need more time to close, and, due to reduced radiation (Figures 5A, 6A, shaded area), the evaporation rate (Figures 5D, 6D, shaded area) is higher, and the stomatal limitation to net assimilation is lower (Figures 5B,C, 6B,C, shaded area). Therefore, WUE is lower for the slower reacting stomata (Figures 5E, 6E, shaded areas). The impact on WUE depends on climatic conditions on that day. In case of constant light intensity over the day, the stomatal speed did not affect WUE. A higher stomatal speed instantaneously increased WUE by up to 6.25% on cloudy day, depending on light variation (Figures 5E, 6E, shaded areas). The model was tested for different light exposure scenarios, including extreme cases when PPFD on sunny days was multiplied by 2, the temperature multiplied by 1.5 and the relative humidity multiplied by 0.6, and for different values of boundary layer conductance. Similar results were observed for all scenarios (Figures 5E, 6E).
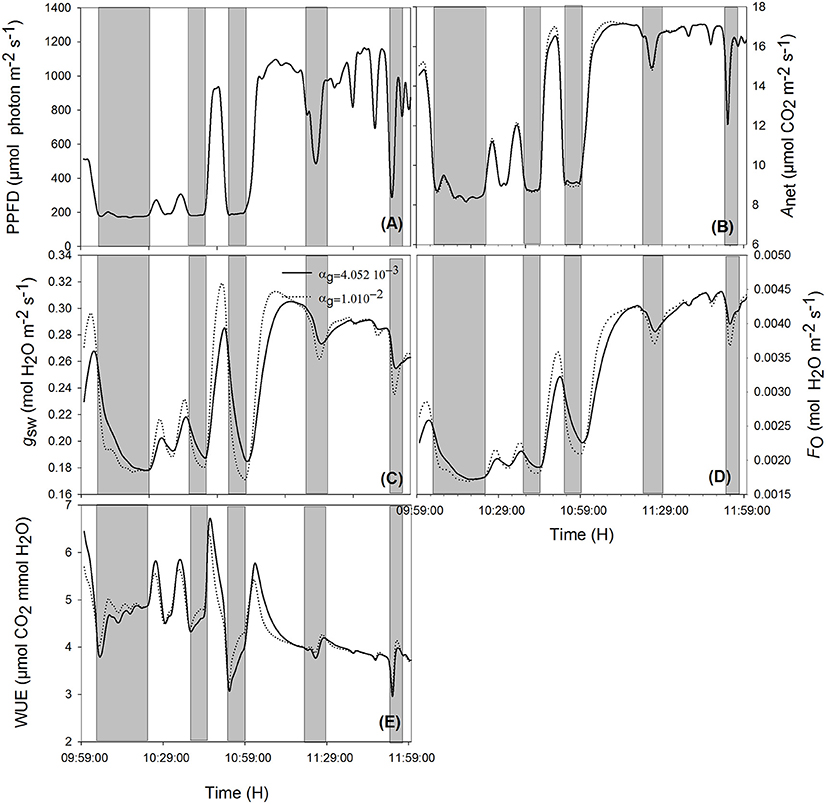
Figure 5. Effect of varying time constant for stomata response (αg) on net assimilation rate (B), stomatal conductance (C), transpiration rate (D), water use efficiency (E) for different photosynthetic active radiation (PAR; A) during the sunny day. Simulations were performed in steps of 1 s over 2 h (from 10:00 a.m. to 12:00 p.m.) and are extracted from measurements over 2 days data. Solid lines represent the fastest stomata opening/closing () and dotted lines represent the simulation result for . Highlighted areas correspond to time courses where slower reacting stomata have a better water use efficiency. Other climatic data were extracted from the 2 days measurement data presented in Figure 1, and all other parameter values are defined in Tables 1, 2.
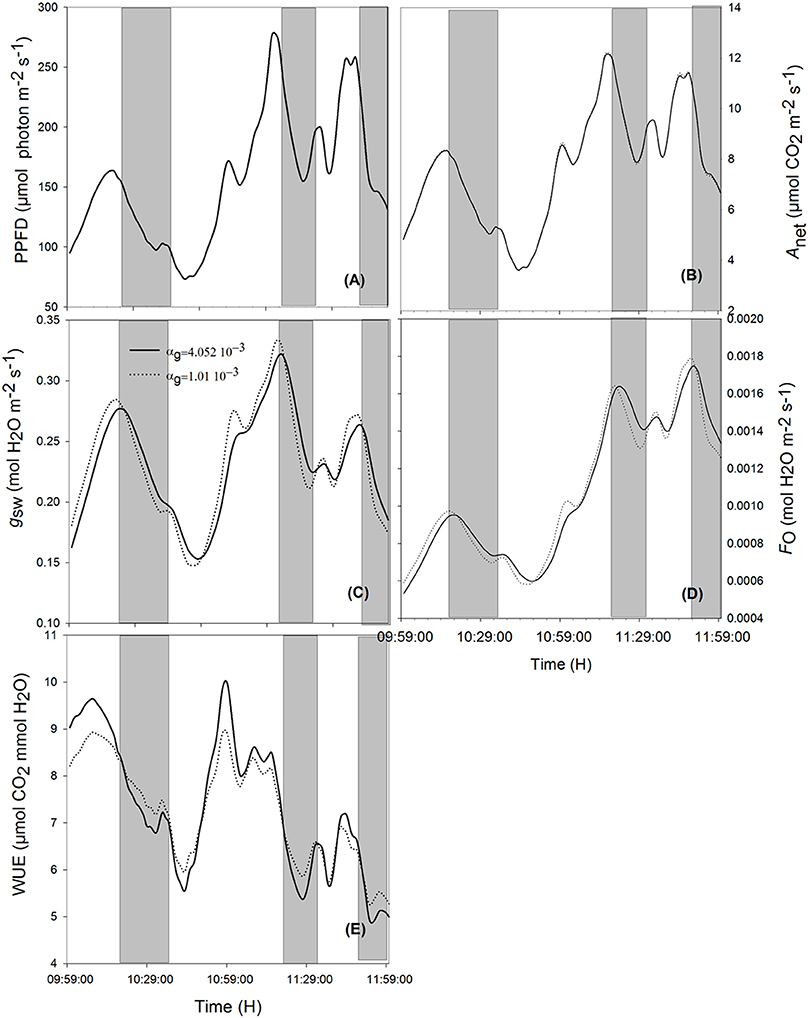
Figure 6. Effects of varying the time constant for stomata response (αg) on net assimilation rate (B), stomatal conductance (C), transpiration rate (D), water use efficiency (E) for different photosynthetic active radiation (PAR; A) during the cloudy day. Simulations were performed in steps of 1 s over 2 h (from 10:00 a.m. to 12:00 p.m.) and are extracted from measurements over 2 days' data. Solid lines represent the slowest stomata opening/closing (αg = 4.052 10−3) and dotted lines represent the simulation result for αg = 1.01 10−2. Shaded areas correspond to the period where slower reacting stomata have a higher water use efficiency. Other climatic data were extracted from the 2 days' measurement data presented in Figure 1 and all other parameter values are defined in Tables 1, 2.
Effects of Increasing Maximum Stomata Conductance on WUE
An increase of 20% of maximum stomatal conductance lead to a decrease of WUE of up to 8.66% during the sunny day and 8.57% during the cloudy day (Figure 7). In fact, increasing the maximum stomatal conductance increased the actual stomatal conductance and therefore transpiration rate. A higher net assimilation rate was also obtained in all cases, but the increased net assimilation did not compensate the water lost, and therefore, the WUE decreased for all stomatal aperture and closure speeds.
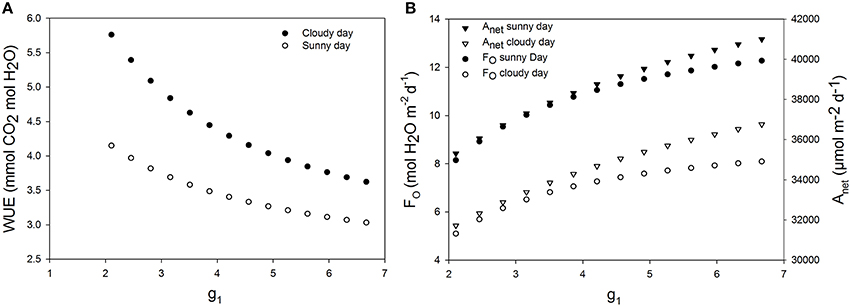
Figure 7. Effect of increasing maximum stomatal conductance on daily water use efficiency. g1 is a parameter characterizing the maximum stomatal conductance. (A) Daily WUE for different values of g1 for a cucumber leaf during the recorded sunny and cloudy days. (B) Total daily transpiration rate (FO) and daily net assimilation rate (Anet) for different values of the maximum stomatal conductance. Simulations were performed per second over 15 h (from 06:00 a.m. to 9:00 p.m.). Values of g1= 3.51 was increased from −40 to 90% and each point on the figure is 1 day simulation result. Other climatic data were extracted from the 2 days measurement data presented in Figure 1 and all other parameter values are summarized in Tables 1, 2.
Effects of Higher Mesophyll CO2 Conductance on WUE
Increasing mesophyll CO2 conductance increased daily WUE by up to 4.5% on the cloudy day and 5.5% on the sunny day, despite an increase in transpiration rate (1.5%, Figures 8A,C,D,F). However, increasing gm beyond 0.8 mol m−2 s−1, had only negligible effects on WUE for all stomatal speeds. Combining an increase in stomatal speed and gm slightly increased WUE, and increased Anet more than the only effect of gm (Figures 8B,E).
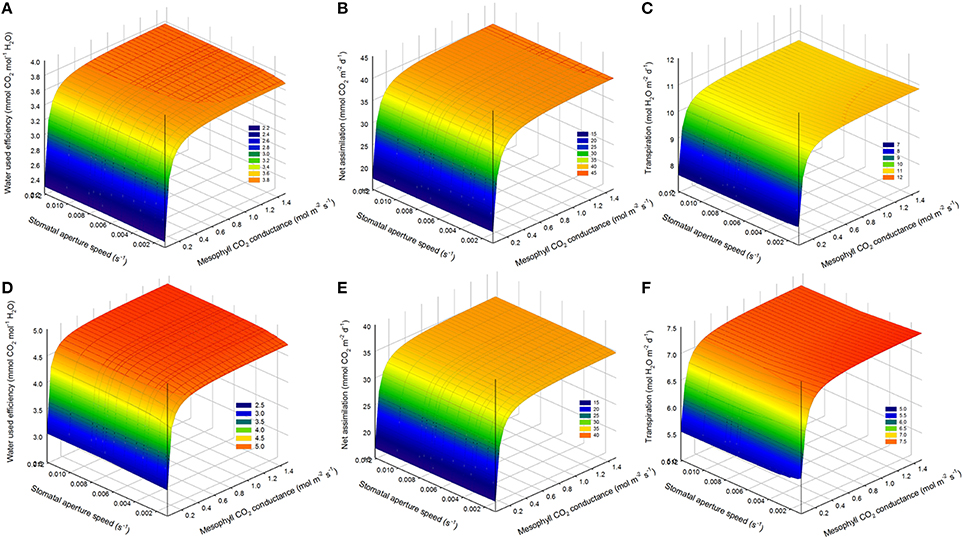
Figure 8. Combined effect of increasing mesophyll CO2 conductance (gm) and stomatal speed (αg) on daily water use efficiency (WUE). (A,D) daily WUE for different values of gm and αg for a cucumber leaf during the recorded sunny (A) and cloudy (D) days. (B,E) total daily transpiration rate (FO) during the recorded sunny (B) and cloudy (E) days for different values of gm and αg. (C,F) total daily net assimilation rate (Anet) during the recorded sunny (C) and cloudy (F) days for different values of gm and αg. Simulations were performed per second over 15 h (from 06:00 a.m. to 9:00 p.m.). Values of gm = 0.3 was increased from −40 to 500% and αg was varied in a set of 15 values and the figure present daily simulation result. Other climatic data were extracted from the 2 days measurement data presented in Figure 1 and all other parameter values are summarized in Tables 1, 2.
Effects of Fluctuating Irradiance on WUE
Using ideal sunny day and ideal cloudy day scenarios, the light period was changed from 2 min 30 s to 2 h. The results show that WUE is maximal when the fluctuation period is around 60 min (Figure 9). WUE increased by as much as 70% depending on fluctuation period and total daily radiation.
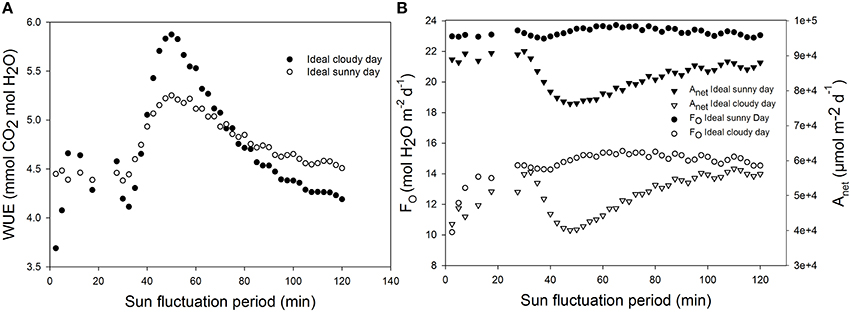
Figure 9. Effect of increasing light and temperature fluctuation frequency on daily (A) water use efficiency (WUE), (B) total daily transpiration rate (FO), and daily net assimilation rate (Anet). Simulations were performed per second over 15 h (from 06:00 a.m. to 9:00 p.m.). Value of the light sinusoidal period was increased from 1 min 25 s to 2 h and each point on the figure represents one day simulation summarized. All other parameter values are presented in Tables 1, 2.
Discussion
Speed of stomatal response to environment, stomatal density and mesophyll conductance to CO2 have been proposed to be important traits of plant to better adapt to drought stress (Merlot et al., 2002; De Lucia et al., 2003; Warren et al., 2003; Büssis et al., 2006; Lawson and Blatt, 2014; Franks et al., 2015). Previous work reported that the speed of stomatal response might be more likely to enhance WUE than stomatal density (Lawson and Blatt, 2014), but their effects were not quantitatively assessed. To overcome the technical difficulties in quantifying the influence of these traits on daily WUE, a model describing the dynamics of WUE controlled by stomatal behavior and mesophyll CO2 conductance under different climatic conditions was presented.
Stomatal Speed
Although a faster reaction of stomatal conductance can increase the instantaneous WUE by up to 20% (Figures 5E, 6E), it did not improve daily WUE (Figures 4A,B). Fast stomatal opening speed in reaction to light increases carbon gain and water loss through transpiration at the same time. Therefore, it does not significantly increase WUE. The result is not in agreement with Lawson and Blatt (2014) who suggested that fast stomatal response increases both daily carbon gain and WUE. This discrepancy might be due to the fact that Lawson and Blatt (2014) calculated the intrinsic WUE (defined as Anet/gsw) and ignored the influence of light energy on transpiration. Moreover, Lawson and Blatt (2014) argued that a slow stomatal response creates a stomatal limitation to photosynthesis and inferred that a fast response to light should reduce this limitation. However, the range of stomatal conductance from their measured data is 0.05–0.13 mol m−2s−1, a range where gsw limitation would be strongest. In contrast, our gsw data ranged from 0.15–0.30 mol m−2s−1, i.e., gsw limitation was much less than in the dataset of Lawson and Blatt (2014). The model should be calibrated to plants with lower maximum gsw, to quantify the combined effect of αg and g1 on WUE.
Effect of g1
Medlyn et al. (2011) demonstrated mathematically that the biological interpretation of g1 is WUE. This interpretation has been further proved by a global dataset showing that g1 reduces with available water in the soil (Lin et al., 2015). Therefore, it is not surprising that increase of g1 decreased WUE (Figure 7A). It is interesting to identify the traits determining g1. According to Equation (16), g0 and g1 are the physiological parameters which could increase gsw. Parameter g0 represents the gsw value in the dark and is normally close to zero (although genotypes in Arabidopsis with constantly high gsw in the dark have been found recently; Costa et al., 2015). Therefore, parameter g1 should be the factor determining the magnitude of gsw, which are related to stomatal size and density. This idea can be supported by the recent publication showing that reducing maximal gsw by stomatal density increases WUE (Franks et al., 2015). Unfortunately, g1 was not estimated in this publication. Further, study which could show the relationship between g1 and stomatal density may help us to approach a more mechanistic understanding on g1. A minimum decrease of the daily WUE was 5.1% for an increase of g1 by 20%. This result does not agree with the instantaneous WUE measured by Franks et al. (2015) under steady state conditions. In contrast to Franks et al. (2015), our results suggest that increasing the maximum stomatal conductance will improve the net assimilation (more than 12.5%), but may not increase WUE. In fact, Franks et al. (2015) estimated a steady state WUE, by letting gsw and A stabilize for 45 min, and therefore, did not account for the stomatal behavior under naturally changing environment. Under constant climatic conditions, a similar result was found (data not shown).
Effect of Light Fluctuations
Increasing oscillation frequency of light and temperature could increase the WUE by up to 70%. The ideal oscillation period for a maximal WUE was found around 50 min. At this oscillation period, the stomatal responses and changes in light intensity may be synchronized in such a way that the light energy is optimally used by the leaf. In fact, stomatal guard cells react in response to changes in environmental conditions. If the light intensity reaches very fast a high value and drop quickly, then the stomatal aperture, because of the speed of response, may not reach the corresponding maximum target value. Therefore, the plant may not fully make use of the high light intensity due to a higher stomata limitation. This observation might explain results found in the literature. For example, the effects of environmental fluctuations on stomatal behavior were reported as reason for the limited effects of stomatal density (Lawson and Blatt, 2014). However, an increase of 70% in WUE for the same integral of light flux and temperature was unexpected. Further experiments may help to find an optimal light and temperature pattern leading to an optimal WUE for different plant species with different speed of stomatal response.
Effects of Mesophyll CO2 Conductance
The model suggested that WUE can be improved by up to 5.5% by increasing mesophyll CO2conductance (gm). When gm > 0.8 mol m−2 s−1, further increase in gm did not significantly improve WUE. It might be explained by the fact that the ratio Anet/gm became very low in comparison with Ci for gm > 0.8 so that the chloroplastic CO2 concentration and Ci are almost similar.
The model showed an influence of mesophyll CO2 conductance on E (Figure 8B). This could have been caused by the fact that the steady state target of stomatal conductance G is calculated from the estimated value of net Anet as modeled by Medlyn et al. (2011), which is a function of mesophyll CO2 conductance. The model can probably be improved by considering a different stomatal target model, independent of Anet, but depending directly on environmental conditions (radiation, temperature, and vapor pressure deficit or relative humidity).
The model presented in this manuscript considered a fully expanded leaf and all photosynthetic parameters were taken constant during the simulation period. The effect of Rubisco activation and deactivation (Gross et al., 1991), and the age effect on photosynthetic parameters might allow a wider application of the model. Another issue for further development of the model is the canopy WUE, taking into account the effect of leaf age and canopy architecture.
Conclusion
The model presented in this manuscript allowed to quantify the effects of stomatal behavior and mesophyll CO2 conductance on the WUE of a cucumber leaf. Combining stomatal dynamics with the effects of changing climatic condition on photosynthesis and transpiration rates allows to find that for the case of cucumber leaves that was analyzed, an increase of stomatal speed will not lead to an increase of more than 1.5% of the daily WUE under normal fluctuating light condition. It was also found that increasing maximum stomatal conductance decrease WUE. Increasing mesophyll CO2 conductance can lead to an increase of daily WUE by up to 5.5%. This suggests that increasing mesophyll CO2 conductance might be more likely to increase WUE than increasing stomatal density and speed.
Author Contributions
DM and TC Developed the model, DM performed all numerical simulations, DM, TC, and HS discussed the data and wrote the paper.
Conflict of Interest Statement
The authors declare that the research was conducted in the absence of any commercial or financial relationships that could be construed as a potential conflict of interest.
Acknowledgments
The publication of this article was funded by the Open Access Fund of the Leibniz Universität Hannover. TC thanks Prof. Kathy Steppe and Dr. Jochen Hanssens at Ghent University, Belgium, for their instructions in using HFD sensors and Landgard Stiftung and TASPO Stiftung for their financial support of his research stay at Ghent University.
References
Aranda, I., Pardos, M., Puértolas, J., Jiménez, M. D., and Pardos, J. A. (2007). Water-use efficiency in cork oak (Quercus suber) is modified by the interaction of water and light availabilities. Tree Physiol. 27, 671–677. doi: 10.1093/treephys/27.5.671
Arneth, A., Lloyd, J., Šantrůčková, H., Bird, M., Grigoryev, S., Kalaschnikov, Y. N., et al. (2002). Response of central Siberian Scots pine to soil water deficit and long-term trends in atmospheric CO2 concentration. Glob. Biogeochem. Cycles 16, 5-1–5-13. doi: 10.1029/2000GB001374
Ball, J. T., Woodrow, I. E., and Berry, J. A. (1987). “A model predicting stomatal conductance and its contribution to the control of photosynthesis under different environmental conditions,” in Progress in Photosynthesis Research, ed J. Biggins (Dordrecht: Springer Netherlands), 221–224.
Blum, A. (2009). Effective use of water (EUW) and not water-use efficiency (WUE) is the target of crop yield improvement under drought stress. Field Crops Res. 112, 119–123. doi: 10.1016/j.fcr.2009.03.009
Büssis, D., von Groll, U., Fisahn, J., and Altmann, T. A. (2006). Stomatal aperture can compensate altered stomatal density in Arabidopsis thaliana at growth light conditions. Funct. Plant Biol. 33, 1037–1043. doi: 10.1071/FP06078
Caldeira, C. F., Jeanguenin, L., Chaumont, F., and Tardieu, F. (2014). Circadian rhythms of hydraulic conductance and growth are enhanced by drought and improve plant performance. Nat. Commun. 5:5365. doi: 10.1038/ncomms6365
Chen, T.-W., Henke, M., de Visser, P. H. B., Buck-Sorlin, G., Wiechers, D., Kahlen, K., et al. (2014). What is the most prominent factor limiting photosynthesis in different layers of a greenhouse cucumber canopy? Ann. Bot. 114, 677–688. doi: 10.1093/aob/mcu100
Costa, J. M., Monnet, F., Jannaud, D., Leonhardt, N., Ksas, B., Reiter, I. M., et al. (2015). Open all night long: the dark side of stomatal control. Plant Physiol. 167, 289–294. doi: 10.1104/pp.114.253369
Damour, G., Simonneau, T., Cochard, H., and Urban, L. (2010). An overview of models of stomatal conductance at the leaf level. Plant Cell Environ. 33, 1419–1438. doi: 10.1111/j.1365-3040.2010.02181.x
De Lucia, E. H., Whitehead, D., and Clearwater, M. J. (2003). The relative limitation of photosynthesis by mesophyll conductance in co-occurring species in a temperate rainforest dominated by the conifer Dacrydium cupressinum. Funct. Plant Biol. 30, 1197–1204. doi: 10.1071/FP03141
Ehdaie, B., Hall, A. E., Farquhar, G. D., Nguyen, H. T., and Waines, J. G. (1991). Water-use efficiency and carbon isotope discrimination in wheat. Crop Sci. 31, 1282–1288. doi: 10.2135/cropsci1991.0011183x003100050040x
Farquhar, G. D., von Caemmerer, S., and Berry, J. A. (1980). A biochemical model of photosynthetic CO2 assimilation in leaves of C3 species. Planta 149, 78–90. doi: 10.1007/bf00386231
Flexas, J., Ribas-Carbó, M., Diaz-Espejo, A., Galmés, J., and Medrano, H. (2008). Mesophyll conductance to CO2: current knowledge and future prospects. Plant Cell Environ. 31, 602–621. doi: 10.1111/j.1365-3040.2007.01757.x
Franks, P. J., Doheny-Adams, T. W., Britton-Harper, Z. J., and Gray, J. E. (2015). Increasing water-use efficiency directly through genetic manipulation of stomatal density. New Phytol. 207, 188–195. doi: 10.1111/nph.13347
Gross, L. J., Kirschbaum, M. U., and Pearcy, R. W. (1991). A dynamic model of photosynthesis in varying light taking account of stomatal conductance, C3-cycle intermediates, photorespiration and Rubisco activation. Plant Cell Environ. 14, 881–893. doi: 10.1111/j.1365-3040.1991.tb00957.x
Guyot, G., Scoffoni, C., and Sack, L. (2012). Combined impacts of irradiance and dehydration on leaf hydraulic conductance: insights into vulnerability and stomatal control. Plant Cell Environ. 35, 857–871. doi: 10.1111/j.1365-3040.2011.02458.x
Hanssens, J., de Swaef, T., Nadezhdina, N., and Steppe, K. (2013). Measurement of sap flow dynamics through the tomato peduncle using a non-invasive sensor based on the heat field deformation method. Acta Hortic. 991, 409–416. doi: 10.17660/ActaHortic.2013.991.50
Hanssens, J., de Swaef, T., and Steppe, K. (2014). High light decreases xylem contribution to fruit growth in tomato. Plant Cell Environ. 38, 487–498. doi: 10.1111/pce.12411
Hari, P., Mäkelä, A., Korpilahti, E., and Holmberg, M. (1986). Optimal control of gas exchange. Tree Physiol. 2, 169–75. doi: 10.1093/treephys/2.1-2-3.169
Hommel, R., Siegwolf, R., Saurer, M., Farquhar, G. D., Kayler, Z., Ferrio, J. P., et al. (2014). Drought response of mesophyll conductance in forest understory species — impacts on water-use efficiency and interactions with leaf water movement. Physiol. Plant. 152, 98–114. doi: 10.1111/ppl.12160
Hubick, K. T., Farquhar, G. D., and Shorter, R. (1986). Correlation between water-use efficiency and carbon isotope discrimination in diverse peanut (Arachis) germplasm. Aust. J. Plant Physiol. 13, 803–816. doi: 10.1071/PP9860803
Jones, H. G. (2013). Plants and Microclimate: A Quantitative Approach to Environmental Plant Physiology. Cambridge: Cambridge University Press.
Katul, G. G., Palmroth, S., and Oren, R. A. (2009). Leaf stomatal responses to vapour pressure deficit under current and CO2 -enriched atmosphere explained by the economics of gas exchange. Plant Cell Environ. 32, 968–979. doi: 10.1111/j.1365-3040.2009.01977.x
Kimball, B. A., and Bellamy, L. A. (1986). Generation of diurnal solar radiation, temperature, and humidity patterns. Energy Agric. 5, 185–197. doi: 10.1016/0167-5826(86)90018-5
Lawson, T., and Blatt, M. (2014). Stomatal size, speed and responsiveness impact on photosynthesis and water use efficiency. Plant Physiol. 164, 1556–1570. doi: 10.1104/pp.114.237107
Lawson, T., Simkin, A. J., Kelly, G., and Granot, D. (2014). Mesophyll photosynthesis and guard cell metabolism impacts on stomatal behaviour. New Phytol. 203, 1064–1081. doi: 10.1111/nph.12945
Lin, Y. S., Medlyn, B. E., Duursma, R. A., Prentice, I. C., Wang, H., Baig, S., et al. (2015). Optimal stomatal behaviour around the world. Nat. Clim. Chang. 5, 459–464. doi: 10.1038/nclimate2550
Lloyd, J. (1991). Modelling stomatal responses to environment in macadamia integrifolia. Aust. J. Plant Physiol. 18, 649–660. doi: 10.1071/PP9910649
Maes, W. H., and Steppe, K. (2012). Estimating evapotranspiration and drought stress with ground-based thermal remote sensing in agriculture: a review. J. Exp. Bot. 63, 4671–4712. doi: 10.1093/jxb/ers165
Medlyn, B. E., Dreyer, E., Ellsworth, D., Forstreuter, M., Harley, P. C., Kirschbaum, M. U. F., et al. (2002). Temperature response of parameters of a biochemically based model of photosynthesis. II. A review of experimental data. Plant Cell Environ. 25, 1167–1179. doi: 10.1046/j.1365-3040.2002.00891.x
Medlyn, B. E., Duursma, R. A., Eamus, D., Ellworth, D. S., Prentice, I. C., Barton, C. V. M., et al. (2011). Reconciling the optimal and empirical approaches to modelling stomatal conductance. Glob. Chang. Biol. 17, 2134–2144. doi: 10.1111/j.1365-2486.2010.02375.x
Merlot, S., Mustilli, A.-C., Genty, B., North, H., Lefebvre, V., Sotta, B., et al. (2002). Use of infrared thermal imaging to isolate Arabidopsis mutants defective in stomatal regulation. Plant J. 30, 601–609. doi: 10.1046/j.1365-313X.2002.01322.x
Ögren, E., and Evans, J. R. (1993). Photosynthetic light-response curves I. The influence of CO2 partial pressure and leaf inversion. Planta 189, 182–190. doi: 10.1007/BF00195075
Sack, L., and Scoffoni, C. (2012). Measurement of leaf hydraulic conductance and stomatal conductance and their responses to irradiance and dehydration using the evaporative flux method (EFM). J. Vis. Exp. 70, 4179. doi: 10.3791/4179
Schlüter, U., Muschak, M., Berger, D., and Altmann, T. (2003). Photosynthetic performance of an Arabidopsis mutant with elevated stomatal density (sdd1-1) under different light regimes. J. Exp. Bot. 54, 867–874. doi: 10.1093/jxb/erg087
Scoffoni, C., McKown, A. D., Rawls, M., and Sack, L. (2012). Dynamics of leaf hydraulic conductance with water status: quantification and analysis of species differences under steady state. J. Exp. Bot. 63, 643–658. doi: 10.1093/jxb/err270
Steppe, K., De Pauw, D. J., Lemeur, R., and Vanrolleghem, P. A. (2006). A mathematical model linking tree sap flow dynamics to daily stem diameter fluctuations and radial stem growth. Tree Physiol. 26, 257–273. doi: 10.1093/treephys/26.3.257
Steudle, E., Zimmermann, U., and Lüttge, U. (1977). Effect of turgor pressure and cell size on the wall elasticity of plant cells. Plant Physiol. 59, 285–289. doi: 10.1104/pp.59.2.285
Tardieu, F., Simonneau, T., and Parent, B. (2015). Modelling the coordination of the controls of stomatal aperture, transpiration, leaf growth, and abscisic acid: update and extension of the Tardieu–Davies model. J. Exp. Bot. 66, 2227–2237. doi: 10.1093/jxb/erv039
Tuzet, A., Perrier, A., and Leuning, R. (2003). A coupled model of stomatal conductance, photosynthesis and transpiration. Plant Cell Environ. 26, 1097–1116. doi: 10.1046/j.1365-3040.2003.01035.x
Vialet-Chabrand, S., Dreyer, E., and Brendel, O. (2013). Performance of a new dynamic model for predicting diurnal time courses of stomatal conductance at the leaf level. Plant Cell Environ. 36, 1529–1546. doi: 10.1111/pce.12086
Warren, C. R., and Adams, M. A. (2006). Internal conductance does not scale with photosynthetic capacity: implications for carbon isotope discrimination and the economics of water and nitrogen use in photosynthesis. Plant Cell Environ. 29, 192–201. doi: 10.1111/j.1365-3040.2005.01412.x
Warren, C. R., Ethier, G. J., Livingston, N. J., Grant, N. J., Turpin, D. H., Harrison, D. L., et al. (2003). Transfer conductance in second growth douglas-fir (Pseudotsuga menziesii (Mirb.) Franco) canopies. Plant Cell Environ. 26, 1215–1227. doi: 10.1046/j.1365-3040.2003.01044.x
Keywords: Light regulation, water use efficiency, sap flow dynamics, stomatal behavior, mesophyll conductance
Citation: Moualeu-Ngangue DP, Chen T-W and Stützel H (2016) A Modeling Approach to Quantify the Effects of Stomatal Behavior and Mesophyll Conductance on Leaf Water Use Efficiency. Front. Plant Sci. 7:875. doi: 10.3389/fpls.2016.00875
Received: 29 February 2016; Accepted: 03 June 2016;
Published: 17 June 2016.
Edited by:
Sergey Shabala, University of Tasmania, AustraliaReviewed by:
Lars Hendrik Wegner, Karlsruhe Institute of Technology, GermanyClaudio Lovisolo, University of Turin, Italy
Copyright © 2016 Moualeu-Ngangue, Chen and Stützel. This is an open-access article distributed under the terms of the Creative Commons Attribution License (CC BY). The use, distribution or reproduction in other forums is permitted, provided the original author(s) or licensor are credited and that the original publication in this journal is cited, in accordance with accepted academic practice. No use, distribution or reproduction is permitted which does not comply with these terms.
*Correspondence: Dany P. Moualeu-Ngangue, moualeu@gem.uni-hannover.de