 Lilian Wu
 Guanglong Zhu
 Shah Fahad
 Fei Wang
- National Key Laboratory of Crop Improvement, Key Laboratory of Crop Ecophysiology and Farming System in the Middle Reaches of the Yangtze River, Ministry of Agriculture, College of Plant Science and Technology, Huazhong Agricultural University, Wuhan, China
Selecting rice varieties with a high nitrogen (N) use efficiency (NUE) is the best approach to reduce N fertilizer application in rice production and is one of the objectives of the Green Super Rice (GSR) Project in China. However, the performance of elite candidate GSR varieties under low N supply remains unclear. In the present study, differences in the grain yield and NUE of 13 and 14 candidate varieties with two controls were determined at a N rate of 100 kg ha−1 in field experiments in 2014 and 2015, respectively. The grain yield for all of the rice varieties ranged from 8.67 to 11.09 t ha−1, except for a japonica rice variety YG29, which had a grain yield of 6.42 t ha−1. HY549 and YY4949 produced the highest grain yield, reflecting a higher biomass production and harvest index in 2014 and 2015, respectively. Total N uptake at maturity (TNPM) ranged from 144 to 210 kg ha−1, while the nitrogen use efficiency for grain production (NUEg) ranged from 35.2 to 62.0 kg kg−1. Both TNPM and NUEg showed a significant quadratic correlation with grain yield, indicating that it is possible to obtain high grain yield and NUEg with the reduction of TNPM. The correlation between N-related parameters and yield-related traits suggests that promoting pre-heading growth could increase TNPM, while high biomass accumulation during the grain filling period and large panicles are important for a higher NUEg. In addition, there were significant and negative correlations between the NUEg and N concentrations in leaf, stem, and grain tissues at maturity. Further improvements in NUEg require a reduction in the stem N concentration but not the leaf N concentration. The daily grain yield was the only parameter that significantly and positively correlated with both TNPMand NUEg. This study determined variations in the grain yield and NUE of elite candidate GSR rice varieties and provided plant traits that could be used as selection criteria in breeding N-efficient rice varieties.
Introduction
Rice is one of the staple food crops for approximately half of the global population (Godfray et al., 2010), and rice production must increase by 70% by 2050 to satisfy the requirements of the growing world population (Koning et al., 2008; Godfray et al., 2010). Moreover, increased rice production needs to be achieved under the pressures of decreased arable land area, global climate change (Peng et al., 2004), intensified natural disasters (Tao et al., 2013), and the frequent occurrence of diseases and pests (Sheng et al., 2003). Therefore, it is imperative to develop new varieties that have a higher yield potential and improved adaptation to the environment.
Yield potential is defined as the yield of a cultivar grown in environments to which it is adapted, with nutrients and non-limiting water, as well as pests, diseases, weeds, lodging, and other stresses effectively controlled (Evans and Fischer, 1999). Cassman (1999) provided a more functional definition of yield potential, suggesting that this parameter is the yield obtained when an adapted cultivar is grown with the minimal possible stress, which is achieved by using the best management practices. In rice, yield potential has been significantly augmented, reflecting the utilization of semi-dwarf genes, heterosis, and the combination of intersubspecific heterosis and new plant types (Peng et al., 2008). In 2014, the elite super hybrid rice Y-Liang-You900 (YLY900) showed a record high yield of 15.4 t ha−1 (Li et al., 2014). However, the main dilemma is that new varieties that have a high yield potential were achieved using surplus nutrient application, suggesting that farmers should apply a higher amount of fertilizers than the minimum required to produce the highest grain yield in rice production (Peng et al., 2002). The performance of these newly developed high-yielding varieties under low nutrient input remains unclear.
Nitrogen (N) is a vital element for plant development and growth, and the application of N fertilizer could significantly increase yield formation (Andrews et al., 2013). From 1960 to 2012, the global N fertilizer consumption increased by 800% and the annual N consumption in China increased from 8 to 35% of the world's N consumption (data from IFA). In China, the average rate of N application in rice production is ~180 kg ha−1, which is 75% higher than the world average rate (Peng et al., 2002, 2006). High N fertilizer input leads to low nitrogen use efficiency (NUE) due to the rapid N losses from ammonia volatilization, denitrification, surface runoff, and leaching in the soil-floodwater system (Vlek and Byrnes, 1986; De Datta and Buresh, 1989). A low NUE results in significant environmental pollution, such as soil acidification (Guo et al., 2010), air pollution (Smil, 1999), and water eutrophication (Diaz and Rosenberg, 2008). To increase the NUE in rice production, scientists have developed a range of optimized crop management practices, such as Site-Specific N Management (SSNM, Dobermann et al., 2002), Real-Time N Management (RTNM, Peng et al., 2006), the San-Ding Cultivation Method (SDCM, Zou et al., 2006), and “Three Controls” Nutrient Management Technology (TCNM, Zhong et al., 2007).
One potential approach to reduce N fertilizer application in rice production is the development of varieties with an improved NUE (Sun et al., 2014; Hu et al., 2015). Variations in the NUE of different rice genotypes have been determined, and NUE-related traits have been evaluated for their accuracy in reflecting genotypic variation in rice NUE from 1987 to 2003 (Broadbent et al., 1987; De Datta and Broadbent, 1988, 1993; Tirol-Padre et al., 1996; Singh et al., 1998; Inthapanya et al., 2000; Ntanos and Koutroubas, 2002; Koutroubas and Ntanos, 2003). These studies reported significant differences in N uptake capacity and N use efficiency for grain production (NUEg), suggesting candidate parameters reflecting NUE variation, such as WP/Nt (panicle weight/total N uptake), NPI (the product of grain yield at zero N treatment and NUEg), among others. Since 2003, there have only been a few studies on NUE variation in rice. Recently, Ju et al. (2015) compared the grain yield of two N-efficient varieties and two N-inefficient varieties under low N input conditions, reporting that a high grain yield at a low N rate was associated with deeper roots, increased root oxidation activity, and a higher photosynthetic NUE. However, NUE differences among newly developed elite varieties under low N input condition have not been studied.
Zhang (2007) proposed strategies for developing Green Super Rice (GSR) to meet the challenges in rice production. In 2010, the Ministry of Science and Technology of China launched a mega project to develop GSR as proposed by Zhang (2007). One main aspect in this project is to decrease N fertilizer application in rice production through the genetic development of N-efficient varieties. Thus, the objectives of the present study were to evaluate the grain yield and NUE of the newly developed candidate GSR varieties from different breeding institutes under low N supply and to examine the physiological mechanisms underlying the differences in NUE.
Materials and Methods
Plant Materials
In 2014, 13 candidate GSR varieties were grown in the middle season with YLY6 (a super hybrid variety) and HHZ (a potential GSR) as control varieties. In 2015, 14 new candidate GSR varieties were grown in the middle season with YLY6 and HHZ as control varieties. HY549 and HLY630 were used in both years. All of the candidate GSR varieties were developed in recent years, achieving a high grain yield in local variety tests, while the two control varieties, YLY6 and HHZ, were widely planted in South China in the last decade. Detailed information concerning these varieties is shown in Table 1.
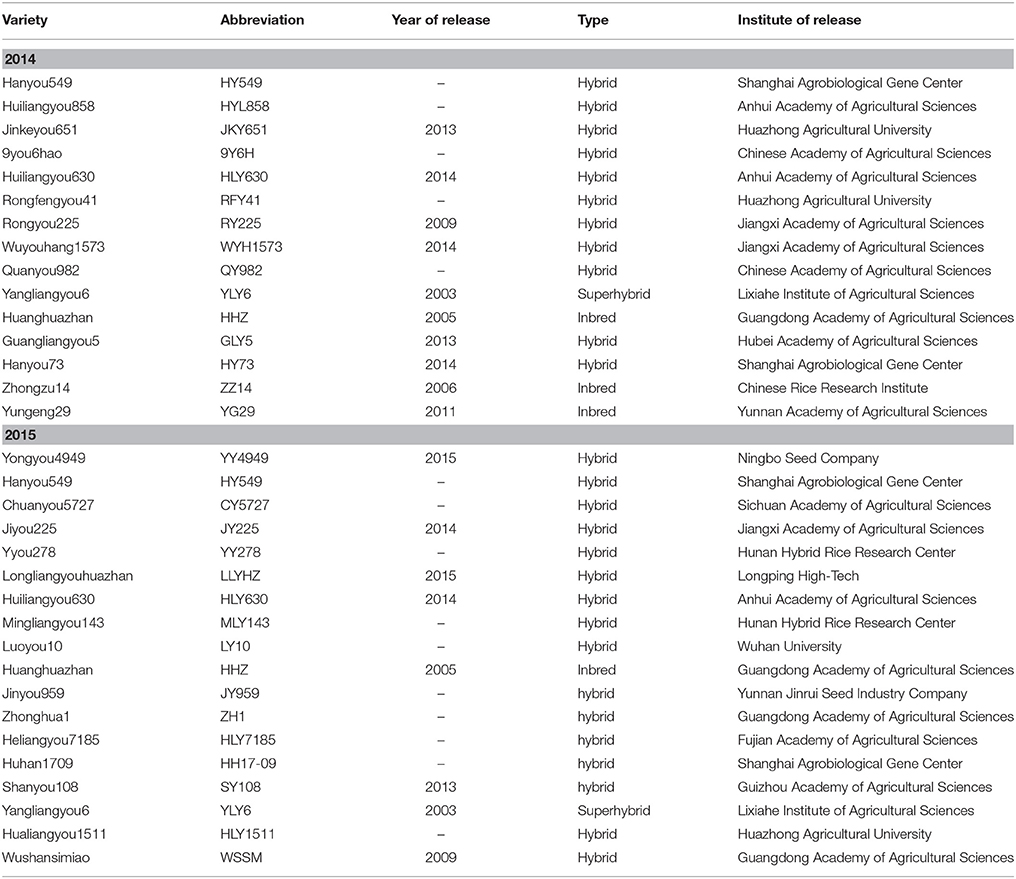
Table 1. Grain yield and yield components of the varieties in 2014 and 2015 at Wuxue County, Hubei Province, China.
Experimental Design
Field experiments were conducted in Zhougan Village (2014) and Zhangbang Village (2015) of Wuxue County, Hubei Province, China. Prior to the experiments, soil samples from the upper 20-cm layer were collected to analyze the soil chemical properties. In 2014, the soil had a clay loam texture with a pH of 5.60, organic matter of 27.18 g kg−1, total N of 1.83 g kg−1, available P of 4.91 mg kg−1, and available K of 105.8 mg kg−1, while in 2015, the soil had a clay loam texture with a pH of 5.20, organic matter of 26.69 g kg−1, total N of 1.19 g kg−1, available P of 22.56 mg kg−1, and available K of 159.2 mg kg−1. The data for daily rainfall, solar radiation, and minimum and maximum temperatures during the rice growing season were collected at a meteorological station (CR800, Campbell Scientific Inc., Logan, Utah, USA) near the fields, and are shown in Figure 1.
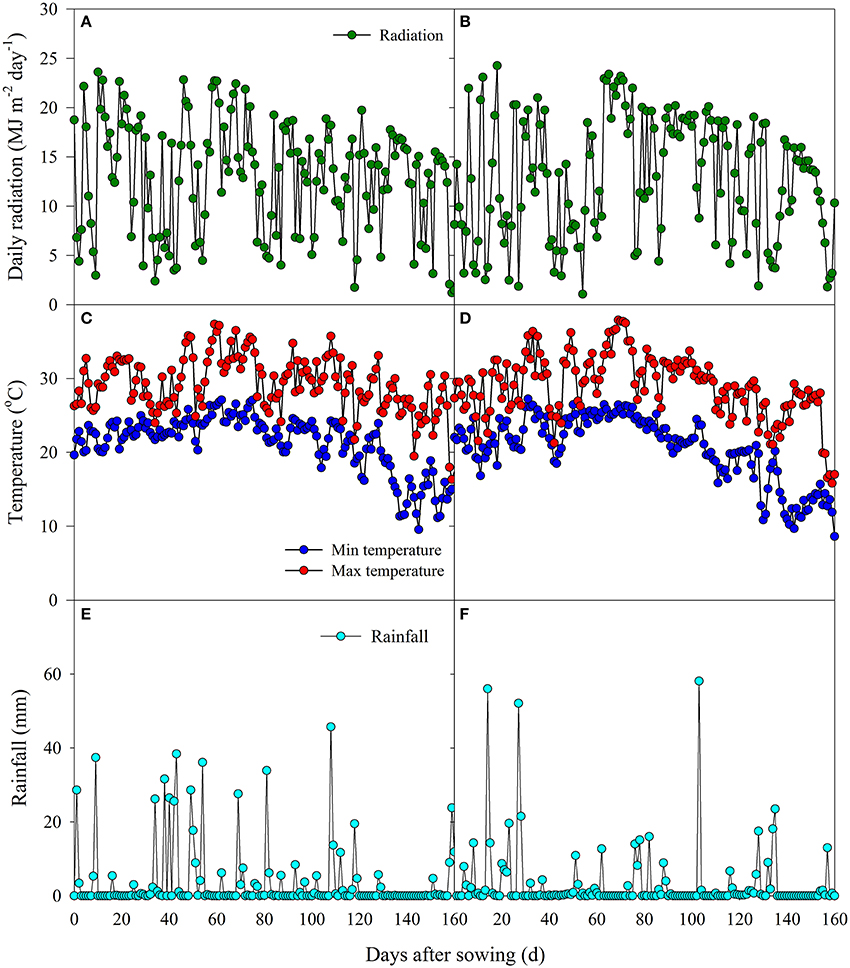
Figure 1. Daily radiation, daily minimum and maximum temperatures, and daily rainfall in the middle growing season of 2014 (A, C, E) and 2015 (B, D, F).
The experiment was arranged in a completely randomized block design with four replications. The seedlings were raised in the seedbed with a sowing date of May 23, 2014 and May 25, 2015. Twenty-five-day-old seedlings were transplanted on June 17 and June 19 in 2014 and 2015, respectively, at a hill spacing of 20.0 × 20.0 cm with two seedlings per hill and a plot size of 30 m2 in 2014 and 25 m2 in 2015. The fertilizers were manually broadcasted and incorporated 1 day before transplanting for basal application (40 kg N ha−1 urea, 40 kg P ha−1 calcium superphosphate, 50 kg K ha− potassium chloride, and 5 kg Zn ha−1 zinc sulfate heptahydrate for 2 years). Nitrogen topdressings were applied at midtillering (20 kg ha−1) and panicle initiation (PI; 40 kg ha−1), and K was topdressed at PI at a rate of 50 kg ha−1 during a 2-year experimental period. To minimize seepage between the plots, all of the bunds were covered with plastic film and installed at a depth of 20 cm below the soil surface. A water depth of 5–10 cm was maintained until 7 days prior to maturity when the fields were drained. The weeds were controlled manually and using herbicides. Pests and diseases were controlled using insecticides and fungicides; no obvious water, weed, pest, or disease stresses were observed during the experiment.
Crop Measurements
Twelve hills were sampled from each plot at mid-tillering (MT), PI, and heading (HD). Plant height and stem (main stems plus tillers) numbers were recorded. A tiller with at least one leaf was counted as a stem. The plant samples were separated into leaf blade (leaf), culm plus sheath (stem), and panicle. The green leaf area was measured using a leaf area meter (LI-3100, LI-COR, Lincoln, NE, USA) and was expressed as the leaf area index (LAI). The specific leaf weight (SLW) was defined as the ratio of the leaf dry weight to leaf area. The dry weight of each component was determined after oven drying at 80°C to a constant weight. The plant dry weight was the sum of all of the aboveground components.
At physiology maturity (PM), 12 hills were obtained from each subplot to determine the aboveground total biomass and other yield components. Plant height and panicle number were obtained from 12 hills. The plant samples were separated into leaf, stem and panicle. The dry weight of straw was determined after oven drying at 80°C to a constant weight. The panicles were hand-threshed, and the filled spikelets were separated from unfilled spikelets after submerging them in tap water. The empty spikelets were separated from the half-filled spikelets through winnowing. Three 30-g subsamples of filled spikelets, three 2-g subsamples of empty spikelets, and the total number of half-filled spikelets were obtained to quantify the number of spikelets per m2. The dry weights of rachis, filled, half-filled, and unfilled spikelets were determined after oven drying at 80°C to constant weight. The aboveground total biomass was calculated as the total dry matter of straw, rachis, and filled, half-filled, and unfilled spikelets. The spikelets per panicle, grain filling percentage (100 × filled spikelet number/total spikelet number), and harvest index (HI) (100 × filled spikelet weight/aboveground total biomass) were calculated. The grain yield was determined from a 5-m2 area in each subplot and was adjusted to a standard moisture content of 0.14 g H2O g−1 fresh weight. The grain moisture content was measured with a digital moisture tester (DMC-700, Seedburo, Chicago, IL, USA).
The tissue N concentration of each component at HD and PM was determined using an Elemental analyzer (Elementar vario MAX CNS/CN, Elementar Trading Co., Ltd, Germany). The plant N accumulation at HD and PM was calculated as the sum of N in each of the aboveground components. The nitrogen use efficiency for grain production (NUEg) was calculated as the grain yield per unit plant N accumulation. The nitrogen use efficiency in biomass production (NUEb) was determined as the ratio of biomass production to plant N accumulation. The nitrogen harvest index (NHI) was calculated as the percentage of accumulated N in grain to plant N accumulation (Peng et al., 1996).
Statistical Analysis
The data were analyzed using analysis of variance, and the mean values among the varieties were compared based on the least significant difference (LSD) test at the 0.05 probability level.
Results
Growth Duration
The growth duration ranged from 118 to 141 d in 2014 and from 119 to 144 d in 2015. For the majority of varieties, the growth duration ranged from 130 to 141 d in 2014 and from 137 to 144 d in 2015 (Table 2). The days from sowing to flowering for these varieties ranged from 78 to 99 d in 2014 and from 84 to 101 d in 2015, and the grain filling period was from 33 to 47 d in 2014 and from 33 to 53 d in 2015. Generally, the growth duration of HY549 and HLY630 was similar in 2014 and 2015. The growth duration of HHZ in 2014 was longer than that in 2015, while the growth duration of YLY6 in 2014 was shorter than that in 2015. Notably, YY4949 had the shortest growth period prior to flowering but had the longest growth period after flowering in 2015 (Table 2).
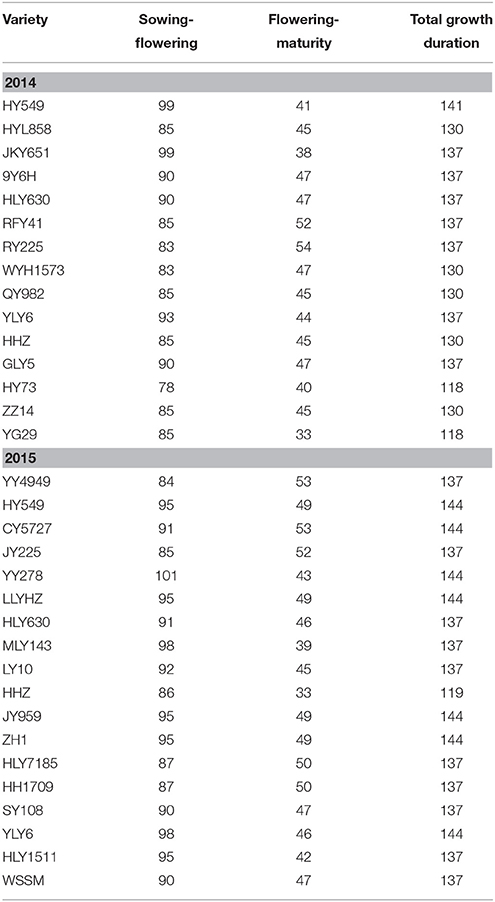
Table 2. Growth duration of the varieties in 2014 and 2015 at Wuxue County, Hubei Province, China.
Grain Yield and Yield Components
The grain yield ranged from 6.42 to 10.41 t ha−1 in 2014 (Table 3). HY549 produced the highest grain yield, and YG29 produced the lowest grain yield. No significant difference in grain yield was observed between YLY6 and HHZ. Compared with the two controls, HY549, HYL858, JKY651, 9Y6H, HLY630, and RFY41 produced a significantly superior grain yield. The grain yields of RY225, WYH1573, QY982, and GLY5 were similar to those of the two controls. HY73, ZZ14, and YG29 produced a significantly lower grain yield compared with the two controls (Table 3). In 2015, the grain yield ranged from 8.96 to 11.09 t ha−1. Notably, a higher grain yield was observed in YY4949, HY549, and CY5727 than in either HHZ or YLY6. WSSM generated a significantly lower grain yield than HHZ. The average grain yield of HHZ, YLY6, HY549, and HLY630 was 9.82 t ha−1 in 2014 and 10.13 t ha−1 in 2015 (Table 3), and analysis of variance indicated that the difference in the average grain yield of the four common varieties between 2014 and 2015 was not statistically significant.
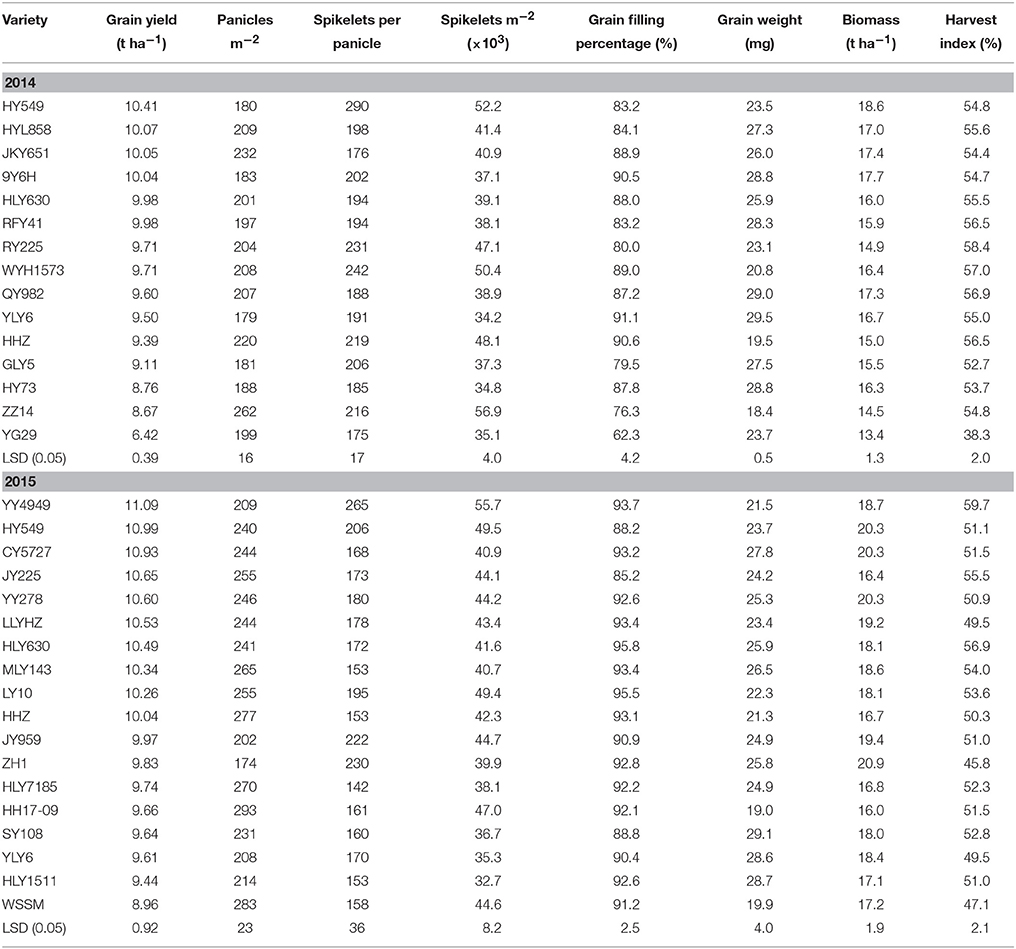
Table 3. Grain yield and yield components of the varieties in 2014 and 2015 at Wuxue County, Hubei Province, China.
In 2014, the higher grain yields of HY549, HYL858, JKY651, and 9Y6H primarily reflected the higher biomass production (Table 3). HY549 had a smaller number of large panicles, resulting in a significantly larger sink size (spikelets m−2) compared with the other varieties. In 2015, the higher grain yield of YY4949 resulted from a higher harvest index, while the higher biomass production of HY549 and CY5727 contributed to the yield advantage of these two varieties. YY4949 and HY549 had a larger sink size than the other varieties. The higher grain yields of HHZ, YLY6, HY549, and HLY630 in 2015 reflected the higher biomass production (Table 3).
Nitrogen Uptake and Use Efficiency
Significant differences were observed among the varieties for total N uptake at the heading stage (TNHD), total N uptake during the grain filling period (TNGF), total N uptake at maturity (TNPM), nitrogen use efficiency for grain production (NUEg), nitrogen use efficiency for grain production (NUEb), and NHI in 2014 and 2015. The TNPM ranged from 144 to 172 kg ha−1 in 2014 and from 158 to 210 kg ha−1 in 2015. The NUEg of the varieties ranged from 35.2 to 62.0 kg kg−1 in 2014 and from 43.1 to 58.4 kg kg−1 in 2015. The TNPM of HHZ, YLY6, HY549, and HLY630 in 2015 was higher than that in 2014, resulting in a lower NUEg for these varieties in 2015 than that in 2014 (Table 4).
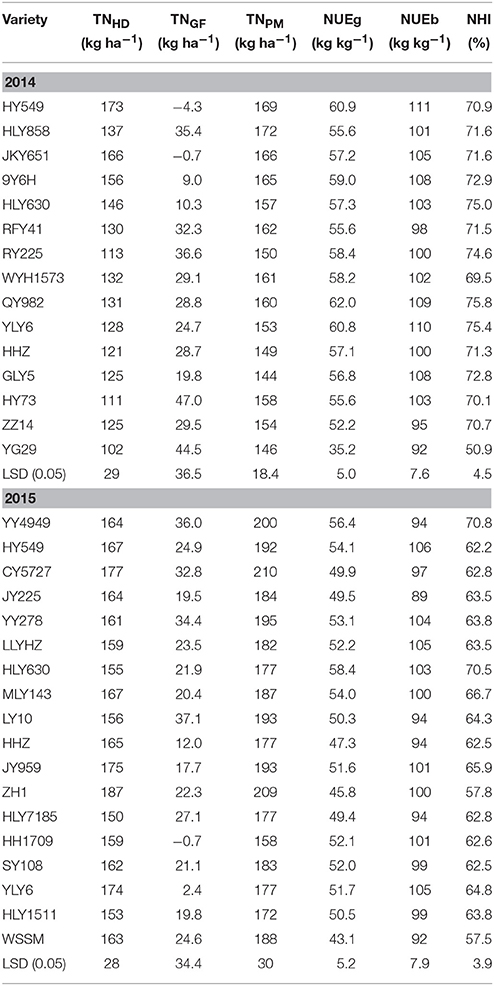
Table 4. Nitrogen uptake at the heading stage (TNHD), nitrogen uptake during grain filling period (TNGF), nitrogen uptake at maturity (TNPM), nitrogen use efficiency for grain production (NUEg), nitrogen use efficiency for biomass production (NUEb), and nitrogen harvest index (NHI) of the varieties in 2014 and 2015 at Wuxue County, Hubei Province, China.
In both years, the leaf N concentration was significantly higher than that in the stem and panicle at the heading stage, while the grain N concentration was the highest at maturity only in 2014. At the maturity stage in 2015, the N concentration in the leaf was similar to that in the grain. However, HY549 had the lowest leaf N concentration at maturity in both 2014 and 2015, while YY4949 had the highest N concentration in the leaf and stem at the heading stage in 2015 (Table 5).
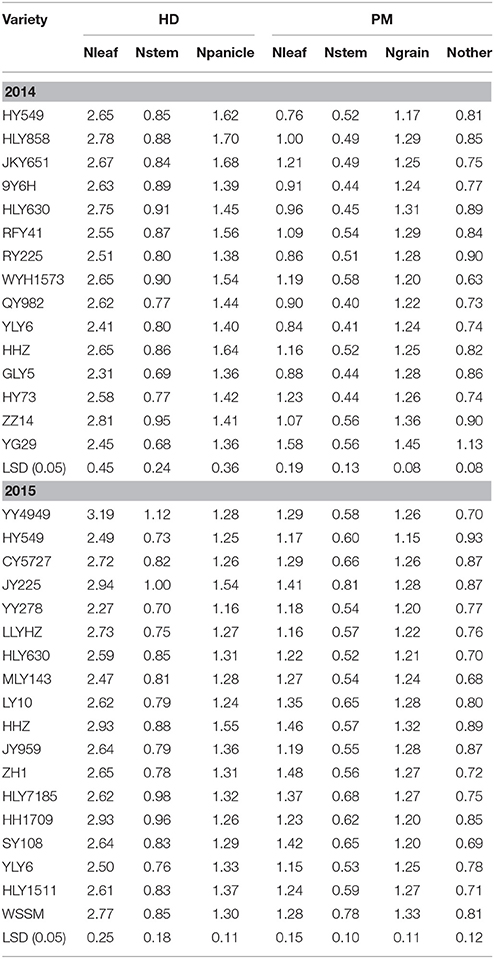
Table 5. Nitrogen concentration in various plant organs of the varieties at the heading stage and maturity in 2014 and 2015 at Wuxue County, Hubei Province, China.
Relationship between NUE and Growth Traits
The data for the varieties in 2014 and 2015 were used for correlation analyses to examine the relationship between the NUE-related parameters and growth analyses (Figures 2, 3; Table 6). A significant quadratic relationship was observed between the grain yield and TNPM, demonstrating that the grain yield was augmented with an increase in TNPM until 180 kg ha−1 (Figure 2A). The significant quadratic relationship between the grain yield and NUEg revealed that improvements in NUEg had no influence on the grain yield when NUEg was higher than 45 kg kg−1 (Figure 2B). Improvements in the N uptake capacity and NUEg were accomplished through breeding for high biomass production and HI, respectively (Figures 2C,D). No significant relationship was observed between NUEg and TNPM (Figure 3A). NUEg was significantly and positively correlated with NUEb and NHI, but was negatively correlated with the N concentration in the grain, leaf, and stem (Figures 3B–F). The quadratic relationship between the NUEg and N concentration in leaf and stem suggested that improvements in NUEg were dependent on a decreased leaf N concentration when the NUEg value was lower than 50 kg kg−1, while further improvements in NUEg were dependent on a decreased stem N concentration (Figures 3E,F).
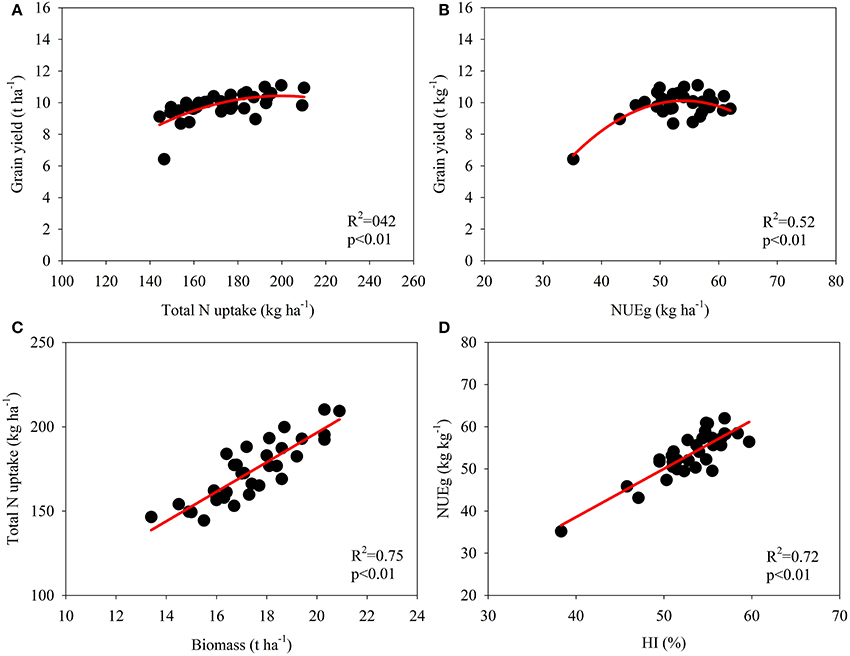
Figure 2. Correlation between total N uptake at maturity and grain yield (A), NUEg and grain yield (B), biomass at maturity and total N uptake (C), and harvest index (HI) and NUEg (D).
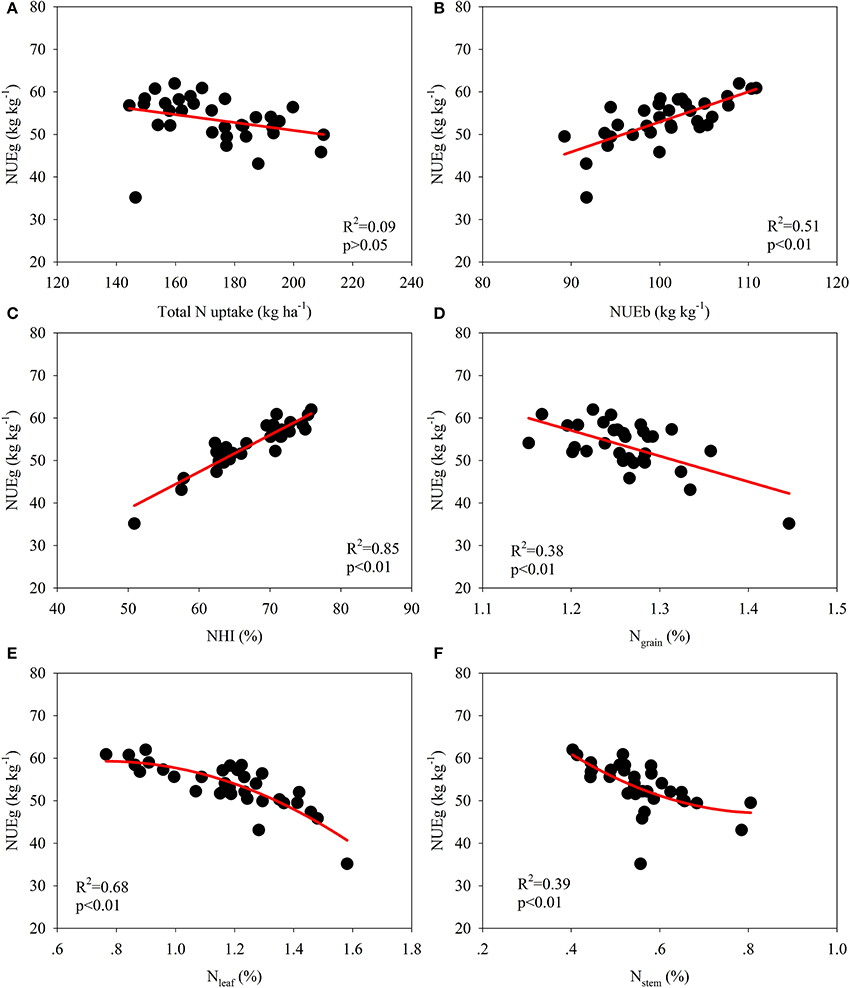
Figure 3. Correlation among NUE-related parameters and their relationship with the N concentration in various plant organs at maturity. (A) Correlation between total N uptake and NUEg, (B) Correlation between NUEb and NUEg, (C) Correlation between NHI and NUEg, (D) Correlation between N grain and NUEg, (E) Correlation between N leaf and NUEg, (F) Correlation between N stem and NUEg.
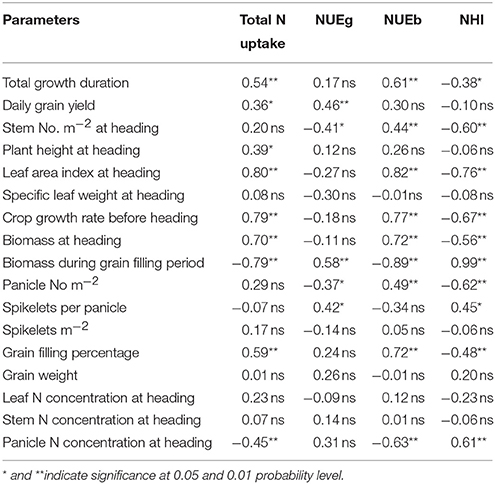
Table 6. Correlation between NUE-related parameters and growth-related parameters.
Many growth traits were significantly and positively correlated with TNPM, such as the total growth duration, daily grain yield, plant height at heading, leaf area index at heading, crop growth rate before heading, biomass at heading, and grain filling percentage. However, the biomass during the grain-filling period and the panicle N concentration at heading were negatively correlated with TNPM (Table 6). A significant and positive correlation was observed between the NUEg and biomass during the grain-filling period, spikelets per panicle, and daily grain yield. Most of the growth parameters affected the NUEb or NHI (Table 6).
Discussion
Intervarietal Difference in NUE
Variations in rice NUE have been studied since the research by Broadbent et al. (1987), who reported significant differences in the NUE of 24 rice genotypes at IRRI. Thereafter, many studies were conducted to examine the rice NUE, showing that TNPM and NUEg ranged from 48 to 130 kg ha−1 and 35 to 79 kg kg−1, respectively, under irrigated lowland conditions (Tirol-Padre et al., 1996; Singh et al., 1998). Under rainfed lowland conditions, Inthapanya et al. (2000) showed that TNPM ranged from 25.7 to 40.4 kg ha−1 and NUEg from 55.1 to 83.8 kg kg−1 for 16 genotypes under a N fertilizer rate of 60 kg ha−1. Under Mediterranean direct water-seeded conditions, Koutroubas and Ntanos (2003) observed that the NUEg ranged from 60.9 to 90.9 kg kg−1 for two indica and three japonica rice varieties at an N fertilizer rate of 150 kg ha−1. In wheat, significant differences in NUE have been examined (Le Gouis et al., 2000). The TNPM and NUEg in wheat ranged from 31 to 264 kg ha−1 and 27 to 77 kg kg−1, respectively, depending on the N rate, variety, and year (Barraclough et al., 2010; Gaju et al., 2011; Bingham et al., 2012).
In a previous study, we observed that TNPM ranged from 138 to 248 kg ha−1, and NUEg ranged from 28.8 to 58.4 kg kg−1 for 14 rice mega varieties developed at different ages. Similarly, both TNPM and NUEg were significantly enhanced through the advancements in genetic breeding (Zhu et al., 2016). In the present study, the TNPM of the elite varieties ranged from 144 to 210 kg ha−1, which was higher than the values observed for rice at a similar N rate, as previously discussed. NUEg ranged from 35.2 to 60.9 kg kg−1, which is consistent with the findings of Tirol-Padre et al. (1996) and Singh et al. (1998), but was lower than the findings of Koutroubas and Ntanos (2003). Koutroubas and Ntanos (2003) reported a grain yield ranging from 6.0 to 8.3 t ha−1, thus the relatively high NUEg reflected a lower TNPM, which ranged from 76.2 to 124.2 kg ha−1. Notably, the grain yield in the present study was significantly higher than the values reported in all of the previous studies, indicating that it is feasible to simultaneously achieve high yield and high efficiency.
Relationship between Grain Yield and NUE
Broadbent et al. (1987) evaluated the stability of nine NUE-related parameters using the N15 labeling method to rank the genotypes across different seasons, and De Datta and Broadbent (1988) further tested these methods without using isotopically labeled fertilizer to reflect genotypic variations in NUE. These studies showed that the yield and GW/Nt were the most stable parameters reflecting genotypic differences in the NUE of rice. In the present study, the grain yield and daily grain yield were significantly and positively correlated with both TNPM and NUEg (Figure 2, Table 6; Samonte et al., 2006). This finding is consistent with the evidence that genetic improvements in the yield potential improve both TNPM and NUEg (Fischer, 1981; Bingham et al., 2012; Zhu et al., 2016). However, the correlations between the grain yield and TNPM and between the grain yield and NUEg were quadratic (Figures 2A,B; Cassman et al., 1993; Singh et al., 1998). This finding indicated that the increase in grain yield through an increase in TNPM is marginal when TNPM is higher than 150 kg ha−1, and this increase is likely to improve NUEg while maintaining a high grain yield.
Plant Traits Related with NUE
The N uptake efficiency accounted for 64% of the variation in the NUE at zero N rate, while the NUEg was more significant at a higher N rate (Le Gouis et al., 2000). Gaju et al. (2011) also demonstrated the association between the N uptake efficiency and showed that NUE increased with increasing N limitation. Thus, breeders should select varieties with a high N uptake efficiency for low-yield crops, and varieties with high NUEg for high-yield crops, although it is possible to simultaneously improve the N uptake efficiency and NUEg (Figure 3A; Moll et al., 1982). The following plant traits were associated with TNPM and NUEg.
TNPM could be estimated from primary plant parameters, as this measurement was significantly correlated with the tiller number, spikelet number, main culm panicle node number reflecting the potential tillers and leaves of a plant (Singh et al., 1998; Samonte et al., 2006). Moreover, Singh et al. (1998) observed that varieties with long growth durations had higher TNPM values compared with varieties with medium growth durations. In addition, deeper roots and greater root oxidation activities are important for N uptake at low N rates in both rice and wheat (Foulkes et al., 2009; Worku et al., 2012; Ju et al., 2015). In the present study, TNPM was significantly and positively correlated with total growth duration, plant height at heading, leaf area index at heading, crop growth rate before heading, biomass at heading, and grain filling percentage, but it was negatively correlated with biomass accumulation during the grain filling period and panicle N concentration at heading (Table 6). Consequently, genetically promoting plant growth prior to heading is important for improvements in the TNPM at low N rates.
N utilization efficiency is dependent on the N efficiency of biomass formation, the effect of N on carbohydrate partitioning, nitrate reduction efficiency, and remobilization of N from senescent tissues and storage functions (Foulkes et al., 2009). NUEg was significantly correlated with HI (Figure 2D), as HI was positively and significantly correlated with the dry matter translocation efficiency (Ntanos and Koutroubas, 2002). Mathematically, NUEg is equal to the ratio of the NHI and grain N concentration; thus, the NUEg was positively and significantly correlated with the NHI but was negatively correlated with the grain N concentration (Figures 3C,D). In the present study, the NHI ranged from 57.5 to 75.0%, which is consistent with the values reported in the studies of Tirol-Padre et al. (1996) and Singh et al. (1998). Consequently, it might be possible to further increase the NHI of rice to some extent (Sinclair and Vadez, 2002). Significant negative correlations between the grain N concentration and NUEg have been widely demonstrated among different genotypes in rice and wheat (Singh et al., 1998; Inthapanya et al., 2000; Koutroubas and Ntanos, 2003). Moreover, Cassman et al. (1993) demonstrated that a lower N content grain in rice than that in bread wheat contributes to a higher NUEg in rice, particularly at high yield levels. The straw N concentration explained a large percentage of the genotypic variation in NUEg in the studies of Singh et al. (1998) and Koutroubas and Ntanos (2003). In the present study, we further demonstrated that the variation in NUEg was dependent on the changes in the leaf N concentration at maturity at low NUEg levels, while further increases in NUEg resulted from decreases in the stem N concentration (Figures 3E,F). These results are consistent with the findings in wheat, suggesting that delayed leaf senescence is a key trait for increasing NUEg at low N supply (Foulkes et al., 2009; Gaju et al., 2011). Moreover, NUEg was significantly and positively correlated with biomass accumulation during the grain-filling period, spikelets per panicle and daily grain yield (Table 6).
In conclusion, the present study determined the genotypic variation in NUE among newly developed elite rice varieties in China and demonstrated that genetic improvements in the yield potential under high nutrient input conditions also increased the TNPM and NUEg at a low N supply. The quadratic correlation between the grain yield and TNPM and between the grain yield and NUEg suggests that a further increase in N uptake results in a small increase in grain yield when TNPM is above 160 kg ha−1, and it is possible to simultaneously achieve a high grain yield and high NUEg under low N supply. Improvements in the NUE are likely to occur with simultaneous increases in TNPM and NUEg through the improvements in the daily grain yield. Plant traits associated with the rapid crop growth rate prior to heading could be used to increase TNPM, while biomass accumulation and a large panicle are essential for improvements in NUEg. Moreover, further improvements in NUEg depend on the increase in the translocation of N from the stems to delay leaf senescence during the grain-filling period.
Author Contributions
LW, SY, LH, and FS conducted the field experiments. SP and FW designed the experiments. SF revised the manuscript. LW analyzed the data, and FW drafted the manuscript.
Funding
This work was financially supported by grants from the National High Technology Research and Development Program of China (the 863 Project no. 2014AA10A605), the Bill and Melinda Gates Foundation (OPP51587), and the Fundamental Research Funds for the Central Universities (Project 2015BQ002).
Conflict of Interest Statement
The authors declare that the research was conducted in the absence of any commercial or financial relationships that could be construed as a potential conflict of interest.
References
Andrews, M., Raven, J. A., and Lea, P. J. (2013). Do plants need nitrate? The mechanisms by which nitrogen form affects plants. Ann. Appl. Biol. 163, 174–199. doi: 10.1111/aab.12045
Barraclough, P. B., Howarth, J. R., Jones, J., Lopez-Bellido, R., Parmar, S., Shepherd, C. E., et al. (2010). Nitrogen efficiency of wheat: genotypic and environmental variation and prospects for improvement. Eur. J. Agron. 33, 1–11. doi: 10.1016/j.eja.2010.01.005
Bingham, I. J., Karley, A. J., White, P. J., Thomas, W. T. S., and Russell, J. R. (2012). Analysis of improvements in nitrogen use efficiency associated with 75 years of spring barley breeding. Eur. J. Agron. 42, 49–58. doi: 10.1016/j.eja.2011.10.003
Broadbent, F. E., De Datta, S. K., and Laureles, E. V. (1987). Measurement of nitrogen utilization efficiency in rice genotypes. Agron. J. 79, 786–791. doi: 10.2134/agronj1987.00021962007900050006x
Cassman, K. G. (1999). Ecological intensification of cereal production systems: yield potential, soil quality, and precision agriculture. Proc. Natl. Acad. Sci. U.S.A. 96, 5952–5959. doi: 10.1073/pnas.96.11.5952
Cassman, K. G., Kropff, M. J., Gaunt, J., and Peng, S. (1993). Nitrogen use efficiency of rice reconsidered: what are the key constraints. Plant Soil 155/156, 359–362. doi: 10.1007/BF00025057
De Datta, S. K., and Broadbent, F. E. (1988). Methodology for evaluating nitrogen utilization efficiency by rice genotypes. Agron. J. 80, 793–798. doi: 10.2134/agronj1988.00021962008000050020x
De Datta, S. K., and Broadbent, F. E. (1993). Development changes related to nitrogen-use efficiency in rice. Field Crops Res. 34, 47–56. doi: 10.1016/0378-4290(93)90110-9
De Datta, S. K., and Buresh, R. J. (1989). Integrated nitrogen management in irrigated rice. Adv. Soil Sci. 10, 143–169. doi: 10.1007/978-1-4613-8847-0_4
Diaz, R. J., and Rosenberg, R. (2008). Spreading dead zones and consequences for marine ecosystems. Science 321, 926–929. doi: 10.1126/science.1156401
Dobermann, A., Witt, C., Dawe, D., Gines, H. C., Nagarajan, R., Satawathananont, S., et al. (2002). Site-specific nutrient management for intensive rice cropping systems in Asia. Field Crops Res. 74, 37–66. doi: 10.1016/S0378-4290(01)00197-6
Evans, L. T., and Fischer, R. A. (1999). Yield potential: its definition, measurement, and significance. Crop Sci. 39, 1544–1551. doi: 10.2135/cropsci1999.3961544x
Fischer, R. A. (1981). Optimization the use of water and nitrogen through breeding for crops. Plant Soil 58, 249–278. doi: 10.1007/BF02180056
Foulkes, M. J., Hawkesford, M. J., Barraclough, P. B., Holdsworth, M. J., Kerr, S., Kightley, S., et al. (2009). Identifying traits to improve the nitrogen economy of wheat: recent advances and future prospects. Field Crops Res. 114, 329–342. doi: 10.1016/j.fcr.2009.09.005
Gaju, O., Allard, V., Martre, P., Snape, J. W., Heumez, E., Le Gouis, J., et al. (2011). Identification of traits to improve the nitrogen-use efficiency of wheat genotypes. Field Crops Res. 123, 139–152. doi: 10.1016/j.fcr.2011.05.010
Godfray, H. C., Beddington, J. R., Crute, I. R., Haddad, L., Lawrence, D., Muir, J. F., et al. (2010). Food security: the challenge of feeding 9 billion people. Science 327, 812–818. doi: 10.1126/science.1185383
Guo, J. H., Liu, X. J., Zhang, Y., Shen, J. L., Han, W. X., Zhang, W. F., et al. (2010). Significant acidification in major Chinese croplands. Science 327, 1008–1010. doi: 10.1126/science.1182570
Hu, B., Wang, W., Ou, S., Tang, J., Li, H., and Che, R. (2015). Variation in NRT1.1B contributes to nitrate-use divergence between rice subspecies. Nat. Genet. 47, 834–838. doi: 10.1038/ng.3337
Inthapanya, P., Sipaseuth, Sihavong, P., Sihathep, V., Chanphengsay, M., Fukai, S., et al. (2000). Genotype differences in nutrient uptake and utilization for grain yield production of rainfed lowland rice under fertilized and non-fertilized conditions. Field Crops Res. 65, 57–68. doi: 10.1016/S0378-4290(99)00070-2
Ju, C., Buresh, R. J., Wang, Z., Zhang, H., Liu, L., Yang, J., et al. (2015). Root and shoot traits for rice varieties with higher grain yield and higher nitrogen use efficiency at lower nitrogen rates application. Field Crops Res. 175, 47–55. doi: 10.1016/j.fcr.2015.02.007
Koning, N. B. J., Van Ittersum, M. K., Becx, G. A., Van Boekel, M., Brandenburg, W., Van Den Broek, J. A., et al. (2008). Long-term global availability of food: continued abundance or new scarcity? Wagen. J. Life Sci. 55, 229–292. doi: 10.1016/s1573-5214(08)80001-2
Koutroubas, S. D., and Ntanos, D. A. (2003). Genotypic differences for grain yield and nitrogen utilization in Indica and Japonica rice under Mediterranean conditions. Field Crops Res. 83, 251–260. doi: 10.1016/S0378-4290(03)00067-4
Le Gouis, J., Beghin, D., Heumez, E., and Pluchard, P. (2000). Genetic differences for nitrogen uptake and nitrogen utilisation efficiencies in winter wheat. Eur. J. Agron. 12, 163–173. doi: 10.1016/S1161-0301(00)00045-9
Li, J., Zhang, Y., Wu, J., Shu, Y., Zhou, P., and Deng, Q. (2014). High-yielding cultural techniques of super hybrid rice YLY900 yielded 15.40 t/hm2 on a 6.84 hm2 scale. China Rice 20, 1–4.
Moll, R. H., Kamprath, E. J., and Jackson, W. A. (1982). Analysis and interpretation of factors which contribute to efficiency of nitrogen-utilization. Agron. J. 74, 562–564. doi: 10.2134/agronj1982.00021962007400030037x
Ntanos, D. A., and Koutroubas, S. D. (2002). Dry matter and N accumulation and translocation for Indica and Japonica rice under Mediterranean conditions. Field Crops Res. 74, 93–101. doi: 10.1016/S0378-4290(01)00203-9
Peng, S., Buresh, R. J., Huang, J., Yang, J., Zou, Y., Zhong, X., et al. (2006). Strategies for overcoming low agronomic nitrogen use efficiency in irrigated rice systems in China. Field Crops Res. 96, 37–47. doi: 10.1016/j.fcr.2005.05.004
Peng, S., Garcia, F. V., Laza, R. C., Sanico, A. L., Visperas, R. M., and Cassman, K. G. (1996). Increased N-use efficiency using a chlorophyll meter on high-yielding irrigated rice. Field Crops Res. 47, 243–252. doi: 10.1016/0378-4290(96)00018-4
Peng, S., Huang, J., Sheehy, J. E., Laza, R. C., Visperas, R. M., Zhong, X. H., et al. (2004). Rice yields decline with higher night temperature from global warming. Proc. Natl. Acad. Sci. U.S.A. 101, 9971–9975. doi: 10.1073/pnas.0403720101
Peng, S., Huang, J., Zhong, X., Yang, J., Wang, G., Zou, Y., et al. (2002). Research strategy in improving fertilizer-nitrogen use efficiency of irrigated rice in China. Sci. Agric. Sin. 35, 1095–1103.
Peng, S., Khush, G. S., Virk, P., Tang, Q., and Zou, Y. (2008). Progress in ideotype breeding to increase rice yield potential. Field Crops Res. 108, 32–38. doi: 10.1016/j.fcr.2008.04.001
Samonte, S., Wilson, L. T., Medley, J. C., Pinson, S. R. M., McClung, A. M., and Lales, J. S. (2006). Nitrogen utilization efficiency: relationships with grain yield, grain protein, and yield-related traits in rice. Agron. J. 98, 168–176. doi: 10.2134/agronj2005.0180
Sheng, C., Wang, H., Sheng, S., Gao, L., and Xuan, W. (2003). Pest status and loss assessment of crop damage caused by the rice borers, Chilo suppressalis and Tryporyza incertulas in China. Entomol. Knowledge 40, 289–294.
Sinclair, T. R., and Vadez, V. (2002). Physiological traits for crop yield improvement in low N and P environments. Plant Soil 245, 1–15. doi: 10.1023/A:1020624015351
Singh, U., Ladha, J. K., Castillo, E. G., Punzalan, G., Tirol-Padre, A., and Duqueza, M. (1998). Genotypic variation in nitrogen use efficiency in medium- and long-duration rice. Field Crops Res. 58, 35–53. doi: 10.1016/S0378-4290(98)00084-7
Smil, V. (1999). Nitrogen in crop production: an account of global flows. Global Biogeochem. Cycles 13, 647–662. doi: 10.1029/1999GB900015
Sun, H., Qian, Q., Wu, K., Luo, J., Wang, S., and Zhang, C. (2014). Heterotrimeric G proteins regulate nitrogen-use efficiency in rice. Nat. Genet. 46, 652–657. doi: 10.1038/ng.2958
Tao, F., Zhang, S., and Zhang, Z. (2013). Changes in rice disasters across China in recent decades and the meteorological and agronomic causes. Reg. Environ. Change 13, 743–759. doi: 10.1007/s10113-012-0357-7
Tirol-Padre, A., Ladha, J. K., Singh, U., Laureles, E., Punzalan, G., and Akita, S. (1996). Grain yield performance of rice genotypes at suboptimal levels of soil N as affected by N uptake and utilization efficiency. Field Crops Res. 46, 127–143. doi: 10.1016/0378-4290(95)00095-X
Vlek, P. L. G., and Byrnes, B. H. (1986). The efficacy and loss of fertilizer N in lowland rice. Fertil. Res. 9, 131–147. doi: 10.1007/BF01048699
Worku, M., Banziger, M., Erley, G., Friesen, D., Diallo, A. O., and Horst, W. J. (2012). Nitrogen efficiency as related to dry matter partitioning and root system size in tropical mid-altitude maize hybrids under different levels of nitrogen stress. Field Crops Res. 130, 57–67. doi: 10.1016/j.fcr.2012.02.015
Zhang, Q. (2007). Strategies for developing green super rice. Proc. Natl. Acad. Sci. U.S.A. 104, 16402–16409. doi: 10.1073/pnas.0708013104
Zhong, X., Huang, R., Zheng, H., Peng, S., and Buresh, R. J. (2007). Specification for the “Three Controls” nutrient management technology for irrigated rice. Guangdong Agric. Sci. 5s, 13–15.
Keywords: daily grain yield, Green Super Rice, grain yield, nitrogen use efficiency
Citation: Wu L, Yuan S, Huang L, Sun F, Zhu G, Li G, Fahad S, Peng S and Wang F (2016) Physiological Mechanisms Underlying the High-Grain Yield and High-Nitrogen Use Efficiency of Elite Rice Varieties under a Low Rate of Nitrogen Application in China. Front. Plant Sci. 7:1024. doi: 10.3389/fpls.2016.01024
Received: 23 February 2016; Accepted: 28 June 2016;
Published: 15 July 2016.
Edited by:
José Luis Araus, Universitat de Barcelona, SpainReviewed by:
Iker Aranjuelo, Agrobiotechnology Institute-CSIC-UPNA, SpainSushma Naithani, Oregon State University, USA
Copyright © 2016 Wu, Yuan, Huang, Sun, Zhu, Li, Fahad, Peng and Wang. This is an open-access article distributed under the terms of the Creative Commons Attribution License (CC BY). The use, distribution or reproduction in other forums is permitted, provided the original author(s) or licensor are credited and that the original publication in this journal is cited, in accordance with accepted academic practice. No use, distribution or reproduction is permitted which does not comply with these terms.
*Correspondence: Fei Wang, fwang@mail.hzau.edu.cn