 Deserah D. Strand1,2†
 Aaron K. Livingston3†
 Mio Satoh-Cruz2Tyson Koepke4Heather M. Enlow3
 Nicholas Fisher2
 John E. Froehlich2,5
 Jeffrey A. Cruz2Deepika Minhas4Kim K. Hixson3,6
 Kaori Kohzuma2Mary Lipton6
 Amit Dhingra4
 David M. Kramer1,2,5*
- 1Department of Plant Biology, Michigan State University, East Lansing, MI, USA
- 2DOE-Plant Research Laboratory, Michigan State University, East Lansing, MI, USA
- 3Institute of Biological Chemistry, Washington State University, Pullman, WA, USA
- 4Department of Horticulture, Washington State University, Pullman, WA, USA
- 5Department of Biochemistry and Molecular Biology, Michigan State University, East Lansing, MI, USA
- 6Environmental Molecular Sciences Laboratory, Pacific Northwest National Laboratory, Richland, WA, USA
We describe a new member of the class of mutants in Arabidopsis exhibiting high rates of cyclic electron flow around photosystem I (CEF), a light-driven process that produces ATP but not NADPH. High cyclic electron flow 2 (hcef2) shows strongly increased CEF activity through the NADPH dehydrogenase complex (NDH), accompanied by increases in thylakoid proton motive force (pmf), activation of the photoprotective qE response, and the accumulation of H2O2. Surprisingly, hcef2 was mapped to a non-sense mutation in the TADA1 (tRNA adenosine deaminase arginine) locus, coding for a plastid targeted tRNA editing enzyme required for efficient codon recognition. Comparison of protein content from representative thylakoid complexes, the cytochrome bf complex, and the ATP synthase, suggests that inefficient translation of hcef2 leads to compromised complex assembly or stability leading to alterations in stoichiometries of major thylakoid complexes as well as their constituent subunits. Altered subunit stoichiometries for photosystem I, ratios and properties of cytochrome bf hemes, and the decay kinetics of the flash-induced thylakoid electric field suggest that these defect lead to accumulation of H2O2 in hcef2, which we have previously shown leads to activation of NDH-related CEF. We observed similar increases in CEF, as well as increases in H2O2 accumulation, in other translation defective mutants. This suggests that loss of coordination in plastid protein levels lead to imbalances in photosynthetic energy balance that leads to an increase in CEF. These results taken together with a large body of previous observations, support a general model in which processes that lead to imbalances in chloroplast energetics result in the production of H2O2, which in turn activates CEF. This activation could be from either H2O2 acting as a redox signal, or by a secondary effect from H2O2 inducing a deficit in ATP.
Introduction
This work arose out of our attempts to understand how chloroplasts balance their energy budgets to efficiently capture solar energy and provide plants with sufficient energy for growth and maintenance while avoiding self-destructive side reactions, which led us to find unexpected connections between the maintenance of photosynthesis, the regulation of rigid stoichiometries of protein complexes in the chloroplast and the production of the reactive oxygen species H2O2.
In oxygenic photosynthesis, light is harvested by two distinct photochemical reaction centers, photosystem II (PSII) and photosystem I (PSI) that stimulate electron transfer through series of redox carriers to store solar energy in forms to drive biochemical processes (Eberhard et al., 2008). When PSI and PSII are electronically connected in series, they drive linear electron flow (LEF), which results in the oxidation of water and the reduction of NADPH. The electron transfer reactions of LEF are coupled to the uptake of protons from the chloroplast stroma and their deposition into the lumen, establishing an electrochemical gradient of protons, or proton motive force (pmf). Protons are taken up during reduction of plastoquinone at the QB site of PSII and the Qi site of the cytochrome bf complex (bf). Protons are released into the lumen during water oxidation at the oxygen-evolving complex (OEC) of PSII and during plastoquinol oxidation at the Qo site of the cytochrome bf complex. The pmf generated in these electron and proton transfer reactions drives the synthesis of ATP at the chloroplast ATP synthase.
The pmf also regulates the light reactions of photosynthesis through its effects on lumen pH-dependent qE component of non-photochemical quenching (NPQ; reviewed in Müller et al., 2001), and electron flow through the cytochrome bf complex (Hope et al., 1994; Takizawa et al., 2007). The pmf, in turn, is modulated in response to environmental and metabolic conditions (Kanazawa and Kramer, 2002; Avenson et al., 2005; Cruz et al., 2005; Kohzuma et al., 2009; Strand and Kramer, 2014), allowing for fine-tuning of regulation of the light reactions in response to changes in metabolic state. The pmf can be controlled by regulating both rate of proton influx into the lumen, through the light-driven electron transfer reactions, and the efflux of protons from the lumen via the chloroplast ATP synthase, with different consequences on the balance of energy storage in ATP and NADPH and thus also affect downstream metabolic processes (Kramer et al., 2004; Cruz et al., 2005; Kramer and Evans, 2011).
The deposition of protons into the lumen is dependent on the rate of LEF. In addition, cyclic electron flow around PSI (CEF) is thought to contribute to pmf, and thus potentially to the activation of photoprotective mechanisms, and to augment the production of ATP to balance the ATP/NADPH energy budget (reviewed in Kramer and Evans, 2011).
CEF is a light-driven energy storing process that involves PSI but not PSII (Bendall and Manasse, 1995). Electrons from PSI are transferred to plastoquinone (PQ) forming plastoquinol (PQH2), which is subsequently oxidized by bf and shuttled back to PSI by plastocyanin (PC). The translocation of protons from the chloroplast stroma to the lumen through the Q-cycle, catalyzed by the bf complex (Cape et al., 2006; Cramer et al., 2011), contributes to the formation of pmf and ATP synthesis, but without net reduction of NADPH. In this way, CEF has been implicated in balancing the chloroplast energy budget by augmenting ATP production, and is thus thought to be physiologically important under conditions of elevated ATP demands. For example, CEF is known to be induced under environmental stresses such as drought (Kohzuma et al., 2009; Huang et al., 2012), high light (Takahashi et al., 2009), and chilling (Huang et al., 2010) when ATP may be needed to repair cellular machinery, maintain ion homeostasis, transport proteins, etc. CEF is also thought to be supply ATP for CO2 concentrating mechanisms, including the C4 cycle in plants (Takabayashi et al., 2005) and the carbon concentrating mechanism (CCM) in green algae, and appears to be critical under anoxia (Alric, 2014) or when CO2 is limiting (Lucker and Kramer, 2013) in the green alga Chlamydomonas reinhardtii. It is also possible that CEF plays a regulatory role in photosynthesis by acidifying the thylakoid lumen and thus activating the photoprotective qE response and slowing electron flow at the bf complex (Munekage et al., 2002; Takahashi et al., 2009). However, it is important to recognize that uncontrolled activation of CEF will also result in a change in the ATP/NADPH output stoichiometry, a situation that can lead to deleterious secondary effects. Thus, chloroplasts also have alternate mechanisms of regulating lumen acidification that do not result in alteration of ATP/NADPH, including modulation of ATP synthase rates, and these appear to play primary roles in regulating photoprotection (reviewed in Strand and Kramer, 2014).
Several alternative CEF pathways have been proposed, that involve different PQ reductases, including the antimycin A sensitive ferredoxin:quinone reductase (FQR) pathway (Tagawa et al., 1963; Bendall and Manasse, 1995; Munekage et al., 2002; DalCorso et al., 2008; Alric, 2014), the Qi site of the bf complex (Zhang et al., 2001; Joliot and Joliot, 2006), and the ferredoxin dehydrogenase complex (NDH, also referred to as the NADPH:plastoquinone oxidoreductase complex, though its substrate is Fd; Burrows et al., 1998; Sazanov et al., 1998). It is likely that different CEF pathways are activated in different species, and/or under different conditions (Casano et al., 2001; Lascano et al., 2003; Havaux et al., 2005; Takabayashi et al., 2005; Kohzuma et al., 2009; Iwai et al., 2010; Lucker and Kramer, 2013; Takahashi et al., 2013; Strand et al., 2015, 2016). To make matters more complex, a range of regulatory signals have been proposed for CEF, including sensing of ATP/ADP ratios (Joliot and Joliot, 2002, 2006), chloroplast redox status (Breyton et al., 2006; Takahashi et al., 2013; Alric, 2014; Johnson et al., 2014), metabolic intermediates (Fan et al., 2007), state transitions (Finazzi et al., 2002; Iwai et al., 2010), calcium (Terashima et al., 2012), and reactive oxygen species (Casano et al., 2001; Lascano et al., 2003; Strand et al., 2015).
To address these questions, we initiated an effort to discover new CEF structural and regulatory components by isolating mutants of Arabidopsis (Arabidopsis thaliana) with constitutively elevated CEF, which we named high cyclic electron flow (hcef) mutants (Livingston et al., 2010a,b). The first of these mutants to be reported, hcef1, was mapped to a missense mutation in the chloroplast-targeted fructose 1,6 bisphosphatase (FBPase), and appears to indirectly activate CEF by disrupting redox balance (Livingston et al., 2010b; Strand et al., 2015) possibly by activating a futile metabolic cycle that consumes ATP (Livingston et al., 2010a; Sharkey and Weise, 2015) leading to the generation of H2O2, which has been proposed to activate CEF (Strand et al., 2015). Results from a series of double mutants and inhibitors indicate that CEF in hcef1 (Livingston et al., 2010a), and that seen in response to H2O2 (Strand et al., 2015), involves the chloroplast NDH complex and not the antimycin A sensitive FQR pathway.
In this work, we report on the isolation and characterization of hcef2, which was mapped to an unexpected locus involving tRNA editing. Despite very different processes involved, hcef2 was found to have similar levels of CEF activation, H2O2 generation and increases in photoprotection as hcef1. This finding has strong implications for the role of CEF, including the possible involvement of reactive oxygen species in its regulation, and the critical importance of strict regulation of plastid proteome stoichiometries.
Results
Genetic Selection of hcef Mutants
As described in detail in Livingston et al. (2010a), we identified hcef mutants using a multi-stage selection process from a pool of ethyl methanesulfonate (EMS) mutagenized seeds (Columbia ecotype [Col-0], Lehle Seeds [M2E-02-05]). We first used chlorophyll fluorescence imaging to screen for plants that displayed high qE phenotypes, likely indicating high light-induced pmf. We then subjected this population to secondary screening using a series of measurements of light-driven electron and proton transfer reactions, based on analysis of chlorophyll a fluorescence and absorbance changes (Sacksteder and Kramer, 2000; Baker et al., 2007; Baker, 2008; Livingston et al., 2010a) to identify mutants with elevated CEF.
Growth of hcef2
The hcef2 mutant grew photoautotrophically in soil, but with an impaired growth rate (Figure 1). Col-0 was fully expanded in 24–28 days, whereas hcef2 of the same age had a rosette diameter <20% that of Col-0. Bolting was delayed in hcef2. The hcef2 mutant displayed a slightly pale appearance owing to lower accumulation of chlorophyll compared to Col-0 levels per leaf area (157.8 mg/m2 ± 5.7 and 271.6 mg/m2 ± 5.1, respectively, p = 0.00001, Student's t-test, n = 3). All of the following results were obtained on plants at the same developmental stage, regardless of age, just prior to bolting.
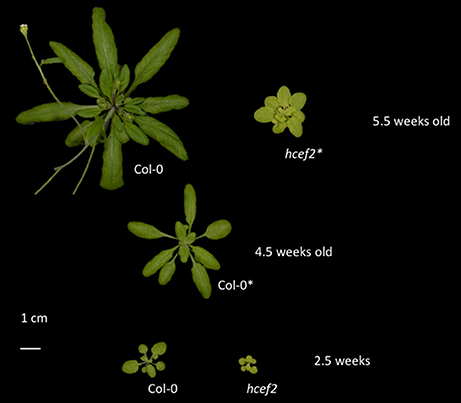
Figure 1. Growth phenotype of Col-0 and hcef2. The developmental stage of each genotype used for experimentation is marked with (*).
Photosynthetic Properties of hcef2 Compared to Col-0 Responses of Photosynthetic Electron Transport
Chlorophyll a fluorescence was used to estimate linear electron flow (LEF) and qE responses after accounting for differences in leaf absorptivity using the approach described previously (Dai et al., 1996; Livingston et al., 2010a). The hcef2 mutant showed suppressed LEF rates across all light intensities used, about four-fold lower than Col-0 at saturating light (21.2 ± 1.68 and 82.6 ± 2.83 μmol e− m−2 s−1, respectively, ~480 μmol photons m−2 s−1; Figure 2A). The half-saturation irradiance for LEF in hcef2 (~90 μmol photons m−2 s−1) was ~65% that of Col-0 (~140 μmol photons m−2 s−1). In addition to differences in PSII electron transfer rates, Col-0 and hcef2 showed distinct 77 K fluorescence emission spectra (Figure 2B), reflecting large changes in the composition, and state distribution of photosynthetic antenna complexes. The hcef2 mutant showed a large increase in the relative emission of long-wavelength (~735 nm) emission associated with PSI antenna complexes, compared to shorter wavelength (685 nm) emission reflecting antenna complexes associated with PSII (for review see Krause and Weis, 1984). In addition, the PSI associated peak showed a strong blue shift, likely reflecting dissociation or loss of LCHI complexes from the PSI core (see below).
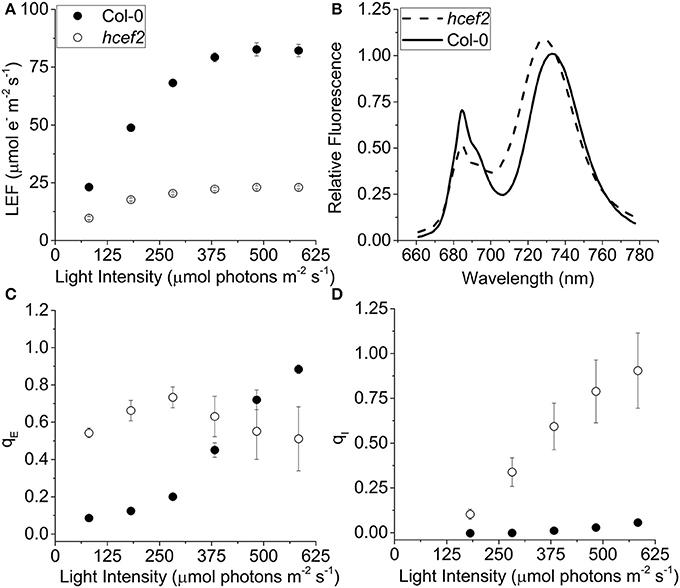
Figure 2. Effects of hcef2 on photosynthetic properties. (A) Photosynthetic linear electron flow (LEF) as a function of light intensity. Col-0 (closed circles) and hcef2 (open circles). Mean ± SD, n = 3. (B) 77k emission spectra. Col-0 (solid line) and hcef2 (dashed line). Emission spectra are representative of three independent experiments. (C) Energy dependent exciton quenching (qE) as a function of light intensity. Col-0 (closed circles) and hcef2 (open circles). Mean ± SD, n = 3. (D) Photoinhibition (qI) as a function of light intensity. Col-0 (closed circles) and hcef2 (open circles). Mean ± SD, n = 3.
The maximal photochemical efficiency of PSII in dark-adapted leaves, estimated by the Fv/FM parameter, was substantially lower in hcef2 (0.59 ± 0.066) compared to Col-0 (0.80 ± 0.003), probably indicating the accumulation of unrepaired photoinhibition in the mutant. Col-0 showed a typical sigmoidal response of qE to light intensity (compared to results in e.g., Takizawa et al., 2007; Figure 2C), with an apparent half-saturation point at 375 μmol photons m−2 s−1 reaching ~0.9 at the highest light intensity tested, similar to previous results on plants grown under similar conditions (Livingston et al., 2010a). The qE response of hcef2 was distinct from those of Col-0, exhibiting high levels of qE even at low light intensities. For example, at 80 μmol photons m−2 s−1, qE in hcef2 was approximately four-fold higher than in Col-0 (0.54 ± 0.026, 0.09 ± 0.12, respectively; Figure 2C). In hcef2, qE reached a maximum at about 280 μmol photons m−2 s−1 with a value of 0.73 (±0.055, n = 3), but decreased slightly at higher irradiances likely reflecting the accumulation of photodamage at higher light in hcef2, as is consistent with the observed increase over this time in the slowly-reversible NPQ component, qI, which is typically associated with the onset of photoinhibition (Figure 2D).
Responses of the Photosynthetic Proton Circuit of hcef2
We measured dark interval relaxation kinetics (DIRK) of the electrochromic shift (ECS) to probe the proton circuit of photosynthesis (see reviews in Cruz et al., 2005; Baker et al., 2007). The extent of light-driven pmf was estimated from the total amplitude of the decay signal (ECSt); the relative rate of light-driven proton flux (vH+) was estimated from the initial slope of the ECS decay; and the conductivity of the thylakoid membrane to protons (gH+), which predominantly reflects the activity of the chloroplast ATP synthase, was estimated from the lifetime of the ECS decay (Sacksteder and Kramer, 2000; Cruz et al., 2005; Baker et al., 2007). From these values we calculated relative electron and proton fluxes through thylakoid components, and inferred the activation state of CEF (discussed in Livingston et al., 2010a,b; Strand and Kramer, 2014).
The hcef2 mutant showed strongly decreased LEF compared to Col-0 (Figure 2A), yet produced substantially higher light-driven pmf, as indicated by increased ECSt-values as a function of LEF (Figure 3A). At an LEF-value of 20 μmol electrons m−2 s−1, hcef2 had a four-fold higher ECSt than Col-0 (0.002 ± 0.0001 and 0.0042 ± 0.000075, respectively, n = 3). The increased pmf was associated with qualitatively elevated qE in hcef2 (Figure 3B), as would be expected based on the lumen pH-dependence of the qE response (reviewed in Müller et al., 2001). While Col-0 showed a sigmoidal dependence of qE on ECSt, as previously reported (Takizawa et al., 2007), hcef2 showed high activation of qE at even low ECSt-values, but saturated at relatively low LEF or ECSt extents (Figures 3B,C). The higher sensitivity of qE responses in hcef2 was more sensitive to estimated pmf changes (ECSt) in hcef2 compared to Col-0, indicating additional factors beyond the pmf play a role in modulating the qE response in hcef2 (discussed below).
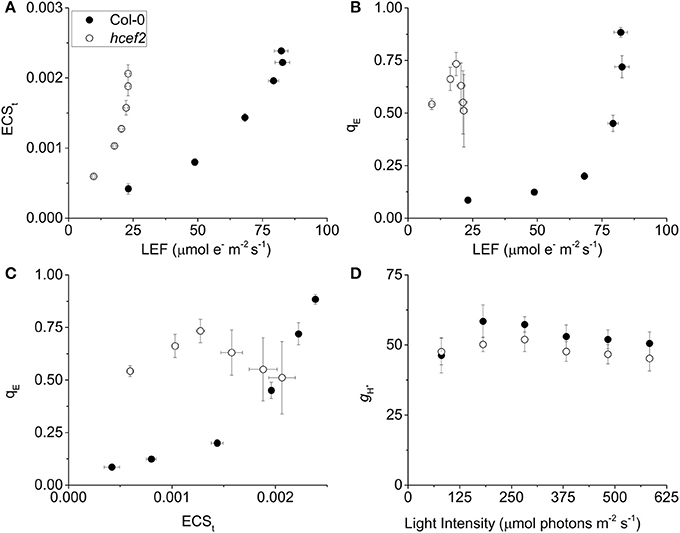
Figure 3. Effects of hcef2 on the photosynthetic proton circuit. (A) Light driven transthylakoid pmf as measured by ECSt as a function of LEF. Col-0 (closed circles) and hcef2 (open circles). Mean ± SD, n = 3. (B) qE as a function of LEF. Col-0 (closed circles) and hcef2 (open circles). Mean ± SD, n = 3. (C) qE as a function of ECSt. Col-0 (closed circles) and hcef2 (open circles). Mean ± SD, n = 3. (D) Thylakoid proton conductivity (gH+) as a function of light intensity. Col-0 (closed circles) and hcef2 (open circles). Mean ± SD, n = 3.
Assessment of ATP Synthase Activity In vivo
As discussed earlier (Kanazawa and Kramer, 2002; Cruz et al., 2005), thylakoid pmf can be increased with respect to LEF by either accelerating proton influx through CEF or retarding proton efflux from the lumen by inactivating the chloroplast ATP synthase. To distinguish between these possibilities, we assessed the relative proton conductivity of the thylakoid membrane (gH+) using the ECS decay lifetime measurements. As shown in Figure 3D, gH+-values for Col-0 and hcef2 were nearly identical, varying by <10%, indicating that the observed increases in pmf and qE responses in hcef2 could not be explained by down-regulation of the chloroplast ATP synthase.
Estimates of CEF1 in hcef2
We next used three complementary approaches to assess the activation of CEF in hcef2. In the first approach, we compared proton flux estimated from initial decay rates of the ECS signal (vH+) with LEF estimated from chlorophyll a fluorescence parameters. When vH+ was plotted as a function of LEF (Figure 4A), hcef2 showed a ~three-fold increase in slope over Col-0 (0.0039 ± 0.0011 and 0.0013 ± 0.0003 respectively, p = 0.0103 ANCOVA, n = 3), indicating an increase in the light-driven fluxes of protons over LEF. Because LEF produces a fixed H+/e− stoichiometry, the additional protons would need to be supplied independently of PSII, i.e., by activation of CEF.
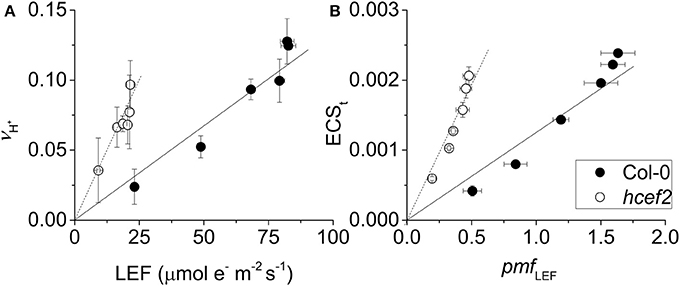
Figure 4. Induction of CEF in Col-0 and hcef2. (A) Light driven transthylakoid proton flux (vH+) as a function of LEF. Col-0 (closed circles) and hcef2 (open circles). Mean ± SD, n = 3. (B) ECSt as a function of pmf generated by LEF (pmf LEF). Col-0 (closed circles) and hcef2 (open circles). Mean ± SD, n = 3.
In the second approach (Figure 4B), we compared relative light-driven pmf, estimated by the ECSt parameter, with calculations of the pmf from LEF alone (pmf LEF; Avenson et al., 2005). This approach is based on different assumptions than the first, and is largely independent of extrinsic factors, such as the leaf content of ECS-responding carotenoids, etc. (see discussion in Avenson et al., 2004; Baker et al., 2007). The dependence of ECSt against pmf LEF was approximately three-fold higher in hcef2 compared to Col-0 (0.0037 ± 0.0005 and 0.0012 ± 0.0003, respectively, p < 0.0001 ANCOVA n = 3), indicating that hcef2 accumulates larger extents of pmf than can be attributed to changes in LEF, supporting the conclusion that CEF is strongly activated in hcef2. It should be noted that estimates of LEF by analysis of chlorophyll fluorescence depend on the fraction of light energy absorbed by PSII. The 77K fluorescence emission spectra (Figure 2B) show a decrease in the relative fluorescence of PSII at 685 nm relative to that attributable to PSI at about 735 nm, possibly indicating a decrease in PSII relative to PSI excitation, but the potential error introduced by this antenna change should lead to an underestimation of the increase in CEF/LEF for the data in Figures 4A,B.
In the third approach, we measured post-illumination changes in chlorophyll a fluorescence that indicate the non-photochemcial reduction of the PQ pool associated with activation of the NDH-pathway for CEF (Burrows et al., 1998; Sazanov et al., 1998; Shikanai et al., 1998; Gotoh et al., 2010). Typically, such fluorescence rise experiments are conducted by exposing leaves to continuous illumination for a few minutes and the fluorescence yield is followed after switching off the light. An initial decrease of fluorescence is caused by rapid oxidation (on tens to hundreds of milliseconds time scale) of QA by PQ. When NDH is active, this initial decay phase is followed by a slower fluorescence rise as PQ becomes progressively reduced by NDH. During initial trials, we found that the decay and rise phases was more clearly resolved when leaves from growth conditions were partially dark adapted (for 10 min) and exposed to short (10 ms duration) pulses of intense actinic light. As shown in Figure 5A, each pulse resulted in increased fluorescence yield reflecting light-induced reduction of QA. The fluorescence yield then deceased in multiple phases after each flash. A rapid phase, with a half time of less than a few ms, reflected the equilibration of QA and PQ redox states in the dark. In Col-0 (Figure 5A, black line), each pulse resulted in progressively more reduced PQ pool as indicated by the increases in dark fluorescence levels. This interpretation was confirmed by the decreased in fluorescence yield induced by far red (730 nm) illumination (Figure 5A, red line), which preferentially excites PSI photochemistry resulting in net oxidation of the PQ pool and QA. Cessation of far-red illumination resulted in a slow return to higher fluorescence yields indicating reduction of the PQ by a non-photochemical process, most likely through a process related to CEF. These phenomena were also observed in hcef2 (Figure 5B, black line), but were stronger and more rapid. In fact, a distinct fluorescence rise phase was seen after the third flash in hcef2 that we interpret as indicating strong activation of PQ reductase activity. The interpretation was confirmed by application of far-red illumination (Figure 5B, red line), which resulted in substantial quenching of the signal. Rise occurred after each additional flash and continued during the following dark period. We conclude that hcef2 has a substantially higher activity of PQ reductase than Col-0. In addition, in the dark, application of far-red illumination only minimally quenched basal fluorescence in both Col-0 and hcef2 (Figure 5, blue lines) indicating F0-values were not strongly affected by pre-reduction of QA. However, in hcef2, there was a rise in fluorescence after application of far-red (Figure 5B, blue line), suggesting stimulation of PQ reduction that was not seen in Col-0 (Figure 5A, blue line).
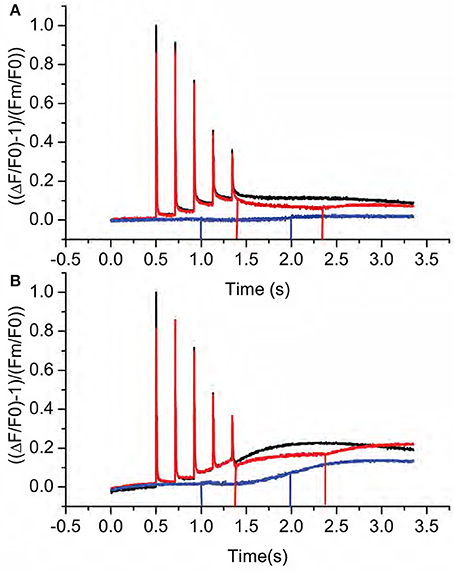
Figure 5. Kinetics of post-illumination fluorescence rises in Col-0 and hcef2. (A) Relative fluorescence yield changes in Col-0 in the dark after a series of actinic flashes (black), changes with far-red illumination after the actinic flashes (red), and changes with far-red illumination in the dark. Data is normalized using F0 and Fm-values from the first data set (black) and is representative of three independent experiments. Lines indicate the start and stop of far red illumination, respectively. (B) Relative fluorescence yield changes in Col-0 in the dark after a series of actinic flashes (black), changes with far-red illumination after the actinic flashes (red), and changes with far-red illumination in the dark. Data is normalized using F0 and Fm-values from the first data set (black) and is representative of three independent experiments. Lines indicate the start and stop of far red illumination, respectively.
Antimycin A Infiltration of hcef2
In Col-0 we observed no significant differences in the ratio of vH+/LEF between leaves infiltrated with water or 20 μM antimycin A (0.0015 ± 0.0025 and 0.00158 ± 0.00026 respectively p > 0.05 n = 3, Figure 6). The elevated ratio of vH+/LEF in hcef2 was also unaffected by 20 μM antimycin A (0.00551 ± 0.0014 and 0.00461 ± 0.00095, respectively p > 0.05 n = 3, Figure 6), indicating hcef2 CEF is antimycin A insensitive and thus does not occur through the antimycin A-sensitive CEF pathway.
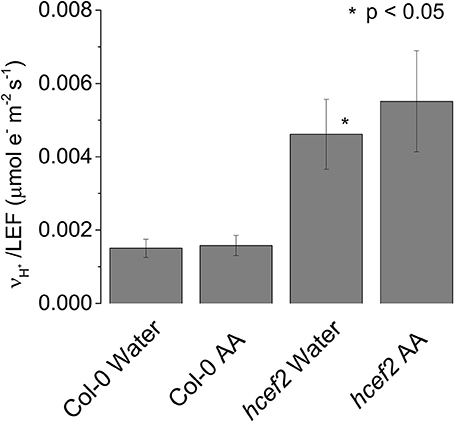
Figure 6. Antimycin a insensitivity of CEF in hcef2. Slope of vH+/LEF in leaves infiltrated with either water or antimycin A (AA). Mean ± SD, n = 3.
Mapping the Genetic Locus of hcef2 as TADA1
Map based cloning and deep sequencing was used to identify the probable genetic locus for the hcef2 mutation to a point mutation in TADA1 (At1G68720). This C > T mutation introduces a stop codon at R643 (Figure 7), eliminating the C-terminus of the protein containing the active site required for function (Delannoy et al., 2009; Karcher and Bock, 2009). The T-DNA insert line GK-119G08 contains an insertion in the first exon in At1G68720 (Delannoy et al., 2009). Similar to hcef2, tada1 showed strongly increased CEF as indicated by a five-fold increase relative to Col-0 of vH+/LEF (0.0063 ± 0.003 and 0.0011 ± 0.0004, respectively, p < 0.05 n = 3; Figure 8A) as well as in ECSt/pmf LEF (0.0057 ± 0.001 and 0.0011 ± 0.0003, respectively, p < 0.001, n = 3; Figure 8B) relationships. These results indicate increased CEF equal to or greater than hcef2 and support the identification of hcef2 mutation within TADA1. Likewise, tada1 showed no statistical difference from hcef2 in leaf chlorophyll content or absorptivity.
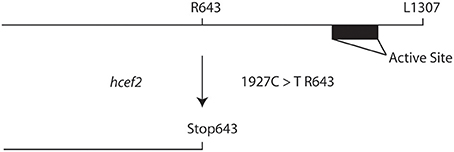
Figure 7. Introduction of a stop codon into the TADA1 locus in hcef2. Translation is terminated before the active site of TADA1, leading to a loss of function.
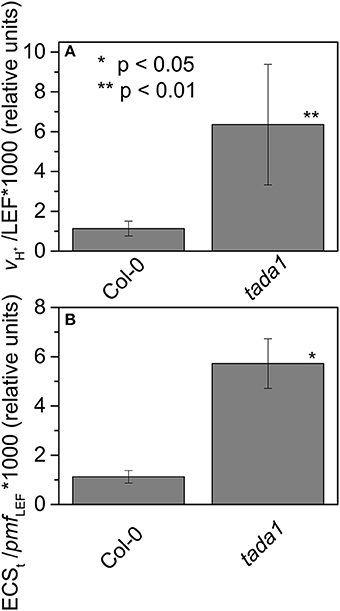
Figure 8. Elevated CEF in tada1. The ratios of vH+/LEF (A) and ECSt/pmf LEF (B) of intact leaves were measured and estimated as described in Section Methods and Figure 4. Date represent the mean ± SD with n = 3.
Delannoy et al. (2009) showed that the tada1 phenotype was reversed by expressing the C-terminus of the tada1 (At1G68720) behind a 35S promoter. We transferred this construct by crossing the complimented tada1 mutant with hcef2 followed by segregation and genotyping for homozygocity of the hcef2 mutation, lack of the tada1 insertion, and possession of the P35S:ΔNTADA1 construct. Verified lines were analyzed spectroscopically for suppression of the hcef2 phenotype. The increased vH+ as a function of LEF seen in hcef2 (Figure 4A) was completely suppressed in the hcef2 P35S:ΔNTADA1 line (Figure 9), i.e., the slope returns to Col-0-values (0.0013 ±.00029 and 0.0013 ± 0.00031, respectively, p > 0.05, ANCOVA n = 3). These results confirm TADA1 as the site of the mutation causing elevated CEF in hcef2.
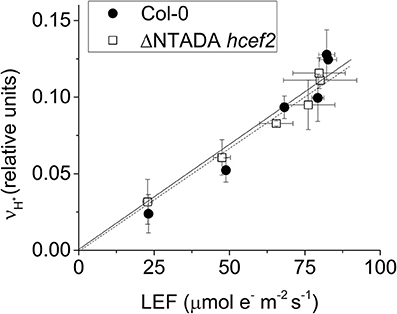
Figure 9. TADA1 complementation of hcef2. vH+/LEF of intact leaves of Col-0 (filled circles) and hcef2 P35S:ΔN TADA1 (open squares). Mean ± SD, n = 3.
Translational Defects Lead to Increases in CEF
The TADA1 gene codes for a tRNA editing enzyme, suggesting that a defect in translation machinery somehow leads to increased CEF. To test if this effect is a general consequence of decreased chloroplast translation efficiency, we assayed for increased CEF in mutants defective in nuclear encoded peripheral ribosomal proteins. The prsp3-1 mutant contains a T-DNA insert in the At1g68590 locus with a complete loss of PRSP3 (Tiller et al., 2012). The rps17 mutant contains a T-DNA insert in the At1g79850 locus, resulting in decreased expression of RPS17 by 85% (Tiller et al., 2012). Both of these mutations resulted in partial loss of ribosomal proteins and impaired chloroplast translation (Tiller et al., 2012). The extents of CEF as measured by vH+/LEF were increased by about two-fold compared to Col-0 in both prsp3-1 (0.0033 ± 0.0005 and 0.0017 ± 0.0001, respectively, p < 0.001, n = 3; Figure 10), and rps17 (0.0017 ± 0.0001 and 0.0055 ± 0.0004, respectively, p < 0.001, n = 3). These results suggest that elevated CEF may be a general response to disruption of chloroplast translation.
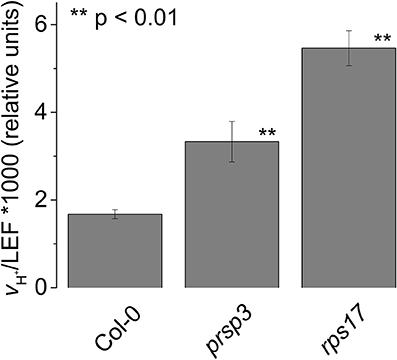
Figure 10. Elevated CEF in the ribosomal mutants prsp3 and rps17. vH+/LEF of intact leaves. Mean ± SD, n = 3.
Flash Induced Relaxation Kinetics in Dark-Adapted Leaves of hcef2
The decay of the flash induced ECS signal has been used to monitor the generation of electric field (Δψ) across the thylakoid and its dissipation by the movements of protons through the ATP synthase or counterions through ion channels (Kramer and Crofts, 1989). In dark-adapted leaves, or leaves infiltrated with methyl viologen (Figure 11), the ATP synthase becomes inactivated by oxidation of regulatory thiols, slowing the decay of the ECS signal. The residual decay, measured at low flash intensity to prevent re-activation of ATP synthase, reflects leakage of protons and counterions across the thylakoid membrane. In Col-0, this residual decay was slow, with a lifetime of about 0.8 s, similar to previous results (Kramer and Crofts, 1989). A substantially increased ECS decay rate was about two-fold faster in hcef2 (lifetime = ~0.4 s, Figure 11), indicating an increased rate of proton or ion leakage from the lumen.
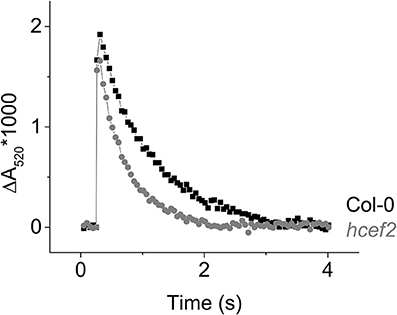
Figure 11. Flash induced relaxation kinetics of the electrochromic shift in Col-0 (black) and hcef2 (gray) leaves infiltrated with 100 μM methyl viologen. Data is representative of three independent experiments.
Spectral Analyses of Thylakoid Cytochrome Composition in Col-0 and hcef2
To assess effects of hcef2 on thylakoid cytochrome composition, we performed a rough redox titration analysis while monitoring the absorbance spectrum between 535 and 575 nm, using difference spectra (Figure 12A) of the 0.5 mM ascorbate reduced minus 0.5 mM potassium ferricyanide oxidized samples and the difference spectra of dithionite reduced minus 8 mM ascorbate reduced samples were used as indicators of the relative contents of cytochromes f and b. In wild type chloroplasts, the reduced-minus oxidized difference spectrum around 554 nm reflects cytochrome f, whereas lower potential absorbance spectra in the 560–565 nm region contains overlapping contributions from at least three heme b species, including the PSII cytochrome b559 (at around 560 nm) and cyt bH and bL (near 563 nm) of the bf complex. In Col-0 thylakoids the dithionite-ascorbate absorbance difference spectrum in the heme b region was approximately double that in the ascorbate-ferricyanide cytochrome f region consistent with what is expected for the native complex (i.e., containing two cytochrome b hemes for each cytochrome f). It should be noted that the cytochrome b spectrum was broader (full width at half height of 12 nm) than expected if only cytochrome bH and bL contributed, likely indicating at least some contributions to the spectrum from cytochrome b559, though this should not have dramatically affected the estimated ratio of cytochrome b to cytochrome f (see discussion in Kramer and Crofts, 1994). The ratios of cytochrome b and f spectra were strongly affected by the hcef2 mutation, with a larger cytochrome f signal relative to cytochrome b signal, suggesting that the ratio of heme f to heme b was increased in the mutant by a factor of at least two, and was accompanied by an apparent shift of 1 nm to the blue in the α-band of the cytochrome f redox difference spectrum of hcef2 compared to Col-0, possibly indicating a modification of the protein environment around heme f in the mutant. In addition, the shape of the cytochrome b region became more asymmetric, and shifted to the red suggesting changes in the ratios of contributions from cytochrome b559 and cytochrome bH.
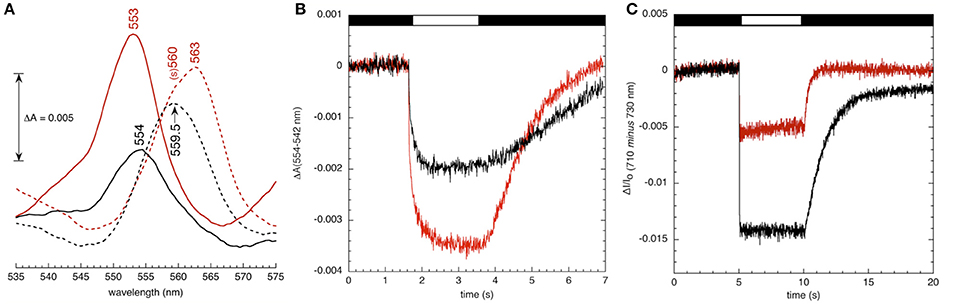
Figure 12. (A) Redox difference visible absorption spectra of the cytochrome bf complex in broken chloroplast preparations from Col-0 (black) and hcef2 (red). Broken chloroplasts from Col-0 and hcef2 were prepared as described and resuspended to a chlorophyll concentration of 150 μg/ml in an assay buffer consisting of 10 mM HEPES (pH 7.6), 5 mM MgCl2 and 0.2% (w/v) dodecyl maltoside. Difference spectra for cytochrome f (solid line, 0.5 mM ascorbate reduced minus 0.5 mM potassium ferricyanide oxidized) and cytochrome b (broken line, dithionite reduced minus 8 mM ascorbate reduced) are shown. Difference spectra were obtained at room temperature and averaged from four scans per redox condition per sample with a spectral resolution of 1 nm. A five point smoothing function was applied to the data, and spectra were adjusted for dilution effects. Peak positions are labeled. “(s)” refers to shoulder. Spectra of PSII-associated cytochrome b-559 (obtained from [(8mM ascorbate – 0.5 mM ferricyanide) minus (0.5 mM ascorbate – 0.5 mM ferricyanide)] are not shown. (B) Oxidation-reduction kinetics of cytochrome f in Col-0 (black) and hcef2 (red) thylakoids. Kinetics were measured in broken chloroplast preparations at a chlorophyll concentration of 50 μg/mL−1. The assay buffer consisted of 10 mM HEPES (pH 7.6), 5 mM MgCl2, 20 mM KCl, 10 μM DCMU, 1 mM methyl viologen, 10 μM valinomycin, 10 μM nigericin, and 2 mM ascorbate. Red actinic light (620 nm) was applied at an intensity of 200 μE m−2 s−1 (indicated by white bar in figure). Measuring pulses were provided by narrow-band filtered LEDs at 554- and 545-nm. The (dark) interval between measuring traces was 30 s, and eight traces were averaged per experiment. (C) P700 content in isolated thylakoids (A) 710 nm minus 730 nm absorbance changes in Col-0 (black) and hcef2 (red) thylakoid preparations The chlorophyll concentration was 50 μg Chl · ml−1, and the assay buffer consisted of 10 mM HEPES (pH 7.6), 5 mM MgCl2, 2 mM ascorbate, 1 mM methyl viologen, and 10 μM DCMU. Hydroxylamine (added immediately prior to data collection) was present at 1 mM to remove any PSII-associated variable fluorescence. Red actinic light (620 nm) was applied at an intensity of 200 μmoles photons m−2 s−1 (indicated by white bar in figure). The (dark) interval between measuring traces was 60 s, and four traces were averaged per experiment.
As shown in Figure 12B, illumination of uncoupled thylakoids in the presence of 10 μM DCMU, 2 mM ascorbate, and 1 mM methyl viologen resulted in absorbance changes at 554–545 nm, attributable to oxidation of cytochrome f. Interestingly, the extent of cytochrome f oxidation signal was almost two-fold larger in hcef2 than Col-0, suggesting that the increased content of cytochrome f was photooxidizable through redox interactions with PC.
PSI Content and P700 Redox Status
Figure 12C shows light-induced P700 redox changes measured by absorbance changes at 710–730 nm in thylakoid preparations of hcef2 and Col-0 treated with DCMU and hydroxylamine to inhibit PSII electron transfer and variable fluorescence, as well as methyl viologen as a final electron acceptor, allowing us to photoaccumulate essentially all P700 in its oxidized state. The extents of the photo-induced bleaching (which reflect the disappearance of the reduced P700 state) indicate that hcef2 had <50% the level of active PSI complexes.
Figure 13A shows saturating pulse induced absorbance changes at 810 nm in intact leaves, which indicates the appearance of the P700+ state, during a series of light-pulses to indicate the redox status of PSI in the steady-state (after 10 min of illumination; based on the procedure presented in Klughammer and Schreiber, 1994). First, data was taken at the start of the curves to probe the redox state of P700 during steady-state actinic illumination. A strong saturating pulse was then applied to determine the number of photo-oxidizable PSI centers, i.e., those with reduced P700 and oxidized FA/FB electron acceptors. Compared to Col-0, hcef2 showed about 50% fewer such centers. After the saturating pulse, the actinic light was switched off to allow all P700+ to go reduced. The difference in the signal from the baseline to the dark indicates the total number of PSI centers oxidized during steady-state illumination, which was substantially lower in hcef2 than Col-0. Following the dark interval, the leaves were exposed to far-red illumination to oxidize electron carriers between PSI and PSII, followed by a second, saturation pulse to essentially fully oxidize P700. The extents of oxidation during the second pulse were consistent with the results in Figure 13A, showing an ~50% decrease in active PSI centers in hcef2 compared to Col-0. The ratio of peak signals during first and second saturation pulses is used as an indicator of the degree of reduction of the PSI electron acceptor pool during steady state illumination. Along with being significantly more reduced, the oxidizable fraction is also decreased in hcef2 (Figure 13B), this is likely due to the closure of the acceptor side of PSI.
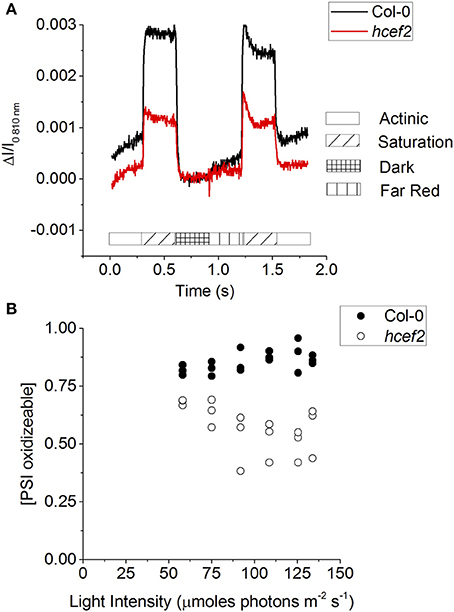
Figure 13. P700 redox status. (A) From the steady state (135 μmoles photons m−2 s−1) A saturation flash was applied to oxidize PSI, followed by a dark interval to allow PSI to be reduced. Far red illumination was applied to preferentially excite PSI and open up the acceptor side, followed by another saturation flash to fully oxidize PSI. (B) The fraction of oxidizable PSI in Col-0 (closed circles) and hcef2 (open circles) calculated from (A) as described in Klughammer and Schreiber (1994).
Thylakoid Protein Levels in hcef2
Figure 14 shows protein levels of thylakoids isolated from Col-0 and hcef2 and separated by SDS-PAGE on a chlorophyll basis. Multiple antibodies were used against subunits of the thylakoid complexes to look for changes in subunit stoichiometries.
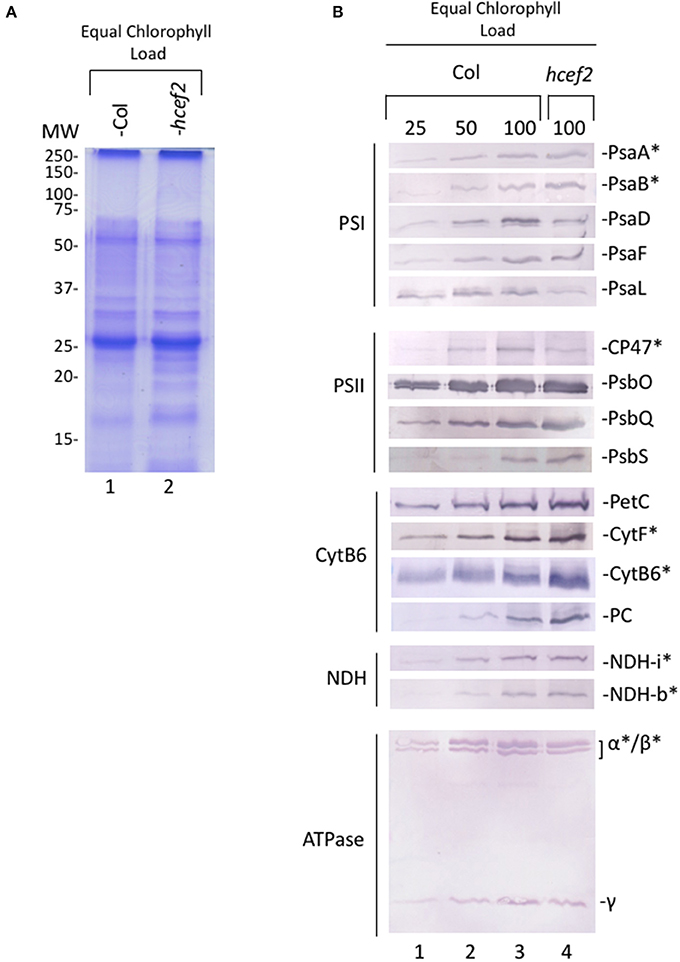
Figure 14. Photosynthetic protein accumulation in Col-0 and hcef2 thylakoid membranes. (A) Coomassie stain of thylakoid proteins separated by SDS-PAGE and (B) western blot of thylakoid electron and proton transport chain components. Chloroplast encoded proteins are denoted by (*).
PSII subunits PSBO and PSBQ accumulated in hcef2 at Col-0 levels, while CP47 was about half that of Col-0. PSBS was seemingly increased in hcef2 over Col-0, possibly explaining the increased qE sensitivity to ECSt in hcef2 (Li et al., 2002), but not ruling out the possibility of altered ΔpH/pmf (discussed in Cruz et al., 2005). The bf complex was overall increased in hcef2, in agreement with increase in chromophores seen in the redox cut (Figure 12A). NDH subunits levels did not increase, contrary to previously described hcef mutants (Livingston et al., 2010a; Strand et al., 2015), however this is not without precedence (Gotoh et al., 2010). The levels of ATP-γ and ATP-α/β subunits of the ATP synthase also accumulated to Col-0 levels in hcef2, suggesting that the ion leak in seen in hcef2 (Figure 11) is a phenomenon not related to stoichiometry changes of subunits within the ATP synthase.
The core subunits of PSI (PSAA and PSAB), as well as PSAF, were similar to wildtype levels. However, PSAD accumulated to only 50% of Col-0 levels, while PSAL accumulation appeared to be even lower. Thus, the loss of functional PSI centers, seen in Figures 13A,B), probably reflects the loss of the smaller subunits of the complex, implying that a substantial fraction of PSI proteins are not assembled into active complexes.
The hcef2 and Related Mutants Show Elevated Rates of H2O2 Production
Figure 15 shows relative leaf H2O2 content in Col-0, hcef2, tada1, hcef2 P35S:ΔNTADA1, prsp3, and hcef1. Both hcef2 and tada1 had significantly higher H2O2 accumulation than Col-0 (2.67 ± 0.57, 1.67 ± 0.29, and 1.00 ± 0.06, respectively, p < 0.01 and p < 0.02, respectively, n = 3) while the complimented line, hcef2 P35S:ΔNTADA1, had H2O2 levels similar to Col-0 (1.13 ± 0.16 p = 0.25, n = 3). The plastid ribosomal mutant prsp3 also had a significantly higher level of H2O2 (1.41 ± 0.13, p < 0.01, n = 3). In addition, the hcef1 mutant also was shown to accumulate increased levels of H2O2 than Col-0 (1.87 ± 0.30 p < 0.01, n = 3).
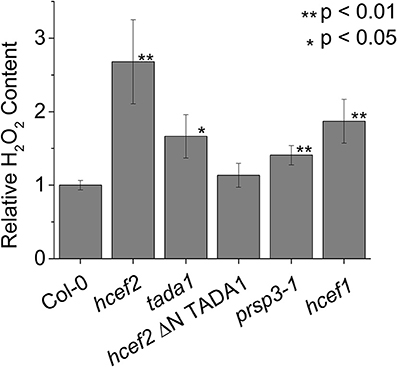
Figure 15. Relative accumulation of H2O2 in Col-0 and mutant lines. Leaf H2O2 content was determined using resorufin fluorescence resulting from the reaction of Amplex red with H2O2. Fluorescence was expressed on a chlorophyll basis and normalized to the mean Col-0 fluorescence level. Bars represent mean ± SD, n = 3.
Discussion
Disruption of Protein Translation in hcef2 Leads to Activation of CEF Involving the Chloroplast NDH Complex
The hcef2 mutant was identified by progressively screening mutants using a series of criteria designed to identify mutants with elevated CEF. Several independent lines of evidence support strong activation of CEF in hcef2, including comparison of proton and electron fluxes (Figure 4A), pmf related parameters (Figure 4B), post-illumination fluorescence yield changes (Figure 5), and reduction of P700+ in the presence of DCMU. The elevated CEF in hcef2 was found to be insensitive to antimycin A (Figure 6), arguing against the participation of the FQR pathway (Cleland and Bendall, 1992; Munekage et al., 2004), and in favor of the NDH complex, as previously shown for hcef1 (Livingston et al., 2010a).
Surprisingly, we mapped hcef2 to a non-sense mutation in the Tada1 locus, leading to a deletion of the C-terminal active site of TADA1, an enzyme that modifies the chloroplast arginine tRNAACG to tRNAICG. Loss of TADA1 leads to the use of the less efficient “two out of three” codon recognition mechanism (Delannoy et al., 2009).
While the effect of the hcef2 (tada1) mutation should affect the translation of ~80% of the chloroplast-encoded genes (Sato et al., 1999; i.e., any of the chloroplast genes with a CGC or CGA codon), and is therefore almost certainly pleiotropic, its strong effect on regulation of CEF is of interest, and illustrates some key bioenergetics points.
Modifying Chloroplast Translation Leads to Accumulation of H2O2, a Likely Activator of CEF
It was previously shown that simply suppressing overall photosynthesis does not, by itself, trigger high rates of CEF (Cruz et al., 2005; Livingston et al., 2010b), implying that the effect of hcef2 on CEF is not caused by a general effect on photosynthetic capacity, but more likely affecting a CEF regulatory process. We do not see major changes in NDH protein levels (Figure 14) suggesting that the hcef affects activation of NDH at the enzyme level.
Intriguingly, it has recently been shown that there is a strong relationship between activation of NDH-CEF and the production of H2O2 in the chloroplast (Casano et al., 2001; Lascano et al., 2003; Livingston et al., 2010b; Takahashi et al., 2013; Strand et al., 2015). Several mutants of the CBB cycle have found to have high CEF (Gotoh et al., 2010; Livingston et al., 2010a,b), one of which was shown to accumulate H2O2 (Strand et al., 2015), which, within the chloroplast leads to a rapid increase of CEF in vivo and accumulation of the complex over longer time periods (Casano et al., 2001; Lascano et al., 2003; Strand et al., 2015). Our observation of a strongly increased H2O2 production in hcef2 (Figure 15) supports this model for CEF activation, in agreement with the results from hcef1 and other high CEF mutants (Livingston et al., 2010b; Strand et al., 2015).
How H2O2 production leads to the activation of CEF remains an open question, but our results allow us to define some possible mechanisms that have substantial impact on the connections between the status of the cell and the regulation of photosynthesis. It is possible that H2O2 acts as a direct signaling agent, e.g., by activating a signal cascade ending in phosphorylation of the NDH complex (Lascano et al., 2003). In this case, H2O2 could be a good indicator of imbalances in the production and consumption of ATP/NADPH (Strand et al., 2015). For instance, a relative deficit of ATP would slow the CBB cycle, leading to accumulation of reduced NADPH and Fd that can reduce O2 to superoxide and H2O2. Activating CEF would correct this imbalance by supplying additional ATP and slowing overall photosynthetic electron transfer by acidifying the thylakoid lumen.
Alternatively, H2O2 could impact the energy budget of photosynthesis in by leading to the depletion of ATP (discussed below), which in turn could activate CEF. For example, it was proposed that elevated CEF in glyceraldehyde phosphate dehydrogenase-deficient mutations of tobacco is caused by activation of a futile cycle that depletes the chloroplast of ATP (Livingston et al., 2010b). Similarly, it has recently been proposed that loss of chloroplast FBPase activity induces a glucose-6-phosphate shunt, allowing photosynthesis to continue despite the lesion in FBPase (Sharkey and Weise, 2015). This bypass would impose a higher ATP demand, and that this increase in ATP demand could be leading to the upregulation of CEF. It is thus also possible that H2O2 production in hcef2 could lead to ATP deficits through induction or similar futile cycling related to disruption of the normal redox-regulation of enzymes.
There are several (non-exclusive) possible mechanisms for the accumulation of high levels of H2O2 in hcef2. Because the codons affected in hcef2 (and tada1) are present in >80% of the protein coding genes within the chloroplast genome (Sato et al., 1999), the overall effect on plastid translation is expected to similar to that of prsp3, and rps17, but through a different mechanism. In other words, hcef2, tada1, prsp3, and hcef1 all showed both increased levels of H2O2 (Figure 15) and elevated CEF (Figures 4, 8, 10). This suggests a model in which defects in chloroplast translation lead to discoordination of protein homeostasis, and indirectly to elevated H2O2, and thus the activation of CEF. Evidence for such discoordination in hcef2 can be seen in the altered ratios of photosynthetic complexes, cytochrome bf and PSI (Figures 12A,C) and in the preferential loss of PSI subunits PSAL and PSAF (Figure 14).
It is possible that this dis-coordination could increase the rates of H2O2 production or decrease the effectiveness of the chloroplast H2O2 detoxification system. The majority of H2O2 production in chloroplasts is proposed to arise from the accumulation of PSI reduced oxygen radicals, through the Mehler reaction, of which H2O2 is an intermediate step in the detoxification (or water-water cycle; Mubarakshina et al., 2010). In this scenario, the increased H2O2 production in hcef2 could be explained by partial protonic uncoupling of the thylakoid membrane as suggested by the ECS decay kinetics (Figure 11), which would decrease the production of ATP relative to NADPH, leading to both ATP deficits and accumulation of electrons on acceptor side of PSI which in turn can lead to reduction of O2. In addition to the effects of uncoupling, the loss of PSI peripheral subunits in hcef2 (Figure 14) may lead a change in the donor/acceptor environment on the stromal side of PSI, altering the rates of electron transfer to soluble carriers, and potentially leading to the increased reduction of the molecular oxygen. This defect is hinted at in a PSAE deficient mutant, when marker gene expression is used as a ROS indicator (Ihnatowicz et al., 2007).
Finally, it is worth noting that we obtained high CEF mutants that have defects in very diverse processes. On one hand, this outcome is frustrating because it makes it less likely that genetic approaches, screening for high CEF mutants, will directly indicate the precise mechanism of CEF activation. On the other hand, it indicates just how integrated the NDH-CEF response is in balancing the overall metabolic system of the organism. In other words, it is able to respond to a wide range of system-wide perturbations related to energy imbalances, and most likely transmitted to the NDH complex through a common energy currency (e.g., ATP) or general signal (e.g., H2O2).
Methods
Plant Materials and Growth
All plants were grown photoautotrophically on soil in a controlled growth chamber with a 16:8 h light/dark photoperiod (~100 μmols photons m−2 s−1, white light) at 22°C. Seed for tada1 (GK-119G08) and the tada1 line complimented with P35S:ΔNTADA1 was graciously provided by Dr. Jośe Gualberto. Seed for prsp3 (Salk_010806) and rps17 (Salk_066943) were provided by the ABRC. The tada1 insertion was verified with as described in Delannoy et al. (2009). The hcef2 mutation in the tada1 locus was verified by sequencing. The presence of the P35S: ΔNTADA1 construct was verified using primers for the 35S promoter (5′-CCACTGACGTAAGGGATGACG-3′) and the C-terminus end of TADA1 (5′-TGCTTTAGAACCCTCTCGAAT-3′). Verification of homozygous prsp3 and rps17 was performed using primers generated from the SIGnAL T-DNA primer design tool (http://signal.salk.edu/tdnaprimers.2.html).
Isolation of hcef Mutants
The hcef2 mutant was initially identified and isolated as a high NPQ mutant as described in Livingston et al. (2010a). Identification of backcrossed lines and F2 mapping populations with high NPQ was performed as described in Livingston et al. (2010a).
77 K Fluorescence Spectroscopy
Fresh light adapted leaf material was flash frozen in liquid nitrogen, ground to a fine powder and diluted to <5 μg chlorophyll ml−1 in ice as described in Weis (1985). Emission spectra were detected using a spectrofluorometer (Ocean Optics, HR200+ES) by a blue (440 nm) diode laser, controlled by SpectraSuite software (Ocean Optics). The spectra were normalized to the 735 nm peak.
In vivo and In vitro Spectroscopy
All in vivo spectroscopic measurements were performed on fully expanded leaves in mature plants just prior to bolting (Figure 1). Comparisons were made between mature leaves, despite age, due to the inhibited growth in the mutant lines. Steady-state chlorophyll a fluorescence yield and light induced absorption changes were made as extensively described elsewhere (Genty et al., 1989; Kanazawa and Kramer, 2002; Avenson et al., 2005; Baker et al., 2007; Baker, 2008; Livingston et al., 2010a,b) on a spectrophotometer/fluorimeter described in Hall et al. (2013). Prior to the experimental protocol, plants were dark adapted for 10 min. Steady state was reached, and measurements were made after 10 min of actinic illumination. To account for changes in pigmentation of the mutants, LEF was calculated using the approach of Dai et al. (1996) and Livingston et al. (2010a) using the following equation:
where i is the actinic light intensity and A is the absorptivity of the leaf quantified as in Livingston et al. (2010a). Leaf absorptivity used for each genotype was the average of three leaves, and calculated for each new batch of plants grown. Absorptivity values in hcef2 and tada1 (0.64 and 0.65, respectively) were lower than Col-0 (0.83, p < 0.01, n = 3), but not significantly different from each other (p = 0.99, n = 3), while there was no significant difference between Col-0 and the complimented line (0.83, 0.85, respectively, p = 0.65, n = 3).
Electrochromic shift measurements were corrected for changes in leaf properties by normalizing to leaf chlorophyll content. This correction gives similar results as corrections described in Avenson et al. (2005) and Livingston et al. (2010a,b).
For chlorophyll a fluorescence yield in response to short actinic pulses, plants were dark adapted for 10 min prior to the experiment. For each trace the excitation light was pulsed at a frequency of 500 Hz, contributing minimally to the kinetics of chlorophyll a fluorescence induction in the absence of actinic illumination. Five actinic flashes (10 ms at ~12,000 μmol photons m−2 s−1) were given 0.2 s apart. A second experiment was performed in which an interval of far-red illumination was inserted after the last actinic flash. Finally, the experiment was repeated in the dark with an interval of far-red illumination. Data was normalized to F0 and Fm of the initial experiment, and the baseline was set to 0.
For in vitro spectroscopy, broken chloroplasts were prepared as described in Fisher and Kramer (2014) at the same developmental stage as described above. Cytochrome α band redox difference spectra of chloroplast preparations were obtained using a Perkin-Elmer-Lambda 650 UV/vis spectrophotometer.
Map-Based Cloning of hcef2
The hcef2 mutant was mapped on chromosome 1 between At1G68560 (25,733,701 bp) and At1G69020 (25,947,401), a 213.7 kb region, using molecular markers based on Simple sequence length polymorphisms (SSLPs) and cleaved amplified polymorphic sequences (CAPS; Konieczny and Ausubel, 1993). Polymorphism sequence information between Col-0 and Landsberg erecta, from the ABRC TAIR website (http://www.arabidopsis.org/browse/Cereon/index.jsp), was used to design SSLPs and/or CAPS marker for mapping. F2 plants were derived from breeding homozygous hcef2 (Col-0 background) and wildtype (Landsberg erecta background). The hcef2 mutation was found to be recessive, and genomic DNA was isolated from homozygous F2 plants (hcef2 hcef2) with high NPQ by chlorophyll a fluorescence imaging (described above). To determine the hcef2 mutation, we performed whole genome sequencing on homozygous hcef2 plants. Genomic DNA from the mutant line was used to create a sequencing library using the Illumina TruSeq DNA Library Kit following manufacturers recommendations. The library was then sequenced on an Illumina GAIIx using single end with 50 base reads. All next generation sequencing was conducted by the Genomics Core of the Research Technology Support Facility at Michigan State University. Illumina reads were assembled using SeqMan NGen software (DNASTAR). SNPs were compared across multiple samples of the same Col-0 background and SNPs unique to hcef2 were confirmed by Sanger sequencing.
CAPS Marker for hcef2 Genotype
To genotype hcef2 without sequencing a CAPS marker was designed for the hcef2 mutation. A PCR fragment spanning the mutation site was amplified (5′-GAGGCTGATTGGTCAAGGA-3′, forward; 5′-GGATGTTCAAAGGCTGTGGT-3′, reverse) and then digested with NruI (R0192, New ENGLAND BioLabs). The Col-0 sequence was cut with NruI, and homozygocity/heterozygocity was determined by comparing banding patterns on a 2% agarose gel.
Infiltrations
Freshly detached leaves were infiltrated with 20 μM antimycin A in distilled water in the dark by soaking between two saturated lab tissues for 3 h. Successful infiltration of antimycin A was confirmed by secondary effects of this chemical on NPQ responses probed by chlorophyll fluorescence (Oxborough and Horton, 1987). Leaves were infiltrated with 100 μM methyl viologen in a similar manner for 1 h prior to measurement.
H2O2 Quantification
To quantify relative H2O2 accumulation, leaves were flash frozen in the light and H2O2 was extracted in 50 mM potassium phosphate (pH 7.4). Total H2O2 of the extract was quantified using Amplex Red fluorescence (Invitrogen) against a standard curve, and normalized to chlorophyll content of the sample, then normalized to average Col-0 H2O2 content.
Determination of Protein Changes in hcef2
Thylakoids were prepared from leaves of hcef2 and Col-0 as described in Strand et al. (2016). For one dimensional SDS-PAGE, thylakoids were solubilized in Laemmli buffer and loaded on a total chlorophyll basis for simplicity as there were no large differences seen in protein load from the coomassie stain (Figure 14A). For western blots, proteins were transferred to a PVDF membrane and probed with antibodies raised against the whole ATP synthase (Agrisera), cytochrome b6 (Agrisera), and/or cytochrome f (Agrisera). All blots were performed with n = 3, with the exception of the ATP synthase blot, which was performed n = 4.
Author Contributions
DDS designed the research, performed research, analyzed data, and wrote the paper. AKL and NF designed the research, performed research, analyzed data, and wrote portions of the paper. MS-C, DM, KKH, and JEF designed the research, performed research, and analyzed data. ML and TK analyzed data. HME performed research. JAC designed the research, performed research, contributed new analytic tools, and analyzed data. AD and KK designed the research. DMK designed the research, interpreted the data, and wrote the paper.
Funding
Experiments performed at MSU and WSU were funded by Grant DE-FG02-11ER16220 from the Division of Chemical Sciences, Geosciences, and Biosciences, Office of Basic Energy Sciences of the US Department of Energy (to DK), with support for the development and use of phenotyping tools from U.S. Department of Energy (DOE), Office of Science, Basic Energy Sciences (BES DE-FG02-91ER20021) and the MSU Center for Advanced Algal and Plant Phenotyping (CAAPP). A portion of this work was performed in the Environmental Molecular Science Laboratory, a U.S. Department of Energy national scientific user facility at Pacific Northwest National Laboratory (PNNL) in Richland, WA.
Conflict of Interest Statement
The authors declare that the research was conducted in the absence of any commercial or financial relationships that could be construed as a potential conflict of interest.
The handling Editor declared a past co-authorship with one of the authors HE and states that the process nevertheless met the standards of a fair and objective review.
Acknowledgments
The authors would like to thank Drs. Ralph Bock and Jeff Landgraf for helpful discussions. We would also like to thank our outstanding technicians, Amelia Barhanovich, Brendan Johnson, and Ben Wolf for their maintenance of plants and general assistance within the lab. This work is dedicated to the memory of Dr. Fabrice Rappaport.
References
Alric, J. (2014). Redox and ATP control of photosynthetic cyclic electron flow in Chlamydomonas reinhardtii: (II) involvement of the PGR5-PGRL1 pathway under anaerobic conditions. Biochim. Biophys. Acta 1837, 825–834. doi: 10.1016/j.bbabio.2014.01.024
Avenson, T. J., Cruz, J. A., Kanazawa, A., and Kramer, D. M. (2005). Regulating the proton budget of higher plant photosynthesis. Proc. Natl. Acad. Sci. U.S.A. 102, 9709–9713. doi: 10.1073/pnas.0503952102
Avenson, T. J., Cruz, J. A., and Kramer, D. M. (2004). Modulation of energy-dependent quenching of excitons in antennae of higher plants. Proc. Natl. Acad. Sci. U.S.A. 101, 5530–5535. doi: 10.1073/pnas.0401269101
Baker, N. R. (2008). Chlorophyll fluorescence: a probe of photosynthesis in vivo. Annu. Rev. Plant Biol. 59, 89–113. doi: 10.1146/annurev.arplant.59.032607.092759
Baker, N. R., Harbinson, J., and Kramer, D. M. (2007). Determining the limitations and regulation of photosynthetic energy transduction in leaves. Plant Cell Environ. 30, 1107–1125. doi: 10.1111/j.1365-3040.2007.01680.x
Bendall, D. S., and Manasse, R. S. (1995). Cyclic photophosphorylation and electron transport. Biochim. Biophys. Acta 1229, 23–38. doi: 10.1016/0005-2728(94)00195-B
Breyton, C., Nandha, B., Johnson, G. N., Joliot, P., and Finazzi, G. (2006). Redox modulation of cyclic electron flow around photosystem I in C3 plants. Biochemistry 45, 13465–13475. doi: 10.1021/bi061439s
Burrows, P. A., Sazanov, L. A., Svab, Z., Maliga, P., and Nixon, P. J. (1998). Identification of a functional respiratory complex in chloroplasts through analysis of tobacco mutants containing disrupted plastid ndh genes. EMBO J. 17, 868–876. doi: 10.1093/emboj/17.4.868
Cape, J. L., Bowman, M. K., and Kramer, D. M. (2006). Understanding the cytochrome bc complexes by what they don't do. The Q-cycle at 30. Trends Plant Sci. 11, 46–55. doi: 10.1016/j.tplants.2005.11.007
Casano, L. M., Martín, M., and Sabater, B. (2001). Hydrogen peroxide mediates the induction of chloroplastic Ndh complex under photooxidative stress in barley. Plant Physiol. 125, 1450–1458. doi: 10.1104/pp.125.3.1450
Cleland, R. E., and Bendall, D. S. (1992). Photosystem I cyclic electron transport: measurement of ferredoxin-plastoquinone reductase activity. Photosyn. Res. 34, 409–418. doi: 10.1007/BF00029815
Cramer, W. A., Hasan, S. S., and Yamashita, E. (2011). The Q cycle of cytochrome bc complexes: a structure perspective. Biochim. Biophys. Acta 1807, 788–802. doi: 10.1016/j.bbabio.2011.02.006
Cruz, J. A., Avenson, T. J., Kanazawa, A., Takizawa, K., Edwards, G. E., and Kramer, D. M. (2005). Plasticity in light reactions of photosynthesis for energy production and photoprotection. J. Exp. Bot. 56, 395–406. doi: 10.1093/jxb/eri022
Dai, Z., Ku, M. B., and Edwards, G. (1996). Oxygen sensitivity of photosynthesis and photorespiration in different photosynthetic types in the genus Flaveria. Planta 198, 563–571. doi: 10.1007/BF00262643
DalCorso, G., Pesaresi, P., Masiero, S., Aseeva, E., Schünemann, D., Finazzi, G., et al. (2008). A complex containing PGRL1 and PGR5 is involved in the switch between linear and cyclic electron flow in Arabidopsis. Cell 132, 273–285. doi: 10.1016/j.cell.2007.12.028
Delannoy, E., Le Ret, M., Faivre-Nitschke, E., Estavillo, G. M., Bergdoll, M., Taylor, N. L., et al. (2009). Arabidopsis tRNA adenosine deaminase arginine edits the wobble nucleotide of chloroplast tRNAArg(ACG) and is essential for efficient chloroplast translation. Plant Cell 21, 2058–2071. doi: 10.1105/tpc.109.066654
Eberhard, S., Finazzi, G., and Wollman, F.-A. (2008). The dynamics of photosynthesis. Annu. Rev. Genet. 42, 463–515. doi: 10.1146/annurev.genet.42.110807.091452
Fan, D.-Y., Nie, Q., Hope, A. B., Hillier, W., Pogson, B. J., and Chow, W. S. (2007). Quantification of cyclic electron flow around Photosystem I in spinach leaves during photosynthetic induction. Photosyn. Res. 94, 347–357. doi: 10.1007/s11120-006-9127-z
Finazzi, G., Rappaport, F., Furia, A., Fleischmann, M., Rochaix, J.-D., Zito, F., et al. (2002). Involvement of state transitions in the switch between linear and cyclic electron flow in Chlamydomonas reinhardtii. EMBO Rep. 3, 280–285. doi: 10.1093/embo-reports/kvf047
Fisher, N., and Kramer, D. M. (2014). Non-photochemical reduction of thylakoid photosynthetic redox carriers in vitro: relevance to cyclic electron flow around photosystem I? Biochim. Biophys. Acta 1837, 1944–1954. doi: 10.1016/j.bbabio.2014.09.005
Genty, B., Briantais, J.-M., and Baker, N. R. (1989). The relationship between the quantum yield of photosynthetic electron transport and quenching of chlorophyll fluorescence. Biochim. Biophys. Acta 990, 87–92. doi: 10.1016/S0304-4165(89)80016-9
Gotoh, E., Matsumoto, M., Ogawa, K., Kobayashi, Y., and Tsuyama, M. (2010). A qualitative analysis of the regulation of cyclic electron flow around photosystem I from the post-illumination chlorophyll fluorescence transient in Arabidopsis: a new platform for the in vivo investigation of the chloroplast redox state. Photosyn. Res. 103, 111–123. doi: 10.1007/s11120-009-9525-0
Hall, C. C., Cruz, J., Wood, M., Zegarac, R., DeMars, D., Carpenter, J., et al. (2013). “Photosynthetic measurements with the Idea Spec: an integrated diode emitter array spectrophotometer/fluorometer,” in Photosynthesis Research for Food, Fuel and Future, eds T. Kuang, C. Lu, and L. Zhang (Hangzhou; Heidelberg: Zhejiang University Press; Springer), 184–188
Havaux, M., Rumeau, D., and Ducruet, J.-M. (2005). Probing the FQR and NDH activities involved in cyclic electron transport around Photosystem I by the “afterglow” luminescence. Biochim. Biophys. Acta 1709, 203–213. doi: 10.1016/j.bbabio.2005.07.010
Hope, A. B., Valente, P., and Matthews, D. B. (1994). Effects of pH on the kinetics of redox reactions in and around the cytochromebf complex in an isolated system. Photosyn. Res. 42, 111–120. doi: 10.1007/BF02187122
Huang, W., Yang, S.-J., Zhang, S.-B., Zhang, J.-L., and Cao, K.-F. (2012). Cyclic electron flow plays an important role in photoprotection for the resurrection plant Paraboea rufescens under drought stress. Planta 235, 819–828. doi: 10.1007/s00425-011-1544-3
Huang, W., Zhang, S.-B., and Cao, K.-F. (2010). Stimulation of cyclic electron flow during recovery after chilling-induced photoinhibition of PSII. Plant Cell Physiol. 51, 1922–1928. doi: 10.1093/pcp/pcq144
Ihnatowicz, A., Pesaresi, P., and Leister, D. (2007). The E subunit of photosystem I is not essential for linear electron flow and photoautotrophic growth in Arabidopsis thaliana. Planta 226, 889–895. doi: 10.1007/s00425-007-0534-y
Iwai, M., Takizawa, K., Tokutsu, R., Okamuro, A., Takahashi, Y., and Minagawa, J. (2010). Isolation of the elusive supercomplex that drives cyclic electron flow in photosynthesis. Nature 464, 1210–1213. doi: 10.1038/nature08885
Johnson, X., Steinbeck, J., Dent, R. M., Takahashi, H., Richaud, P., Ozawa, S.-I., et al. (2014). Proton gradient regulation 5-mediated cyclic electron flow under ATP- or redox-limited conditions: a study of ΔATPase pgr5 and ΔrbcL pgr5 mutants in the green alga Chlamydomonas reinhardtii. Plant Physiol. 165, 438–452. doi: 10.1104/pp.113.233593
Joliot, P., and Joliot, A. (2002). Cyclic electron transfer in plant leaf. Proc. Natl. Acad. Sci. U.S.A. 99, 10209–10214. doi: 10.1073/pnas.102306999
Joliot, P., and Joliot, A. (2006). Cyclic electron flow in C3 plants. Biochim. Biophys. Acta 1757, 362–368. doi: 10.1016/j.bbabio.2006.02.018
Kanazawa, A., and Kramer, D. M. (2002). In vivo modulation of nonphotochemical exciton quenching (NPQ) by regulation of the chloroplast ATP synthase. Proc. Natl. Acad. Sci. U.S.A. 99, 12789–12794. doi: 10.1073/pnas.182427499
Karcher, D., and Bock, R. (2009). Identification of the chloroplast adenosine-to-inosine tRNA editing enzyme. RNA 15, 1251–1257. doi: 10.1261/rna.1600609
Klughammer, C., and Schreiber, U. (1994). An improved method, using saturating light pulses, for the determination of photosystem I quantum yield via P700+-absorbance changes at 830 nm. Planta 192, 261–268. doi: 10.1007/BF01089043
Kohzuma, K., Cruz, J. A., Akashi, K., Hoshiyasu, S., Munekage, Y. N., Yokota, A., et al. (2009). The long-term responses of the photosynthetic proton circuit to drought. Plant Cell Environ. 32, 209–219. doi: 10.1111/j.1365-3040.2008.01912.x
Konieczny, A., and Ausubel, F. M. (1993). A procedure for mapping Arabidopsis mutations using co-dominant ecotype-specific PCR-based markers. Plant J. 4, 403–410. doi: 10.1046/j.1365-313X.1993.04020403.x
Kramer, D. M., Avenson, T. J., and Edwards, G. E. (2004). Dynamic flexibility in the light reactions of photosynthesis governed by both electron and proton transfer reactions. Trends Plant Sci. 9, 349–357. doi: 10.1016/j.tplants.2004.05.001
Kramer, D. M., and Crofts, A. R. (1989). Activation of the chloroplast ATPase measured by the electrochromic change in leaves of intact plants. Biochim. Biophys. Acta 976, 28–41. doi: 10.1016/S0005-2728(89)80186-0
Kramer, D. M., and Crofts, A. R. (1994). Re-examination of the properties and function of the b cytochromes of the thylakoid cytochrome bf complex. Biochim. Biophys. Acta 1184, 193–201. doi: 10.1016/0005-2728(94)90223-2
Kramer, D. M., and Evans, J. R. (2011). The importance of energy balance in improving photosynthetic productivity. Plant Physiol. 155, 70–78. doi: 10.1104/pp.110.166652
Krause, G. H., and Weis, E. (1984). Chlorophyll fluorescence as a tool in plant physiology : II. Interpretation of fluorescence signals. Photosynth. Res. 5, 139–157. doi: 10.1007/BF00028527
Lascano, H. R., Casano, L. M., Martín, M., and Sabater, B. (2003). The activity of the chloroplastic Ndh complex is regulated by phosphorylation of the NDH-F subunit. Plant Physiol. 132, 256–262. doi: 10.1104/pp.103.020321
Li, X.-P., Muller-Moule, P., Gilmore, A. M., and Niyogi, K. K. (2002). PsbS-dependent enhancement of feedback de-excitation protects photosystem II from photoinhibition. Proc. Natl. Acad. Sci. U.S.A. 99, 15222–15227. doi: 10.1073/pnas.232447699
Livingston, A. K., Cruz, J. A., Kohzuma, K., Dhingra, A., and Kramer, D. M. (2010a). An Arabidopsis mutant with high cyclic electron flow around photosystem I (hcef) involving the NADPH dehydrogenase complex. Plant Cell 22, 221–233. doi: 10.1105/tpc.109.071084
Livingston, A. K., Kanazawa, A., Cruz, J. A., and Kramer, D. M. (2010b). Regulation of cyclic electron flow in C(3) plants: differential effects of limiting photosynthesis at ribulose-1,5-bisphosphate carboxylase/oxygenase and glyceraldehyde-3-phosphate dehydrogenase. Plant. Cell Environ. 33, 1779–1788. doi: 10.1111/j.1365-3040.2010.02183.x
Lucker, B., and Kramer, D. M. (2013). Regulation of cyclic electron flow in Chlamydomonas reinhardtii under fluctuating carbon availability. Photosyn. Res. 117, 449–459. doi: 10.1007/s11120-013-9932-0
Mubarakshina, M. M., Ivanov, B. N., Naydov, I. A., Hillier, W., Badger, M. R., and Krieger-Liszkay, A. (2010). Production and diffusion of chloroplastic H2O2 and its implication to signalling. J. Exp. Bot. 61, 3577–3587. doi: 10.1093/jxb/erq171
Müller, P., Li, X. P., and Niyogi, K. K. (2001). Non-photochemical quenching. A response to excess light energy. Plant Physiol. 125, 1558–1566. doi: 10.1104/pp.125.4.1558
Munekage, Y., Hashimoto, M., and Miyake, C. (2004). Cyclic electron flow around photosystem I is essential for photosynthesis. Nature 700, 0–3. doi: 10.1038/nature02598
Munekage, Y., Hojo, M., Meurer, J., Endo, T., Tasaka, M., and Shikanai, T. (2002). PGR5 is involved in cyclic electron flow around photosystem I and is essential for photoprotection in Arabidopsis. Cell 110, 361–371. doi: 10.1016/S0092-8674(02)00867-X
Oxborough, K., and Horton, P. (1987). Characterisation of the effects of Antimycin A upon high energy state quenching of chlorophyll fluorescence (qE) in spinach and pea chloroplasts. Photosynth. Res. 12, 119–127. doi: 10.1007/bf00047942
Sacksteder, C. A., and Kramer, D. M. (2000). Dark-interval relaxation kinetics (DIRK) of absorbance changes as a quantitative probe of steady-state electron transfer. Photosyn. Res. 66, 145–158. doi: 10.1023/A:1010785912271
Sato, S., Nakamura, Y., Kaneko, T., Asamizu, E., and Tabata, S. (1999). Complete structure of the chloroplast genome of Arabidopsis thaliana. DNA Res. 6, 283–290. doi: 10.1093/dnares/6.5.283
Sazanov, L. A., Burrows, P. A., and Nixon, P. J. (1998). The plastid ndh genes code for an NADH-specific dehydrogenase: isolation of a complex I analogue from pea thylakoid membranes. Proc. Natl. Acad. Sci. U.S.A. 95, 1319–1324. doi: 10.1073/pnas.95.3.1319
Sharkey, T. D., and Weise, S. E. (2015). The glucose 6-phosphate shunt around the Calvin – Benson cycle. J. Exp. Bot. 67, 4067–4077. doi: 10.1093/jxb/erv484
Shikanai, T., Endo, T., Hashimoto, T., Yamada, Y., Asada, K., and Yokota, A. (1998). Directed disruption of the tobacco ndhB gene impairs cyclic electron flow around photosystem I. Proc. Natl. Acad. Sci. U.S.A. 95, 9705–9709. doi: 10.1073/pnas.95.16.9705
Strand, D. D., Fisher, N., Davis, G. A., and Kramer, D. M. (2016). Redox regulation of the antimycin A sensitive pathway of cyclic electron flow around photosystem I in higher plant thylakoids. Biochim. Biophys. Acta 1857, 1–6. doi: 10.1016/j.bbabio.2015.07.012
Strand, D. D., and Kramer, D. M. (2014). “Control of non-photochemical exciton quenching by the proton circuit of photosynthesis,” in Advances in Photosynthesis and Respiration, Vol. 40, Non-Photochemical Quenching and Energy Dissipation in Plants, Algae and Cyanobacteria Demmig-Adams, eds B. Garab, G. Adams III, and W. Govindjee (Dordrecht: Springer Netherlands), 387–408.
Strand, D. D., Livingston, A. K., Satoh-cruz, M., Froehlich, J. E., Maurino, V. G., and Kramer, D. M. (2015). Activation of cyclic electron flow by hydrogen peroxide in vivo. Proc. Natl. Acad. Sci. U.S.A. 112, 5539–5544. doi: 10.1073/pnas.1418223112
Tagawa, K., Tsujimoto, H. Y., and arnon, D. I. (1963). Separation by monochromatic light of photosynthetic phosphorylation from oxygen evolution. Proc. Natl. Acad. Sci. U.S.A. 50, 544–549. doi: 10.1073/pnas.50.3.544
Takabayashi, A., Kishine, M., Asada, K., Endo, T., and Sato, F. (2005). Differential use of two cyclic electron flows around photosystem I for driving CO2-concentration mechanism in C4 photosynthesis. Proc. Natl. Acad. Sci. U.S.A. 102, 16898–16903. doi: 10.1073/pnas.0507095102
Takahashi, H., Clowez, S., Wollman, F.-A., Vallon, O., and Rappaport, F. (2013). Cyclic electron flow is redox-controlled but independent of state transition. Nat. Commun. 4, 1954. doi: 10.1038/ncomms2954
Takahashi, S., Milward, S. E., Fan, D.-Y., Chow, W. S., and Badger, M. R. (2009). How does cyclic electron flow alleviate photoinhibition in Arabidopsis? Plant Physiol. 149, 1560–1567. doi: 10.1104/pp.108.134122
Takizawa, K., Cruz, J. A., Kanazawa, A., and Kramer, D. M. (2007). The thylakoid proton motive force in vivo. Quantitative, non-invasive probes, energetics, and regulatory consequences of light-induced pmf. Biochim. Biophys. Acta 1767, 1233–1244. doi: 10.1016/j.bbabio.2007.07.006
Terashima, M., Petroutsos, D., Hüdig, M., Tolstygina, I., Trompelt, K., Gäbelein, P., et al. (2012). Calcium-dependent regulation of cyclic photosynthetic electron transfer by a CAS, ANR1, and PGRL1 complex. Proc. Natl. Acad. Sci. U.S.A. 109, 17717–17722. doi: 10.1073/pnas.1207118109
Tiller, N., Weingartner, M., Thiele, W., Maximova, E., Schöttler, M. A., and Bock, R. (2012). The plastid-specific ribosomal proteins of Arabidopsis thaliana can be divided into non-essential proteins and genuine ribosomal proteins. Plant J. 69, 302–316. doi: 10.1111/j.1365-313X.2011.04791.x
Weis, E. (1985). Chlorophyll fluorescence at 77K in intact leaves: characterization of a technique to eliminate artifacts related to self-absorption. Photosyn. Res. 6, 73–86. doi: 10.1007/BF00029047
Keywords: photosynthesis, cyclic electron flow around photosystem I, hydrogen peroxide (H2O2), Arabidopsis, chloroplast translation
Citation: Strand DD, Livingston AK, Satoh-Cruz M, Koepke T, Enlow HM, Fisher N, Froehlich JE, Cruz JA, Minhas D, Hixson KK, Kohzuma K, Lipton M, Dhingra A and Kramer DM (2017) Defects in the Expression of Chloroplast Proteins Leads to H2O2 Accumulation and Activation of Cyclic Electron Flow around Photosystem I. Front. Plant Sci. 7:2073. doi: 10.3389/fpls.2016.02073
Received: 13 October 2016; Accepted: 28 December 2016;
Published: 13 January 2017.
Edited by:
Peter Jahns, University of Düsseldorf, GermanyReviewed by:
Xinguang Zhu, University of Chinese Academy of Sciences, ChinaCornelia Spetea, University of Gothenburg, Sweden
Copyright © 2017 Strand, Livingston, Satoh-Cruz, Koepke, Enlow, Fisher, Froehlich, Cruz, Minhas, Hixson, Kohzuma, Lipton, Dhingra and Kramer. This is an open-access article distributed under the terms of the Creative Commons Attribution License (CC BY). The use, distribution or reproduction in other forums is permitted, provided the original author(s) or licensor are credited and that the original publication in this journal is cited, in accordance with accepted academic practice. No use, distribution or reproduction is permitted which does not comply with these terms.
*Correspondence: David M. Kramer, kramerd8@msu.edu
†Present Address: Deserah D. Strand, Max-Planck-Institut für Molekulare Pflanzenphysiologie, Potsdam-Golm, Germany
Aaron K. Livingston, Department of Biology, Portland Community College, Portland, OR, USA