 Juan de la Cruz Jiménez1,2*†
 Juan A. Cardoso2†
 Luisa F. Leiva3Juanita Gil2Manuel G. Forero3
 Margaret L. Worthington2,4John W. Miles2
 Idupulapati M. Rao2
- 1School of Plant Biology, The University of Western Australia, Crawley, WA, Australia
- 2International Center for Tropical Agriculture, Cali, Colombia
- 3Semillero de Investigación LÚN, Grupo D+TEC, Universidad de Ibagué, Ibagué, Colombia
- 4Department of Horticulture, University of Arkansas, Fayetteville, AR, USA
Brachiaria grasses are sown in tropical regions around the world, especially in the Neotropics, to improve livestock production. Waterlogging is a major constraint to the productivity and persistence of Brachiaria grasses during the rainy season. While some Brachiaria cultivars are moderately tolerant to seasonal waterlogging, none of the commercial cultivars combines superior yield potential and nutritional quality with a high level of waterlogging tolerance. The Brachiaria breeding program at the International Center for Tropical Agriculture, has been using recurrent selection for the past two decades to combine forage yield with resistance to biotic and abiotic stress factors. The main objective of this study was to test the suitability of normalized difference vegetation index (NDVI) and image-based phenotyping as non-destructive approaches to identify Brachiaria hybrids tolerant to waterlogging stress under field conditions. Nineteen promising hybrid selections from the breeding program and three commercial checks were evaluated for their tolerance to waterlogging under field conditions. The waterlogging treatment was imposed by applying and maintaining water to 3 cm above soil surface. Plant performance was determined non-destructively using proximal sensing and image-based phenotyping and also destructively via harvesting for comparison. Image analysis of projected green and dead areas, NDVI and shoot biomass were positively correlated (r ≥ 0.8). Our results indicate that image analysis and NDVI can serve as non-destructive screening approaches for the identification of Brachiaria hybrids tolerant to waterlogging stress.
Introduction
Due to climate change, it is expected that extreme rainfall events will increase in some parts of the tropics in the future (Hirabayashi et al., 2013). This projected increase in precipitation over shorter periods of time will likely result in temporarily waterlogged soil conditions. Waterlogging causes a hypoxic or anoxic soil environment due to the slow diffusion of oxygen between the atmosphere and waterlogged soil, and by the rapid consumption of O2 by microorganisms and roots (Ponnamperuma, 1972; Colmer, 2003; Koppitz, 2004; Colmer and Voesenek, 2009; Unger et al., 2009). Oxygen deficiency in waterlogged soil limits root aerobic respiration (Jackson and Drew, 1984). As a result, symptoms such as leaf senescence and reduced or stunted growth are common in plants not adapted to waterlogged conditions (Malik et al., 2015).
Livestock production is one of the main economic activities across Latin America (Rivas and Holmann, 2004). Livestock productivity depends largely on forage productivity (Boval and Dixon, 2012). Brachiaria grasses are the most widely sown forages in tropical Latin America, and their productivity and persistence are affected by waterlogging (Baruch, 1994; Rao, 2014). Plant breeding has the potential to improve waterlogging tolerance in Brachiaria grasses since inter-and intraspecific variation has been found (Cardoso et al., 2014a,b). The International Center for Tropical Agriculture (CIAT) conducts a Brachiaria breeding program which aims to develop interspecific Brachiaria hybrids with greater forage and seed yield, improved forage quality, and adaptation to biotic and abiotic stress factors (including waterlogging tolerance) (Miles, 2007).
Shoot biomass (i.e., forage yield) is one of the most important target traits for improvement in any forage breeding program. However, measurement of shoot biomass is a labor and time consuming process that involves a significant amount of sample processing (harvesting, drying, and weighing) (Schaefer and Lamb, 2016). Plant height is commonly measured to estimate shoot biomass, particularly in forage grasses with erect growth habit (Harmoney et al., 1997; Ganguli et al., 2000). However, plant height does not provide information on the green vs. senescent or chlorotic (from now on referred to as ‘dead’) fraction of shoot biomass. Such distinction between fractions of the shoot biomass in Brachiaria hybrids is relevant because the green fraction contributes to the potential productivity of the hybrid, whereas the dead fraction indicates the sensitivity of the hybrid to a number of environmental stresses, including waterlogging (Cardoso et al., 2013; Rao, 2014), and influences forage quality. Yet, distinction between green and dead fractions of the shoot biomass is not often applied in field studies due to labor and time constraints.
Visual evaluation of symptoms (green vs. dead fraction of shoot) under waterlogging stress has traditionally been used to evaluate the tolerance of selected Brachiaria hybrids in the CIAT breeding program. However, such evaluations are laborious, often biased by the examiner and may not be sufficiently accurate (Walter et al., 2012). In the face of such limitations, there is increasing interest in implementing non-destructive approaches to evaluate Brachiaria hybrids under waterlogging conditions, particularly applying techniques that were developed for use under field conditions and are currently tested on other major crops (e.g., Rundquist et al., 2004; Scotford and Miller, 2004; Montes et al., 2007; Lan et al., 2009; McCarthy et al., 2010; Comar et al., 2012; White et al., 2012; White and Conley, 2013; Andrade-Sanchez et al., 2014; Araus and Cairns, 2014; Deery et al., 2014; Barker et al., 2016; Lootens et al., 2016). The use of non-destructive automated phenotyping may enable more accurate quantification of symptoms, representing a strong possibility to achieve progress in genetic gain (Walter et al., 2012).
One such technique is the use of the normalized difference vegetation index (NDVI). The NDVI measures differences of reflectance in the red and near-infrared regions of the spectrum and provides an estimation of plant biomass and senescence (Di Bella et al., 2004; Verhulst and Govaerts, 2010). The leaves of a healthy plant absorb more red light and reflect more of the near infrared light, resulting in high NDVI values. As a result, NDVI handheld sensors were developed to monitor plant health (Verhulst and Govaerts, 2010) and currently are widely used for screening purposes for resistance to abiotic stress (Lopes and Reynolds, 2012; Adebayo et al., 2014; Arguello et al., 2016). More recently, digital images have been used to assess plant responses to different abiotic constraints (for examples see, Granier et al., 2006; Tackenberg, 2007; Walter et al., 2007; Golzarian et al., 2011; Hartmann et al., 2011; Humplík et al., 2015a,b).
Each of these techniques (NDVI and digital photography) have disadvantages but might be complimentary to each other. A common set-up for the non-destructive and proximal sensing of plants under field conditions (using NDVI and digital images) relies on data acquisition from the top of the plant. An overhead digital image can discriminate between green and dead fractions (Camargo et al., 2014), but cannot predict plant height. Whereas, NDVI might provide an estimate of plant height and shoot biomass (Payero et al., 2004; Pittman et al., 2015) but cannot separate green from dead fractions of the shoot biomass. Therefore, a comprehensive understanding of plant performance under waterlogging conditions could be reached by using both NDVI and digital photography. For that reason, the main objective of the present study was to test NDVI and digital images as complementary non-destructive approaches to identify Brachiaria hybrids tolerant to waterlogging stress under field conditions.
Materials and Methods
Plant Material and Growing Conditions
The field trial was conducted in July, 2015 at the CIAT headquarters in Palmira, Colombia (lat. 3° 29′ N; long. 76° 21′ W; altitude 965 m). Plants grown in a Mollisol (Fluventic Haplustept), clay-loam, pH 7.8, organic matter 18.4 g/kg and bulk density 1.6 g/cm3. The genotypes used in this study were 19 hybrids generated from interspecific crosses (B. brizantha × B. decumbens × B. ruziziensis) in the CIAT Brachiaria breeding program as well as 3 commercial cultivars (B. decumbens cv. Basilisk [CIAT 606]; B. brizantha cv. Marandu [CIAT 6294]; and the interspecific Brachiaria hybrid cv. Caymán [BR02/1752]) as checks. The 19 test hybrids were selected from a larger group of advanced hybrid breeding materials based on their high biomass production after 2 weeks of continuous waterlogging in a previous pot trial (data not shown). The trial was performed as a split plot experiment with control and waterlogged treatments assigned to main plots (8 m width × 36 m long) organized in a randomized complete block design with two replicates and the 22 genotypes assigned to subplots in a randomized complete block design with six replicates per main plot.
Vegetative propagules of each genotype were planted in Jiffy mix (Carefree®, Jiffy International, Norway) for an establishment period of 2 weeks before being transplanted into the field. Plants were then allowed to grow for an additional period of 2 months under field conditions spaced by 2 m before the experimental treatments were imposed. After the establishment period, waterlogged and control treatments were imposed for 2 weeks. Main plots were leveled to 0° and surrounded by a compacted berms (50 cm height and 60 cm length). The waterlogged treatment was imposed by applying water to a lamina of three centimeters above soil surface by flood irrigation. Waterlogged plots were irrigated daily in order to maintain the water level during the entire 2-week treatment period. Control plots were supplied with adequate water at the beginning of the treatment and the water table was monitored using homemade piezometers. Average temperature was 31/20°C (day/night) and total precipitation was 1.5 mm during the 2 week treatment period.
Conventional Destructive Phenotyping
Initial vigor (IV) before waterlogging treatment was assessed using a five-point, visual scale: level ‘5’ indicated high shoot growth with many leaves and tillers while level ‘1’ represented low shoot growth with fewer tillers and less leaf growth. A second visual evaluation (VE) at harvest was performed only in waterlogged plants. This VE consisted of a waterlogging injury score that was used to characterize the performance of the plants after waterlogging conditions: level ‘5’ represented plants without any visible damage and ‘1’ denoted dead plants. Plant height (PH) was measured manually using a ruler before starting waterlogging treatment and at harvest.
After 2 weeks of treatment, aboveground biomass was harvested at 1 cm above soil surface and oven dried at 60°C for 3 days. Finally, aboveground tissue including leaves and stems were weighed and expressed as shoot biomass (SHB). Then SHB components were separated into dead leaf biomass (DLB) and green leaf biomass (GLB). The waterlogging tolerance coefficient (WTC) was determined according to Liu et al. (2010) and expressed in percentage:
NDVI and Digital Image Processing for Non-destructive Phenotyping
Digital color images of each plant were taken individually before imposing treatments and at harvest from 1.5 m above the soil surface using a Coolpix P6000 camera (Nikon, Japan) with a resolution of 13 megapixels. Digital images were saved in 4224 × 3168 pixel JPG format and analyzed by a set of instructions written in Java and run in ImageJ software (National Institutes of Health, USA). A workflow of the image analysis program is summarized in Figure 1. The main steps of image analysis were performed to classify pixels of the image into its components, namely soil, green leaves, and dead leaves as follows. (1) Image background information was eliminated by using a previous color threshold learning adjusted to remove soil pixels from the image. This process outputs plant silhouettes without background noise. (2) A stretching process was applied to increase color contrast and to reduce correlation among similar pixels. This process enhances subtle differences in hue by creating a false image which will be easily segmented afterward. (3) Images were segmented by a pattern recognition approach using a modified K-means classifier. This non-supervised classifier used Euclidian distance to classify pixels clusters according to classes of interest, e.g., dead leaves vs. green leaves. (4) Segmented pictures were analyzed by counting pixels according to different regions of interest. (5) Data were recorded in.csv format and expressed in percentage of pixels according to different areas of interest in the original picture. For instance, green pixels refers to green areas in the picture and yellow pixels refers to both chlorotic and senescent tissues in the picture. Finally, the number of pixels in each region of interest was converted to mm2. Immediately before the conventional destructive phenotyping, we measured the NDVI from 1.5 m above the soil surface using a hand-held device (GreenSeeker®, Trimble, USA). Projected WTC was also determined following the methodology previously used in the section before and comparing projected green areas under waterlogging and control conditions.
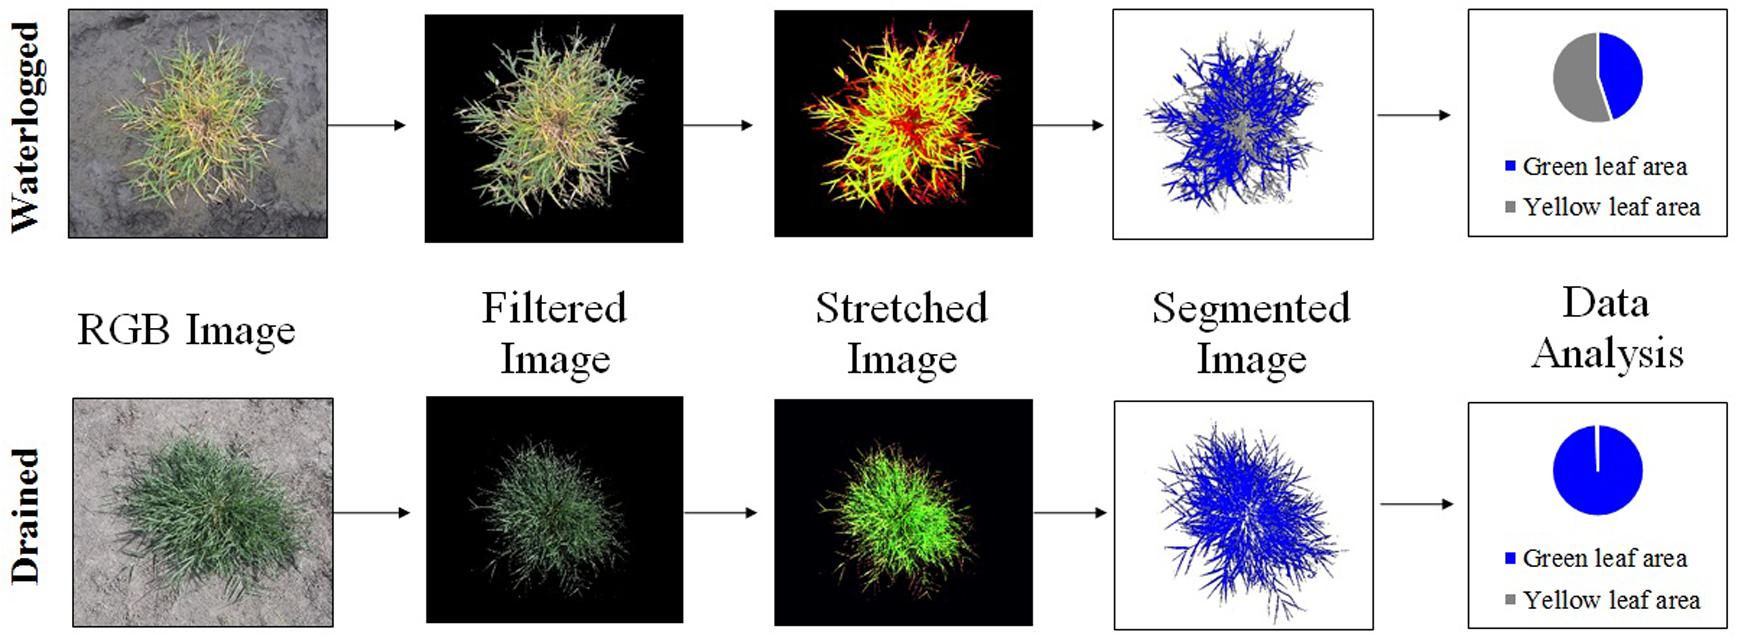
FIGURE 1. Work flow of image analysis steps used in the calculation of projected green and dead plant biomass from overhead digital photography.
Statistical Analysis
Statistical analyses were conducted using SAS 9.2 (SAS Institute, Inc., USA). Analyses of variance (ANOVA) were performed to test for the effect of treatments and traits measured. Least-square means were calculated for all traits using PROC MIXED, genotypes and treatments were considered as fixed effects and replications as random effects. Least-square means were then used to calculate Pearson’s correlations. Means of measured traits, variation coefficient and Fisher’s protected LSD were also calculated to identify differences among treatments and genotypes.
Results
Big differences in green leaf biomass and dead leaf biomass produced under waterlogging conditions were prominent across evaluated hybrids, indicating that sufficient genetic variation for waterlogging tolerance exists within the CIAT Brachiaria breeding program and that current screening methodology can be used to effectively select for increased tolerance to waterlogging. We found that both conventional and non-destructive phenotyping can be used to accurately select Brachiaria hybrids under waterlogged field conditions. However, the use of non-destructive phenotyping entails a much more throughput evaluation without compromising selection accuracy.
Conventional Destructive Phenotyping
Waterlogging treatment had a negative effect on performance of all the genotypes evaluated (Table 1). Mean shoot biomass under waterlogged conditions decreased by 51% compared with drained conditions. The performance of hybrids under waterlogged conditions varied significantly. Two hybrids (BR12/1399; BR12/4951) showed high shoot biomass production under both waterlogged and control conditions (Table 1). Under waterlogged conditions, hybrids BR12/2316, BR12/1176, and BR12/3018 had significantly lower shoot biomass production in comparison with the cultivar Caymán (Table 1). Mean plant height under waterlogged conditions decreased by 23% compared with control conditions (Table 1). After 2 weeks of waterlogging, a set of hybrids (BR12/3436, BR12/1399, BR12/1535, BR12/3377, BR12/4951) were significantly taller than cultivars Basilisk and Marandu (Table 1). Only hybrid BR12/1316 had a significantly lower VE score than the three cultivars tested (Table 1). Hybrid BR12/4856, had a significantly higher waterlogging tolerance coefficient (WTC) than the commercial cultivars (Figure 2).
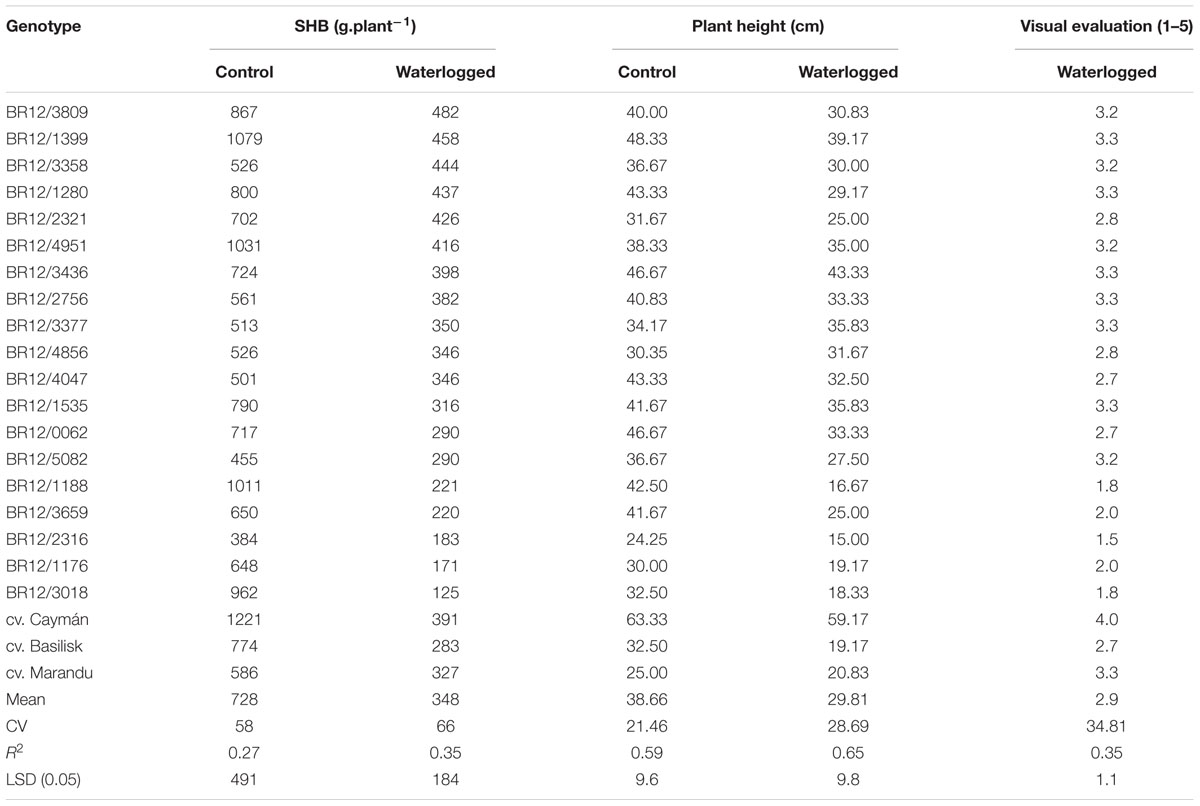
TABLE 1. Least-square means of shoot biomass (SHB), plant height after treatment and visual evaluation of symptoms in 19 Brachiaria hybrids and three commercial cultivars grown under control and waterlogged field conditions.
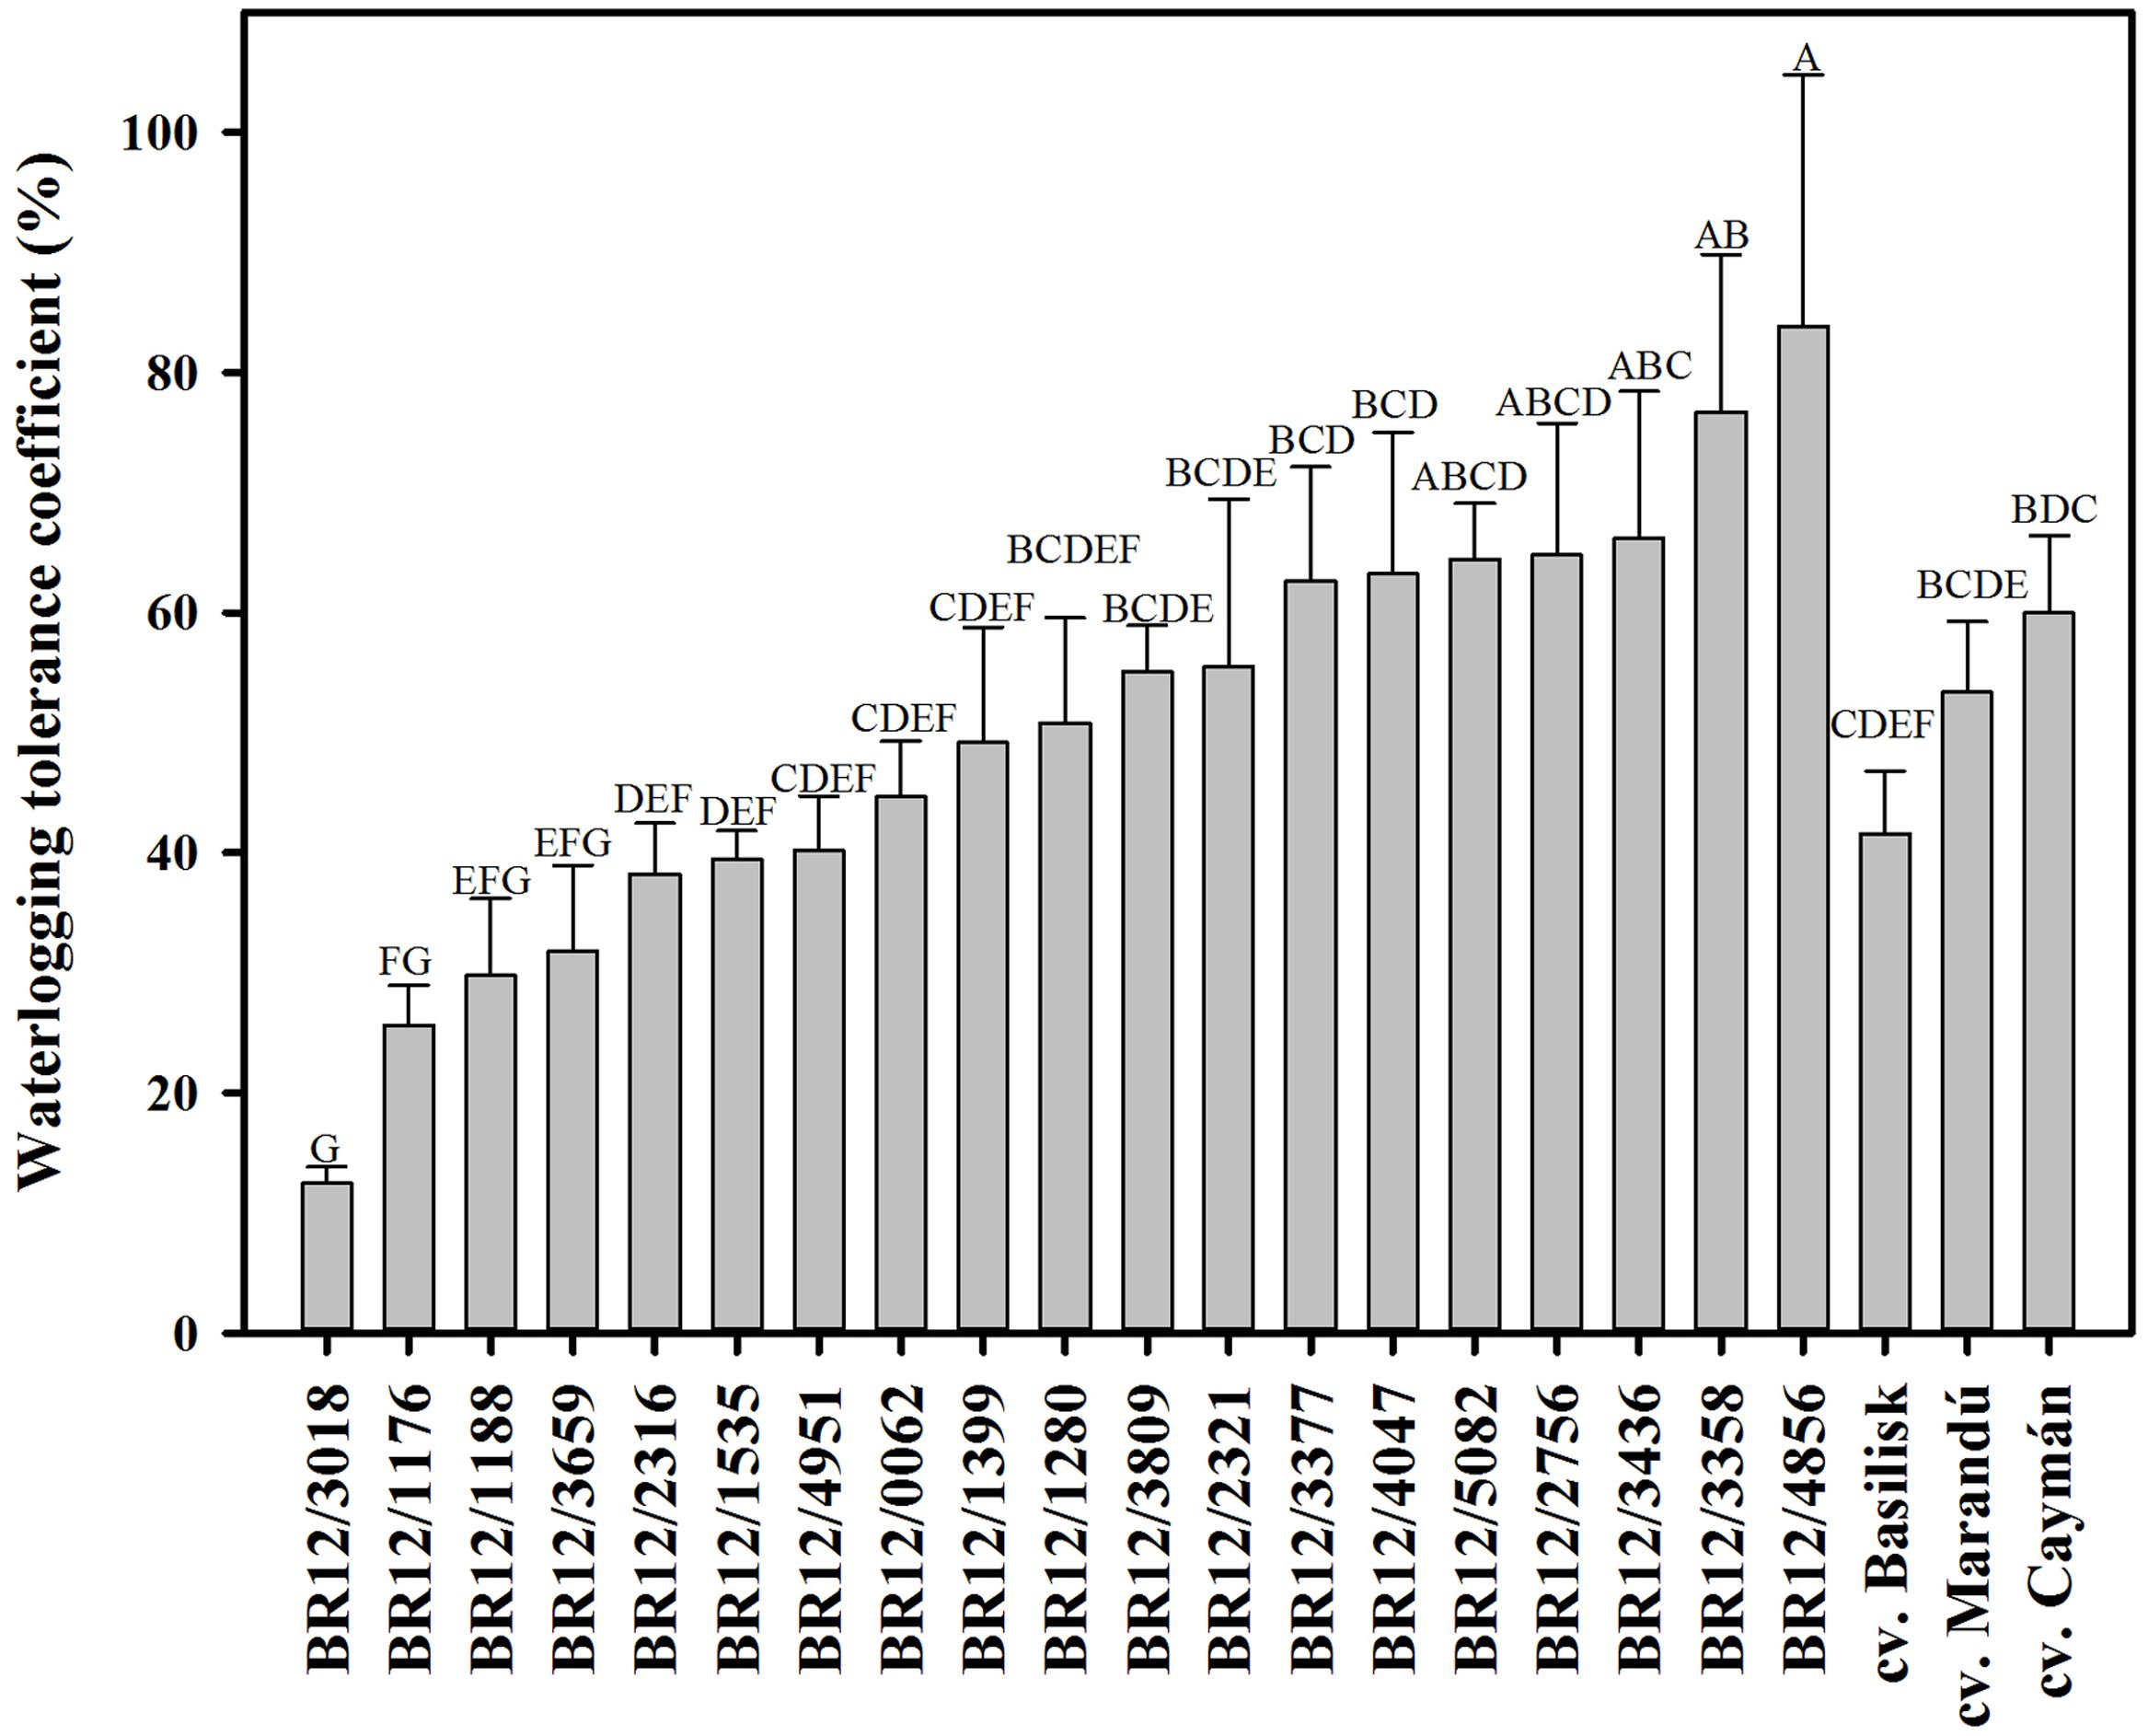
FIGURE 2. Waterlogging tolerance coefficient (WTC) among evaluated hybrids. Means with different letters indicate significant differences according to the Fisher-protected LSD test (P ≤ 0.05).
Harvested shoot biomass under control conditions was significantly correlated with IV (r = 0.58, P < 0.01), plant height before treatment (r = 0.61, P < 0.01), and plant height after treatment (r = 0.56, P < 0.01) (Table 2). Under waterlogged conditions, harvested shoot biomass was positively and significantly associated with IV (r = 0.58, P < 0.01), plant height before treatment (r = 0.57, P < 0.01), plant height after treatment (r = 0.80, P < 0.001) and visual evaluation of symptoms (r = 0.69, P < 0.01) (Table 3).
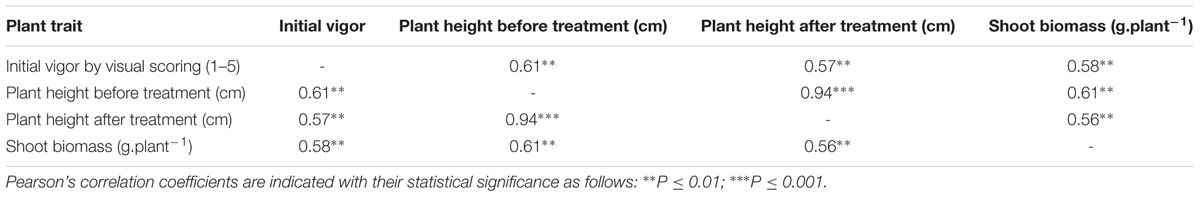
TABLE 2. Correlation (r) of least-square means of conventional destructive phenotyping traits measured under control conditions (n = 22).
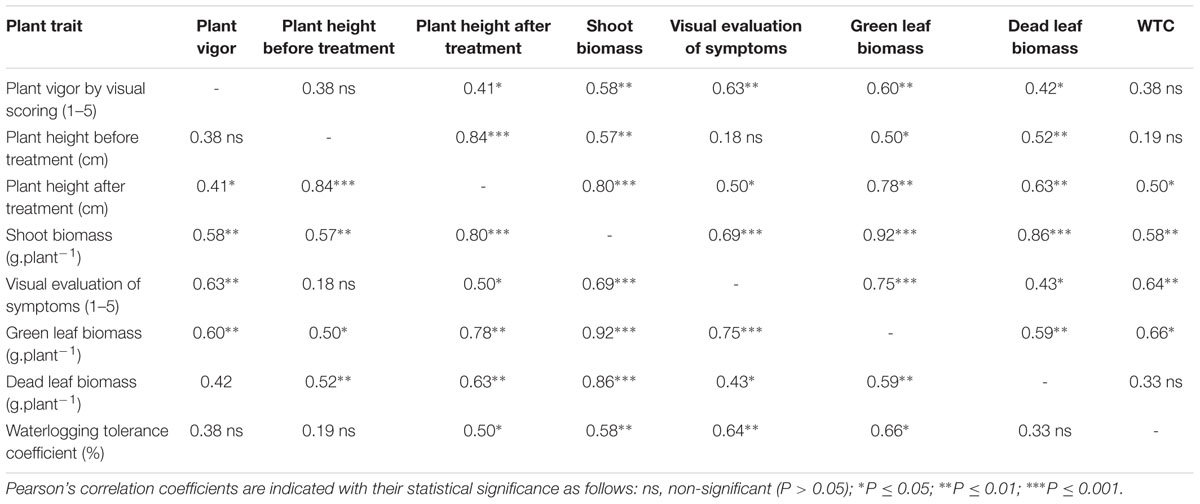
TABLE 3. Correlation (r) of least-square means of conventional destructive phenotyping traits measured under waterlogged conditions (n = 22).
NDVI and Digital Image Processing for Non-destructive Phenotyping
We evaluated the feasibility of simple and non-destructive phenotyping by comparing it with conventional, more laborious and expensive phenotyping methods. Non-destructive image analysis of projected green area before starting treatment (PGA1) and projected green area after treatment (PGA2) were positively and linearly correlated with harvested shoot biomass among genotypes evaluated under control conditions (r = 0.94, P < 0.001 and r = 0.84, P < 0.001, respectively) (Table 4). Likewise, no strong correlation was found neither between PGA2 and IV (r = 0.52, P < 0.01) nor between PGA2 and both values of plant height before treatment (r = 0.51, P < 0.05) and plant height after treatment (r = 0.51, P < 0.05) (Table 4). NDVI values were not significantly correlated with either PGA1 (r = 0.40, P > 0.05) or with IV (r = 0.34, P > 0.05) under control conditions (Table 4). Plant height before treatment and plant height after treatment under control conditions had highly significant correlations with NDVI values (r = 0.70, P < 0.001 and r = 0.76, P < 0.001, respectively) (Table 4).
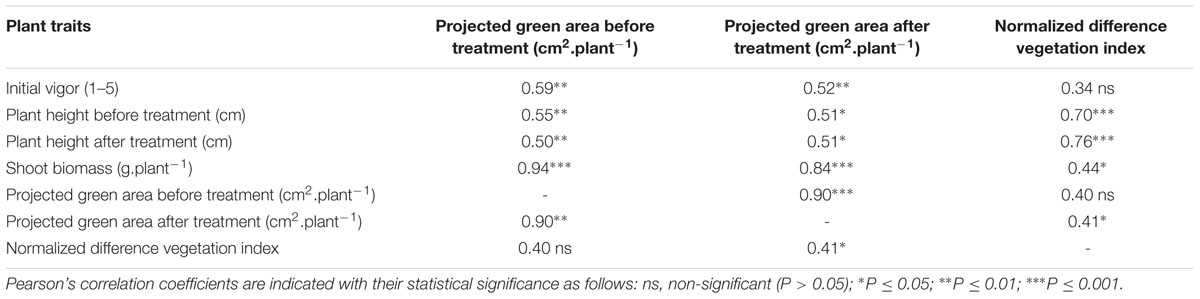
TABLE 4. Correlation (r) of least-square means of non-destructive phenotyping traits measured under control conditions (n = 22).
Under waterlogging conditions, a significant positive correlation was found between the dead and green leaf area predicted through image analysis and destructively measured dead or green leaf biomass (r = 0.92, P < 0.001 and r = 0.88, P < 0.001, respectively) (Table 5). Normalized difference vegetation index values were also significantly associated with total shoot biomass (r = 0.84, P < 0.001), green leaf biomass (r = 0.85, P < 0.001), plant height after treatment (r = 0.75, P < 0.001), visual evaluation of symptoms (r = 0.85, P < 0.001) and projected green area after waterlogging using digital photography (r = 0.85, P < 0.001) (Table 5). There was no correlation between plant vigor before treatment and projected dead area (r = 0.38) (Table 5). Plant height before starting waterlogging treatment was significantly positively related to projected green area before waterlogging treatment (r = 0.62, P < 0.01). Similarly, plant height after 2 weeks of waterlogging was significantly correlated with projected green area after waterlogging treatment (r = 0.73, P < 0.001) (Table 5). Visual evaluation of symptoms after waterlogging treatment were associated with projected green area after treatment (r = 0.71, P < 0.001) (Table 5). A significant correlation was found (r = 0.7, P < 0.001) between destructively measured WTC and projected WTC calculated from digital images (Figure 3).
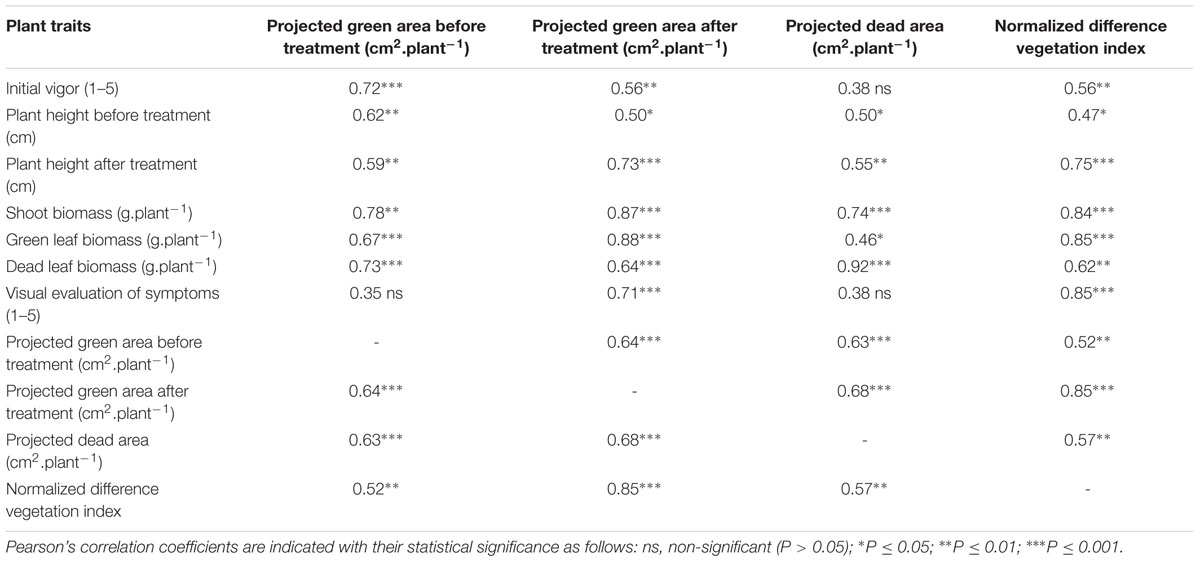
TABLE 5. Correlation (r) of least-square means of non-destructive phenotyping traits measured under waterlogged conditions (n = 22).
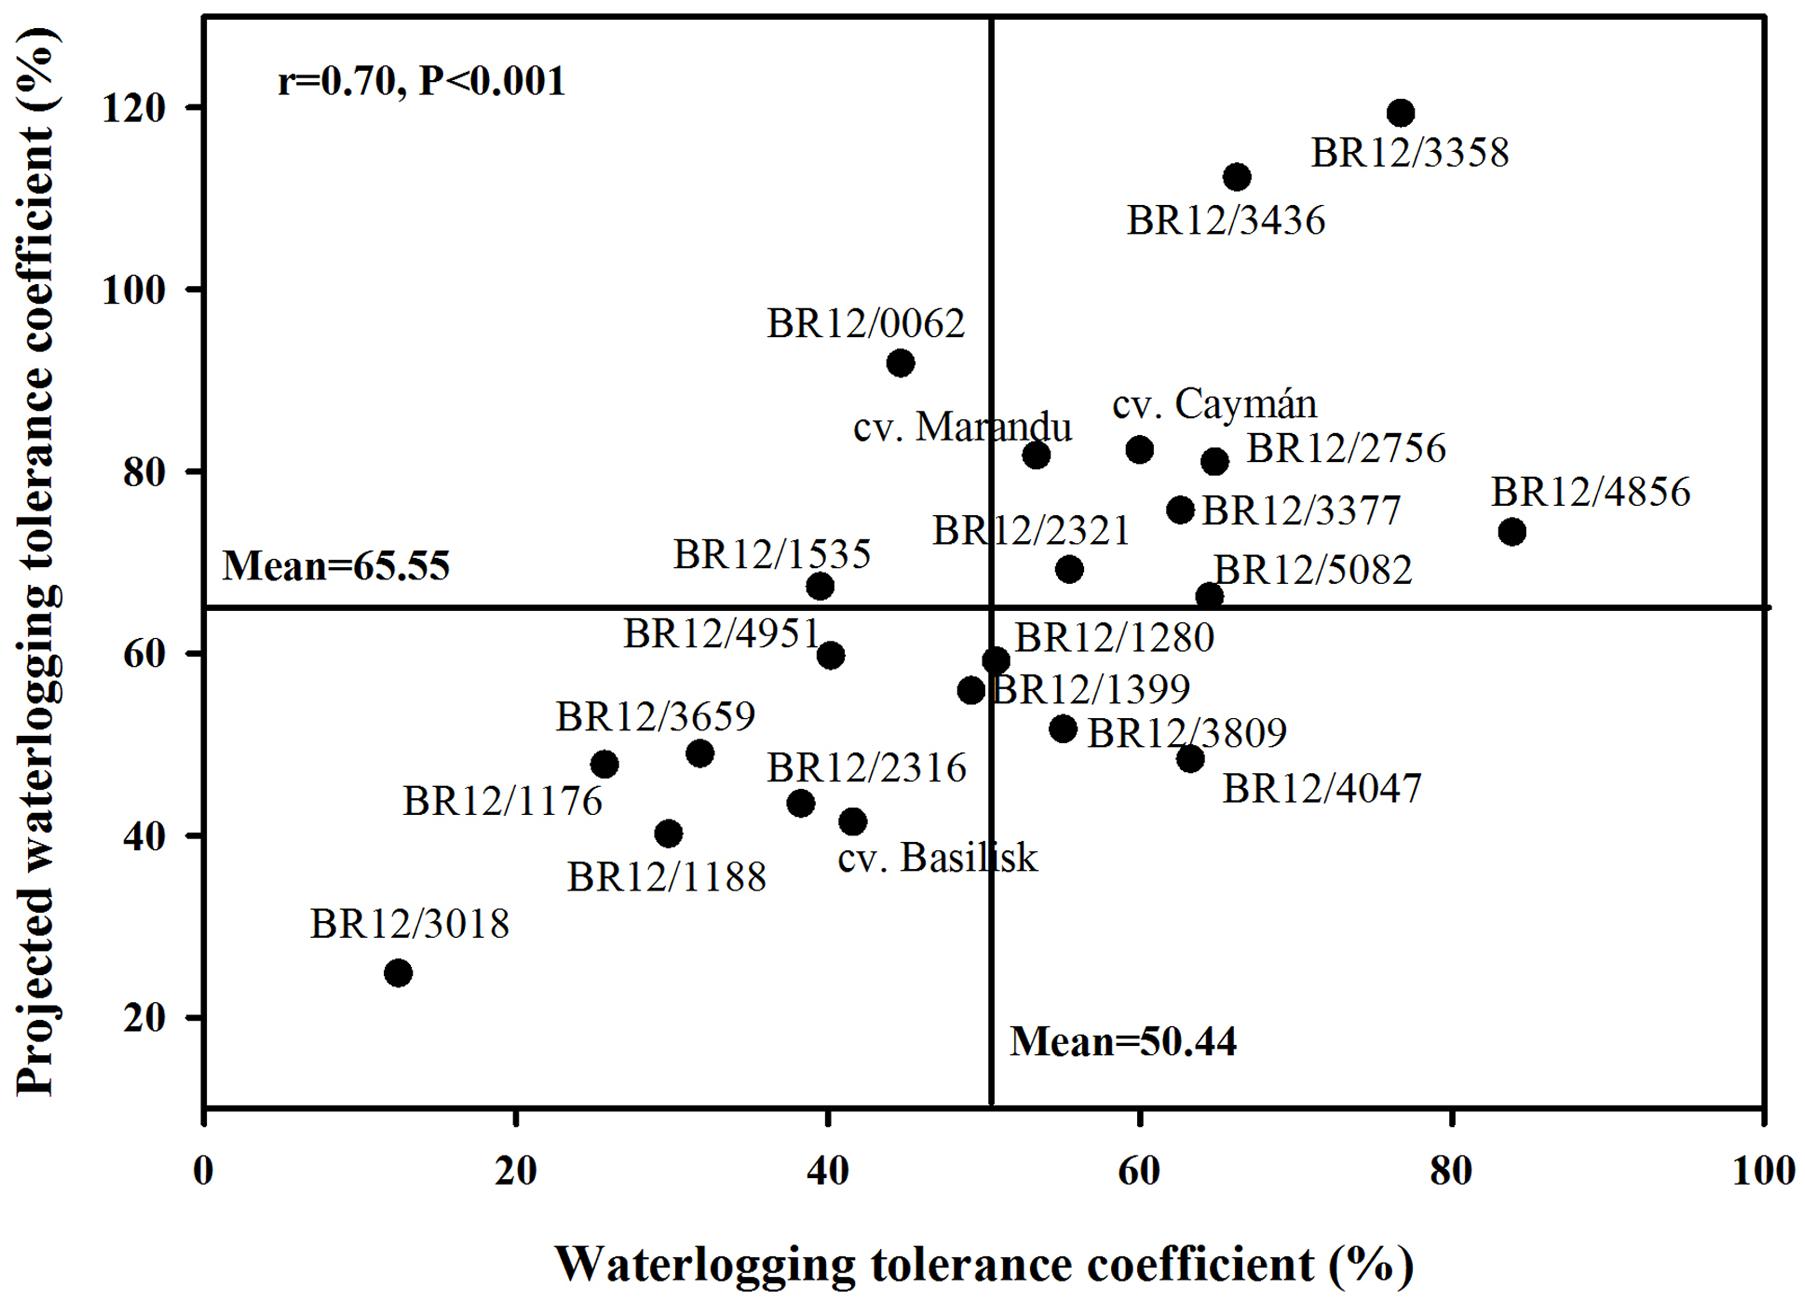
FIGURE 3. Relationship between waterlogging tolerance coefficient and projected waterlogging tolerance coefficient.
Discussion
The results of this study demonstrate that NDVI and image-based phenotyping for non-destructive estimation of plant performance was useful to identify differences in shoot biomass production and waterlogging tolerance among Brachiaria genotypes under field conditions. This phenotyping methodology just requires the use of a regular Red Green Blue (RGB) camera, a static frame and the free ImageJ software, making implementation easily achievable and user friendly. Fifty plants were photographed per hour and images were analyzed in less than 10 min. Although waterlogged plots made photograph collection difficult, this analysis was done more efficiently compared with conventional phenotyping. With only few modifications in the code, our processing program could also be used to phenotype different plants under different field and stress conditions. The main constraint of imaging in the field is the ever changing intensity and spectral composition of solar irradiance, making the pixel analysis comparison inconsistent between different pictures (Joalland et al., 2016). However, by selecting an adequate color threshold of different regions of interest we were able to address this problem.
Conventional Destructive Phenotyping
Waterlogged soil has a deleterious effect in Brachiaria growth. Major effects of waterlogging in Brachiaria includes decrease in water and nutrient uptake, stomatal closure, reduction of photosynthetic activity, stunted growth and senescence, often leading to plant death (Dias-Filho, 2006). In the present study, significant differences in harvested shoot biomass after waterlogging treatment were found among the genotypes evaluated (Table 1). Differences in biomass production under waterlogging conditions have previously been reported in Brachiaria genotypes (Dias-Filho, 2002). The advanced hybrid selections evaluated in this study showed comparable or even higher shoot biomass production under waterlogging conditions than the commercial cultivars (Table 1). These outstanding hybrids should be an interesting source of alleles to further exploit through breeding.
Phenotypic differences in plant height after waterlogging treatment were found among the evaluated plants (Table 1). Taller plants have an advantage over short plants under waterlogging conditions, as more water is required to fully cover the plants. It is widely known that plants respond to flooding or submergence conditions by growing hyponastically or changing growth habit and leaf angle (reviewed by Polko et al., 2011) as mechanisms to escape the anoxic environment. Therefore, plants with an erect growth habit might be more resistant to waterlogging conditions. Despite the mean plant height decreased under waterlogging conditions, we found a significant and strong correlation between plant height and shoot biomass under waterlogging conditions (r = 0.80, P < 0.001) (Table 3). This suggested that plants that were able to grow hyponastically tended to produce more biomass under waterlogging conditions. This finding suggests that plant height could be used as a simple trait in screening schemes aimed at selecting waterlogging tolerant grasses.
The WTC represents a calculation of the biomass produced under waterlogging against that produced under control conditions, and has been employed as a practical screening method to test waterlogging tolerance in maize (Liu et al., 2010). One hybrid (BR12/4856) had significantly superior WTC compared to the three commercial cultivars (Figure 2). However, this hybrid was not among the best performers in terms of overall shoot biomass produced under waterlogging conditions (Table 1), suggesting that its high WTC was influenced by its reduced growth under control conditions. Small plants require less metabolic demands for maintaining growth in comparison with bigger plants, thus it would represent a competitive advantage under waterlogging conditions. Similarly, a significant and strong correlation between shoot biomass and dead leaf biomass (r = 0.86, P > 0.0001) under waterlogging condition was found (Table 3), indicating that plants showing high biomass also had more proportion of dead leaves. Genotypes showing high WTC also had high projected WTC (Figure 3), indicating the feasibility of image analysis as a phenotyping tool. Nonetheless, no substantial differences between evaluated hybrids were found suggesting that calculation of WTC is not efficient for screening purposes in Brachiaria.
NDVI and Digital Image Processing for Non-destructive Phenotyping
In the present field study, a strong correlation between analysis of regular RGB images and harvested aboveground biomass was found (Tables 4 and 5). The correlations between projected green and dead shoot area obtained from digital photographs of plants subjected to 2 weeks of waterlogging treatment and destructively harvested green and dead leaf biomass were highly positive and significant (r = 0.88, P < 0.0001 and r = 0.92, P < 0.0001, respectively) (Table 5), indicating the potential use of this approach as non-destructive phenotyping tool. This approach could also be used to determine the negative effect of waterlogging and could provide an estimate of acclimation ability -or lack of it-, as the stress continues. In a field experiment, Lootens et al. (2016) found a strong correlation (r = 0.82) between leaf growth predicted by digital photography and its respective destructive measurement in a Lolium perenne germplasm panel. Other studies in controlled greenhouse conditions have found similar correlations between areas estimated by image analysis and harvested biomass (Tackenberg, 2007; Rajendran et al., 2009; Fanourakis et al., 2014; Hairmansis et al., 2014; Joalland et al., 2016).
Although plants under control conditions were vigorous with a considerable amount of overlapping leaves (Figure 1), the correlation between projected green area and harvested shoot biomass was also highly positive and significant (r = 0.84, P < 0.001) (Table 4). This indicates that pictures collected with a regular 13 megapixels’ camera located 1.5 m above the plants give adequate resolution for phenotyping purposes. Image analysis of vigorous plants with overlapping leaves can lead to underestimations of projected areas (Fanourakis et al., 2014; Joalland et al., 2016). To address this problem, Tessmer et al. (2013) have proposed a functional analysis involving plant area estimation, growth modeling and analysis which takes overlapping leaves into account in small rosette plants. In the same way, image analysis accuracy should be improved by taking into account plant area and plant age (Golzarian et al., 2011).
Under waterlogged conditions we found significant correlations among projected green area, shoot biomass and green leaf area. NDVI values were also well-correlated with shoot biomass and green leaf biomass. Thus non-destructive phenotyping through analysis of digital photographs is a more accurate method to estimate total shoot biomass and green leaf biomass than visual estimation. As a consequence of waterlogging, all of the evaluated plants showed green and dead leaves, hindering the conventional harvest and visual scoring method. In this sense, automation of phenotyping by using complementary tools such as NDVI and image analysis offers potential benefits in labor savings and accuracy because they are not affected by human fatigue or bias. Non-destructive phenotyping through image analysis could also be used to quantify the proportion of aboveground biomass affected by waterlogging in early stages. This in turn could give information about which species can be targeted to be planted in zones with different periods of waterlogging. In the same way, analysis of growth rate under waterlogging conditions could also be performed using the proposed phenotyping technique. The advantages of image analysis are that the measurements obtained are quantitative, non-destructive, rapid, and can be used as a proxy for forage yield (Hairmansis et al., 2014). Digital photography could be used as a powerful tool for increasing selection accuracy by increasing the number of replicates evaluated and could also be applied to large mapping populations to identify genes underlying variation in senescence under stress conditions (Furbank and Tester, 2011). Thus the use of non-destructive phenotyping approaches should facilitate rapid and reliable field evaluation of a greater number of genotypes without compromising selection accuracy of a traditional visual evaluation and destructive type of analysis. This in turn will support the on-going Brachiaria breeding efforts and accelerate genetic gain in improving forage yield under waterlogging and also other abiotic stress factors.
Conclusion
The high correlation observed in the present study between harvested shoot biomass and projected shoot area confirm the reliability of the non-destructive approach as a powerful tool of phenotyping to identify stress tolerant hybrids. The image processing method proposed in this study discriminated between green leaves, dead leaves and soil and was found to correlate with plant performance under waterlogged conditions. NDVI was successfully used as a complimentary measurement well-correlated to plant height. Both approaches could be applied to monitor changes in plant growth and senescence under waterlogged conditions over time. The application of this methodology could serve as a screening method specially in remote areas without access to appropriate facilities to perform conventional screening. Even though our methodology and code for image analysis was sufficiently robust to identify phenotypes under field conditions, further characteristics could be added. A side-view camera attached to the frame could improve biomass prediction and quantify plant height. Furthermore, statistical analysis could be incorporated to the code aimed to facilitate phenotyping analysis and plant identification. Further work is needed to test the suitability of this method in a set of tolerant plants in order to assess its aptitude to detect small differences between waterlogged plants as well as differences under other stresses.
Author Contributions
JJ, JC, MW, JM, and IR designed the experiment and contributed to data interpretation. JJ and JC collected field data. JJ, JC, LL, JG, and MF analyzed images. JJ, JC, MW, and IR wrote the paper. All authors read and approved the final manuscript.
Conflict of Interest Statement
The authors declare that the research was conducted in the absence of any commercial or financial relationships that could be construed as a potential conflict of interest.
Acknowledgments
We thank Mr. Juan Bosco Cuasquer for helping with statistical analysis. This work was partially funded by Dow AgroSciences, USA. We thank CGIAR research program on Livestock & Fish for partial financial support. We would also like to thank all donors who supported this work through their contributions to the CGIAR Fund.
References
Adebayo, M. A., Menkir, A., Blay, E., Gracen, V., Danquah, E., and Hearne, S. (2014). Genetic analysis of drought tolerance in adapted x exotic crosses of maize inbred lines under managed stress conditions. Euphytica 196, 261–270. doi: 10.1007/s10681-013-1029-5
Andrade-Sanchez, P., Gore, M. A., Heun, J. T., Thorp, K. R., Carmo-Silva, A. E., French, A. N., et al. (2014). Development and evaluation of a field-based high-throughput phenotyping platform. Funct. Plant Biol. 41, 68–79. doi: 10.1071/FP13126
Araus, J. L., and Cairns, J. E. (2014). Field high-throughput phenotyping: the new crop breeding frontier. Trends Plant Sci. 19, 52–61. doi: 10.1016/j.tplants.2013.09.008
Arguello, M. N., Mason, R. E., Roberts, T. L., Subramanian, N., Acuña, A., Addison, C. K., et al. (2016). Performance of soft red winter wheat subjected to field soil waterlogging: grain yield and yield components. Field Crops Res. 194, 57–64. doi: 10.1016/j.fcr.2016.04.040
Barker, I. I. I. J., Zhang, N., Sharon, J., Steeves, R., Wang, X., Wei, Y., et al. (2016). Development of a field-based high-throughput mobile phenotyping platform. Comput. Electron. Agric. 122, 74–85. doi: 10.1016/j.compag.2016.01.017
Baruch, Z. (1994). Responses to drought and flooding in tropical forage grasses. I. Biomass allocation, leaf growth and mineral nutrients. Plant Soil 164, 87–96. doi: 10.1007/BF00010114
Boval, M., and Dixon, R. M. (2012). The importance of grasslands for animal production and other functions: a review on management and methodological progress in the tropics. Animal 6, 748–762. doi: 10.1017/S1751731112000304
Camargo, A., Papadopoulou, D., Spyropoulou, Z., Vlachonasios, K., Doonan, J. H., and Gay, A. P. (2014). Objective definition of rosette shape variation using a combined computer vision and data mining approach. PLoS ONE 9:5. doi: 10.1371/journal.pone.0096889
Cardoso, J. A., Jiménez, J., Rincón, J., and Rao, I. (2014a). Adaptive responses of Brachiaria grasses to hypoxia stress. Trop. Grass. 2, 21–23. doi: 10.17138/TGFT(2)21-23
Cardoso, J. A., Jiménez, J. C., and Rao, I. M. (2014b). Waterlogging induced changes in root architecture of germplasm accessions of the tropical forage grass Brachiaria humidicola. AoB Plants 6, lu017. doi: 10.1093/aobpla/plu017
Cardoso, J. A., Jiménez, J. C., Rincón, J. D., Guevara, E., Van Der Hoek, R., Jarvis, A., et al. (2013). Advances in improving tolerance to waterlogging in Brachiaria grasses. Trop. Grass. 1, 197–201. doi: 10.17138/TGFT(1)197-201
Colmer, T. D. (2003). Long-distance transport of gases in plants: a perspective on internal aeration and radial oxygen loss from roots. Plant Cell Environ. 26, 17–36. doi: 10.1046/j.1365-3040.2003.00846.x
Colmer, T. D., and Voesenek, L. A. C. J. (2009). Flooding tolerance: suites of plant traits in variable Environments. Funct. Plant Biol. 36, 665–681. doi: 10.1071/FP09144
Comar, A., Burger, P., de Solan, B., Baret, F., Daumard, F., and Hanocq, J. (2012). A semi-automatic system for high throughput phenotyping wheat cultivars in-field conditions: description and first results. Funct. Plant Biol. 39, 914–924. doi: 10.1071/FP12065
Deery, D., Jimenez-Berni, J., Jones, H., Sirault, X., and Furbank, R. (2014). Proximal remote sensing buggies and potential applications for field-based phenotyping. Agronomy 5, 349–379. doi: 10.3390/agronomy4030349
Di Bella, C. M., Paruelo, J. M., Becerra, J. E., Bacour, C., and Baret, F. (2004). Effect of senescent leaves on NDVI-based estimates of fAPAR: experimental and modelling evidences. Int. J. Remote Sens. 25, 5415–5427. doi: 10.1080/01431160412331269724
Dias-Filho, M. B. (2002). Tolerance to flooding in five Brachiaria brizantha accessions. Pesqui. Agropecu. Bras. 37, 439–447. doi: 10.1590/S0100-204X2002000400003
Dias-Filho, M. B. (2006). Opções Forrageiras Para Áreas Sujeitas ao Encharcamento ou Alagamento Temporário. Belém: Embrapa Amazônia Oriental.
Fanourakis, D., Briese, C., Max, J. F. J., Kleinen, S., Putz, A., Fiorani, F., et al. (2014). Rapid determination of leaf area and plant height by using light curtain arrays in four species with contrasting shoot architecture. Plant Methods 10, 1–11. doi: 10.1186/1746-4811-10-9
Furbank, R. T., and Tester, M. (2011). Phenomics – technologies to relieve the phenotyping bottleneck. Trends Plant Sci. 16, 635–644. doi: 10.1016/j.tplants.2011.09.005
Ganguli, A. C., Vermeire, L. T., Mitchell, R. B., and Wallace, M. C. (2000). Comparison of four nondestructive techniques for estimating standing crop in sShortgrass plains. Agron. J. 92, 1211–1215. doi: 10.2134/agronj2000.9261211x
Golzarian, M. R., Frick, R. A., Rajendran, K., Berger, B., Roy, S., Tester, M., et al. (2011). Accurate inference of shoot biomass from high-throughput images of cereal plants. Plant Methods 7, 1–11. doi: 10.1186/1746-4811-7-2
Granier, C., Aguirrezabal, L., Chenu, K., Cookson, S. J., Dauzat, M., Hamard, P., et al. (2006). PHENOPSIS, an automated platform for reproducible phenotyping of plant responses to soil water deficit in Arabidopsis thaliana permitted the identification of an accession with low sensitivity to soil water deficit. New Phytol. 169, 623–635. doi: 10.1111/j.1469-8137.2005.01609.x
Hairmansis, A., Berger, B., Tester, M., and Roy, S. J. (2014). Image-based phenotyping for non-destructive screening of different salinity tolerance traits in rice. Rice 7, 16. doi: 10.1186/s12284-014-0016-3
Harmoney, K. R., Moore, K. J., George, J. R., Brummer, E. C., and Russell, J. R. (1997). Determination of pasture biomass using four indirect methods. Agron. J. 89, 665–672. doi: 10.2134/agronj1997.00021962008900040020x
Hartmann, A., Czauderna, T., Hoffmann, R., Stein, N., and Schreiber, F. (2011). HTPheno: an image analysis pipeline for high-throughput plant phenotyping. BMC Bioinformatics 12:148. doi: 10.1186/1471-2105-12-148
Hirabayashi, Y., Mahendran, R., Koirala, S., Konoshima, L., Yamazaki, D., Watanabe, S., et al. (2013). Global flood risk under climate change. Nat. Clim. Change 3, 816–821. doi: 10.1038/nclimate1911
Humplík, J. F., Lazár, D., Fürst, T., Husièková, A., Hbl, M., and Spíchal, L. (2015a). Automated integrative high-throughput phenotyping of plant shoots: a case study of the cold-tolerance of pea (Pisum sativum L.). Plant Methods 11, 2–11. doi: 10.1186/s13007-015-0063-9
Humplík, J. F., Lazár, D., Husièková, A., and Spíchal, L. (2015b). Automated phenotyping of plant shoots using imaging methods for analysis of plant stress responses–a review. Plant Methods 11, 1–10. doi: 10.1186/s13007-015-0072-8
Jackson, M. B., and Drew, M. C. (1984). “Effects of flooding on growth and metabolism of herbaceous plants,” in Flooding and Plant Growth, ed. T. T. Kozlowsky (Orlando, FL: Academic Press), 47–128.
Joalland, S., Screpanti, C., Gaume, A., and Walter, A. (2016). Belowground biomass accumulation assessed by digital image based leaf area detection. Plant Soil 398, 257–266. doi: 10.1007/s11104-015-2660-9
Koppitz, H. (2004). Effects of flooding on the amino acid and carbohydrate patterns of Phragmites australis. Limnologica 34, 37–47. doi: 10.1016/S0075-9511(04)80020-3
Lan, Y., Zhang, H., Lacey, R., Hoffmann, W. V., and Wu, W. (2009). Development of an Integrated Sensor and Instrumentation System for Measuring Crop Conditions. Technical Report Agricultural Engineering International: The CIGR Ejournal. Manuscript IT 08 1115. Vol. XI. Beijing: PKP Publishing Services.
Liu, Y. Z., Tang, B., Zheng, Y. L., Ma, K. J., Xu, S. Z., and Qiu, F. Z. (2010). Screening methods for waterlogging tolerance at maize (Zea mays L.) seedling stage. Agric. Sci. China 9, 362–369. doi: 10.1016/S1671-2927(09)60105-X
Lootens, P., Ruttink, T., Rohde, A., Combes, D., Barre, P., and Roldan-Ruiz, I. (2016). High-throughput phenotyping of lateral expansion and regrowth of spaced Lolium perenne plants using on-field image analysis. Plant Methods 12, 32. doi: 10.1186/s13007-016-0132-8
Lopes, M. S., and Reynolds, M. P. (2012). Stay-green in spring wheat can be determined by spectral reflectance measurements (normalized difference vegetation index) independently from phenology. J. Exp. Bot. 63, 3789–3798. doi: 10.1093/jxb/ers071
Malik, A. I., Ailewe, T. I., and Erskine, W. (2015). Tolerance of three grain legume species to transient waterlogging. AoB Plants 7, 1–11. doi: 10.1093/aobpla/plv040
McCarthy, C., Hancock, N., and Raine, S. (2010). Apparatus and infield evaluations of a prototype machine vision system for cotton plant internode length measurement. J. Cotton Sci. 14, 221–232.
Miles, J. W. (2007). Apomixis for cultivar development in tropical forage grasses. Crop Sci. 47, 5238–5249. doi: 10.2135/cropsci2007.04.0016IPBS
Montes, J. M., Melchinger, A. E., and Reif, J. C. (2007). Novel throughput phenotyping platforms in plant genetic studies. Trends Plant Sci. 12, 433–436. doi: 10.1016/j.tplants.2007.08.006
Payero, J. O., Neale, C. M. U., and Wright, J. L. (2004). Comparison of eleven vegetation indices for estimating plant height of alfalfa and grass. Appl. Eng. Agric. 20, 385–393. doi: 10.13031/2013.16057
Pittman, J. J., Arnall, D. B., Interrante, S. M., Moffet, C. A., and Butler, T. J. (2015). Estimation of biomass and canopy height in bermudagrass, alfalfa, and wheat using ultrasonic, laser, and spectral sensors. Sensors 15, 2920–2943. doi: 10.3390/s150202920
Polko, J. K., Voesenek, L. A. C. J., Peeters, A. J. M., and Pierik, R. (2011). Petiole hyponasty: an ethylene-driven, adaptive response to changes in the environment. AoB Plants 2011, lr031. doi: 10.1093/aobpla/plr031
Ponnamperuma, F. N. (1972). The chemistry of submerged soils. Advan. Agron. 24, 29–96. doi: 10.1016/S0065-2113(08)60633-1
Rajendran, K., Tester, M., and Roy, S. T. (2009). Quantifying the three main components of salinity tolerance in cereals. Plant Cell Environ. 32, 237–249. doi: 10.1111/j.1365-3040.2008.01916.x
Rao, I. M. (2014). “Advances in improving adaptation of common bean and Brachiaria forage grasses to abiotic stresses in the tropics,” in Handbook of Plant and Crop Physiology, ed. M. Pessarakli (Boca Raton, FL: CRC Press), 847–889.
Rivas, L., and Holmann, F. (2004). Impacto de la Adopción de Nuevos Híbridos de Brachiarias Resistentes al Salivazo en Colombia, México y Centroamérica. Cali: Centro Internacional de Agricultura Tropical (CIAT), 28.
Rundquist, D., Perk, R., Leavitt, B., Keydan, G., and Gitelson, A. (2004). Collecting spectral data over cropland vegetation using machine-positioning versus hand-positioning of the sensor. Comput. Electron. Agric. 43, 173–178. doi: 10.1016/j.compag.2003.11.002
Schaefer, M. T., and Lamb, D. W. (2016). A combination of plant NDVI and LiDAR measurements improve the estimation of pasture biomass in tall fescue (Festuca arundinacea var. Fletcher). Remote Sens. 8, 109. doi: 10.3390/rs8020109
Scotford, I. M., and Miller, P. C. H. (2004). Combination of spectral reflectance and ultrasonic sensing to monitor the growth of winter wheat. Biosyst. Eng. 87, 27–38. doi: 10.1016/j.biosystemseng.2003.09.009
Tackenberg, O. (2007). A new method for non-destructive measurement of biomass, growth rates, vertical biomass distribution and dry matter content based on digital image analysis. Ann. Bot. 99, 777–783. doi: 10.1093/aob/mcm009
Tessmer, O. L., Jiao, Y., Cruz, J. A., Kramer, D. M., and Chen, J. (2013). Functional approach to high-throughput plant growth analysis. BMC Syst. Biol. 7:S17. doi: 10.1186/1752-0509-7-S6-S17
Unger, I. M., Kennedy, A. C., and Muzika, R. M. (2009). Flooding effects on soil microbial communities. Appl. Soil Ecol. 42, 1–8. doi: 10.1016/j.apsoil.2009.01.007
Verhulst, N., and Govaerts, B. (2010). The Normalized Difference Vegetation Index (NDVI) GreenSeekerTM Handheld Sensor: Toward the Integrated Evaluation of Crop Management. Part A: Concepts and Case Studies. Mexico: CIMMYT.
Walter, A., Scharr, H., Gilmer, F., Zierer, R., Nagel, K. A., Ernst, M., et al. (2007). Dynamics of seedling growth acclimation towards altered light conditions can be quantified via GROWSCREEN: a setup and procedure designed for rapid optical phenotyping of different plant species. New Phytol. 174, 447–455. doi: 10.1111/j.1469-8137.2007.02002.x
Walter, A., Studer, B., and Kölliker, R. (2012). Advanced phenotyping offers opportunities for improved breeding of forage and turf species. Ann. Bot 110, 1271–1279. doi: 10.1093/aob/mcs026
White, J. W., Andrade-Sanchez, P., Gore, M. A., Bronson, K. F., Coffelt, T. A., Conley, M. M., et al. (2012). Field-based phenomics for plant genetics research. Field Crop Res. 133, 101–112. doi: 10.1016/j.fcr.2012.04.003
Keywords: image analysis, image segmentation, NDVI, tropical grasses, soil flooding
Citation: Jiménez JdlC, Cardoso JA, Leiva LF, Gil J, Forero MG, Worthington ML, Miles JW and Rao IM (2017) Non-destructive Phenotyping to Identify Brachiaria Hybrids Tolerant to Waterlogging Stress under Field Conditions. Front. Plant Sci. 8:167. doi: 10.3389/fpls.2017.00167
Received: 28 July 2016; Accepted: 26 January 2017;
Published: 13 February 2017.
Edited by:
Carl-Otto Ottosen, Aarhus University, DenmarkReviewed by:
Panagiotis Kalaitzis, Mediterranean Agronomic Institute of Chania, GreeceFulai Liu, University of Copenhagen, Denmark
Copyright © 2017 Jiménez, Cardoso, Leiva, Gil, Forero, Worthington, Miles and Rao. This is an open-access article distributed under the terms of the Creative Commons Attribution License (CC BY). The use, distribution or reproduction in other forums is permitted, provided the original author(s) or licensor are credited and that the original publication in this journal is cited, in accordance with accepted academic practice. No use, distribution or reproduction is permitted which does not comply with these terms.
*Correspondence: Juan de la Cruz Jiménez, juan.jimenezserna@research.uwa. edu.au
†These authors have contributed equally to this work.