 Mirko Pavicic1,2
 Katriina Mouhu1,2
 Feng Wang1,2
 Marcelina Bilicka1,2
 Erik Chovanček1
 Kristiina Himanen1,2*
- 1Department of Agricultural Sciences, University of Helsinki, Helsinki, Finland
- 2Viikki Plant Science Centre, University of Helsinki, Helsinki, Finland
Flowering time control integrates endogenous as well as environmental signals to promote flower development. The pathways and molecular networks involved are complex and integrate many modes of signal transduction. In plants ubiquitin mediated protein degradation pathway has been proposed to be as important mode of signaling as phosphorylation and transcription. To systematically study the role of ubiquitin signaling in the molecular regulation of flowering we have taken a genomic approach to identify flower related Ubiquitin Proteasome System components. As a large and versatile gene family the RING type ubiquitin E3 ligases were chosen as targets of the genomic screen. The complete list of Arabidopsis RING E3 ligases were retrieved and verified in the Arabidopsis genome v11 and their differential expression was used for their categorization into flower organs or developmental stages. Known regulators of flowering time or floral organ development were identified in these categories through literature search and representative mutants for each category were purchased for functional characterization by growth and morphological phenotyping. To this end, a workflow was developed for high throughput phenotypic screening of growth, morphology and flowering of nearly a thousand Arabidopsis plants in one experimental round.
Introduction
Flowering time control is a complex network that integrates many modes of signal transduction promoting transition from vegetative stage to reproduction and ultimately leading to the development of flower organs. The endogenous changes that signal the beginning of flowering are referred as autonomous pathways (Amasino and Michaels, 2010). Multiple studies have established the major role that photoperiod has in flowering (Piñeiro and Jarillo, 2013). Flowering in Arabidopsis is strongly promoted in long day (LD) conditions but will also ultimately occur under short day (SD) conditions (Steffen et al., 2014). Under LDs, flower induction is dependent on the expression and protein levels of CONSTANS (CO; Suárez-López et al., 2001). Light controls the CO transcription via the circadian clock system, inducing a CO mRNA peak during the latter part of the day (Suárez-López et al., 2001). CO transcription is repressed by CYCLING DOF FACTORs (CDFs; Fornara et al., 2009). Under LDs, the CO mRNA afternoon peak coincides with a blue-light activated complex containing FLAVIN-BINDING, KELCH REPEAT, F-BOX 1 (FKF1) and GIGANTEA (GI), which lead CO transcription repressors CDFs to degradation (Sawa et al., 2007; Fornara et al., 2009; Song et al., 2012). Additionally, the FKF1-GI complex also stabilizes CO protein in the afternoon (Sawa et al., 2007; Song et al., 2012). CO protein degradation is promoted by at least two ubiquitin E3 ligases: HIGH EXPRESSION OF OSMOTICALLY RESPONSIVE GENES 1 (HOS1) and CONSTITUTIVE PHOTOMORPHOGENIC 1 (COP1; Jang et al., 2008; Lazaro et al., 2012). In the morning, red light promotes HOS1 interaction with CO via phytochrome B activation (Lazaro et al., 2012). COP1 mediates CO protein degradation in a complex with SUPPRESSOR OF PHYA-105 (SPA; Laubinger et al., 2006). In the afternoon, blue light inhibits COP1-SPA-mediated CO degradation by activating CRYPTOCHROME 2 (CRY2) interaction with COP1 (Liu et al., 2008). Thus, both CO transcription is up-regulated and CO protein stabilized allowing up-regulation of the mobile flowering signal gene FLOWERING LOCUS T (FT) expression in the phloem during the afternoon under LDs, but not under SDs (Piñeiro and Jarillo, 2013). Also regulation of flower development is likely to involve Ubiquitin Proteasome System (UPS) components (Vierstra, 2009).
The UPS has emerged as a powerful regulatory mechanism that facilitates irreversible transitions between developmental stages, and responses to environmental stimuli by selectively degrading short-lived regulators, such as transcription factors and receptors (Sadanandom et al., 2012). Genetic analyses in plants have proposed that this pathway plays a vital role in hormone regulation, floral homeostasis, stress responses and pathogen defense; however, very few targets have been identified in plants apart from the hormone signaling components (Santner and Estelle, 2010). In the UPS system, the highly conserved 76-amino acid protein, ubiquitin, acts as a covalent molecular tag to signal target proteins for proteasome mediated degradation. Ubiquitin attachment requires three distinct enzymatic activities: E1, ubiquitin activating enzymes; E2, ubiquitin conjugating enzymes; and E3, ubiquitin ligase enzymes. Moreover, the UPS consists of accompanying proteins that modulate target recognition and degradation (such as RAD23, SPA1), deubiquitinating enzymes (DUB1) and the proteasome (26S and 20S structures). According Vierstra (2009) over 6% of the Arabidopsis proteome is potentially involved in UPS. However, the common strategy for functionally addressing the role of all UPS components is still evolving. The ubiquitin E3 ligases are the most abundant UPS components and mediate the important recognition of the target proteins for ubiquitination (Kosarev et al., 2002; Stone et al., 2005). The E3 ligases found in plants belong to one of four subtypes: single subunit Homology to E6-AP C-Terminus (HECT), U-box and Really Interesting New Gene (RING) or multisubunit cullin-RING ligases (Sadanandom et al., 2012). The RING-type E3 proteins are the most abundant among the single subunit E3 ligases (Kosarev et al., 2002; Stone et al., 2005).
To unravel the role of the RING type ubiquitin E3 ligase protein family, we took a reverse-genetics approach to identify the RING E3 ligases that could be involved in regulation of Arabidopsis flowering time and/or flower development. To this end, we first curated the RING E3 protein family, earlier described by Stone et al. (2005), in the most recent Arabidopsis genome release. The Arabidopsis protein sequences were subjected to InterProScan for protein domain search and the number of ubiquitin E3 ligases containing RING domains was established to be 509. Association of these RING protein encoding genes with Arabidopsis flowering and floral organs was done through the Genevestigator transcriptome database (Hruz et al., 2008). To this end, the expression profiles were divided into categories based on their specificity, high expression or enrichment in flower organs and in the developmental stages of Arabidopsis. Several already characterized regulators were identified among these genes, such as the anther dehiscence regulating DAF gene family (Peng et al., 2013), flower size regulating DA2 (Xia et al., 2013) and FRG1 involved in flowering time related DNA methylation (Groth et al., 2014). The well-established flowering time regulator COP1 fell just below the cut off criteria due to its wide expression profile. A representative mutant collection for each category was obtained from NASC stock center. Additional candidates were also selected based on literature. The genotypically verified mutant collection was subjected to systematic morphological and growth analysis using an automated imaging based plant phenotyping facility. After the thorough vegetative assessment, the flowering time parameters such as number of leaves at bolting and days to bolting were recorded together with morphological analysis of the flower structures. The phenotypic assessment indicated lines with altered growth, morphology, or flowering time. Furthermore, one of the lines showed growth defects in sepals and petals.
Materials and Methods
Bioinformatic Screens
To curate putative RING-type ubiquitin E3 ligases in Arabidopsis thaliana genome version ARA11, classification made by Kosarev et al. (2002) and Stone et al. (2005) were used. To this end, the whole Arabidopsis proteome was downloaded from ARAPORT (https://www.araport.org/downloads/), and screened with InterProScan for protein families and domain architecture. To confirm that the newly identified RING domain containing protein sequences indeed represented ubiquitin E3 ligase type RING domains, InterProScan 5 (v5.16-55.0) Gene3D, SUPERFAMILY, ProSiteProfiles, SMART, Pfam, and ProSitePatterns signatures were used. Most of InterProScan tools use Hidden Markov Models (HMMs) to detect conserved domains along protein sequences. HMMs have been developed for conserved protein domains and they define for the software, which and where critical residues should be located along the analyzed protein sequence. From the protein domain collection, the ubiquitin E3 ligase type RING domains were filtered according to the criteria provided by Kosarev et al. (2002) and Stone et al. (2005) for canonical RING domains. Once the RING domains were identified, they were aligned with Jalview using ProbCons algorithm with two rounds of pre-training. The metal ligand binding residues were manually inspected and corrected, and small misalignments were edited. Sequences that failed to meet the criteria of InterProScan search engines were not considered in this study.
Transcriptomic Database Screens
To associate the curated collection of 509 RING type ubiquitin E3 ligases with flowering the Genevestigator gene expression database software was used (Hruz et al., 2008). The experiments AT-00087, AT-00088, AT-00089, and AT-00090 containing developmental expression data of AtGenExpress initiative microarrays were selected for the analysis (Schmid et al., 2005). In the selected experiments, hybridization probes were available for 393 RING E3 genes out of the 509. From these experiments, the linear expression data was extracted for the developmental stages of developed rosette, bolting, young flower, developed flower, and flower and silique. For flower organs, the gene expression profiles were extracted for categories of shoot apical meristem (SAM), sepal, petal, stamen, and carpels. In these categories, genes were ranked for their at least 2-fold differential expression against the developed rosette. Their relative expression levels were obtained by log2(FC) = log2(FL) − log2(R), where FC is fold of change, FL is flower organ or development stage and R is rosette. The results for each category were sorted by their log2(FC) and all genes with log2(FC) > 1 were considered as up-regulated.
Candidate Genes Selected by Literature
For the candidate approach, we used interaction networks from BioGRID (http://thebiogrid.org/) and cross-checked them with flowering pathway genes listed in the Flowering Interactive Database FLOR-ID (Bouché et al., 2016) to identify RING E3 ligases interacting with known flowering time regulators CONSTANS (CO), CONSTITUTIVE PHOTOMORPHOGENIC 1 (COP1), and TARGET OF EARLY ACTIVATION TAGGED (EAT) 2 (TOE2).
Plant Material and Growth Conditions
For functional characterization of the identified top most differentially expressed genes and for the selected candidates, Arabidopsis mutant lines were obtained from the NASC stock center representing CATMA, SAIL, SALK, and GABI-Kat collections (Alonso et al., 2003; Rosso et al., 2003; Schmid et al., 2005; Kleinboelting et al., 2012). Altogether 49 lines were genotyped by combination of segregation analysis and T-DNA PCR with primers listed in Supplemental Table 1. From these, 43 lines represented 30 unique gene accessions (Supplemental Table 1). As a wild type control, Columbia (Col-0) ecotype of Arabidopsis thaliana was used.
For genotyping, plants were grown in vitro on MS media supplemented with the corresponding selection. For phenotyping, seeds were sown directly on soil with 50% peat and 50% vermiculite. Trays were covered with plastic wrap and cold stratified at +4 °C for three nights, after which they were transferred to the growth chamber (FytoScope, PSI, Czech Rep.). Seven days after stratification (DAS) the seedlings were transferred to their own pots, placed on the analysis trays and sand was added on top of the peat to prevent growth of any green algae. From the full water saturation of the soil, the water content was let to decrease until 70% and was kept at this level through daily weighing and watering. Growth conditions in the Arabidopsis growth chambers were 16 h light/8 h darkness and 22 °C. Relative air humidity of the growth chambers was targeted at 60%. The light intensity was set and controlled at 130 μE (MS6610, Mastech, China).
Genotyping of the Mutant Lines
Homozygous one locus mutant lines were confirmed by segregation analysis and T-DNA specific PCRs. The PCR primers, T-DNA position and line information were summarized in Supplemental Table 1. The transcript levels of the T-DNA targeted genes were verified by quantitative real-time PCR (qPCR) analysis. The sample material for qPCR was harvested from the tissue indicated by Arabidopsis eFP Browser for each gene expression pattern: if the gene expression pattern indicated at least moderate expression in flower parts during floral development, tips of inflorescences with developing and open flowers were pooled from three to five individual plants. If the expression was in the seeds, young to mature siliques were pooled. If no expression data via eFP was found, new leaves were pooled with developing and open flowers. Three to four biological replications were harvested for each RNA preparation. RNA was extracted using InviTrap® Spin Plant RNA Kit (STRATEC Molecular), complementary DNA was prepared with SuperScript® IV Reverse Transcriptase (Thermo Fisher Scientific), and the qPCRs were performed using Roche Lightcycler® 480 Instrument II (Roche Diagnostics) using LightCycler® 480 SYBR Green I Master (Roche Diagnostics) with primers listed in Supplemental Table 1. Primers were primarily designed to locus downstream of the T-DNA. The fold up values (mutant line against Col-0) were calculated using the 2−ΔΔCT method according to Livak and Schmittgen (2001). Reference genes used in this study were the most stable Arabidopsis genes according to Czechowski et al. (2005): TIP41 LIKE (AT4G34270, forward: GTGAAAACTGTTGGAGAGAAGCAA, reverse: TCAACTGGATACCCTTT∧CGCA), AP2M (AT5G46630, forward: TTGAAAATTGGAGTACCGTACCAA, reverse: TCCCTCGTATACATCTGGCCA) and PTB1 (AT3G01150, forward: TTGAAGGAGTGGAATCTCACG, reverse: ATGTGCGGAAAGCAGATACC). Significance level of the qPCR were set at 0.1–0.5 FC for knock-down; <0.1 FC for knock-out; and >2 FC for up-regulated (Supplemental Table 1).
High Throughput Plant Phenotyping Platform
The plant phenotyping facility at the University of Helsinki Viikki campus (http://blogs.helsinki.fi/nappi-blog/) was used for the phenotypic characterization of the selected Arabidopsis mutant collection. The plants were imaged daily by overhead CCD camera for RGB images positioned in a PlantScreen™ analysis chamber with automated plant transportation between the imaging, weighing and watering stations. The RGB images were obtained for 20 plants at the time and stored in central database. The images were pre-processed online as described in Awlia et al. (2016) to allow collecting binary and RGB data for each plant. The obtained binary images were used for calculating growth parameters of area and perimeter. The obtained parameters of area, perimeter and the convex hull were then used for automatic online calculations of morphometric rosette parameters including: roundness1, roundness2, isotropy, eccentricity, compactness, Rotational Mass Symmetry (RMS), and Slenderness of Leaves (SOL) (PlantScreen™ analyzer, PSI, Czech R.). To characterize the general morphology of the mutant lines these nine morphological parameters were grouped into four categories based on their type: raw, circularity, symmetry and center distance, and compared over time (Figure 1). Raw parameters were represented by area and perimeter of the rosette and they were calculated by counting pixels of a rosette picture and the edge pixels respectively and transformed to millimeters (Figure 1A). The parameters of roundness1 and roundness2 and isotropy represented the circular parameters (Figure 1B). The parameter roundness describes rosette area in comparison to perfect circle with same perimeter and is affected by leaf slenderness, petiole length and leaf perimeter. For wild type plant, this parameter usually takes values between 0.1 and 0.5 while a perfect circle has value 1. Roundness value tends to decay overtime due to leaf development that at the same time increases the rosette perimeter. Roundness 2 uses rosette convex hull area and perimeter for its computation and for wild type plants this parameter appears to have values between 0.7 and 1.0 following an oscillating pattern with less steep peaks over time (Figure 1B). Isotropy uses the area of a drawn polygon on top of the rosette (Figure 1B). Thus, isotropy has a behavior similar to roundness 2 over time, but with less steep peaks and decreasing tendency similar to roundness. The eccentricity and RMS were symmetric parameters (Figure 1C). Eccentricity describes how elliptical the plant rosette is, where a value close to 1 corresponds to a rosette with highly sharp elliptical shape, while a value close to 0 describes a circular shape. Wild type rosette shows a high eccentricity peak that decays over time with a second smaller peak by the end of growth, thus the rosette shape fluctuates between a round and an elliptical shape. On the other hand, RMS describes the symmetry of the plant rosette by making a ratio between the non-overlapping rosette convex hull area and a perfect circle of the same area centered in the plant centroid and the overlapping area of both. RMS shows a similar pattern as eccentricity, but with higher absolute values and a sharper peak. Compactness and SOL were based on the center distance (Figure 1D). Compactness is the ratio between the rosette area and the rosette convex hull area. This parameter tells about petiole length and leaf blade width. The parameter SOL explains how sharp the leaf blades are, but it is also affected by the leaf number. SOL was derived from the ratio between squared rosette skeleton and rosette area. Thus, SOL can take values greater than 0 and below 50 in dimensionless units for wild type plants (Figure 1D).
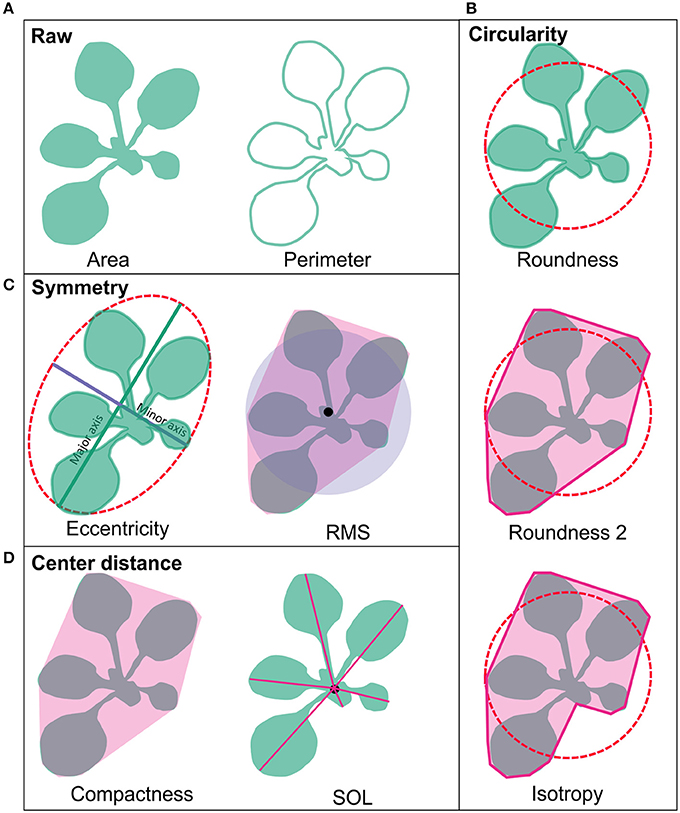
Figure 1. Rosette morphology parameters. (A) Area and perimeter of the rosette are raw parameters and are calculated by counting pixels of rosette binary images and the edge pixels respectively and transformed to millimeters. (B) The parameters of roundness and roundness 2 and isotropy represented circular parameters. (C) Eccentricity and RMS were symmetric parameters. (D) Compactness and SOL were based on the center distance. Pink area around RMS, compactness and roundness 2 represent rosette convex hull, and for isotropy it represents rosette polygon. The characteristics of the parameters are described in detail in the Section Materials and Methods.
Experimental Design
Ten days old (10 DAS) Arabidopsis plants were subjected to growth and morphological characterization by top view imaging for the following 10 days. One phenotyping round was designed to accommodate a maximum of 960 Arabidopsis plants representing 36 genotypes at a time in six consecutive experimental rounds called F006–F011. The total number of lines analyzed throughout the six rounds was 43. The maximum of 36 genotypes were divided in three batches that were rotating between the growth area and the PlantScreen™ analysis chamber. Each batch consisted of three experimental units of four mutant genotypes randomized with Col-0, each represented by 20 individual plants. One experiment consisted thus of five trays of altogether 100 plants. Each experimental unit had their own Col-0 wild type in randomized block design to normalize for any local differences in the microenvironments of the PlantScreen™ or the growth area. Each line showing any phenotypic responses was analyzed in at least three independent experimental rounds. Lines that did not show differences as compared to the Col-0 wild type were excluded from the subsequent rounds thus resulting in reduced numbers of genotypes included.
Phenotypic Analysis of Flowering Time and Flower Structures
After the image based growth and morphological measurements of the 20 mutant and 20 Col-0 plants in the PlantScreen™ system, the flowering time parameters leaf numbers at bolting (LAB) and days to bolting (DTB), were manually counted for each of the plant individuals. The number of rosette leaves were counted at the appearance of the flower bud (developmental stage 5.10, Boyes et al., 2001) and the DTB was recorded at the same time. The flowering time phenotypes were observed in two to three independent experimental rounds. Finally, flowers of the main inflorescences were photographed and further dissected for floral organ analysis under stereomicroscope (SteREO Discovery.V20, Zeiss). Microscopic pictures of the inflorescence tips, single flowers, sepals and petals were taken with the attached camera (AxioCam ICc3, Zeiss). The analyzed inflorescences and flowers originated from several independent experiments. Flower developmental stages were determined as in Smyth et al. (1990). To confirm pollen viability pollen grain staining according to the modified Alexander method was performed (Peterson et al., 2010). Anther images were captured using Leica DFC420 C camera attached to an optical microscope.
Statistical Analysis
The significance of the differences between mutant lines and Col-0 was computed by contrasting two fitted models to the data points using several order polynomials (Mirman, 2014). First, a model was fitted to all data points and then a second model was fitted including the factor genotype (wild type and mutant). These two models were then compared using the Chi square test to determine if the second model explained more variance than the first one beyond the significance (α = 0.05). If the second model was statistically different from the first one, it implied that the compared genotypes were different. These statistical analyses were conducted in R software (https://www.r-project.org/). LAB and DTB analysis were performed by Analysis of Variance using GLM procedure and pairwise comparisons against Col-0 using option Dunnett in the MEANS statement using SAS/STAT© software version 9.4 (SAS Institute Inc., Cary, NC, USA).
Results
Curation of the Arabidopsis RING-Type Ubiquitin E3 Ligase Protein Sequences
To re-confirm the published RING-type ubiquitin E3 ligase proteins encoded in Arabidopsis genome the 27,667 Arabidopsis proteins from the latest genome annotation release (ARA11) were scanned for RING domains. Through filtering the signatures in Gene3D, SUPERFAMILY, ProSiteProfiles, SMART, Pfam, ProSitePatterns altogether 509 putative RING domain containing protein sequences were obtained (Supplemental Table 2). RING gene names and descriptions were obtained from Araport using Thalemine tool (Supplemental Table 2). Araport used curated but also automatic gene annotation, therefore many RING domain containing proteins were annotated as RING/U-box protein although they did not contain U-box domain. Similarly, some were annotated as RING/FYVE/PHD zinc finger superfamily proteins. The 509 RING sequences were compared to the previously described RING-type protein sequences (Kosarev et al., 2002; Stone et al., 2005). From the 509 identified RING domain proteins 457 matched with the 490 previously described, thus resulting in 31 non-matching sequences (Figure 2). These non-matching sequences were thoroughly analyzed and, 6 of them were found to be merged with other gene models, 10 had no RING domain, 3 were not found in the database, 3 corresponded to pseudogenes, 7 were split and a new locus identifier had been assigned for them, and 2 were transposable elements (Supplemental Table 3A). The 50 additionally identified RING domain proteins were shown to represent diverse RING domains such as, 1 of D type, 4 of C2 type, 20 of H2, 16 of HC, 2 of S/T, and 7 of V (CH) type, according to the Stone et al. (2005) classification (Supplemental Table 2).
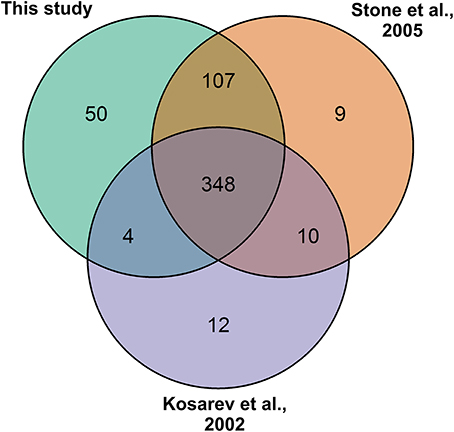
Figure 2. RING gene family of 509 as identified by: this study (Kosarev et al., 2002; Stone et al., 2005). This study brought in 50 new RING genes and 31 from the earlier studies were excluded.
Differential Gene Expression Data Identifies 122 Flower Related RING Ubiquitin E3 ligases
To associate the RING domain proteins with flowering or flower development two approaches were followed: (1) identifying those with gene expression enhanced or enriched during flower development or in flower organs, and (2) by searching RING proteins interacting with known flower regulators. For the first approach Genevestigator (Hruz et al., 2008) tool was used to rank differentially expressed genes (DEG) of the identified RING genes over Arabidopsis developmental stages and in flower organs relative to their expression in developed rosette (Figures 3A,B). In the selected experiments in Genevestigator database, probes were available for 393 of the 509 RING E3 ligases analyzed. The cut off for DEGs was set at 2-fold to be included in the selection resulting in lists of genes of interest for each of the categories. This process was repeated to identify gene expression enrichment at each of the development stages of bolting, young flower, developed flower, and flower and siliques. For the developmental categories altogether 71 DEGs were identified (Figure 3C). In addition to the developmental stages, enrichment for shoot apical meristem, sepal, petal, stamen and pistil organs were retrieved and resulted in 109 DEGs (Figure 3D). Some of the RING genes were common between these two categories and in total 122 unique RING genes were up-regulated in the flower related processes. The gene identifying AGI codes of these 122 flower related candidates are provided in the Supplemental Table 3B.
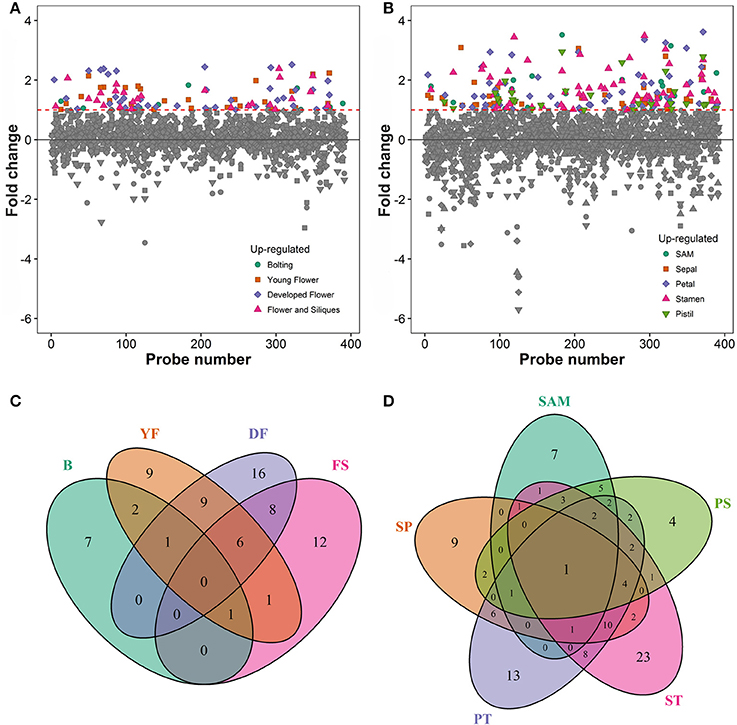
Figure 3. (A) Differential expression profiles of developmental stage enriched RING genes relative to developed rosette. (B) Differential expression profiles of flower organ enriched RING genes relative to rosette; SAM, Shoot apical meristem. (C) Venn diagram of RING genes expressed in the different developmental stages (B, bolting; YF, Young flower; DF, Developed flower; FS, Flowers and siliques). (D) Venn diagram of RING genes expressed in the different flower organs; SAM, Shoot apical meristem; SP, Sepal; PT, Petal; ST, stamen; PS, pistil.
For the second approach we identified 6 additional genes of interest through literature study and from interaction networks of CO, COP1, and TOE2 from BioGRID (http://thebiogrid.org/). Based on these interaction screens 5 RING E3 ligases were selected to the study, represented by the following mutant lines; N656705 (AT5G65683), N686069 (AT1G61620), N372291 (AT3G29270), N2037522 and N67002 (AT4G17680), and N742646 (AT2G44410). In addition, a mutant line for COP1, cop1-6, and RED AND FAR-RED INSENSITIVE 2 (RFI2) for which a role in mediating red and far-red light signaling and ubiquitination activity has been shown in vitro, were included (Stone et al., 2005; Chen and Ni, 2006a). This E3 ligase was selected as a candidate since its expression is regulated by circadian clock and rfi2-1 mutant flowers early (Chen and Ni, 2006b). Thus, one mutant allele for RFI2 (N878610) was included in the study. Mutants representing these genes were analyzed together with the flower up-regulated RINGs and were named flower related UPS candidates in the Supplemental Table 1.
Representative Mutant Collection
For functional characterization of the 122 flower related UPS candidates and those selected based on literature, a mutant collection was obtained from the NASC stock center. The mutants represented lines from CATMA, SAIL, SALK, and GABI-Kat collections (Alonso et al., 2003; Rosso et al., 2003; Schmid et al., 2005; Kleinboelting et al., 2012). Altogether 43 lines were shown to contain T-DNA insertion in one locus, six were doubtful and were omitted from the analysis. To confirm that the T-DNA insertion had interrupted the gene of interest, their altered expression levels were confirmed by qPCR analysis with primers listed in Supplemental Table 1. For 43 accessions representing 30 unique loci from the 122 flower related UPS candidates and the selected candidates a differential gene expression pattern was analyzed. Altogether 19 lines were knock-outs, and 13 knock-down mutants, and for 10 lines up-regulation of the gene of interested was observed (Supplemental Table 1). For one line, no differential expression was confirmed and this was excluded from the phenotyping. For 14 lines alleles were available with similar or opposite gene expression patterns.
Phenotypic Screen of the Mutant Accessions
From the genotypically and qPCR confirmed T-DNA insertion mutant lines, 43 were subjected to phenotypic characterization by top view RGB imaging using the PlantScreen™ system. Image series of each analyzed line were collected daily allowing analyzing the growth and changes in morphology over time. For scoring those lines showing phenotypes, we fitted general additive models (GAM) to each parameter of each analyzed lines (data not shown). Most of the lines showed no differences to their corresponding Col-0 controls. However, three lines were consistently different across the experiments compared to Col-0 in both growth and rosette morphology: csu1-4 (cop1 suppressor 1-4, N686069), sinal7-2 (seven in absentia like 7-2, N833574) (Peralta et al., 2016) and rha1a-1 (ring-h2 finger a1a-1, N2045046) (Table 1, Supplemental Tables 1, 4). The csu1-4 mutant rosette was clearly smaller than Col-0 and showed a yellowish coloration (Figure 4). The mutant line rha1a-1 seemed to have smaller leaves than Col-0, however, at the end of growth it appeared to have more leaves that resulted in similar final rosette area as compared to Col-0. This line also had shorter petioles and leaf serration. The third line sinal7-2 rosette was clearly larger than Col-0 but did not show major differences in color, shape or number of leaves (Figure 4).
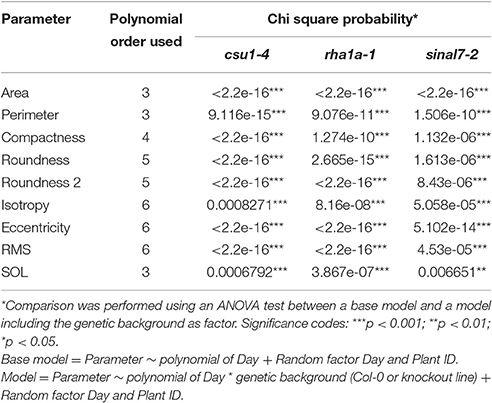
Table 1. Polynomial order and their respective Chi square probability from ANOVA test for each parameter used in this study.
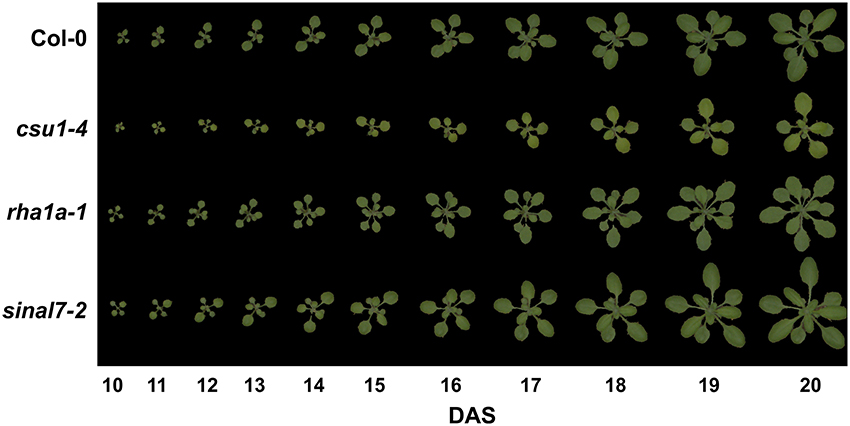
Figure 4. Rosette growth of csu1-4, rha1a-1 and sinal7-2 mutants. Representative rosette images are shown from days 10 to 20 after stratification. DAS, days after stratification.
To further analyze these three lines, mixed non-linear models were fitted to their data using several order polynomials for parametric analysis of the models. This analysis confirmed the earlier observations of significant changes in growth and development for these lines over time (Table 1). Line csu1-4 showed slower growth, reduced rosette area and perimeter compared to Col-0 along the complete measured period (Figures 5A,D). For line rha1a-1 the rosette area was very similar to Col-0 being, however, slightly but significantly larger over time probably due to its higher number of leaves (Figure 5B, Table 1). Although the differences between rha1a-1 and Col-0 were small the statistical model was able to capture those. Conversely, sinal7-2 showed both area and perimeter larger than Col-0 indicating more vigorous growth (Figures 5C,F).
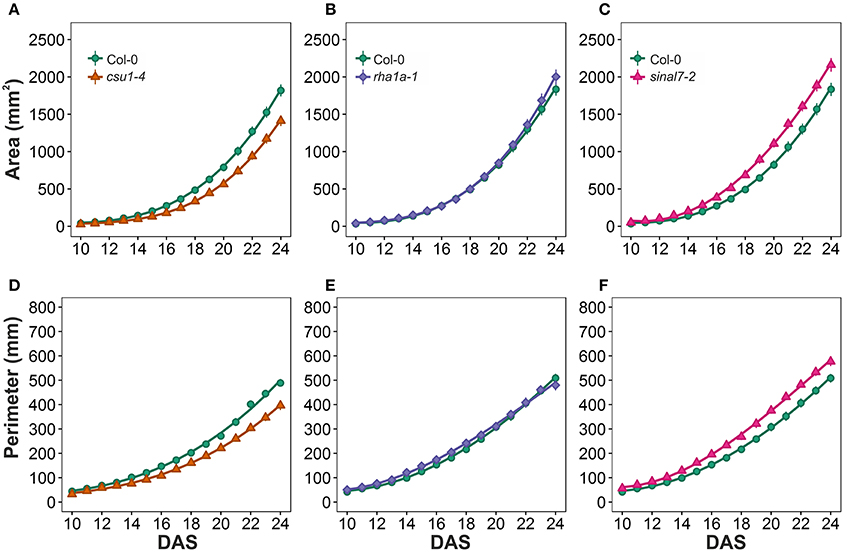
Figure 5. Growth measurements from day 10 to 20. Area (A) csu1-4, (B) rha1a-1, and (C) sinal7-2. Perimeter (D) csu1-4, (E) rha1a-1, and (F) sinal7-2. Markers, daily mean; error bars, 95% confidence interval; Curves, fitted models; n = 20 plants. The experiment was repeated at least 3 times with similar results. DAS, days after stratification.
Circularity Parameters
Morphological data for parameters of circularity that include roundness, roundness 2 and isotropy were also evaluated for these lines (Figure 1). Line csu1-4 showed increased roundness over the total period analyzed in comparison to Col-0 (Figures 6A–C, Table 1). However, csu1-4 roundness curve had similar pattern to Col-0 but shifted to the right (Figure 6A). Similar situation was observed for sinal7-2, where the roundness curve shape was almost identical to Col-0 but in this case was shifted to the left, showing lower roundness along the total time period (Figure 6C, Table 1). Roundness curve of rha1a-1 was neither shifted nor similar to Col-0 curve. This line showed a lower roundness than Col-0 at the beginning of the analysis, reaching a stabilization point around 16 DAS (Table 1). For Col-0 plants roundness continued decreasing until it become lower than rha1a-1 (Figure 6B).
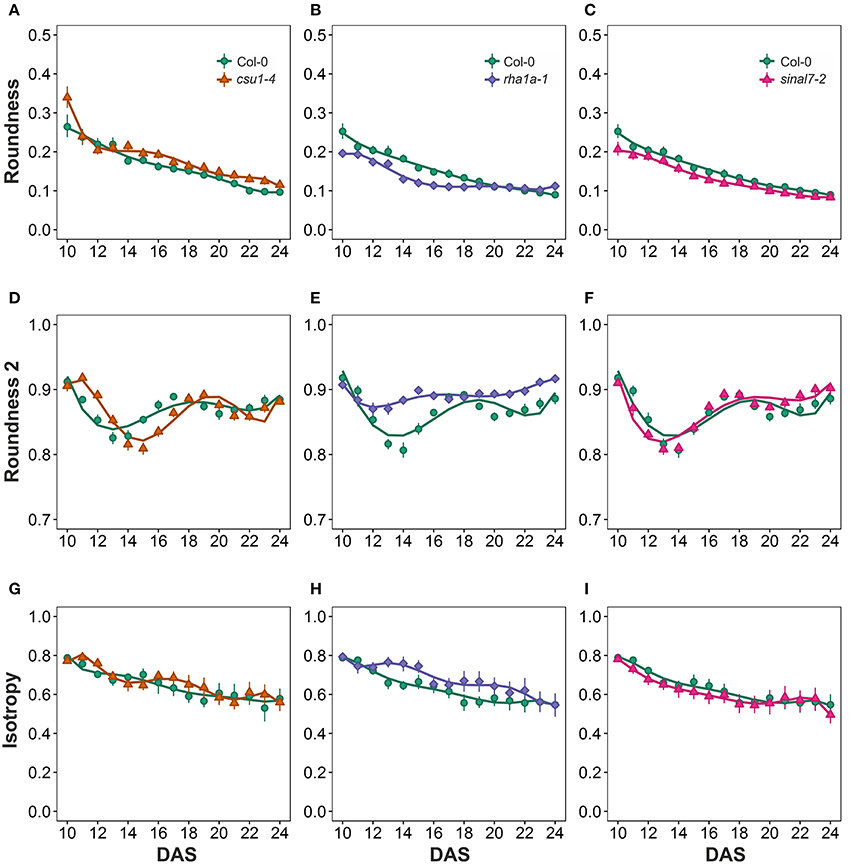
Figure 6. Circularity measurements from day 10 to 20. Roundness (A) csu1-4, (B) rha1a-1, and (C) sinal7-2. Roundness2 (D) csu1-4, (E) rha1a-1, and (F) sinal7-2. Isotropy (G) csu1-4, (H) rha1a-1, and (I) sinal7-2. Markers, daily mean; error bars, 95% confidence interval; Curves = fitted models; n = 20 plants. The experiment was repeated at least 3 times with similar results. DAS, days after stratification.
Line csu1-4 showed a similar roundness 2 pattern as Col-0 that is shifted to the right by approximately 2 days (Figures 6D–F). Line rha1a-1, showed an oscillating pattern too, however, its roundness 2 values were constantly close to 0.9 with less steep peaks than Col-0, presenting the highest differences between days 12 and 16 (Figure 6E, Table 1). Similarly, to line csu1-4, line sinal7-2 presented an oscillating pattern very similar to Col-0, however, this time the curve had shifted to the left by approximately 1 day (Figure 6F).
Isotropy showed similar results as roundness and roundness 2, where line csu1-4 and sinal7-2 had similar oscillating pattern as Col-0, but csu1-4 curve is shifted to the right, while the curve for sinal7-2 is shifted to the left (Figures 6G–I). Line rha1a-1 showed a constant high isotropy value decreasing over time until reaching Col-0 pattern by day 23 (Figure 6H, Table 1).
Symmetry Parameters
The morphological parameters describing symmetry were eccentricity and rotational mass symmetry (RMS) (Figure 1). For eccentricity, line csu1-4 showed a similar pattern as Col-0 plants with a large and a small eccentricity peak, but shifted to the right (Figure 7A). Line rha1a-1 presented no shift in its curve, but it showed a rather flat peak around days 11 and 15, remaining lower than Col-0 until the end of the analysis (Figure 7B, Table 1). This result shows that rha1a-1 is less eccentric than Col-0 along the complete analysis. Line sinal7-2 showed also a similar pattern to Col-0 plants with two eccentric peaks, but slightly shifted to the left (Figure 7C). For RMS line csu1-4 showed similar pattern as Col-0 plants, but shifted again to the right about 1 day for the highest peak and remained higher than Col-0 in the last days of the analysis (Figure 7D). On the other hand, rha1a-1 presented no shift in its curve, but it showed a decrease in the peak around days 11 and 15, decaying faster and remaining lower than Col-0 plants (Figure 7E, Table 1). Like in eccentricity, sinal7-2 was almost indistinguishable from the Col-0 plants, except for a slight shift to the left captured by the model (Figure 7F).
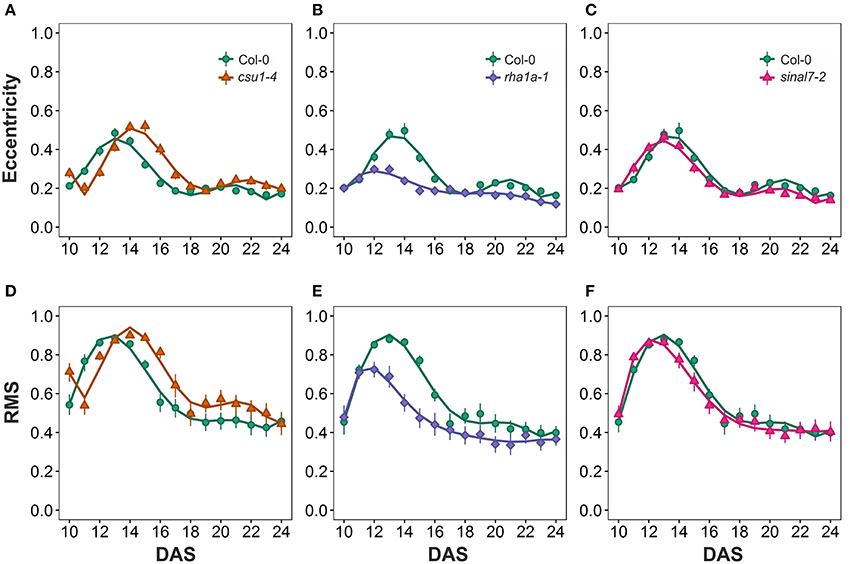
Figure 7. Symmetry measurements from day 10 to 20. Eccentricity (A) csu1-4, (B) rha1a-1, and (C) sinal7-2. Rotational Mass Symmetry (RMS) (D) csu1-4, (E) rha1a-1, and (F) sinal7-2. Markers, daily mean; error bars, 95% confidence interval; Curves, fitted models; n = 20 plants. The experiment was repeated at least 3 times with similar results. DAS, days after stratification.
Center Distance Parameters
The last two morphological parameters analyzed were compactness and slenderness of the leaves (SOL), which were based on the center distance (Figure 1). Here line csu1-4 showed a decay of compactness overtime in a similar way to Col-0 plants, but its curve was shifted to the right (Figure 8A). Lines csu1-4 and sinal7-2 presented quite normal compactness curves, while for rha1a-1 the pattern that was less compact than Col-0 plants at the beginning of the analyzed period (Figure 8B, Table 1). The compactness later rises above Col-0, showing higher compactness values. Like for the previously described parameters, sinal7-2 compactness curve showed slightly lower values than Col-0, except for the last 2 days where Col-0 plants reached sinal7-2 compactness (Figure 8C).
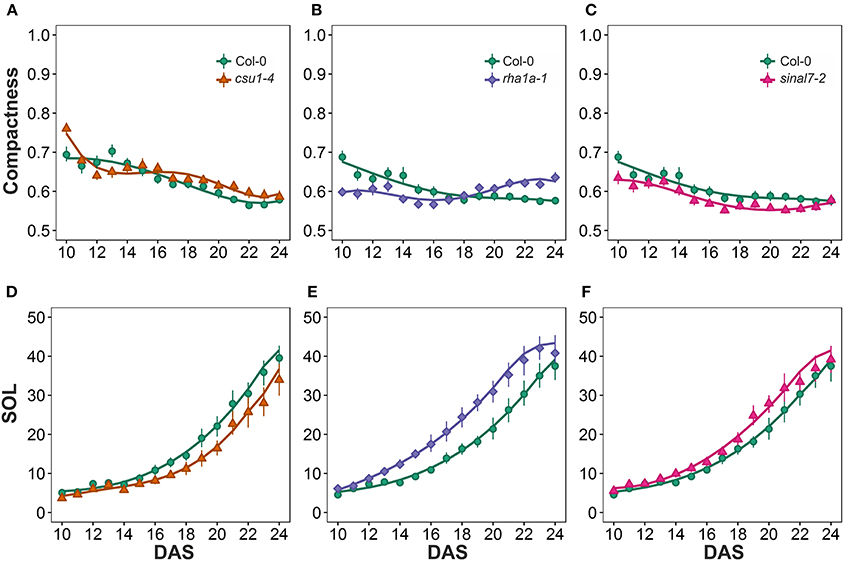
Figure 8. Center distance measurements from day 10 to 20. Compactness (A) csu1-4, (B) rha1a-1, and (C) sinal7-2. Slenderness Of Leaves (SOL) (D) csu1-4, (E) rha1a-1, and (F) sinal7-2. Markers, daily mean; error bars, 95% confidence interval; Curves, fitted models; n = 20 plants. The experiment was repeated at least 3 times with similar results. DAS, days after stratification.
Line csu1-4 showed lower SOL values than Col-0, while rha1a-1 and sinal7-2 showed higher SOL values than Col-0 (Figures 8E,F, Table 1). The main differences in SOL could be observed during the exponential growing phase of the rosette and reaching a plateau at the end of the analyzed period where the differences to Col-0 plants become insignificant (Figures 8D–F).
Flowering Time Phenotypes
Flowering time mutants identified in the screen represented both with reduced and increased leaf numbers at bolting (Table 2). Line csu1-4 (AT1G61620) was clearly early-flowering in both experimental replications. AT5G63970, a putative forkhead box protein, mutant line was early flowering in one of two experimental replications. SBP (S-ribonuclease binding protein) family protein (AT4G17680) was late flowering in both experimental replications. As already shown by others, cop1-6 mutant was early flowering in both LAB (7) and DTB (22). In most of the mutant lines, LAB did not differ from Col-0 in all experimental replications, but the trend was observed in both or all. LAB or DTB of sinal7-2 did not differ from Col-0 in either of the experimental replications.
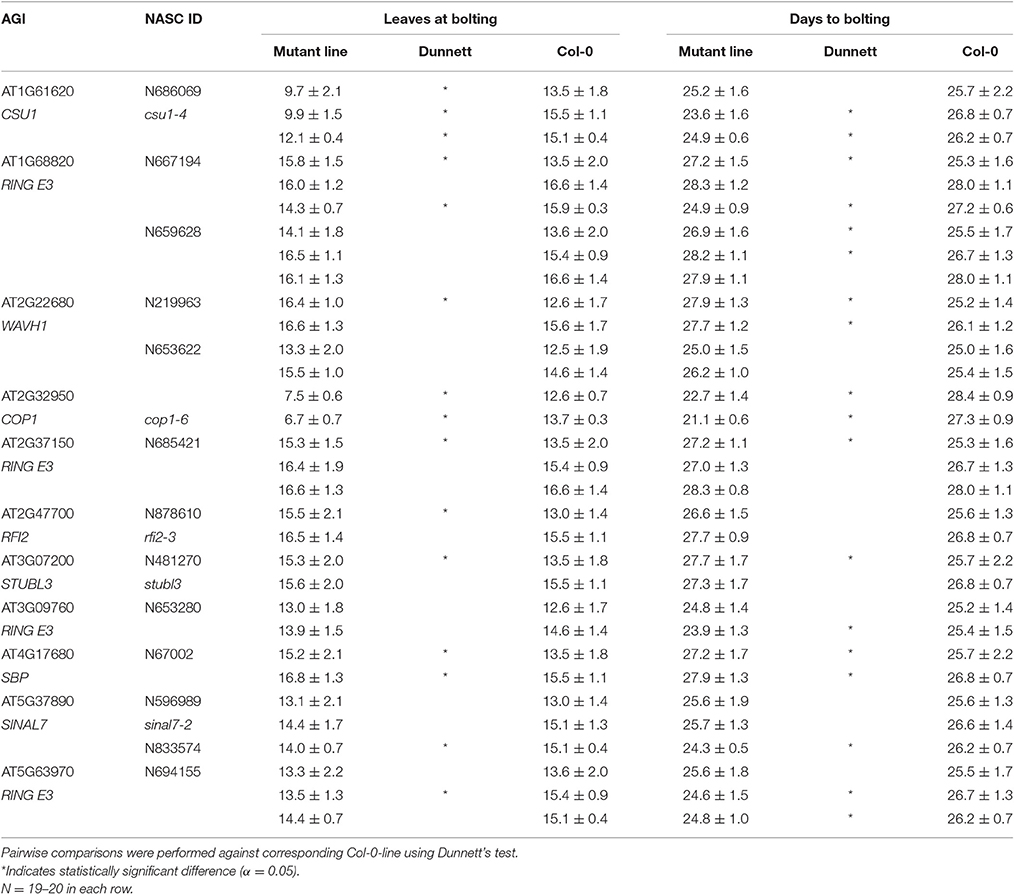
Table 2. Number of leaves and number of days to bolting in Arabidopsis mutant lines grown in LDs.
Mutation in SINAL7 Causes Flower Growth Phenotypes
Flower morphology of the analyzed mutants was observed under stereomicroscope. The mutant line sinal7-2 was found to produce flower buds of abnormal shape, characterized by presence of cavities in the bud tips (Figures 9A,B). These openings were present at one or both sides of the affected buds and were caused by tips of the lateral sepals bending inwards (Figures 9E,F). Also medial sepals frequently showed altered morphology: their tips covered the buds to a lesser extent than in Columbia, resulting in their “blunt” appearance. Whereas these phenotypes were present in all 18 analyzed inflorescences of sinal7-2 plants, regardless of the plant age—only two out of 13 analyzed wild type inflorescences showed similar sepal features, restricted to the first six flowers on the main stems. Scoring flowers stage late 12–15 (located between positions 1st and 20th on the main inflorescences) revealed that in 54% of the mutant flowers (43/80) at least one lateral sepal tip was bent inwards—as compared to 6/50, i.e., 12% in Col-0 (the analyzed flowers came from 13 to 9 individual plants, respectively).
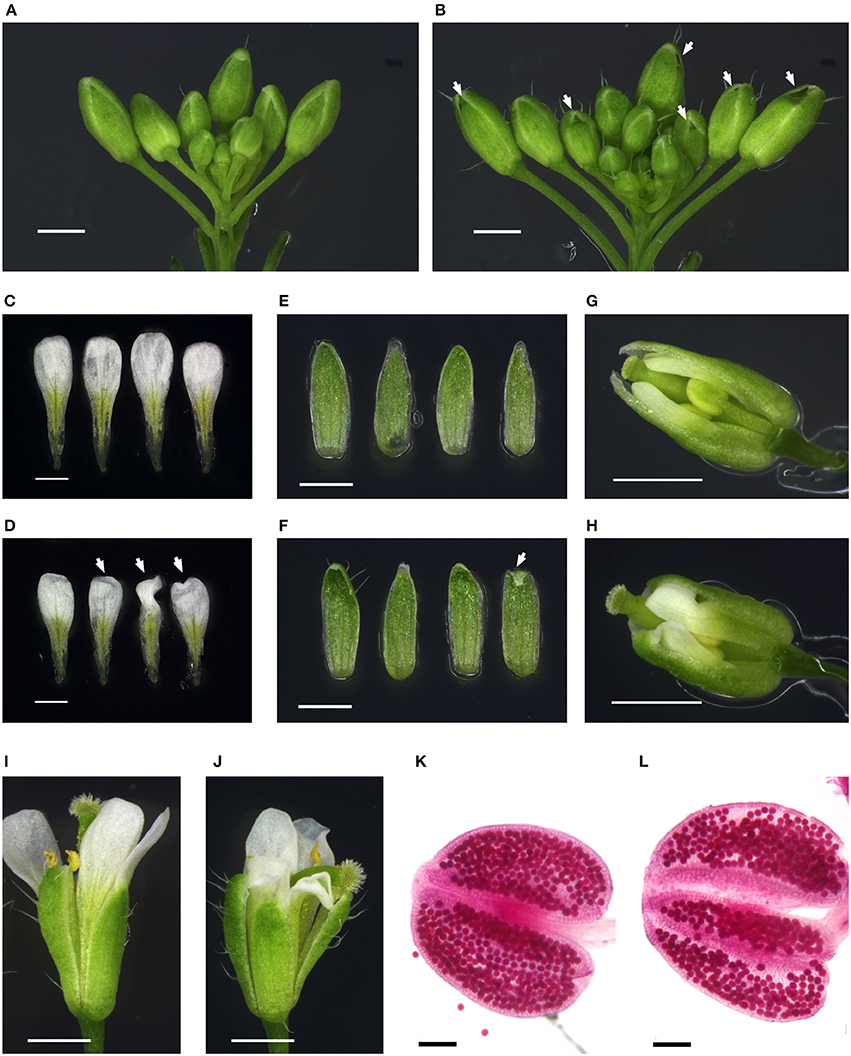
Figure 9. Flower phenotypes of the sinal7-2 mutant. Flower developmental stages assigned according to Smyth et al. (1990). Scale bars: 1 mm (A–J) and 100 μm (K,L). (A,B) Representative inflorescences of Col-0 (A) and sinal7-2 (B). All flowers and siliques older than stage 12 have been removed. Mutant flower buds contain cavities beneath the bud tip (indicated with white arrows). (C,D) Petals of a Col-0 (C) and a sinal7-2 (D) flower at stage 15. White arrows pointing at the wrinkled mutant petals. (E,F) Adaxial surface of the sepals from a Col-0 (E) and a sinal7-2 (F) flower at stage 15. White arrow pointing at the bending lateral sepal tip of sinal7-2. (G,H) Late stage 12 flower buds of Col-0 (G) and sinal7-2 (H). The medial sepals have been removed to reveal the elongating and wrinkling petals blocked by the ingrown lateral sepals of the mutant. (I,J) Col-0 (I) and sinal7-2 (J) flowers stage 15. (K,L) Representative anthers from Col-0 (K) and sinal7-2 (L) flowers stage 12–13 stained for pollen viability.
Dissecting flower buds at the end of stage 12 revealed that the occurrence of ingrown lateral sepal tips was accompanied by petal wrinkling, as the sepal shape interfered with elongation of the petals (Figures 9G,H). Indeed, in some of the mature flowers with bent lateral sepal tips, the petal blades remained wrinkled; in several cases also pistil or stamen shape was affected (Figures 9C,D,I,J).
SINAL7 has been shown to mediate ubiquitination of glyceraldehyde-3-phosphate dehydrogenase 1 (GAPC1) enzyme in vitro and to affect its enzymatic activity and subcellular localization in Arabidopsis (Peralta et al., 2016). In plants lacking GAPC1 male sterility was observed (Rius et al., 2008). To investigate whether deficiency of SINAL7 impairs male fertility in the sinal7-2 mutant, pollen viability was inspected according to the modified Alexander method (Peterson et al., 2010). Anthers of 12 mutant and 11 Col-0 flowers in the developmental stages late 12 and 13 were stained (early and late flowers, originating from at least five individual plants per line). However, no difference between the mutant and Col-0 pollen was observed: anthers of both lines contained almost exclusively viable pollen grains (Figures 9K,L).
Discussion
Genomic knowledge in both model plants and crops is expanding at a fast pace. However, translating the knowledge from sequence to function and thereby from models to applications is hampered by bottlenecks in screening for the phenotypes associated with the genotypes. Here, we set out to conduct a reverse genetic approach (Bolle et al., 2011) by defining a proportion of the RING type ubiquitin E3 ligases to the developmental processes of flowering time control or flower development. To this end, the RING type ubiquitin E3 ligases were first curated in the most recent Arabidopsis genome annotation (ARA11) that had been improved, e.g., by the next generation sequencing techniques (Krishnakumar et al., 2015). Thereby, many gene models had indeed become obsolete, split, merged or their original sequence had changed. We also found that in the annotations there are a considerable number of RING domain containing proteins annotated as RING/U-box genes. RING and U-box share similar functions and are structurally and functionally similar, both are ubiquitin E3 ligases that work as scaffolds between the ubiquitin E2 conjugase and substrate. However, at the amino acid residual level RING and U-box domains are significantly different; in the RING domain the arrangement of cysteines and histidines mediate binding of two zinc ions to stabilize the RING domain, while the U-box domains are stabilized by a set of hydrogen bonds and salt bridges (Wiborg et al., 2008).
Recent studies have revealed complex molecular networks that include ubiquitin E3 ligases in regulation of flowering (Lazaro et al., 2012; Peng et al., 2013; Xia et al., 2013). To start defining the genomic flower related Ubiquitin Proteasome System of RING E3 ligases, we first verified the gene expression patterns of the curated RING genes. RING E3 ligases work at protein level but are likely to be transcriptionally directed to their relevant tissues. From the 509 RING genes, 122 were indeed associated with flowering with enrichment of gene expression in flower organs or during flowering. This observation prompted us to obtain a representative mutant collection for phenotypic evaluation.
To screen for phenotypes associated with the mutant collection, an automated plant phenotyping facility was utilized. To facilitate a phenotypic screening of a large Arabidopsis mutant collection a phenomics workflow was established to analyze simultaneously up to 36 genotypes in a PlantScreen™ imaging system installed at the Viikki campus of the University of Helsinki (http://blogs.helsinki.fi/nappi-blog/). Although T-DNA insertion knock-out mutants do not always impair gene function (Bolle et al., 2011), the high-throughput phenomics screen of altogether 43 genotypes singled out three mutant lines with clear growth and morphology phenotypes, three mutant lines with flowering time phenotypes and only one with altered flower structure.
For the Arabidopsis growth assessment, we analyzed rosette growth from 10 to 20 DAS. The analysis of such longitudinal data is challenging and demands automated statistical analysis and modeling steps. The rosette growth normally follows a sigmoid pattern showing a lag phase represented by slow growth around the first 10 days, accelerating in the middle and slowing down when getting close to the transition from the vegetative to reproductive phase. The best way to model data with sigmoid behavior is by fitting a three parameter logistic regression (3PL) to explain the three stages (Paine et al., 2012; Tessmer et al., 2013; Neilson et al., 2015). However, our analysis time window captured only the lag and the exponential phases, so a 3PL model was not suitable for our data. Therefore, we used polynomials for more flexibility and a better explanation of the data for all the parameters. This was particularly useful for the initial screening of the data of the tens of lines for the complex parameters like roundness, roundness 2, isotropy, compactness and RMS.
Typically, the parameters of roundness 2, isotropy and RMS increase and decrease over time. This behavior is due to the natural cycle of leaf initiation and expansion. At the beginning when the two first true leaves are developed, the rosette has an elliptical shape that becomes more circular when the leaves 3 and 4 appear and start to expand. Because leaves 3 and 4 keep on expanding, while the leaves 1 and 2 have already stopped expanding, the rosette takes an elliptical shape around day 12 (Figure 4). This process is repeated each time two new leaves develop and expand, explaining the oscillating behavior of these parameters. The steepness of each peak decrease over time because previously generated leaves expand making the rosette more circular. Thus, recording fluctuations in these parameters allows establishing the developmental timing of leaf initiation and expansion.
Here, three lines showed consistently significant differences in growth and morphology compared to the wild type Col-0. The mutant lines csu1-4 and sinal7-2 showed similar growth curve shapes as Col-0, but shifted to the left or right, respectively, for all morphological parameters. This behavior was explained by their speed of growth over time. If two lines differ in their growth rate but were analyzed only on one particular day after germination, they could show high differences in morphological parameters. Therefore, longitudinal time course analysis of Arabidopsis rosette growth and shape became compulsory for making accurate conclusions about the effect of a mutation also on morphology. On the contrary, the rha1a-1 mutant did not show major differences in growth, but did for morphology. The increased number and serration of rosette leaves in rha1a-1 rendered the rosette perimeter and the skeleton longer, thereby, reducing the roundness and increasing SOL during all time points (Figures 6B, 8E). Furthermore, the increased number of leaves of rha1a-1 prevented its rosette from taking overly elliptical shape, keeping it more circular than Col-0 plants over time (Figure 4). This characteristic was translated in higher roundness 2, isotropy, compactness and lower eccentricity and RMS (Figures 6E–H, 7B–E, 8B). Thus, the morphological parameters can be used not only to record developmental timing but also to explain the plant architecture in a numeric manner.
The line showing an early flowering time phenotype was COP1 SUPPRESSOR1 (CSU1). csu1-4 plants flowered three to six leaves earlier than Col-0 grown under LDs (Table 2). In addition to early flowering, csu1-4 plants showed vegetative phenotypes: plants were smaller than Col-0 (Figure 5), the eccentricity, RMS and roundness2 development started later than Col-0 (Figures 6, 7), and SOL was smaller than in Col-0 (Figure 8). CSU1 has been shown to negatively regulate hypocotyls length in the dark, via ubiquitination of COP1 and repression of SPA1 (Xu et al., 2014). Our results indicate that CSU1 may regulate both vegetative and generative development. The line showing a late flowering phenotype, SBP family protein (AT4G17680), flowered one to two leaves later than Col-0 (Table 2). This gene was selected for the phenotypic analysis based on its interaction with TOE2. toe2 is late flowering, and toe1 toe2 double mutant represses FT expression (Zhai et al., 2015). Our results suggest that this SBP family protein could be involved in regulation of flowering time possibly through TOE2. Some SBP family members are known to regulate flowering time. Four SBP proteins, BOTRYTIS SUSCEPTIBLE1 INTERACTOR (BOI) and its three homologous repress flowering by repressing FT expression in a CO dependent manner and a CO independent manner via DELLA proteins (Nguyen et al., 2015). This evidence suggests that there might be a connection between SBP proteins and flowering time control.
In the sinal7-2 mutant defects in flower morphology were observed. SINAL7 has been shown to ubiquitinate glyceraldehyde-3-phosphate dehydrogenase 1 (GAPC1) and to regulate its enzymatic activity and movement to nucleus (Peralta et al., 2016). GAPC1 plays a role in glycolysis, thus regulating carbon metabolism, and it has been also associated with cytoskeleton and mitochondria (Giegé et al., 2003; Anderson et al., 2004). SINAL7 gene is differentially expressed in the gapc1 knockout mutant as well as in u-ATP9 plants with mitochondrial dysfunction (Rius et al., 2008; Busi et al., 2011). Although both gapc1 and u-ATP9 lines showed defects in male fertility (Gómez-Casati et al., 2002; Rius et al., 2008), we did not observe increased number of aborted pollen grains in the sinal7-2 mutant (Figures 9K,L), suggesting that SINAL7-mediated GAPC1 regulation does not impact pollen maturation. Although we have not tested if the sinal7-2 mutation influences pollen germination and pollen tube growth, fertility of the mutant did not seem to be strongly compromised. Instead, we observed defects in sinal7-2 flower morphology - cavities in flower buds and wrinkled petals. Sepal curvature is controlled by giant cells in the abaxial epidermis, in which cell expansion is connected with endoreduplication (Roeder et al., 2010, 2012). A couple of mutants have been identified in which reduction of giant cells was accompanied by their sepals bending inwards. Closer examination of sinal7-2 sepal epidermis will show whether the observed bent sepal tips and resulting flower bud cavities (Figures 9A,B,E–H) originate from endoreduplication defects, which could suggest a novel role for the SINAL7 protein. Other flower phenotypes of the mutant—wrinkling of petals as well as bending of stamens and pistils (Figures 9C,D,G–J)—seem to be a direct consequence of the abnormal shape of sepals posing an obstacle for the developing floral organs during their growth and release from the buds. Nevertheless, at this point it cannot be ruled out that the SINAL7 ubiquitin E3 ligase could be involved in the development of these flower organs in other ways.
Here we showed that automated, imaging based phenotyping platform is an efficient tool to overcome the limiting factors of manual and visual phenotypic measurements of large plant collections. Imaging based platforms also allow deep resolution of the phenotypes and thereby more precise association with the genotypes. Furthermore, the automated plant management and transportation to imaging, facilitates time course experiments. Thereby, recording longitudinal numeric values indicating changes in rosette size and morphology can be utilized in developmental timing of plant growth and development. Here the customized solution of the PSI PlantScreen™ system by top view CCD camera in combination with online data processing was used for high throughput phenotyping of an Arabidopsis mutant collection. The obtained resolution and high throughput, whereby hundreds of plants can be analyzed in the time that normally a handful would be analyzed, is an obvious advantage.
Author Contributions
MP conducted the genomic screens, performed the phenomic screens and statistical analysis of these data. KM performed the QPCR analysis and participated in phenotyping and statistical data analysis, FW designed and revised genotyping of the mutant collection. MB designed and revised the flower phenotype analysis. EC participated in the phenotyping assays and conducted flowering time experiments. KH designed the project as a whole, approved the data and wrote the manuscript.
Funding
This project was supported by The Academy of Finland (Suomen Akatemia #283138, #256094, #250972) and Becas Chile from Comisión Nacional de Investigación Científica y Tecnológica (CONICYT) Chile.
Conflict of Interest Statement
The authors declare that the research was conducted in the absence of any commercial or financial relationships that could be construed as a potential conflict of interest.
Supplementary Material
The Supplementary Material for this article can be found online at: http://journal.frontiersin.org/article/10.3389/fpls.2017.00416/full#supplementary-material
References
Alonso, J. M., Stepanova, A. N., Leisse, T. J., Kim, C. J., Chen, H., Shinn, P., et al. (2003). Genome-wide insertional mutagenesis of Arabidopsis thaliana. Science 301, 653–657. doi: 10.1126/science.1086391
Amasino, R. M., and Michaels, S. D. (2010). The timing of flowering. Plant Physiol. 154, 516–520. doi: 10.1104/pp.110.161653
Anderson, L. E., Ringenberg, M. R., and Carol, A. A. (2004). Cytosolic glyceraldehyde-3-P dehydrogenase and the B subunit of the chloroplast enzyme are present in the pea leaf nucleus. Protoplasma 223, 33–43. doi: 10.1007/s00709-003-0030-6
Awlia, M., Nigro, A., Fajkus, J., Schmockel, S., Negrao, S., Santelia, D., et al. (2016). High-throughput non-destructive phenotyping of traits that contribute to salinity tolerance in Arabidopsis thaliana. Front. Plant Sci. 7:1414. doi: 10.3389/fpls.2016.01414
Bolle, C., Schneider, A., and Leister, D. (2011). Perspectives on systematic analyses of gene function in Arabidopsis thaliana: new tools, topics and trends. Curr. Genomics 12, 1. doi: 10.2174/138920211794520187
Bouché, F., Lobet, G., Tocquin, P., and Périlleux, C. (2016). FLOR-ID: an interactive database of flowering-time gene networks in Arabidopsis thaliana. Nucleic Acids Res. 44, D1167–D1171. doi: 10.1093/nar/gkv1054
Boyes, D., Zayed, A., Ascenzi, R., McCaskill, A., Hoffman, N., Davis, K., et al. (2001). Growth stage-based phenotypic analysis of Arabidopsis: a model for high throughput functional genomics in plants. Plant Cell 13, 1499–1510. doi: 10.1105/tpc.13.7.1499
Busi, M., Gomez-Lobato, M., Rius, S., Turowski, V., Casati, P., Zabaleta, E., et al. (2011). Effect of mitochondrial dysfunction on carbon metabolism and gene expression in flower tissues of Arabidopsis thaliana. Mol. Plant 4, 127–143. doi: 10.1093/mp/ssq065
Chen, M., and Ni, M. (2006a). RED AND FAR-RED INSENSITIVE 2, a RING-domain zinc finger protein, mediates phytochrome-controlled seedling deetiolation responses. Plant Physiol. 140, 457–465. doi: 10.1104/pp.105.073163
Chen, M., and Ni, M. (2006b). RFI2, a RING-domain zinc finger protein, negatively regulates CONSTANS expression and photoperiodic flowering. Plant J. 46, 823–833. doi: 10.1111/j.1365-313X.2006.02740.x
Czechowski, T., Stitt, M., Altmann, T., Udvardi, M. K., and Scheible, W.-R. (2005). Genome-wide identification and testing of superior reference genes for transcript normalization in Arabidopsis. Plant Physiol. 139, 5–17. doi: 10.1104/pp.105.063743
Fornara, F., Panigrahi, K. C. S., Gissot, L., Sauerbrunn, N., Rühl, M., Jarillo, J. A., et al. (2009). Arabidopsis DOF transcription factors act redundantly to reduce CONSTANS expression and are essential for a photoperiodic flowering response. Dev. Cell 17, 75–86. doi: 10.1016/j.devcel.2009.06.015
Giegé, P., Heazlewood, J. L., Roessner-Tunali, U., Millar, A. H., Fernie, A. R., Leaver, C. J., et al. (2003). Enzymes of glycolysis are functionally associated with the mitochondrion in Arabidopsis cells. Plant Cell 15, 2140–2151. doi: 10.1105/tpc.012500
Gómez-Casati, D., Busi, M., Gonzalez-Schain, N., Mouras, A., Zabaleta, E., and Araya, A. (2002). A mitochondrial dysfunction induces the expression of nuclear encoded complex I genes in engineered male sterile Arabidopsis thaliana. FEBS Lett. 4, 70–74. doi: 10.1016/S0014-5793(02)03631-1
Groth, M., Stroud, H., Feng, S., Greenberg, M., Vashisht, A., Wohlschlegel, J., et al. (2014). SNF2 chromatin remodeler-family proteins FRG1 and –2 are required for RNA-directed DNA methylation. Proc. Natl. Acad. Sci. U.S.A. 111, 17666–17671. doi: 10.1073/pnas.1420515111
Hruz, T., Laule, O., Szabo, G., Wessendorp, F., Bleuler, S., Oertle, L., et al. (2008). Genevestigator v3: a reference expression database for the meta-analysis of transcriptomes. Adv. Bioinformatics 2008:420747. doi: 10.1155/2008/420747
Jang, S., Marchal, V., Panigrahi, K. C., Wenkel, S., Soppe, W., Deng, X. W., et al. (2008). Arabidopsis COP1 shapes the temporal pattern of CO accumulation conferring a photoperiodic flowering response. EMBO J. 27, 1277–1288. doi: 10.1038/emboj.2008.68
Kleinboelting, N., Huep, G., Kloetgen, A., Viehoever, P., and Weisshaar, B. (2012). GABI-Kat SimpleSearch: new features of the Arabidopsis thaliana T-DNA mutant database. Nucleic Acids Res. 40, D1211–D1215. doi: 10.1093/nar/gkr1047
Kosarev, P., Mayer, K. F. X., and Hardtke, C. S. (2002). Evaluation and classification of RING-finger domains encoded by the Arabidopsis genome. Genome Biol. 3, 1. doi: 10.1186/gb-2002-3-4-research0016
Krishnakumar, V., Hanlon, M. R., Contrino, S., Ferlanti, E. S., Karamycheva, S., Kim, M., et al. (2015). Araport: the Arabidopsis information portal. Nucleic Acids Res. 43, D1003–D1009. doi: 10.1093/nar/gku1200
Laubinger, S., Marchal, V., Gentilhomme, J., Wenkel, S., Adrian, J., Jang, S., et al. (2006). Arabidopsis SPA proteins regulate photoperiodic flowering and interact with the floral inducer CONSTANS to regulate its stability. Development 133, 3213–3222. doi: 10.1242/dev.02481
Lazaro, A., Valverde, F., Piñeiro, M., and Jarillo, J. A. (2012). The Arabidopsis E3 ubiquitin ligase HOS1 negatively regulates CONSTANS abundance in the photoperiodic control of flowering. Plant Cell 24, 982–999. doi: 10.1105/tpc.110.081885
Liu, L.-J., Zhang, Y.-C., Li, Q.-H., Sang, Y., Mao, J., Lian, H.-L., et al. (2008). COP1-mediated ubiquitination of CONSTANS is implicated in cryptochrome regulation of flowering in Arabidopsis. Plant Cell 20, 292–306. doi: 10.1105/tpc.107.057281
Livak, K., and Schmittgen, T. (2001). Analysis of relative gene expression data using real-time quantitative PCR and the 2−ΔΔCT method. Methods 25, 40. doi: 10.1006/meth.2001.1262
Neilson, E. H., Edwards, A. M., Blomstedt, C. K., Berger, B., Møller, B. L., and Gleadow, R. M. (2015). Utilization of a high-throughput shoot imaging system to examine the dynamic phenotypic responses of a C4 cereal crop plant to nitrogen and water deficiency over time. J. Exp. Bot. 66, 1817–1832. doi: 10.1093/jxb/eru526
Nguyen, K. T., Park, J., Park, E., Lee, I., and Choi, G. (2015). The Arabidopsis RING domain protein BOI inhibits flowering via co-dependent and co-independent mechanisms. Mol. Plant 8, 1725–1736. doi: 10.1016/j.molp.2015.08.005
Paine, C. E. T., Marthews, T. R., Vogt, D. R., Purves, D., Rees, M., Hector, A., et al. (2012). How to fit nonlinear plant growth models and calculate growth rates: an update for ecologists. Methods Ecol. Evol. 3, 245–256. doi: 10.1111/j.2041-210X.2011.00155.x
Peng, Y., Shih, C., Yang, J., Tan, C., Hsu, W., Huang, Y., et al. (2013). A RING-type E3 ligase controls anther dehiscence by activating the jasmonate biosynthetic pathway gene DEFECTIVE IN ANTHER DEHISCENCE1 in Arabidopsis. Plant, J. 74, 310–327. doi: 10.1111/tpj.12122
Peralta, D. A., Araya, A., Busi, M. V., and Gomez-Casati, D. F. (2016). The E3 ubiquitin-ligase SEVEN IN ABSENTIA like 7 mono-ubiquitinates glyceraldehyde-3-phosphate dehydrogenase 1 isoform in vitro and is required for its nuclear localization in Arabidopsis thaliana. Int. J. Biochem. Cell Biol. 70, 48–56. doi: 10.1016/j.biocel.2015.11.007
Peterson, R., Slovin, J. P., and Chen, C. (2010). A simplified method for differential staining of aborted and non-aborted pollen grains. Int. J. Plant Biol. 1:13. doi: 10.4081/pb.2010.e13
Piñeiro, M., and Jarillo, J. A. (2013). Ubiquitination in the control of photoperiodic flowering. Plant Sci. 198, 98–109. doi: 10.1016/j.plantsci.2012.10.005
Rius, S. P., Casati, P., Iglesias, A. A., and Gomez-Casati, D. F. (2008). Characterization of Arabidopsis lines deficient in GAPC-1, a cytosolic NAD-dependent glyceraldehyde-3-phosphate dehydrogenase. Plant Physiol. 148, 1655–1667. doi: 10.1104/pp.108.128769
Roeder, A. H. K., Chickarmane, V., Cunha, A., Obara, B., Manjunath, B. S., and Meyerowitz, E. M. (2010). Variability in the control of cell division underlies sepal epidermal patterning in Arabidopsis thaliana. PLoS Biol. 8:e1000367. doi: 10.1371/journal.pbio.1000367
Roeder, A. H. K., Cunha, A., Ohno, C. K., and Meyerowitz, E. M. (2012). Cell cycle regulates cell type in the Arabidopsis sepal. Development 139, 4416–4427. doi: 10.1242/dev.082925
Rosso, M. G., Li, Y., Strizhov, N., Reiss, B., Dekker, K., and Weisshaar, B. (2003). An Arabidopsis thaliana T-DNA mutagenized population (GABI-Kat) for flanking sequence tag-based reverse genetics. Plant Mol. Biol. 53, 247–259. doi: 10.1023/B:PLAN.0000009297.37235.4a
Sadanandom, A., Bailey, M., Ewan, R., Lee, J., and Nelis, S. (2012). The ubiquitin-proteasome system: central modifier of plant signalling. New Phytol. 196, 13–28. doi: 10.1111/j.1469-8137.2012.04266.x
Santner, A., and Estelle, M. (2010). The ubiquitin-proteasome system regulates plant hormone signaling. Plant J. 61, 1029–1040. doi: 10.1111/j.1365-313X.2010.04112.x
Sawa, M., Nusinow, D. A., Kay, S. A., and Imaizumi, T. (2007). FKF1 and GIGANTEA complex formation is required for day-length measurement in Arabidopsis. Science 318, 261–265. doi: 10.1126/science.1146994
Schmid, M., Davison, T. S., Henz, S. R., Pape, U. J., Demar, M., Vingron, M., et al. (2005). A gene expression map of Arabidopsis thaliana development. Nat. Genet. 37, 501–506. doi: 10.1038/ng1543
Smyth, D. R., Bowman, J. L., and Meyerowitz, E. M. (1990). Early flower development in Arabidopsis. Plant Cell 2, 755–767. doi: 10.1105/tpc.2.8.755
Song, Y. H., Smith, R. W., To, B. J., Millar, A. J., and Imaizumi, T. (2012). FKF1 conveys timing information for CONSTANS stabilization in photoperiodic flowering. Science 336, 1045–1049. doi: 10.1126/science.1219644
Steffen, A., Fischer, A., and Staiger, D. (2014). Determination of photoperiodic flowering time control in Arabidopsis and barley. Methods Mol. Biol. 2, 285–295. doi: 10.1007/978-1-4939-0700-7_19
Stone, S. L., Hauksdóttir, H., Troy, A., Herschleb, J., Kraft, E., and Callis, J. (2005). Functional analysis of the RING-type ubiquitin ligase family of Arabidopsis. Plant Physiol. 137, 13–30. doi: 10.1104/pp.104.052423
Suárez-López, P., Wheatley, K., Robson, F., Onouchi, H., Valverde, F., and Coupland, G. (2001). CONSTANS mediates between the circadian clock and the control of flowering in Arabidopsis. Nature 410, 1116–1120. doi: 10.1038/35074138
Tessmer, O. L., Jiao, Y., Cruz, J. A., Kramer, D. M., and Chen, J. (2013). Functional approach to high-throughput plant growth analysis. BMC Syst. Biol. 7, 1–13. doi: 10.1186/1752-0509-7-S6-S17
Vierstra, R. D. (2009). The ubiquitin–26S proteasome system at the nexus of plant biology. Nat. Rev. Mol. Cell Biol. 10, 385–397. doi: 10.1038/nrm2688
Wiborg, J., O'Shea, C., and Skriver, K. (2008). Biochemical function of typical and variant Arabidopsis thaliana U-box E3 ubiquitin-protein ligases. Biochem. J. 413, 447–457. doi: 10.1042/BJ20071568
Xia, T., Li, N., Dumenil, J., Li, J., Kamenski, A., Bevan, M. W., et al. (2013). The ubiquitin receptor DA1 interacts with the E3 ubiquitin ligase DA2 to regulate seed and organ size in Arabidopsis. Plant Cell 25, 3347–3359. doi: 10.1105/tpc.113.115063
Xu, D., Lin, F., Jiang, Y., Huang, X., Li, J., Ling, J., et al. (2014). The RING-finger E3 ubiquitin ligase COP1 SUPPRESSOR1 negatively regulates COP1 abundance in maintaining COP1 homeostasis in dark-grown Arabidopsis seedlings. Plant Cell 26, 1981–1991. doi: 10.1105/tpc.114.124024
Keywords: Arabidopsis, flower, RING E3 ligase, ubiquitin, high throughput, image based phenotyping, phenomics data analysis
Citation: Pavicic M, Mouhu K, Wang F, Bilicka M, Chovanček E and Himanen K (2017) Genomic and Phenomic Screens for Flower Related RING Type Ubiquitin E3 Ligases in Arabidopsis. Front. Plant Sci. 8:416. doi: 10.3389/fpls.2017.00416
Received: 30 September 2016; Accepted: 10 March 2017;
Published: 28 March 2017.
Edited by:
Marcos Egea-Cortines, Universidad Politécnica de Cartagena, SpainReviewed by:
Federico Valverde, Consejo Superior de Investigaciones Científicas (CSIC), SpainDaniel Hofius, Swedish University of Agricultural Sciences, Sweden
Copyright © 2017 Pavicic, Mouhu, Wang, Bilicka, Chovanček and Himanen. This is an open-access article distributed under the terms of the Creative Commons Attribution License (CC BY). The use, distribution or reproduction in other forums is permitted, provided the original author(s) or licensor are credited and that the original publication in this journal is cited, in accordance with accepted academic practice. No use, distribution or reproduction is permitted which does not comply with these terms.
*Correspondence: Kristiina Himanen, kristiina.himanen@helsinki.fi