 Xue Zhang
 Shikang Shen
 Fuqin Wu2†
- 1School of Life Sciences, Yunnan University, Yunnan, China
- 2Yunnan Research and Monitoring Center of Nature Reserve, Yunnan Institute for Forest Inventory and Planning, Kunming, China
Michelia yunnanensis Franch., is a traditional ornamental, aromatic, and medicinal shrub that endemic to Yunnan Province in southwest China. Although the species has a large distribution pattern and is abundant in Yunnan Province, the populations are dramatically declining because of overexploitation and habitat destruction. Studies on the genetic variation and demography of endemic species are necessary to develop effective conservation and management strategies. To generate such knowledge, we used 3 pairs of universal cpDNA markers and 10 pairs of microsatellite markers to assess the genetic diversity, genetic structure, and demographic history of 7 M. yunnanensis populations. We calculated a total of 88 alleles for 10 polymorphic loci and 10 haplotypes for a combined 2,089 bp of cpDNA. M. yunnanensis populations showed high genetic diversity (Ho = 0.551 for nuclear markers and Hd = 0.471 for cpDNA markers) and low genetic differentiation (FST = 0.058). Geographical structure was not found among M. yunnanensis populations. Genetic distance and geographic distance were not correlated (P > 0.05), which indicated that geographic isolation is not the primary cause of the low genetic differentiation of M. yunnanensis. Additionally, M. yunnanensis populations contracted ~20,000–30,000 years ago, and no recent expansion occurred in current populations. Results indicated that the high genetic diversity of the species and within its populations holds promise for effective genetic resource management and sustainable utilization. Thus, we suggest that the conservation and management of M. yunnanensis should address exotic overexploitation and habitat destruction.
Introduction
Investigating population genetics, which includes genetic diversity, population differentiation, and degree of gene flow, is crucial in the conservation and sustainable utilization of a species (Wuyun et al., 2015). Genetic variation is affected by life cycles, ecological traits, and historical events (Yuan et al., 2008). Thus, studies on plant genetic variation can relate a plant with its evolutionary potential for adaptation and survival under environmental stress and climate change (Wu et al., 2015). For years, population genetics and contributing factors have been investigated with different molecular markers, such as amplified fragment length polymorphism (Landey et al., 2013; Mutegi et al., 2016), inter-simple sequence repeats (Han et al., 2007), and random amplified polymorphic DNA (Ram et al., 2008). Co-dominant nuclear microsatellite markers (nSSRs) are different from dominant markers. nSSRs have desirable advantages for assessing the genetic features of species at individual and population levels, such as locus specificity, high reproducibility, highly polymorphism, and technical simplicity (Kalia et al., 2011; Wambulwa et al., 2016). Chloroplast DNA (cpDNA) is not subjected to recombination and has a low effective population size; thus, it can provide complementary and exact information on population differentiation, genetic diversity level, and demographic history of a species. In addition, cpDNA is uniparentally inherited and thus can inform on gene flow mediated by seed dispersal in angiosperms. Therefore, biparentally inherited microsatellites are often combined with uniparental organelle markers for population genetic studies (Poudel et al., 2014).
Michelia yunnanensis Franch. belongs to the genus Michelia in the Magnoliaceae family. It is endemic to Yunnan Province, southwest China. The plant is mainly distributed in mountainous thickets, open forests, and forest edges, and is an indispensable subset for evergreen forests in the central and southern parts of Yunnan Province (Qi, 2000). Moreover, M. yunnanensis provides economic benefits to local residents given its use in horticultural planting, medicines, and perfume manufacturing (Hao, 1999). Although the species is widely distributed, its natural populations and individuals have dramatically declined in recent years based on our field survey because of excessive anthropogenic collection and habitat destruction.
M. yunnanensis has been cultivated and introduced as a horticultural plant because of its graceful appearance, evergreen leaves, aromatic flowers, and strong resistance to wind and toxic gases (Hao, 1999). Its biological characteristics, such as morphological diversity, seed physiology, and tissue culture, have been reported (Han et al., 2010; Song et al., 2013). Detailed studies on the reproductive biology of M. yunnanensis are lacking, but the species is believed to be an insect-pollinated outcrosser, similar to other species of the genus Michellia (Qi, 2000). Moreover, spice and anti-tumor ingredients (sesquiterpene) have been detected in different parts of the M. yunnanensis (Lu and Zhu, 1984; Hu et al., 2010).
Understanding the genetic variation and demographic history of a plant species is essential for conservation decisions and sustainable utilization strategies. The genetic variation and demographic history of wild populations of M. yunnanensis, however, have not been studied. In the present study, we combined cpDNA sequences and microsatellite markers to study the genetic diversity and differentiation, genetic structure, and historical demography of M. yunnanensis. This study addresses the following questions: what is the degree of genetic diversity and gene flow within/between the species' populations? How does the genetic structure of the current population reflected by the gene flow? Such information is essential for devising optimum strategies regarding conservation priorities for populations and sustainable utilization of this species from a genetic perspective.
Materials and Methods
Plant Materials
Because the populations of this species are still declining due to over-exploitation, 100 samples from 7 natural populations (SM, YL, BY, SY, TJ, QZ, and JC) in Yunnan Province (Table 1) were sampled based on the herbarium specimen records and interviews. Except the population SM and BY, in which only 10 individuals have been found, remaining populations were respectively selected 16 individuals (about 10% of each population, Lu et al., 2002) to study. Further, information on each sampled location and numbers of individuals per population were used for analysis are presented in Figure 1 and Table 1, respectively. To avoid sampling the same genotypes, a minimum distance of 15 m between individuals was maintained (Wu et al., 2015). Young and healthy leaves of every sample were collected and placed immediately in desiccating silica gel, returned to the laboratory, and stored at 4°C for DNA extraction.
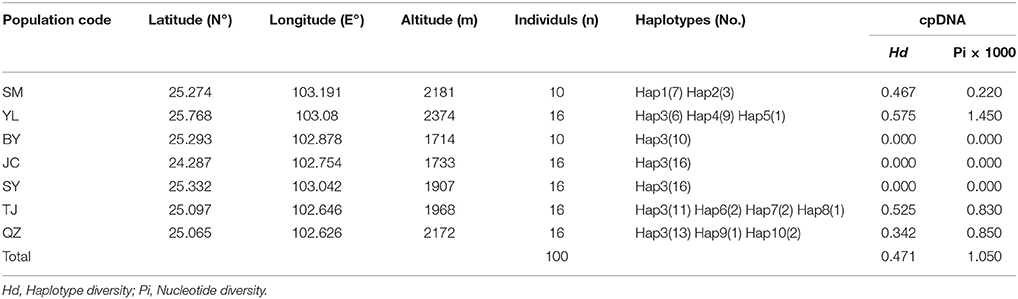
Table 1. Details of sample locations, sample size (n), haplotype diversity (Hd) and nucleotide diversity (Pi) surveyed for cpDNA sequences of M. yunnanensis.
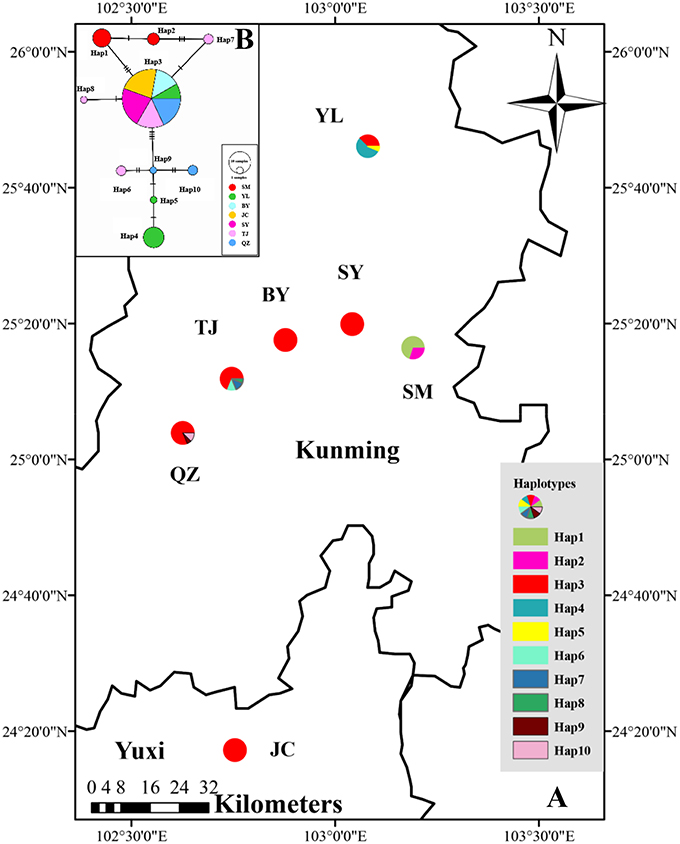
Figure 1. (A) Distribution of cpDNA haplotypes detected in 7 populations of M. yunnanensis. (B) Network of haplotypes of M. yunnanensis based on cpDNA. The size of size of the circles corresponds to the frequency of each haplotype, and the vertical molding on branches indicate mutational steps.
DNA Extraction, PCR Amplification, and Sequencing
Intact genomic DNA was extracted from dried leaves with the modified CTAB method (Doyle, 1991). Extracted DNA was dissolved in 50 μL Tris-EDTA (TE) buffer and stored at −20°C for amplification via polymerase chain reaction (PCR). Through preliminary screening using plastid and nuclear primers, 3 universal cpDNA intergenic spacers (matK, psbA-trnH, and TrnL-trnF) and 10 microsatellite markers were selected from 32 recently developed nuclear microsatellites in Magnoliaceae (Zhao et al., 2009; Sun et al., 2010; Li et al., 2012) on the basis of their clarity and reproducibility.
cpDNA PCR reactions were performed in a total reaction volume of 25 μL that contained 15 ng DNA, 2.5 μL 10 × PCR buffer, 1.5 μL MgCl2 (25 mM), 2.0 μL dNTPs (10 mM), 0.5 μL of each primer, 0.4 μL Taq DNA polymerase (5 U/μL; Takara, Shiga, Japan), and 16.6 μL double-distilled water. PCR amplifications were performed in accordance with the following conditions: 3 min of initial denaturation at 94°C; 35 cycles of 1 min at 94°C; 1 min of annealing at 50°, 53°, and 54°C for trnL-trnF, psbA-trnH, and matK, respectively; 1.5 min of extension at 72°C; and 10 min of final extension at 72°C. PCR reactions of 10 microsatellite markers were referenced and modified into a total reaction volume of 20 μL that contained 20 ng DNA, 2.5 μL 10 × PCR buffer, 1.25 μL MgCl2 (25 mM), 2.25 μL dNTPs (10 mM), 0.5 μL of each primer, 0.4 μL Taq DNA polymerase (5 U/μL; Takara, Shiga, Japan), and 11.1 μL double-distilled water. For each reaction, we used the following conditions: initial 5 min of denaturation at 94°C, followed by 20 cycles of 50 s at 94°C, 50 s of annealing at Tm under different primers, 1.5 min of extension at 72°C, and a final extension for 7 min at 72°C.
The fluorescent dye (FAM, TAMRA, or HEX) was labeled with the forward SSR primers and visualized on an ABI 3730xl Capillary DNA Analyzer by a professional laboratory (Sangon, Shanghai, China). Fragment sizes were assessed using GeneMapper version 4.0. Meanwhile, all purified PCR products by cpDNA markers were bidirectionally sequenced by Sangon in accordance with standard sequencing protocols.
Data Analysis
Data Analysis of cpDNA Sequence
Sequences were edited and assembled by SeqMan II (Swindell and Plasterer, 1997). Multiple alignments of cpDNA sequences were performed manually with subsequent adjustments by Bioedit version 7.0.4.1 (Hall, 1999). Three cpDNA regions were combined by PAUP* 4.0b10 (Swofford, 2002). These regions showed a significant rate of homogeneity (P > 0.5) under a congruency test. The combined cpDNA sequences were used in the following analyses.
We calculated haplotypes and variable sites from aligned cpDNA sequences using DnaSP version 5.0 (Librado and Rozas, 2009). We tested genetic diversity within and among populations by calculating Nei nucleotide diversity (Pi) and haplotype diversity (Hd) indices. Using ArcGis version 10.2 (http://desktop.arcgis.com), the haplotypes of combined cpDNA sequences were plotted on the map of the region from which the samples were collected. Within-population gene diversity (HS) and gene diversity in total populations (HT) were calculated using Permut version 1.0 (http://www6.bordeaux-aquitaine.inra.fr/biogeco/Production-scientifique/Logiciels/Contrib-Permut/Permut). Meanwhile, the level of population differentiation (GST) and phylogenetically ordered alleles (NST) were also calculated by this software to test for the presence of phylogeographic structures (Pons and Petit, 1996).
Arlequin version 3.11 (Excoffier et al., 2005) was used to analyze molecular variance (AMOVA, Excoffier et al., 1992) and estimate the hierarchical genetic structure assigned within and among populations. The signification of the estimated FST across populations was tested with 103 permutations.
Popart (http://popart.otago.ac.nz/examplenex.shtml) was used to construct a genealogical haplotype network to estimate the degree of relatedness per haplotype. Indels were treated as single mutational events. Phylogenetic relationships of cpDNA haplotypes in M. yunnanensis populations were inferred without an outgroup by Bayesian methods in MrBayes version 3.1.2 (Ronquist and Huelsenbeck, 2003) and neighbor-joining method in Mega version 6.06 (Tamura et al., 2013).
Evolutionary rates estimated for M. yunnanensis were converted to 1.01 × 10⁻⁹ (Graur and Li, 2000) with BEAST version 1.6.1 (Drummond and Rambaut, 2007). Markov Chain Monte Carlo (MCMC) analysis was run for 107 iterations with a burn-in of 106 under the HKY model and a strict clock. The most suitable model (HKY) was determined by Modeltest in Mega version 6.06 (Tamura et al., 2013). MCMC samples were inspected in TRACER version 1.5 (Rambaut and Drummond, 2004). All runs were coalesced to the stationary distribution with an adequate sampling (effective sample size > 200 after the burn-in). The results were visualized in FigTree version 1.4.2 (http://tree.bio.ed.ac.uk/software/tracer/).
To further investigate population expansion and signatures of demographic change in populations, we used DnaSP version 5.0 (Librado and Rozas, 2009) and Arlequin version 3.11 (Excoffier et al., 2005) to calculate pairwise mismatch distribution and neutrality tests (Tajima's D and Fu's FS, Tajima, 1989; Fu, 1997). The sum of squared deviations (SSD) between the observed and expected mismatch distributions and raggedness index were computed by Arlequin version 3.11 (Excoffier et al., 2005). P-values were also calculated by this program.
Data Analysis of Microsatellite Markers
Dataset editing and formatting were performed in GenAlEx version 6.3 (Peakall and Smouse, 2006). To assess the genetic diversity of each locus and each population, we used GenAlEx version 6.3 (Peakall and Smouse, 2006) to calculate descriptive statistics, such as the number of alleles (Na), effective number of alleles (NE), number of private alleles (NP), expected heterozygosity (He), observed heterozygosity (HO), information index (I), percentage of polymorphic loci (PPB), and fixation index (FIS = 1-Ho/He) across all microsatellite loci. We mutually corrected statistics with FSTAT version 2.9.3 (Goudet, 1995) and POPGENE version 1.31 (Yeh et al., 1997). Total genetic diversity for species (HT), and coefficient of gene differentiation (GST) were estimated using FSTAT version 2.9.3 (Goudet, 1995), and the rarefied allelic richness (Ra) was also calculated by this program according to Leberg (2002). Linkage disequilibrium (LD) was also investigated at the 5% statistical significance level among loci pairs with 1,000 permutations using this software and then corrected by the sequential Bonferroni method (Rice, 1989). Hardy-Weinberg equilibrium (HWE) was tested for each locus and each population using Genepop version 4.1.4 (Yeh et al., 1997). Arlequin version 3.11 (Excoffier et al., 2005) was used to compute the differentiation between pairwise populations with FST, as well as to estimate historical gene flow between population pairs using Wright's principles Nm = (1 − FST)/4FST (Wright, 1931). In addition, the ratio (r) of pollen to seed gene flow was estimated according to Ennos' (1994) formula: r = [(1/FST(B) − 1) − 2 (1/FST(M) − 1)]/(1/FST(M) − 1), in which FST(B) and FST(M) were F statistics for nSSRs and cpDNA markers calculating by Arlequin respectively.
By performing Mantel tests, isolation by distance (IBD) was tested by analyzing the correlation of FST/(1 − FST) with geographic distance for all population pairs using GenAlEx version 6.3 (Peakall and Smouse, 2006). The genetic structures of sampled populations were estimated through an unweighted pair group mean analysis (UPGMA) using TFPGA version 1.3 (Miller, 1997) with 5,000 permutations. Principal coordinates analysis (PCA) was visualized R software by ape package to assess genetic relationship at individual levels (Paradis et al., 2004). An admixture model-based cluster method was implemented with SSR data using STRUCTURE version 2.2 (Pritchard et al., 2000). Models were tested for K-values of 1–7 with 20 independent runs per set and a burn-in of 1 × 10⁵ iterations and 1 × 10⁵ subsequent MCMC steps. The second-order rate of change of the log probability, with respect to the number of clusters (ΔK), was used as an additional estimator of the likeliest number of genetic clusters (Evanno et al., 2005). The optimal number of clusters was selected by plotting LnP(D) values against ΔK values in STRUCTURE HARVESTER version 0.6.8 (Earl, 2012).
To test for recent bottleneck events, we used BOTTLENECK version 1.2.02 (Piry et al., 1999). We explored the demographic history of populations using the stepwise mutation (SMM) and two-phased (TPM) models and a heterozygosity excess test. The computation was performed under two methods (Sign and Wilcoxon tests), which were applied as the numbers of population <20. Moreover, we computed the Garza-Williamsion index (GWI) using Arlequin version 3.11 (Excoffier et al., 2005). GWI detects genetic bottlenecks that lasted for several generations prior to the rapid demographic recovery of the population (Garza and Williamson, 2001; Williamson-Natesan, 2005). When 7 or more loci were analyzed, GWI was lower than the critical Mc value of 0.68, which indicated that the populations decreased in population size or vice versa (Garza and Williamson, 2001; Excoffier et al., 2005).
Result
cpDNA Sequences
The combined cpDNA sequences had a 2,089-bp consensus length. The consensus sequence contained the cpDNA fragments matk, psbA-trnH, and trnL-trnF, which are 842, 429, and 818 bp in length, respectively (GenBank accession numbers: KY400136-KY400147). A total of 17 variable sites were identified from the cpDNA dataset, containing 13 SNPs, 3 indels, and 14 segregating sites. Finally, 10 haplotypes (Hap1-10) were obtained from 7 populations of M. yunnanensis (Table 1 and Figure 1A). Except for Hap3, which was the most abundant haplotype with a wide distribution in 6 populations, other fixed haplotypes were unique in each population. The values of haplotype diversity (Hd) and nucleotide diversity per site (Pi) in total populations were 0.471 and 1.06, respectively (Table 1). The highest values (Hd = 0.575, Pi = 1.45) occurred in population YL, followed by TJ (0.525, 0.83), and SM (0.467, 0.22); whereas no diversity was found in the 3 remaining populations (BY, JC, and SY). Total genetic diversity (HT = 0.522) was higher than the average intrapopulation diversity (Hs = 0.243). The permutation test revealed a higher value for NST (0.728) than GST (0.534) in M. yunnanensis populations. The difference between the two statistics, however, was not significant (P > 0.05). This result indicated the absence of phylogenetic structure among populations. Moreover, the AMOVA result indicated significant genetic differentiation among all populations (FST = 0.636, P < 0.01) with most chloroplast diversity occurring among populations (63.56% of the total variance) compared with only 36.44% partitioned within populations (Table 2).
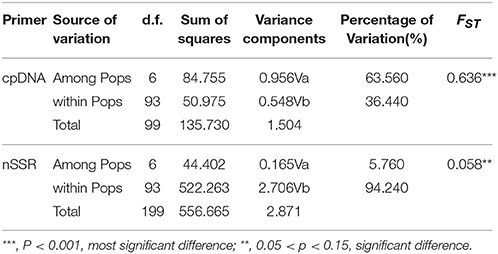
Table 2. Analysis of molecular variance (AMOVA) based on cpDNA and nSSR for populations of M. yunnanensis.
The phylogenetic relationships among the haplotypes, which were obtained via neighbor-joining and Bayesian methods, revealed that 10 cpDNA haplotypes clustered into 2 clades (Figure 2). The neighbor-joining consensus tree was further clarified to show that Hap 4 was closely related to Hap 5, Hap 3 was more closely related to Hap 7 than Hap 8, and Hap 9 was more closely related to Hap 10 than Hap 6 (Figure 2B). The results of the genealogical haplotype network diagram supported the congruent phylogenetic relationships of the cpDNA haplotypes, which showed that Hap 3 and Hap 9 were distributed in the central position and that the remaining haplotypes were distributed in the outside nodes of the reticulate evolutionary diagram (Figure 1B). This distribution pattern predicted that Hap 3 and Hap 9 likely represent the ancestral haplotypes for this geographic area. Hap 3, which was the most abundant haplotype, was widely distributed in most populations.
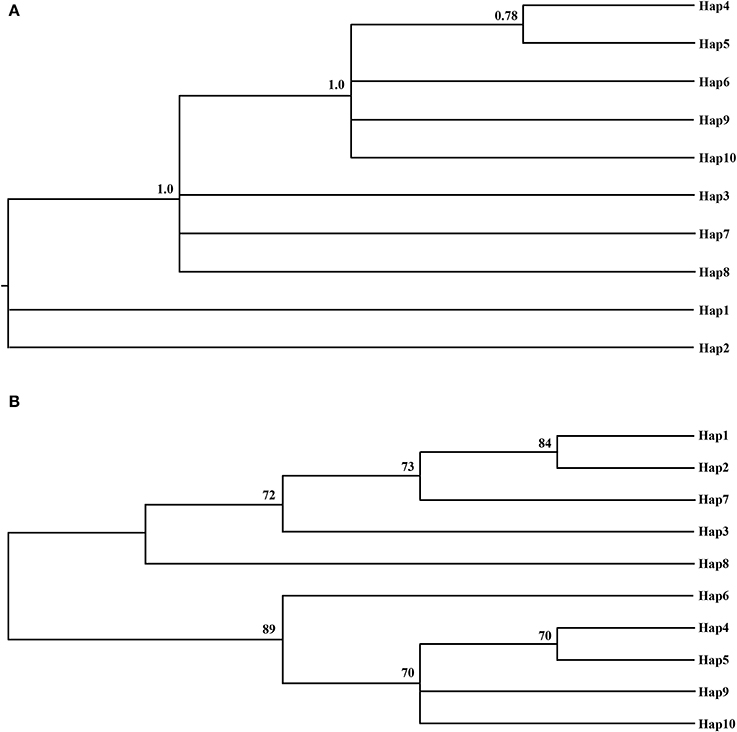
Figure 2. The Bayesian tree (A) and the Neighbor-joning consensus tree (NJ) (B) based on haplotypes of combined cpDNA sequences. The numbers on branches indicate the posterior probability and bootstraps values, respectively.
The neutrality test showed that between Fu and Li'D values, Fu and Li'F were positive, whereas the values of Tajima's D and Fu'Fs were negative but non-significant (Supplementary Table S1). These results indicated the low probability of recent population expansion in M. yunnanensis. Moreover, the mismatch distribution analysis, which used a multimodal graph (Supplementary Figure 1A) indicated no recent population expansion and had a SSD of 0.058 (P = 0.083) and a HRag of 0.204 (P = 0.241; Supplementary Table S1).
The Bayesian skyline plot showed the demographic scenario of the species. M. yunnanensis maintained a constant population size for a long time until ~20,000–30,000 years ago when a contraction event occurred (Supplementary Figure 1B).
SSR Data
A total of 88 alleles were identified in 10 polymorphic loci, ranging from 3 (ssr22) to 22 (ssr27) among 7 M. yunnanensis populations with an average of 8.8 alleles per locus (Supplementary Table S2). As presented in Supplementary Table S3, except for 3 (ssr14, 22, 27, P < 0.001) loci, almost all the remaining loci conform to the equilibrium state in HWE test (P > 0.05). Five of the 45 locus pairwise showed LD (P < 0.05) after Bonferroni correction, but not significant. Diversity estimates from 10 microsatellites varied among populations (Table 3). The total number of alleles (NT) of each population varied from 38 (SM) to 46 (QZ); rarefied allelic richness (Ra) varied from 3.539 (YL) to 4.175 (BY); number of private alleles (NP) varied from 2 (SM) to 9 (QZS); and percentage of polymorphic loci (PPB) varied from 90% (BY, TJ, SY, QZS) to 100% (SM, YL, JC). The lowest values of observed heterozygosity (HO = 0.513) and expected heterozygosity (HE = 0.513) all occurred in population SY, whereas the maximum values of observed heterozygosity (HO = 0.605) and expected heterozygosity (HE = 0.581) were distributed in YL and TJ populations, respectively. The above parameters showed that M. yunnanensis populations have a relatively high genetic diversity.
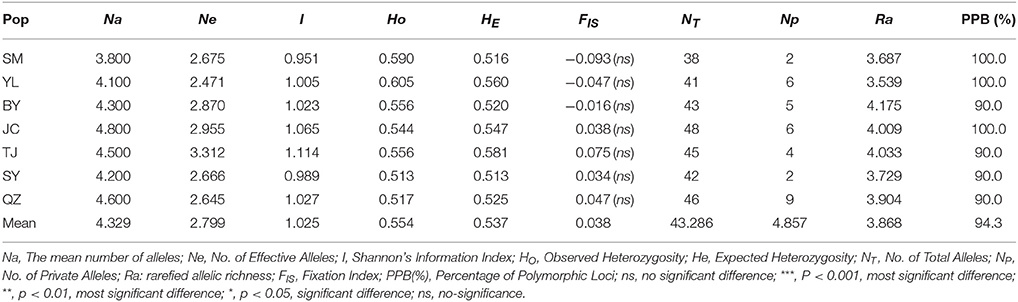
Table 3. Genetic diversity of populations in M. yunnanensis.
Unlike the cpDNA sequences analysis results, AMOVA analysis of SSR data showed that 94.24 and 5.76% of genetic variation were partitioned in and among populations, respectively (Table 2). Evidence of inbreeding was not found in any population because we did not find any significant fixation index values (FIS, Supplementary Table S2, Table 3). A low genetic differentiation was observed among populations (FST = 0.058). Estimates of gene flow between each pair of the 7 populations are shown in Table 4. The maximum gene flow was generated from SM and JC populations (14.184), whereas the minimum gene flow was generated from TJ and JC populations (0.660). The ratio of pollen to seed gene flow was 26.3791. The dendrogram obtained with the UPGMA clustering method showed that the 7 M. yunnanensis populations were separated into two clusters with high bootstrap values (100) (Figure 3). Similarly, PCA grouped natural populations into two clusters at the individual level but failed to cluster individuals at the population level (Supplementary Figure 2). STUCTURE analysis, which used the ΔK method, showed that the optimal K-value was 4 for ΔK = 3.362 and the second fit value was 3 for ΔK = 2.712, although a higher degree of admixture might be noticed. However, the results either from K = 4 or K = 3 both failed to differentiate populations (Figure 4). The correlation between genetic and geographic distances, as determined by mantel tests, were not significant (P = 0.10) and indicated no significant effect of IBD (Supplementary Figure 3).
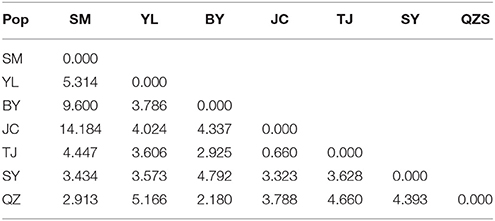
Table 4. The gene flow between 7 populations of M. yunnanensis.
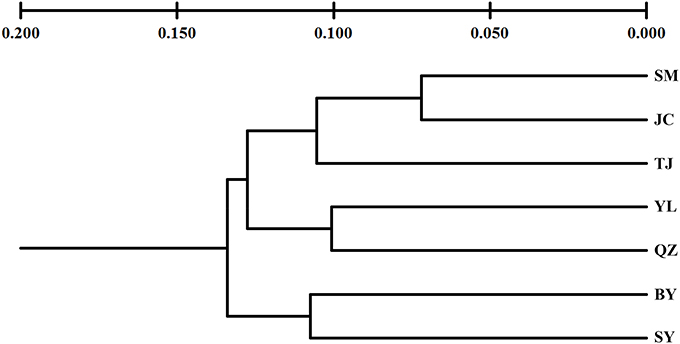
Figure 3. An unweighted pair-group method with arithmetic averages (UPGMA) phenogram of 7 populations of M. yunnanensis, based on microsatellite markers.
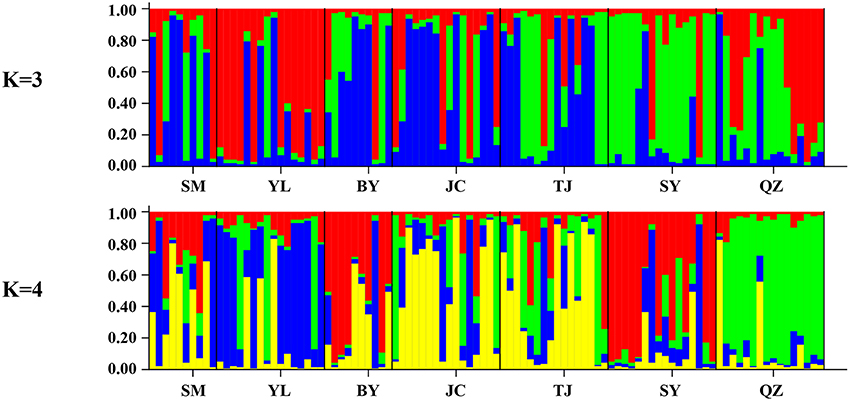
Figure 4. Bayesian inference of number of clusters (K = 3 and K = 4) for M. yunnanensis.
Bottleneck analysis showed that the allele distribution per population was a normal L-shaped distribution under TPM and SMM, which conformed to the mutation-drift equilibrium. Non-significant probabilities of Wilcoxon and Sign tests (P > 0.05) indicated that all populations did not experience a recent bottleneck event (Table 5). However, all the GWI (Table 5) of 7 populations were lower than the critical Mc value of 0.68, which indicated that M. yunnanensis populations underwent a historical demographic reduction.
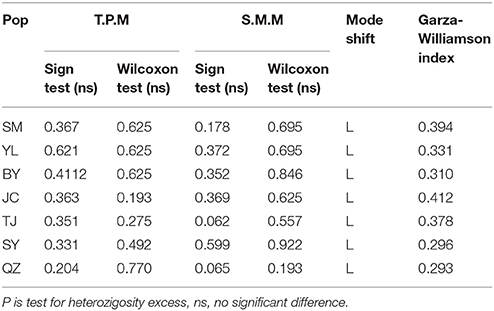
Table 5. Bottleneck analysis for 7 populations of M. yunnanensis.
Discussion
Genetic Diversity of M. yunnanensis
In general, rare or endemic species with small populations always have low levels of genetic diversity (Poudel et al., 2014; Yoichi and Tomaru, 2014). However, previous studies have reported high levels of genetic diversity in some small population species (Wu et al., 2015; Meng et al., 2016). The present study revealed that M. yunnanensis is characterized by relatively higher genetic diversity than other related species, such as M. coriacea (Zhao et al., 2012), M. maudiae (Sun et al., 2011), and M. formosana (Lu et al., 2002). Notably, the values of within-population genetic diversity (He = 0.588) in M. yunnanensis were considerably higher than the values of “narrow” species (He = 0.420) and approached those of “widespread” species (He = 0.620, Nybom, 2004). Life span, reproductive mode, and breeding system are the most important factors in genetic diversity (Nybom, 2004; Feng et al., 2014; Wu et al., 2015). Outcrossing species tend to have higher genetic diversity and heterozygosity than self-pollinated ones, and massive gene flows mitigate the loss of genetic diversity through genetic drift (Nybom, 2004). The present study detected high gene flow for M. yunnanensis, which has an outcross breeding system (Qi, 2000). Moreover, negative or close to zero FIS values proved the high outcrossing rate of the species. The genetic variation of a species reflects its long-term evolution and adaptation to climate changes (Feng et al., 2014): a remnant perennial usually maintains higher levels of intrapopulation genetic diversity than short-lived species (Nybom, 2004). Thus, the high genetic diversity observed in M. yunnanensis may be attributed to its long-lived habit.
Genetic Differentiation and Structure in M. yunnanensis
In M. yunnanensis, 5.76% of genetic variation was partitioned among populations for SSR markers, whereas 63.56% genetic variation was partitioned among populations for cpDNA. We preliminarily speculated that this discordance is usually related to the different markers and a high level of effective gene flow. In general, the comparative analysis between biparentally and maternally inherited microsatellite markers provides complementary, but often contrasting information on genetic structure and differentiation because of their different inheritance modes and evolutionary rates (Birky et al., 1989). Han et al. (2015) also proposed that cpDNA variation reflects a past change in population demographics, whereas microsatellite variation infers recent events in the population. Thus, we inferred low genetic differentiation among current populations of M. yunnanensis. This result supported the conclusion that range-restricted or endemic species generally exhibit lower differentiation among populations (Nybom and Bartish, 2000).
Genetic structure is determined by demography and gene flow, as well as the scale and temporal stability of the environment used by a given species to complete its life cycle (Côté et al., 2013). A topoclimate with long-term stability provides a favorable environment for plants and pollinators (Gugger et al., 2013). In the present study, the relative contribution of pollen to seed gene flow was 26.3791, which indicated that pollen dispersal played an extremely important role in weakening the genetic structure of M. yunnanensis. Furthermore, the widely distributed haplotype (Hap 3) deeply decreased the level of differentiation among populations. Therefore, we speculated that substantial gene flow likely caused the low genetic differentiation and indistinct phylogeographic structure of M. yunnanensis (Allendorf, 1983).
Population assignment cannot provide an optimal phylogeographic structure when difference between populations is low (Sun et al., 2011). We found that the correlation between genetic and geographic distances was non-significant among M. yunnanensis populations (P > 0.05), although the evolutionary trees and genealogical haplotype network showed two reciprocally monophyletic lineages with robust support. However, based on a meta-analysis of isolation by distance, Jenkins et al. (2010) proposed that IBD studies included more populations were more likely to obtain a significant correlation between species' genetic and geographic distances. In addition, the sample size can have a significant effect on the estimation of expected heterozygosity nSSR markers (Nybom, 2004; Poudel et al., 2014). Although previous studies suggest that 20 to 30 individuals should be sampled in microstallite studies, they were also proposed that genetic diversity is prerequisite for research on endangered or endemic populations even if sample sizes are less than ideal (Hale et al., 2012; Pruett and Winker, 2008). Therefore, considering the relative small sample size in the present study, we suggest that the species' genetic characteristics requires further investigation by expanding the sampling scale.
Demographic History of the M. yunnanensis Populations
Bottleneck analysis indicated that no recent bottleneck event occurred in M. yunnanensis. However, the Bayesian skyline plot for cpDNA showed that the populations significantly decreased ~20,000–30,000 years ago. The result is supported by the microsatellite-based GWI (GWI < MC). Thus, we speculated that Quaternary glaciers (20,000–30,000 years ago) may have affected the genetic variations and structure of this long-lived species (Hewitt, 2000; Gugger et al., 2013). M. yunnanensis responded to glacial and interglacial influences in different ways, such as shifting the latitude or elevation of their ranges, population expansion, and population contraction (Davis and Shaw, 2001). As a remnant plant from the last glacial period, the current geographical distribution of M. yunnanensis may be related to climate oscillation (Hewitt, 2000; Gong et al., 2015), which formed the foundation of current genetic variations in M. yunnanensis (Qiao et al., 2010).
The neutrality test and mismatch distribution indicated that no recent population expansion occurred in this species. M. yunnanensis is different from some surviving glacial plants, such as Tetracentron sinense (Sun et al., 2014) and Taxus wallichiana (Gao et al., 2007), but is similar to Ginkgo biloba (Gong et al., 2008) and Cathaya argyrophylla (Wang and Ge, 2006). These differences and similarities likely resulted from the propagation system and seed dispersal capability of M. yunnanensis (Cheng et al., 2015). Seed dispersal is limited by the plant's large, heavy seeds. Moreover, the species' seed dispersal vectors have decreased because of habitat damage (Han et al., 2010). Beyond limitations on the seed itself, however, most seeds suffer negative effects from human disturbance during dispersal and collection by local residents.
Conclusion
Information on the genetic diversity, genetic structure, and demographic history of endemic species can aid the development of appropriate conservation and management strategies. In the present study, the genetic variation and demographic history of seven wild M. yunnanensis populations were first investigated with microsatellite markers and cpDNA sequences. The plant showed high levels of genetic diversity and low levels of genetic differentiation among populations. Given that a high number of private haplotypes and high microsatellite diversity, populations SM, YL, TJ, QZ should be considered as distinct evolutionary significant units (ESUs). These populations with a wider genetic base may be significant to adapt future scenarios and used as source material for germplasm banks and/or nurseries (Poudel et al., 2014). In addition, species with low levels of genetic differentiation will not suffer major reductions in genetic diversity upon the loss of a population (Dodd and Helenurm, 2002), the conservation and management of M. yunnanensis should focus on exotic overexploitation and habitat destruction. Little evidence of inbreeding and high gene flow was detected. Reduced gene flow may be expected, however, given that the species is undergoing dramatic population decline and isolation.
Through the comprehensive analysis of demographic history, we observed that M. yunnanensis has undergone a past population contraction ~20,000–30,000 years ago. This event was likely influenced by Quaternary glaciations. Furthermore, no recent population expansion occurred in this species because of their limited seed dispersal over long distances and human interference. Therefore, we suggest establishing protection zones or plots in the distribution areas of M. yunnanensis, controlling seed collection and minimizing the habitat destruction by local people. Moreover, we advise relevant local departments to develop corresponding conservation actions and mitigation measures to utilize M. yunnanensis, as well as to raise conservation awareness and implement rational management in distribution areas.
Author Contributions
SS, XZ, and YW initiated and designed the research. SS obtained funding for this study. XZ, FW, and SS collected the materials and performed the experiments, SS and XZ analyzed the data and wrote the paper. All authors read and approved the manuscript.
Funding
This study was financially supported by grant 31560224 and 31360155 from the National Natural Science Foundation of China.
Conflict of Interest Statement
The authors declare that the research was conducted in the absence of any commercial or financial relationships that could be construed as a potential conflict of interest.
Acknowledgments
We thank Wenjing Dong, Guansong Yang, and Yingxiong Su at Yunnan University for their help for in sample collection. We also thank Dr. Feng Xiuyan at Kunming Institute of Botany, Chinese Academy of Sciences for her help in data analysis.
Supplementary Material
The Supplementary Material for this article can be found online at: http://journal.frontiersin.org/article/10.3389/fpls.2017.00583/full#supplementary-material
References
Allendorf, F. W. (1983). Isolation, gene flow, and genetic differentiation among populations. Genet. Conserve. 18, 51–65.
Birky, C. W. Jr., Fuerst, P., and Maruyama, T. (1989). Organelle gene diversity under migration, mutation, and drift: equilibrium expectations, approach to equilibrium, effects of heteroplasmic cells, and comparison to nuclear genes. Genetics 121, 613–627.
Cheng, B. B., Zheng, Y. Q., and Sun, Q. W. (2015). Genetic diversity and population structure of Taxus cuspidata in the Changbai Mountains assessed by chloroplast DNA sequences and microsatellite markers. Biochem. Syst. Ecol. 63, 157–164. doi: 10.1016/j.bse.2015.10.009
Côté, C. L., Gagnaire, P. A., Bourret, V., Verreault, G., Castonguay, M., and Bernatchez, L. (2013). Population genetics of the American eel (Anguilla rostrata): FST = 0 and North Atlantic Oscillation effects on demographic fluctuations of a panmictic species. Mol. Ecol. 22, 1763–1776. doi: 10.1111/mec.12142
Davis, M. B., and Shaw, R. G. (2001). Range shifts and adaptive responses to Quaternary climate change. Science 292, 673–679. doi: 10.1126/science.292.5517.673
Dodd, S. C., and Helenurm, K. (2002). Genetic diversity in Delphinium variegatum (Ranunculaceae): a comparison of two insular endemic subspecies and their widespread mainland relative. Am. J. Bot. 89, 613–622. doi: 10.3732/ajb.89.4.613
Doyle, J. (1991). “DNA protocols for plants–CTAB total DNA isolation,” in Molecular Techniques in Taxonomy, eds G. M. Hewitt and A. Johnson (Berlin: Springer-Verlag), 283–293.
Drummond, A. J., and Rambaut, A. (2007). BEAST: bayesian evolutionary analysis by sampling trees. BMC Evol. Biol. 7:214. doi: 10.1186/1471-2148-7-214
Earl, D. A. (2012). STRUCTURE HARVESTER: a website and program for visualizing STRUCTURE output and implementing the Evanno method. Conserv. Genet. Resour. 4, 359–361. doi: 10.1007/s12686-011-9548-7
Ennos, R. A. (1994). Estimating the relative rates of pollen and seed migration among plant populations. Heredity 72, 250–259. doi: 10.1038/hdy.1994.35
Evanno, G., Regnaut, S., and Goudet, J. (2005). Detecting the number of clusters of individuals using the software STRUCTURE: a simulation study. Mol. Ecol. 14, 2611–2620. doi: 10.1111/j.1365-294X.2005.02553.x
Excoffier, L., Laval, G., and Schneider, S. (2005). Arlequin (version 3.0): an integrated software package for population genetics data analysis. Evol. Bioinform. Online 1, 47–50.
Excoffier, L., Smouse, P. E., and Quattro, J. M. (1992). Analysis of molecular variance inferred from metric distances among DNA haplotypes: application to human mitochondrial DNA restriction data. Genetics 131, 479–491.
Feng, X. Y., Wang, Y., and Gong, X. (2014). Genetic diversity, genetic structure and demographic history of Cycas simplicipinna (Cycadaceae) assessed by DNA sequences and SSR markers. BMC Plant Bio. 14:187. doi: 10.1186/1471-2229-14-187
Fu, Y. X. (1997). Statistical tests of neutrality of mutations against population growth, hitchhiking and background selection. Genetics 147, 915–925.
Gao, L. M., Möller, M., Zhang, X. M., Hollingsworth, M. L., Liu, J., Mill, R. R., et al. (2007). High variation and strong phylogeographic pattern among cpDNA haplotypes in Taxus wallichiana (Taxaceae) in China and North Vietnam. Mol. Ecol. 16, 4684–4698. doi: 10.1111/j.1365-294X.2007.03537.x
Garza, J. C., and Williamson, E. G. (2001). Detection of reduction in population size using data from microsatellite loci. Mol. Ecol. 10, 305–318. doi: 10.1046/j.1365-294x.2001.01190.x
Gong, W., Chen, C., Dobeš, C., Fu, C. X., and Koch, M. A. (2008). Phylogeography of a living fossil: pleistocene glaciations forced Ginkgo biloba L. (Ginkgoaceae) into two refuge areas in China with limited subsequent postglacial expansion. Mol. Phylogenet. Evol. 48, 1094–1105. doi: 10.1016/j.ympev.2008.05.003
Gong, Y. Q., Zhan, Q. Q., Nguyen, K. S., Nguyen, H. T., Wang, Y. H., and Gong, X. (2015). The historical demography and genetic variation of the endangered Cycas multipinnata (Cycadaceae) in the red river region, examined by chloroplast DNA sequences and microsatellite markers. PLoS ONE 10:e0117719. doi: 10.1371/journal.pone.0117719
Goudet, J. (1995). FSTAT (version 1.2): a computer program to calculate F-statistics. J. Hered. 86, 485–486. doi: 10.1093/oxfordjournals.jhered.a111627
Graur, D., and Li, W. H. (2000). Fundamentals of Molecular Evolution. Sunderland, MA: Sinauer Associates Sunderland.
Gugger, P. F., Ikegami, M., and Sork, V. L. (2013). Influence of late Quaternary climate change on present patterns of genetic variation in valley oak, Quercus lobata Née. Mol. Ecol. 22, 3598–3612. doi: 10.1111/mec.12317
Hale, M. L., Burg, T. M., and Steeves, T. E. (2012). Sampling for microsatellite-based population genetic studies: 25 to 30 individuals per population is enough to accurately estimate allele frequencies. PLoS ONE 7:e45170. doi: 10.1371/journal.pone.0045170
Hall, T. A. (1999). BioEdit: a user-friendly biological sequence alignment editor and analysis program for Windows 95/98/NT. Nucleic Acids Symp. Ser. 41, 95–98.
Han, C. Y., Welbaum, G., and Long, C. L. (2010). Seed dormancy and germination of Michelia yunnanensis (Magnoliaceae). Sci. Hortic. 124, 83–87. doi: 10.1016/j.scienta.2009.11.021
Han, Q. X., Higashi, H., Mitsui, Y., and Setoguchi, H. (2015). Distinct phylogeographic structures of wild radish (Raphanus sativus L. var. raphanistroides Makino) in Japan. PLoS ONE 10:e0135132. doi: 10.1371/journal.pone.0135132
Han, Y. C., Teng, C. Z., Chang, F. H., Robert, G. W., Zhou, M. Q., Hu, Z. L., et al. (2007). Analyses of genetic relationships in Nelumbo nucifera using nuclear ribosomal ITS sequence data, ISSR and RAPD markers. Aquat. Bot. 87, 141–146. doi: 10.1016/j.aquabot.2007.04.005
Hao, X. Y. (1999). Studies on the chemical constituents of the essential oil of Tsoongiodendron odorum and Michelia yunnanensis. Guizhou Forest. Sci. Tech. 4, 287–290.
Hewitt, G. (2000). The genetic legacy of the Quaternary ice ages. Nature 405, 907–913. doi: 10.1038/35016000
Hu, G. P., Fang, X. P., Yang, Z. N., and Chen, B. L. (2010). Study on the volatile components in different part of Michelia yunnanensis flower. J. Anhui. Agric. Sci. 38, 7321–7323. doi: 10.3969/j.issn.0517-6611.2010.14.069
Jenkins, D. G., Carey, M., Czerniewska, J., Fletcher, J., Hether, T., Jones, A., et al. (2010). A meta-analysis of isolation by distance: relic or reference standard for landscape genetics? Ecography 33, 315–320. doi: 10.1111/j.1600-0587.2010.06285.x
Kalia, R. K., Rai, M. K., Kalia, S., Singh, R., and Dhawan, A. K. (2011). Microsatellite markers: an overview of the recent progress in plants. Euphytica 177, 309–334. doi: 10.1007/s10681-010-0286-9
Landey, R. B., Cenci, A., Georget, F., Bertrand, B., Camayo, G., Dechamp, E., et al. (2013). High genetic and epigenetic stability in Coffea arabica plants derived from embryogenic suspensions and secondary embryogenesis as revealed by AFLP, MSAP and the phenotypic variation rate. PLoS ONE 8:e56372. doi: 10.1371/journal.pone.0056372
Leberg, P. L. (2002). Estimating allelic richness: effects of sample size and bottlenecks. Mol. Ecol. 11, 2445–2449. doi: 10.1046/j.1365-294X.2002.01612.x
Li, J. M., Li, Q. Q., and Xiao, L. Q. (2012). Development of microsatellite markers in Parakmeria nitida (Magnoliaceae). Am. J. Bot. 99, e234–e236. doi: 10.3732/ajb.1100526
Librado, P., and Rozas, J. (2009). DnaSP v5: a software for comprehensive analysis of DNA polymorphism data. Bioinformatics 25, 1451–1452. doi: 10.1093/bioinformatics/btp187
Lu, B. Y., and Zhu, L. F. (1984). The preliminary research of chemical composition of headspace volatile in flower of Michelia yunnanensis. J. Guihaia 4, 145–148.
Lu, S. Y., Hong, K. H., Liu, S. L., Cheng, Y. P., Wu, W. L., and Chiang, T. Y. (2002). Genetic variation and population differentiation of Michelia formosana (Magnoliaceae) based on cpDNA variation and RAPD fingerprints: relevance to post-Pleistocene recolonization. J. Plant Res. 115, 0203–0216. doi: 10.1007/s102650200026
Meng, J., He, S. L., Li, D. Z., and Yi, T. S. (2016). Nuclear genetic variation of Rosa odorata var. gigantea (Rosaceae): population structure and conservation implications. Tree Genet. Genomes 12, 1–14. doi: 10.1007/s11295-016-1024-9
Miller, M. P. (1997). Tools for population genetic analyses (TFPGA) 1.3: a Windows program for the analysis of allozyme and molecular population genetic data. Comput. Softw. 4:157.
Mutegi, S. M., Muchugi, A., Carsan, S., Kariba, R., Jamnadass, R., Oballa, P., et al. (2016). Genetic diversity of the African poplar (Populus ilicifolia) populations in Kenya. Tree Genet. Genomes 12, 1–7. doi: 10.1007/s11295-016-1013-z
Nybom, H. (2004). Comparison of different nuclear DNA markers for estimating intraspecific genetic diversity in plants. Mol. Ecol. 13, 1143–1155. doi: 10.1111/j.1365-294X.2004.02141.x
Nybom, H., and Bartish, I. V. (2000). Effects of life history traits and sampling strategies on genetic diversity estimates obtained with RAPD markers in plants. Perspect. Plant Ecol. Evol. Syst. 3, 93–114. doi: 10.1078/1433-8319-00006
Paradis, E., Claude, J., and Strimmer, K. (2004). APE: analyses of phylogenetics and evolution in R language. Bioinformatics 20, 289–290. doi: 10.1093/bioinformatics/btg412
Peakall, R., and Smouse, P. E. (2006). GENALEX 6: genetic analysis in excel. Population genetic software for teaching and research. Mol. Ecol. Notes 6, 288–295. doi: 10.1111/j.1471-8286.2005.01155.x
Piry, S., Luikart, G., and Cornuet, J. (1999). BOTTLENECK: a computer program for detecting recent reductions in the effective size using allele frequency data. J. Hered. 90, 502–503. doi: 10.1093/jhered/90.4.502
Pons, O., and Petit, R. J. (1996). Measuring and testing genetic differentiation with ordered versus unordered alleles. Genetics 144, 1237–1245.
Poudel, R. C., Möller, M., Li, D. Z., Shah, A., and Gao, L. M. (2014). Genetic diversity, demographical history and conservation aspects of the endangered yew tree Taxus contorta (syn. Taxus fuana) in Pakistan. Tree Genet. Genomes 10, 653–665. doi: 10.1007/s11295-014-0711-7
Pritchard, J. K., Stephens, M., and Donnelly, P. (2000). Inference of population structure using multilocus genotype data. Genetics 155, 945–959.
Pruett, L. C., and Winker, K. (2008). The effects of sample size on population genetic diversity estimates in song sparrows Melospiza melodia. J. Avian. Biol. 39, 252–256. doi: 10.1111/j.0908-8857.2008.04094.x
Qi, S. H. (2000). Studies on Pollination Biology of Michelia yunnanensis. Kunming: Yunnan University (in Chinese).
Qiao, Q., Zhang, C. Q., and Milne, R. I. (2010). Population genetics and breeding system of Tupistra pingbianensis (Liliaceae), a naturally rare plant endemic to SW China. J. Syst. Evol. 48, 47–57. doi: 10.1111/j.1759-6831.2009.00064.x
Ram, S. G., Parthiban, K. T., and Kumar, R. S. (2008). Genetic diversity among Jatropha species as revealed by RAPD markers. Genet. Resour. Crop Evol. 55, 803–809. doi: 10.1007/s10722-007-9285-7
Rambaut, A., and Drummond, A. (2004). Tracer, MCMC Trace Analysis Tool. Oxford. Available online at: http://tree.bio.ed.ac.uk/software/tracer/
Rice, W. R. (1989). Analyzing tables of statistical tests. Evolution 43, 223–225. doi: 10.2307/2409177
Ronquist, F., and Huelsenbeck, J. P. (2003). MrBayes 3: bayesian phylogenetic inference under mixed models. Bioinformatics 19, 1572–1574. doi: 10.1093/bioinformatics/btg180
Song, J., Li, S. F., Liu, L. N., Li, S. F., Xie, W. J., and Guan, W. L. (2013). Phenotypic diversity of natural populations of Michelia yunnanensis. Acta Bot. Boreal. Occident. Sin. 33, 272–279. doi: 10.3969/j.issn.1000-4025.2013.02.010
Sun, Y., Liu, Y. F., Wang, J., Guo, Y., and Huang, H. W. (2010). Ten polymorphic microsatellite markers in Michelia maudiae (Magnoliaceae). Am. J. Bot. 97, e157–e158. doi: 10.3732/ajb.1000332
Sun, Y., Moore, M. J., Yue, L., Feng, T., Chu, H., Chen, S., et al. (2014). Chloroplast phylogeography of the East Asian Arcto-Tertiary relict Tetracentron sinense (Trochodendraceae). J. Biogeogr. 41, 1721–1732. doi: 10.1111/jbi.12323
Sun, Y., Wen, X., and Huang, H. (2011). Genetic diversity and differentiation of Michelia maudiae (Magnoliaceae) revealed by nuclear and chloroplast microsatellite markers. Genetica 139, 1439–1447. doi: 10.1007/s10709-012-9642-0
Swindell, S. R., and Plasterer, T. N. (1997). SEQMAN//Sequence Data Analysis Guidebook. New York, NY: Humana Press. 75–89.
Swofford, D. L. (2002). PAUP*:Phylogenetic Analysis Using Parsimony (and Other Methods), Version 4.0b10. Sunderland, MA: Sinauer Associates.
Tajima, F. (1989). Statistical method for testing the neutral mutation hypothesis by DNA polymorphism. Genetics 123, 585–595.
Tamura, K., Stecher, G., Peterson, D., Filipski, A., and Kumar, S. (2013). MEGA6: molecular evolutionary genetics analysis version 6.0. Mol. Boil. Evol. 30, 2725–2729. doi: 10.1093/molbev/mst197
Wambulwa, M. C., Meegahakumbura, M. K., Chalo, R., Kamunya, S., Muchugi, A., Xu, J. C., et al. (2016). Nuclear microsatellites reveal the genetic architecture and breeding history of tea germplasm of east Africa. Tree Genet. Genomes 12, 1–10. doi: 10.1007/s11295-015-0963-x
Wang, H. W., and Ge, S. (2006). Phylogeography of the endangered Cathaya argyrophylla (Pinaceae) inferred from sequence variation of mitochondrial and nuclear DNA. Mol. Ecol. 15, 4109–4122. doi: 10.1111/j.1365-294X.2006.03086.x
Williamson-Natesan, E. G. (2005). Comparison of methods for detecting bottlenecks from microsatellite loci. Conserv. Genet. 6, 551–562. doi: 10.1007/s10592-005-9009-5
Wu, F. Q., Shen, S. K., Zhang, X. J., Wang, Y. H., and Sun, W. B. (2015). Genetic diversity and population structure of an extremely endangered species: the world's largest Rhododendron. AoB Plants 7:plu082. doi: 10.1093/aobpla/plu082
Wuyun, T., Amo, H., Xu, J., Ma, T., Uematsu, C., and Katayama, H. (2015). Population structure of and conservation strategies for wild Pyrus ussuriensis Maxim in China. PloS ONE 10:e0133686. doi: 10.1371/journal.pone.0133686
Yeh, F. C., Yang, R., Boyle, T. B., Ye, Z., and Mao, J. X. (1997). POPGENE, the user-friendly shareware for population genetic analysis. Mol. Biol. Biotech. Centre University of Alberta, Alberta, 20r25.
Yoichi, W., and Tomaru, N. (2014). Patterns of geographic distribution have a considerable influence on population genetic structure in one common and two rare species of Rhododendron (Ericaceae). Tree Genet. Genomes 10, 827–837. doi: 10.1007/s11295-014-0723-3
Yuan, Q. J., Zhang, Z. Y., Peng, H., and Ge, S. (2008). Chloroplast phylogeography of Dipentodon (Dipentodontaceae) in southwest China and northern Vietnam. Mol. Ecol. 17, 1054–1065. doi: 10.1111/j.1365-294X.2007.03628.x
Zhao, X. F., Ma, Y., Sun, W., Wen, X., and Milne, R. (2012). High genetic diversity and low differentiation of Michelia coriacea (Magnoliaceae), a critically endangered endemic in southeast Yunnan, China. Int. J. Mol. Sci. 13, 4396–4411. doi: 10.3390/ijms13044396
Keywords: genetic diversity, endemic plant, gene flow, ornamental shrub, microsatellite markers, populations contraction
Citation: Zhang X, Shen S, Wu F and Wang Y (2017) Inferring Genetic Variation and Demographic History of Michelia yunnanensis Franch. (Magnoliaceae) from Chloroplast DNA Sequences and Microsatellite Markers. Front. Plant Sci. 8:583. doi: 10.3389/fpls.2017.00583
Received: 04 January 2017; Accepted: 31 March 2017;
Published: 21 April 2017.
Edited by:
Badri Padhukasahasram, Illumina (United States), USAReviewed by:
Peter J. Prentis, Queensland University of Technology, AustraliaYessica Rico, Institute of Ecology (INECOL), Mexico
Copyright © 2017 Zhang, Shen, Wu and Wang. This is an open-access article distributed under the terms of the Creative Commons Attribution License (CC BY). The use, distribution or reproduction in other forums is permitted, provided the original author(s) or licensor are credited and that the original publication in this journal is cited, in accordance with accepted academic practice. No use, distribution or reproduction is permitted which does not comply with these terms.
*Correspondence: Shikang Shen, yunda123456@126.com; ssk168@ynu.edu.cn
†Present Address: Xue Zhang, Shikang Shen, Fuqin Wu and Yuehua Wang, School of Life Science, Yunnan University, Yunnan, China