 Yuxiang Huang1,2,3†
 Hexin Tan3†
 Jian Yu3
 Yue Chen1,3
 Zhiying Guo1,3
 Guoquan Wang1
 Qinglei Zhang1,3Junfeng Chen4Lei Zhang3*
 Yong Diao1*
- 1School of Biomedical Sciences, Huaqiao University, Quanzhou, China
- 2School of Pharmacy, Quanzhou Medical College, Quanzhou, China
- 3School of Pharmacy, Second Military Medical University, Shanghai, China
- 4Department of Pharmacy, Changzheng Hospital, Second Military Medical University, Shanghai, China
Baphicacanthus cusia (Nees) Bremek, the plant source for many kinds of drugs in traditional Chinese medicine, is widely distributed in South China, especially in Fujian. Recent studies about B. cusia mainly focus on its chemical composition and pharmacological effects, but further analysis of the plant's gene functions and expression is required to better understand the synthesis of its effective compounds. Real-time quantitative polymerase chain reaction (RT-qPCR) is a powerful method for gene expression analysis. It is necessary to select a suitable reference gene for expression normalization to ensure the accuracy of RT-qPCR results. Ten candidate reference genes were selected from the transcriptome datasets of B. cusia in this study, and the expression stability was assessed across 60 samples representing different tissues and organs under various conditions, including ultraviolet (UV) irradiation, hormonal stimuli (jasmonic acid methyl ester and abscisic acid), and in different plant organs. By employing different algorithms, such as geNorm, NormFinder, and BestKeeper, which are complementary approaches based on different statistical procedures, 18S rRNA was found to be the most stable gene under UV irradiation and hormonal stimuli, whereas ubiquitin-conjugating enzyme E2 was the best suitable gene for different plant organs. This novel study aimed to screen for suitable reference genes and corresponding primer pairs specifically designed for gene expression studies in B. cusia, in particular for RT-qPCR analyses.
Introduction
Baphicacanthus cusia (Nees) Bremek (Figure S1), widely distributed in Southern China, is the only plant belonging to the family Acanthaceae. Its roots are used as a traditional Chinese medicine, named “Nan-Ban-Lan-Gen” (National Pharmacopoeia Committee, 2015), for its antibacterial, antiviral, and immunoregulatory effects in treating colds, fever, and influenza, and especially severe acute respiratory syndrome (Sun et al., 2008). Its leaves and stems are used to extract indigo naturalis (Qingdai). Previous studies have shown that Qingdai is used to treat leukemia (Li et al., 2011; Hu et al., 2014), ulcerative colitis (Suzuki et al., 2013; Fan et al., 2014), oral cancer (Lo and Chang, 2013), and psoriasis (Lin et al., 2012). Numerous active compounds have been identified from B. cusia to date, such as indole alkaloids, quinazolinone alkaloids, monoterpenes, triterpenes, flavonoids, sterols, anthraquinones, benzoxazinones, and lignans. Of these ingredients, the pharmaceutical activities of indole alkaloids are most frequently reported for their leukocyte-inhibitory, anti-inflammatory, and antiviral activities (Li et al., 1993; Wu et al., 2005; Huang et al., 2014). Recently, indirubin, tryptanthrin, and isorhamnetin were successfully characterized, and their anti-leukemia effects were validated (Wu X. X. et al., 2016). These compounds are secondary metabolites synthesized during normal plant growth or in response to environmental stresses (Borowski et al., 2014). The stress response mechanism of B. cusia to harsh environmental conditions needs to be explored to better understand its role in producing active ingredients. At present, the genetic information of B. cusia for molecular biology research is limited in public databases, which makes further in-depth studies more difficult. The mRNA has recently been sequenced, and the partial contigs have already been deposited into the National Center for Biotechnology Information (NCBI) database (SRR4428209) to accelerate genetic studies in B. cusia.
Plants have established exceedingly complex molecular mechanisms to survive adverse environmental conditions, and the primary mechanism is induced at a transcriptional level when stresses are present (Nakashima et al., 2009; Tran et al., 2010). Moreover, studies show that most hormones can regulate plant physiological activities, and exogenous plant hormones can improve plant resistance to variable environments (Bari and Jones, 2009). For example, abscisic acid (ABA) is called “stress hormone” in plants because it plays an important role in resisting drought, salinity, and heat (Tuteja, 2007). Jasmonic acid methyl ester (MeJA) plays a key role in plant defense and growth (Zhang M. et al., 2015). Moreover, ultraviolet (UV)-B and MeJA were applied in combination for their synergistic effects on the expression levels of key genes in the biosynthetic pathway (Wang et al., 2016).
RNA sequencing (RNA-Seq), a transcriptome-based next-generation sequencing technique, has revolutionized the genome-wide gene expression analysis in various species (Wang et al., 2009; Stone and Storchova, 2015). The main outcome of RNA-Seq data is the identification of differentially expressed genes. It is also used to search for reference genes. Real-time quantitative polymerase chain reaction (RT-qPCR) is a sensitive, specific, and reproducible technique widely used to analyze the expression of genes in different organisms and tissues under different conditions (Bustin, 2002; Andersen et al., 2004; Caldana et al., 2007). Consequently, it has become the method of choice for validating candidate genes with a large sample of individuals and replicates. However, it is necessary to select suitable reference genes as internal controls under different experimental conditions for accurate RT-qPCR evaluation because of the variability in initial material, RNA integrity, RT-PCR efficiency, and RT-qPCR efficiency (Derveaux et al., 2010). Further, gene expression can be highly tissue specific and differentiated based on the physiological status of the organism or experimental treatments.
Many recent studies (Exposito-Rodriguez et al., 2008; Liu et al., 2012) have proved that it is necessary to verify the expression stability of a candidate reference gene in each species prior to its use for normalization. In this regard, several free Excel-based statistical algorithms such as geNorm (Vandesompele et al., 2002), NormFinder (Andersen et al., 2004), and BestKeeper (Pfaffl, 2001) permit the identification of the best internal controls from a set of candidate normalization genes in a given series of biological samples. They have been successfully employed to identify the most stable reference genes in animals, microorganisms, human diseases, and various plant species, such as parsley (Li M. Y. et al., 2016), Chrysanthemum morifolium (Qi et al., 2016), Camellia sinensis (Wu Z. J. et al., 2016), Oxytropis ochrocephala (Wang et al., 2015), and Gentiana macrophylla (He et al., 2016). Besides these software programs, the best suitable reference gene should be evaluated with target genes associated with experimental conditions to obtain reliable results. B. cusia is still a less-studied species at the molecular level. Terpenoid indole alkaloids (TIAs), derivatives of shikimate and terpenoid pathways, are important medicinal ingredients in B. cusia, and they are activated in response to hormonal stresses (Schluttenhofer et al., 2014; Zhang W. et al., 2015). Shikimate kinase and 1-deoxy-D-xylulose 5-phosphate reductoisomerase (DXR) are the main enzymes involved in the synthesis of TIAs (Veau et al., 2000; Kasai et al., 2005). Therefore, the genes coding for them are interesting target genes that may be able to testify the reliability of the reference genes under different experimental conditions.
The stability of 10 commonly used reference genes based on the transcriptome datasets of B. cusia was evaluated by RNA-Seq (unpublished data) in this study to identify potential reference genes suitable for transcript normalization in experiments under UV irradiation and hormonal stimuli (MeJA and ABA), and also in different plant organs. Moreover, the expression of two target genes, BcSK and BcDXR, was investigated to demonstrate the suitability of the selected reference genes.
Materials and Methods
Plant Material and Treatments
Field-grown samples of B. cusia were collected from perennial dominant Shufeng Farm in Fujian, China (25°25 N 118°39C). The organ-specific series of samples (root, stem, leaf, and flower) were collected from flowering plants. Stress treatments were applied to 6-month-old plants before flowering. For UV irradiation, plants with soil were transferred into flowerpots and placed under a UV-B transilluminator (0.2 mW cm−2) for 3 h, and then the viable leaves were selected. The overground parts were sprayed with a solution containing either 100 μM MeJA or 100 μM ABA. Then, tissue samples, mainly comprising viable leaves, were collected at 0, 2, 4, 6, 8, 12, and 24 h after treatment. All samples were separately collected in three biological repeats. So, a total of 60 samples were analyzed, consisting of 12 organ-specific samples (root, stem, leaf, and flower) and 48 stress-treated samples (MeJA-, ABA-, and UV-treated leaves). After collection, the samples were immediately frozen in liquid N2 and stored at −80°C until further use.
Total RNA and Genomic DNA Isolation and cDNA Synthesis
The frozen samples were ground to a fine powder in liquid N2 using a pestle and mortar. The total RNA was extracted from all plant tissue samples using a Column Plant Total RNA Kit (TransGen Biotech, China) following the manufacturer's recommendations. The concentration of RNA samples was determined using a NanoDrop 2000 spectrophotometer (Thermo, America) at 260 nm, whereas its purity was assessed based on absorbance ratios at 260/280 nm. Samples with an optical density absorption ratio at OD260/280 between 1.9 and 2.2 and OD260/230 <2.0 were used for cDNA synthesis. The integrity of purified RNA was confirmed using agarose gel electrophoresis and ethidium bromide staining. Genomic DNA was isolated from young leaves (100 mg) using the cetyltrimethyl ammonium bromide method and checked by agarose electrophoresis. First-strand cDNAs were synthesized using the TransScript One-Step gDNA Removal and cDNA Synthesis SuperMix (TransGen Biotech, China), by adding Oligo (dT) primer, gRemover, E-mix, and R-mix to 1 μg of total RNA. RNase-free water was added to the prior mixture, and the total volume (20 μL) was incubated at 42°C for 15 min according to the manufacturer's protocol. Reverse transcriptase was inactivated by incubating the mixture at 85°C for 5 min, and the cDNA solution was stored at −20°C.
Transcriptome Data Mining for Candidate Reference Genes
Transcriptome sequencing of different B. cusia organs (root, stem, and leaf) was performed using the Illumina Hi-Seq 2500 platform (Illumina, America). After assembly and annotation, RNA-Seq by Expectation Maximization (Li and Dewey, 2011) was used to analyze the read counts, which were then converted into fragments per kilobase of exon per million reads mapped (FPKM) values, a commonly accepted estimate for the expression level of unigenes (Trapnell et al., 2010).
On the basis of previous studies, 10 candidate reference genes (Table 1) belonging to different functional classes were selected to avoid possible co-regulation of the genes. This group of genes comprised several classical housekeeping genes commonly used as internal control for expression studies. The sequences of candidate reference genes were obtained from the transcriptome database. The open reading frame sequences of these genes were cloned (Figure S2). The full-length cDNA sequences of the candidate reference genes are provided in Data S1. Moreover, a “tblastx” (NCBI) was run with the candidate gene sequences on non-redundant database using the default settings of the online program to identify B. cusia homologs. The candidate reference genes tested are listed in Table 1 with their respective reference(s) where they were first described.
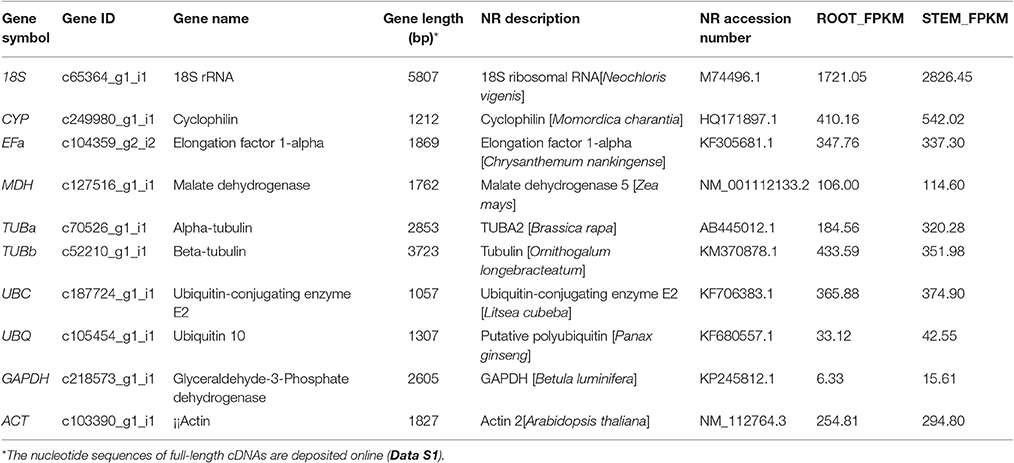
Table 1. Characteristics of the candidate reference genes in transcriptome datasets of B. cusia.
Primer Design and PCR Amplification Efficiency
The amplification primers for real-time PCR were designed using the Primer3 software (http://www.simgene.com/Primer3) (Rozen and Skaletsky, 2000) as a criterion to amplify products from 158 to 249 bp with a temperature of 40–60°C (primer sequences are shown in Table 2). Amplification primers were targeted to different exons to control genomic DNA contamination. The performance of the designed primers (Table 2) was tested by PCR using either B. cusia cDNA or genomic DNA templates (Figure S3). The presence of spurious products of amplification caused by genomic DNA was also continuously checked by verifying RT-qPCR dissociation profile. A template-free control reaction was run to ensure the absence of contamination or primer–dimer formation for each primer pair. The PCR amplification efficiency was determined for each primer combination using the slope of the standard curve obtained by plotting the fluorescence versus a given concentration of a mixture of all sample cDNAs (ranging from 1:1 to 1:10,000 dilution of the cDNA mixture sample) using the equation: E = 10(−1/slope) – 1 (Ruijter et al., 2009), and the values were used in all subsequent analyses (Table 2).
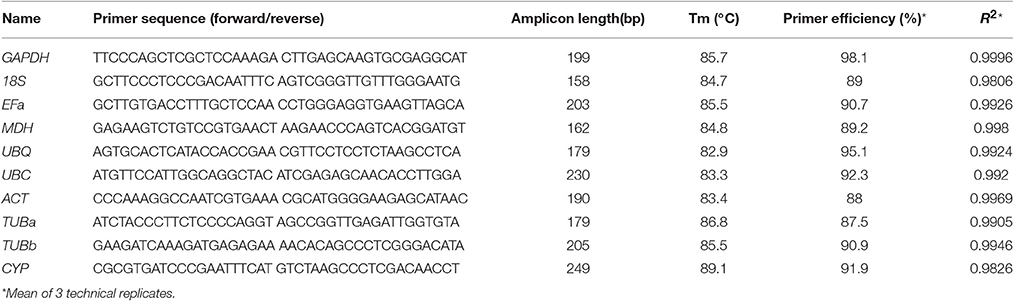
Table 2. Primer sequences of selected candidate reference genes, primers, and amplicon characteristics.
Real-Time Quantitative Polymerase Chain Reaction
Real-time amplification reactions were performed using SYBR Green detection chemistry and run in 96-well plates with the Thermal Cycler Dice TP800 (TaKaRa, Japan). Reactions were performed in a total volume of 20 μL containing 2.0 μL of template, 0.5 μL of each amplification primer, 10.0 μL of 2 × Top Green qPCR SupperMix (TransGen Biotech, China), and 7.0 μL of ddH2O. All reaction components without template were used as a negative control. The amplification program was set as follows: initial denaturation step of 95°C for 30 s to activate the DNA polymerase, followed by 40 cycles of denaturation at 95°C for 5 s and annealing at 60°C for 30 s. The amplification process was followed by a melting curve analysis, ranging from 60 to 95°C. Amplicon-based fluorescence thresholds were used to obtain the Ct-values. All RT-qPCR reactions were carried out in triplicate, both technically and biologically. The final quantification cycle (Cq) values were the mean of nine values (biological triplicate, each in technical triplicate). Melting curve analysis of the amplification products and gel electrophoresis analysis confirmed that the primers amplified only a single product (data not shown).
The expression of target genes BcSK and BcDXR, which were important in the synthesis of compounds in B. cusia, was analyzed using the selected reference genes to validate the reference gene selection. The changes in relative expression levels were calculated using the 2ΔΔCt method (Pfaffl, 2001). Furthermore, the expression levels of both were compared with the FPKM values in RNA-Seq data in some samples (Table S1).
Statistical Analysis of Gene Expression Stability
The suitability of candidate control genes across all the experimental sets was evaluated using three statistical algorithms, geNorm (version 3.5) (Vandesompele et al., 2002), NormFinder (Andersen et al., 2004), and BestKeeper (Pfaffl, 2001) programs, according to their respective protocols. For geNorm and NormFinder, the raw Ct-values of each gene were converted into the relative quantities using the formula 2−ΔCt (ΔCt = each corresponding Ct-value – lowest Ct-value). For BestKeeper, the Ct-value in the program was used directly. Genes with standard deviation (SD) >1 were considered to be unacceptable as reference genes. The pairwise variation (Vn/Vn+1) was calculated additionally using the geNorm software to determine the optimal number of reference genes needed to normalize; additional control gene was not required for normalization when V was <0.15 (Vandesompele et al., 2002).
The 60 samples were divided into 6 experimental sets and analyzed individually to achieve a more accurate expression analysis. Set 1 comprised 21 samples from the MeJA-induced B. cusia leaves, set 2 comprised 21 samples from the ABA-induced B. cusia leaves, set 3 comprised 6 samples from the UV-irradiated B. cusia leaves, set 4 comprised12 samples from different organs (root, stem, leaf, and flower) of B. cusia, and set 5 which was defined as the stress group comprised samples from sets 1, 2, and 3. Also, the overall stability among the five sets and every variety was analyzed.
Results
Selecting Reference Genes Based on Transcriptome Datasets
A total of 10 genes were selected as candidate genes with their FPKM values, as shown in Table 1. They were glyceraldehyde-3-phosphate dehydrogenase (GAPDH), malate dehydrogenase (MDH), ubiquitin 10 (UBQ), ubiquitin-conjugating enzyme E2 (UBC), actin (ACT), 18S rRNA (18S), elongation factor 1-alpha (EFa), cyclophilin (CYP), alpha-tubulin (TUBa), and beta-tubulin (TUBb) housekeeping genes, and these genes have all been reported as stable genes in other species. The sequences of the 10 reference genes were obtained from the transcriptome database (Data S1). Gene characteristics are shown in Table 1. The full-length unigene sequences from transcriptome database, which were used to design the specific primers for RT-qPCR, could be obtained in NCBI (accession number SRR4428209).
Performance of Amplification Primers
The specificity and efficiency of each primer pair were assessed by amplification and dissociation curve analysis. First, the performance of the amplification primers was tested by real-time PCR using cDNA and gDNA as templates, respectively. A single band with the expected size (Table 2) was obtained in each case without signs of primer–dimer formation (Figure S3), and four primer pairs yielded amplicons longer than those obtained with a cDNA template (Figure S3), whereas primers for other genes were unable to amplify genomic sequences. Second, the melting curve analysis of the amplification products was performed by qPCR after 40 cycles of amplification. The presence of a single peak indicated that the expected amplicons were amplified (Figure S4). The amplicons were also examined by 1% agarose gel electrophoresis using ethidium bromide staining, and a single band of the expected size for each primer pair was observed. The correlation coefficients (R2) ranged between 0.9826 and 0.9996, and PCR amplification efficiencies between 87.5 and 98.1% (Table 2); both were results of three technical replicas. No signals were detected in no-template controls.
Expression Stability of Reference Genes
Real-time RT-PCR was conducted on the 60 cDNA samples with 10 primer pairs. The 10 candidate control genes displayed a relatively wide range of expression level with mean Ct-values between 14.3 (CYP) and 36.5 (TUBb) (Figure 1), suggesting that these reference genes were expressed at different levels in B. cusia. The genes with higher SD of Ct-values indicated more variable expression compared with those with lower SD, as shown in Table 4.
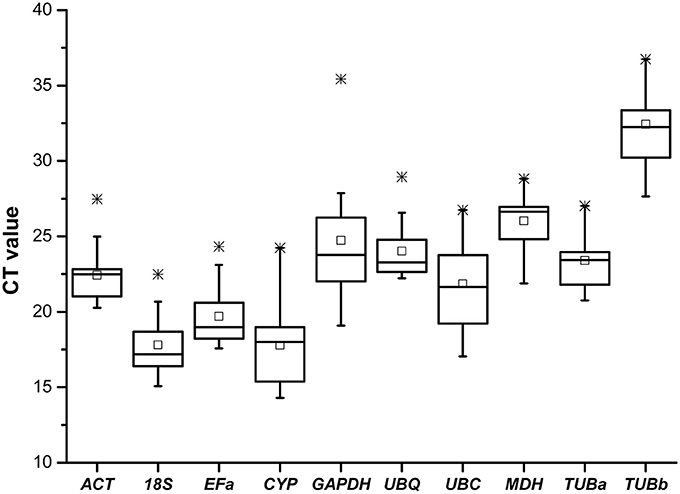
Figure 1. Cycle threshold (Ct) values of 10 candidate reference genes across all samples. The final Ct-value of each sample was the mean of three biological and technical replicates. Box graph indicates the interquartile range. A line across the box is shown as the median. Lower and upper dashes represent the minimum and maximum values, respectively; middle panes show the mean values. *Represents the extremum value.
geNorm Analysis
The geNorm program classifies the stability of gene expression by calculating the average expression stability (M). Stably expressed genes have values below 1.5, and an M-value more than 1.5 indicates lower expression stability (Vandesompele et al., 2002). The ranking order according to the M value is depicted in Figure 2. As determined by geNorm, 18S and EFa were the most stable reference genes in total samples. In contrast, GAPDH and UBC were the least stable reference genes. Under each subset, the two best reference genes in MeJA stress were CYP and UBQ with the lowest M-value. The most preferred genes for normalization in the ABA stress were MDH and TUBa. The two most stable reference genes in UV stress were CYP and MDH. As for the various organs, 18S and TUBb were the most stable reference genes. Furthermore, the best stable control genes in the stress group (set 5) were 18S and EFa.
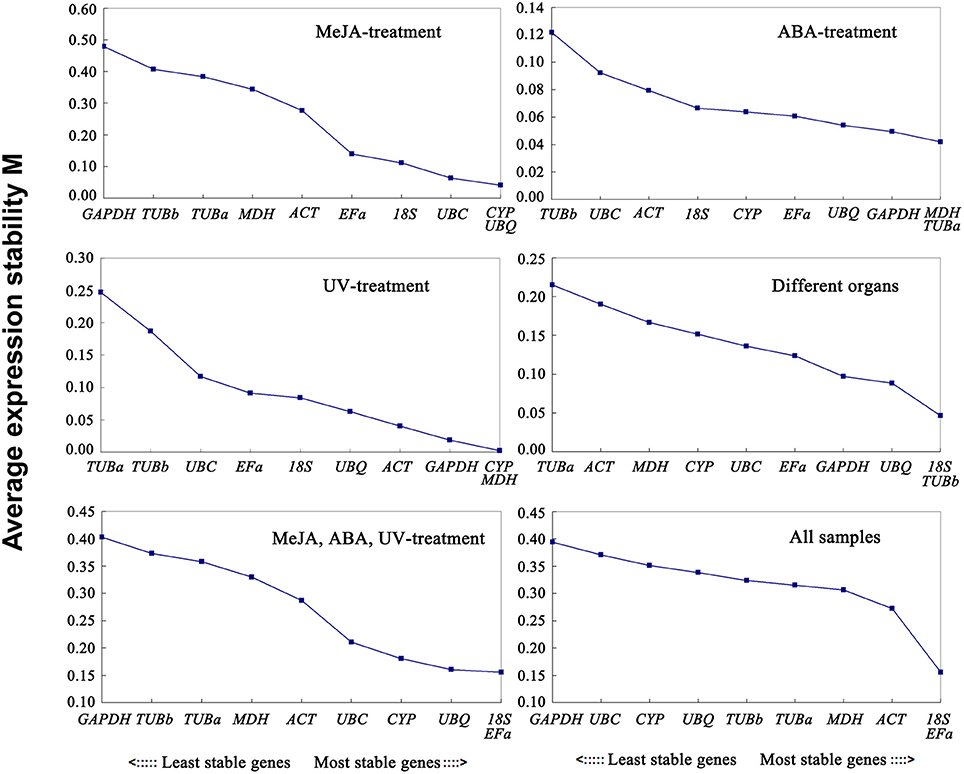
Figure 2. Expression stability values of 10 candidate reference genes calculated by geNorm. Lower M-values indicate more stable expression. Ranking of the gene expression stability was performed in all subset samples. The least stable genes were on the left and the most stable genes on the right.
The optimal number of reference genes required for accurate normalization was determined by the pairwise variation (V). The Vn/Vn+1 values were below 0.15 under all experimental conditions (Figure 3), indicating that one stable reference gene was enough to obtain accurate results.
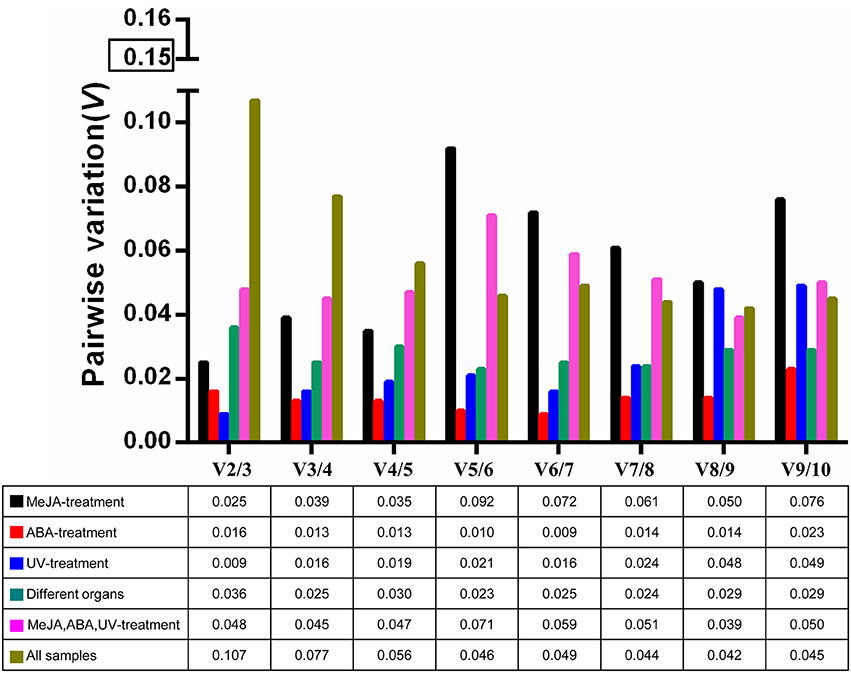
Figure 3. Pairwise variation (V) of 10 candidate reference genes calculated by geNorm to determine the optimal number of reference genes for accurate normalization. The threshold is 0.15.
NormFinder Analysis
The NormFinder program is another visual basic application tool for Microsoft Excel used to determine expression stabilities of reference genes. It ranks genes based on the stability value for each reference gene. More stable gene expression has the lower stability value. Moreover, this algorithm suggests the best pair of genes among the candidate reference genes analyzed using the intra- and intergroup variance. The stability values of reference genes were calculated by NormFinder, as shown in Table 3. In the subset of MeJA stress, 18S and EFa were the most stable. In ABA stress, MDH and GAPDH were the most stable. In UV stress, the top two stably expressed genes were CYP and MDH. In different normal organs (non-stress group), UBC and EFa were the top two stably expressed genes. In set 5, EFa and UBQ were the most highly ranked. When evaluating the total experimental samples, UBQ and 18S were the top ranked genes (Table 3). In contrast, GAPDH was the least stable reference gene under MeJA stress, TUBb was the least stable under ABA stress, and TUBa was the least stable under UV irradiation and normal organs. TUBa was also the least stably expressed gene in set 5 and the second least stably expressed in total samples. The rank in NormFinder was slightly different from that in geNorm. Genes considered as the most stable by geNorm (18S and EFa) ranked second and third by NormFinder, respectively.
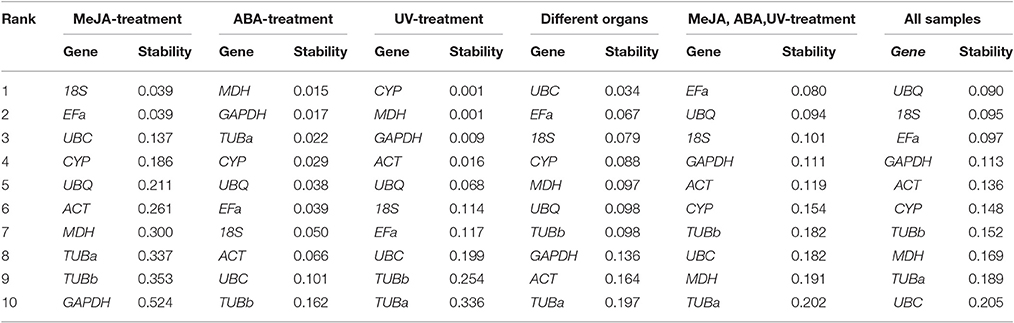
Table 3. Candidate genes ranked according to their expression stability as determined by NormFinder.
BestKeeper Analysis
The BestKeeper algorithm evaluates the stabilities of candidate reference genes based on the CV ± SD values. In the MeJA stress set, 18S (2.65 ± 0.36) and UBQ (1.85 ± 0.46) with lowest CV ± SD values were somewhat similar to the results of geNorm and NormFinder. In the ABA stress set, MDH (0.78 ± 0.21) and UBQ (0.98 ± 0.22) were considered as the most stable genes. In the UV stress treatment, 18S (0.11 ± 0.02) and EFa (0.22 ± 0.04) were identified as the best reference genes for normalization. As for the subsequent three subsets, 18S was the best stable gene, which was consistent with the result of geNorm (Table 4).
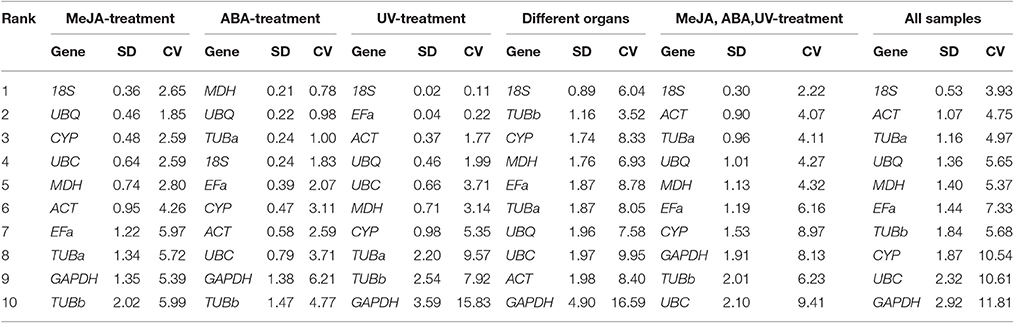
Table 4. Expression stability of 10 candidate reference genes calculated by BestKeeper.
Assessment of Normalization in Sample Subsets
The comprehensive rankings of the candidate reference genes were determined using the RefFinder program online (http://fulxie.0fees.us/?type=reference). Data generated by the three programs across different experimental sets were further compared, as shown in Table 5. The top- and low-ranked candidate reference genes were selected for normalizing two target genes BcSK and BcDXR under different experimental conditions. The result (Figure 4) showed that the expression level of BcSK and BcDXR in B. cusia under MeJA treatment increased with the increase in induction time when 18S was used as a control but attained a different expression pattern with the least stable gene GAPDH. In ABA stress, the expression level of BcSK and BcDXR reached the highest at 6 h when using the most stable reference genes (18S) as the internal control, while the expression level was overestimated when the least stable genes were used (GAPDH). Similarly, the relative expression level of BcSK increased when normalized using the most stable genes (18S) in normal organs, while the expression level was overestimated when normalized using the least stable combination (GAPDH). The relative expression patterns of BcDXR were opposite when the foregoing two genes were used as controls. Meanwhile, UBC and TUBa, which showed the most and least stable genes, respectively, in different organs subset were used as the reference genes, and the expression levels of BcDXR and BcSK were generally identified with the expression profile in RNA-Seq (Figure 4). The result showed that UBC was more suitable for organs in B. cusia.
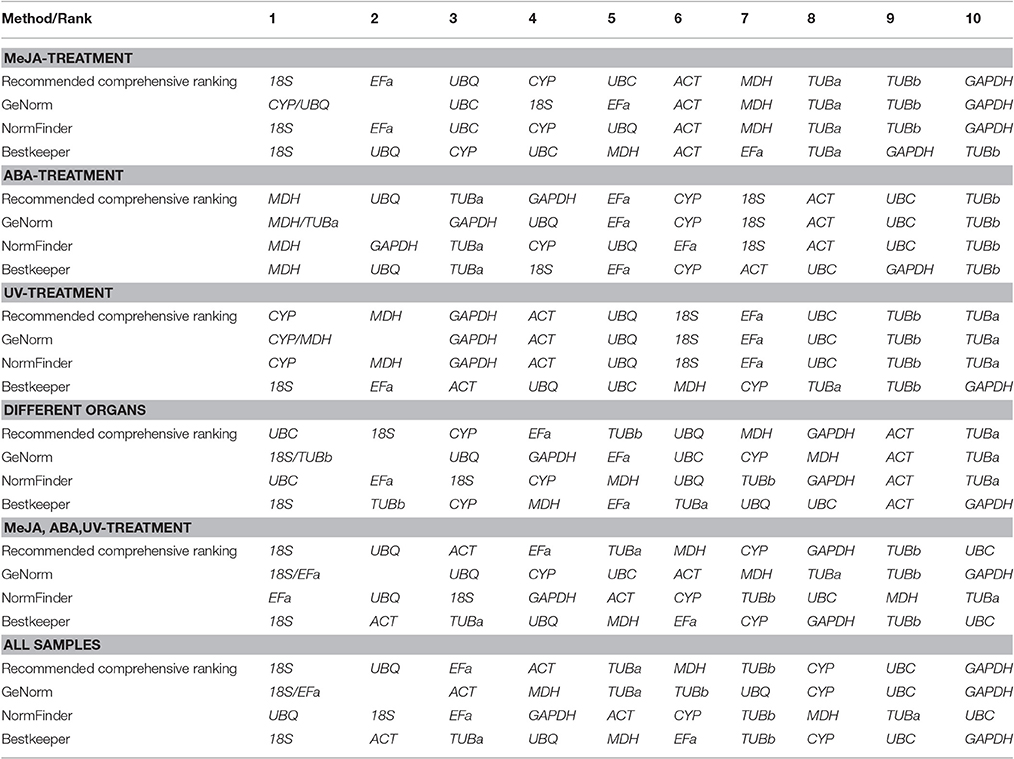
Table 5. Expression stability ranking of the 10 candidate reference genes.
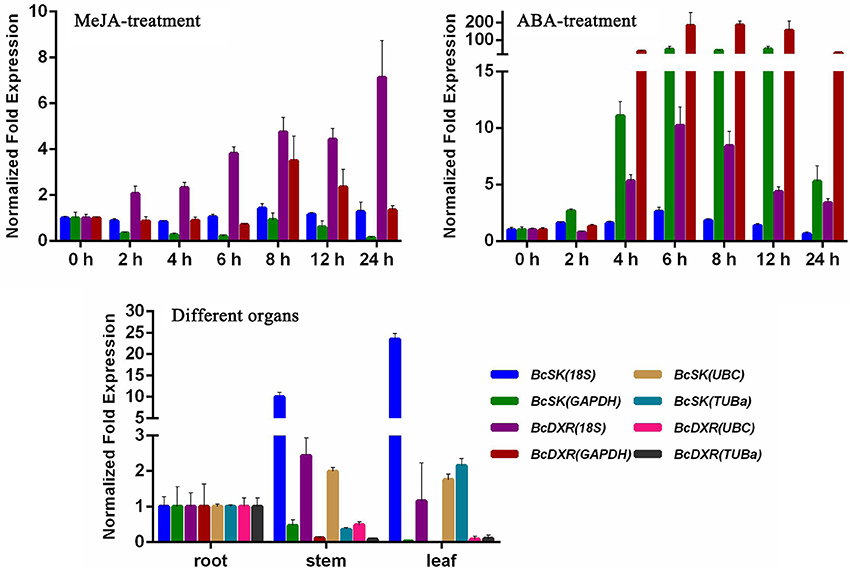
Figure 4. Relative expression patterns of BcSK and BcDXR under hormonal stimuli and organs. 18S, UBC, GAPDH, and TUBa were used as reference genes for expression normalization.
Discussion
RT-qPCR has become a broadly accepted method of choice for accurate expression profiling of target genes in the gene expression analysis (Nolan et al., 2006; VanGuilder et al., 2008). The accurate expression level of a selected gene requires appropriate internal controls, which are commonly called housekeeping or reference genes (Derveaux et al., 2010). The ideal control genes should be stably expressed under each experimental condition, independent of organs, tissues, developmental stages, and different treatments (Bustin et al., 2009). However, no universally suitable control genes are available, since numerous studies have reported that the expression of reference genes can also vary considerably with experimental conditions and different species (Reid et al., 2006; Wan et al., 2011; Galli et al., 2013; Li J. et al., 2016). Therefore, a set of potential housekeeping genes must be previously validated in each particular experimental subset. To date, few studies have compared and selected housekeeping genes in B. cusia. This has hindered the characterization of genes involved in different organisms and stress responses in B. cusia. This novel study performed the first large-scale transcriptome data analysis for B. cusia (unpublished), consisting of 293,666 unigenes, which were used for reference gene selection. The RNA-Seq data were useful sources for screening candidate housekeeping genes and represented an important strategy for large-scale reference gene selection for non-model plants (Zhuang et al., 2015).
Traditional genes, which are involved in cytoskeleton structure (ACT, TUBa, and TUBb), protein synthesis (EFα and 18S), biological metabolic processes (GAPDH and UBQ), and multifunctional proteins (CYP and MDH), are usually used as reference genes. In this study, the foregoing 10 common internal control genes of B. cusia were cloned (Figure S2) for expression normalization in 60 different samples, including UV irradiation, hormonal stimuli (MeJA and ABA), and different organs. This novel study reported a systematic analysis of reference genes that could be used in different treatment samples of B. cusia. The result demonstrated that each species might have its own suitable reference genes, which should be determined for each subset of experimental conditions.
Three different, yet complementary, statistical programs were used to identify the most suitable internal controls for the normalization of gene expression studies in B. cusia to minimize bias entrapped by the statistical approach. The results obtained from geNorm, NormFinder, and BestKeeper were not completely identical due to the different calculation programs (Jacob et al., 2013), especially under specific individual conditions. Similar findings were reported in other studies on rice (Kim et al., 2003), coffee (Cruz et al., 2009), tobacco (Delaney, 2010), and parsley (Li M. Y. et al., 2016). Furthermore, the RefFinder program (Xie et al., 2012) was used to generate a comprehensive ranking of candidate reference genes. As a result, 18S rRNA was the most stable gene in all subsets except ABA stimuli and UV irradiation, while GAPDH, TUBa, and TUBb yielded poor values in this study.
Reference genes varied in different tissues, organs, and experimental conditions in most previous studies. In rice, UBQ5 and EFa were the most stable genes in all the tissue samples, while 18S and 25S rRNAs were the most stable genes under various treatment conditions (Jain et al., 2006). However, another study showed that 18S and 25S rRNAs had the least stable expression at different developmental stages and in different varieties of rice (Li et al., 2010). Moreover, the selections of reference genes were not consistent in various species. ACT and TUBb in carrot (Tian et al., 2015) were the most suitable reference genes under “abiotic stress” and “hormonal stimuli,” but they were not suitable choices in the present study. Moreover, GAPDH showed a good performance in “hormonal stimuli” in parsley (Li M. Y. et al., 2016) but was the least stable in carrot. Also, GAPDH was the least stable gene in Eucalyptus spp. (Boava et al., 2010) and Petunia hybrida (Mallona et al., 2010). The results demonstrated that each species might choose its own stably expressed genes for each subset of experimental conditions. 18S rRNA is frequently used as the control gene for normalizing because it is independent of developmental stages and external stimuli (Gantasala et al., 2013). Moreover, the 26 reports (real-time RT-PCR carried out on barley; published in the period of January 1996 to March 2008) examined indicated that 18S rRNA was the most frequently used gene (8 times) among the 16 different reference genes used (Kozera and Rapacz, 2013).
The expression of BcSK and BcDXR genes was quantified in this study. BcSK and BcDXR were found to play important roles in the indole and carotenoid biosynthesis pathways, respectively. GeNorm is used in most studies because of its capacity to determine the number of genes necessary for normalization (Kozera and Rapacz, 2013). The pairwise variation (V) was analyzed in this study to determine the optimal number of genes required for normalization; the Vn/Vn+1 values were below 0.15 under all subset conditions (Figure 3), indicating that one stable reference gene was enough to obtain accurate results. Therefore, 18S rRNA and GAPDH were used to testify the expression levels of BcSK and BcDXR under stress conditions and different plant organs. The expression levels of BcSK and BcDXR increased with induction time in the MeJA treatment subset, verifying that TIAs are also induced by MeJA in B. cusia. Moreover, the more the expression of BcSK, which participates in the shikimate pathway, the higher the production of indigo (Figure S5). However, it decreases later because of branching to other aromatic compounds. Both the target genes had a peak expression at 6 h in the ABA stimuli subset as a result of the plant resistance to stress, conforming to the phenomenon that ABA not only promoted withering of an organism but could also improve disease resistance in plants. The expression pattern of both genes was generally identified with the expression profile in RNA-Seq in different plant organs.
In general, 18S rRNA is the best gene among all samples, whereas UBC is the most suitable gene for plant organs, thereby facilitating future studies on gene expression in B. cusia. However, normalization with multiple reference genes has become the commonly used method to avoid erroneous data that may be triggered by using a single reference gene. Therefore, based on transcriptome datasets, more novel and stable reference genes can be identified from other B. cusia samples in further studies.
Author Contributions
YH, HT, LZ, and YD conceived and designed the study. YH, JY, GW, and YC collected the tissue material and performed the experiments. YH, JC, ZG, and QZ performed data analysis. YH wrote the manuscript. All authors read and approved the final manuscript.
Conflict of Interest Statement
The authors declare that the research was conducted in the absence of any commercial or financial relationships that could be construed as a potential conflict of interest.
Acknowledgments
The authors thank Professor Wansheng Chen, Dr. Qing Li, and Dr. Ying Xiao for their kind suggestions and help in the study. This work was supported by funds from the National Natural Science Foundation of China (Grant nos. U1405215, 81673529, 31670292, 31300159, and 81325024), the Fujian Medicine and Education Joint Research Program of China (Grant no. WKJ-FJ-13), and Shanghai Science and Technology Development Funds (Grant no. 15391900500).
Supplementary Material
The Supplementary Material for this article can be found online at: http://journal.frontiersin.org/article/10.3389/fpls.2017.00668/full#supplementary-material
Figure S1. Photograph of B. cusia.
Figure S2. The amplification of ORF regions of candidate genes.
Figure S3. Performance of the amplification primers. Amplicons obtained by real-time PCR using cDNA (odd numbers) or gDNA (even numbers) as template, separated by agarose gel electrophoresis.
Figure S4. Melting curves generated for 10 candidate reference genes by qPCR in B. cusia.
Figure S5. Indigo content in leaves of B. cusia after MeJA induction.
Table S1. FPKM values of the target genes in transcriptome datasets of B. cusia.
Data S1. The full-length cDNA sequences of candidate genes. The ORF regions were highlighted in blue color.
References
Andersen, C. L., Jensen, J. L., and Orntoft, T. F. (2004). Normalization of real-time quantitative reverse transcription-PCR data: a model-based variance estimation approach to identify genes suited for normalization, applied to bladder and colon cancer data sets. Cancer Res. 64, 5245–5250. doi: 10.1158/0008-5472.CAN-04-0496
Bari, R., and Jones, J. D. (2009). Role of plant hormones in plant defence responses. Plant Mol. Biol. 69, 473–488. doi: 10.1007/s11103-008-9435-0
Boava, L. P., Laia, M. L., Jacob, T. R., Dabbas, K. M., Goncalves, J. F., Ferro, J. A., et al. (2010). Selection of endogenous genes for gene expression studies in Eucalyptus under biotic (Puccinia psidii) and abiotic (acibenzolar-S-methyl) stresses using RT-qPCR. BMC Res. Notes 3:43. doi: 10.1186/1756-0500-3-43
Borowski, J. M., Galli, V., Messias, R. S., Perin, E. C., Buss, J. H., Dos, A. E. S. S., et al. (2014). Selection of candidate reference genes for real-time PCR studies in lettuce under abiotic stresses. Planta 239, 1187–1200. doi: 10.1007/s00425-014-2041-2
Bustin, S. A. (2002). Quantification of mRNA using real-time reverse transcription PCR (RT-PCR): trends and problems. J. Mol. Endocrinol. 29, 23–39. doi: 10.1677/jme.0.0290023
Bustin, S. A., Benes, V., Garson, J. A., Hellemans, J., Huggett, J., Kubista, M., et al. (2009). The MIQE guidelines: minimum information for publication of quantitative real-time PCR experiments. Clin. Chem. 55, 611–622. doi: 10.1373/clinchem.2008.112797
Caldana, C., Scheible, W. R., Mueller-Roeber, B., and Ruzicic, S. (2007). A quantitative RT-PCR platform for high-throughput expression profiling of 2500 rice transcription factors. Plant Methods 3:7. doi: 10.1186/1746-4811-3-7
Cruz, F., Kalaoun, S., Nobile, P., Colombo, C., Almeida, J., Barros, L. M. G., et al. (2009). Evaluation of coffee reference genes for relative expression studies by quantitative real-time RT-PCR. Mol. Breed. 23, 607–616. doi: 10.1007/s11032-009-9259-x
Delaney, G. W. S. S. (2010). Stable internal reference genes for normalization of real-time RT-PCR in tobacco (Nicotiana tabacum) during development and abiotic stress. Mol. Genet. Genomics 283, 233–241. doi: 10.1007/s00438-010-0511-1
Derveaux, S., Vandesompele, J., and Hellemans, J. (2010). How to do successful gene expression analysis using real-time PCR. Methods 50, 227–230. doi: 10.1016/j.ymeth.2009.11.001
Exposito-Rodriguez, M., Borges, A. A., Borges-Perez, A., and Perez, J. A. (2008). Selection of internal control genes for quantitative real-time RT-PCR studies during tomato development process. BMC Plant Biol. 8:131. doi: 10.1186/1471-2229-8-131
Fan, H., Liu, X. X., Zhang, L. J., Hu, H., Tang, Q., Duan, X. Y., et al. (2014). Intervention effects of QRZSLXF, a Chinese medicinal herb recipe, on the DOR-β-arrestin1-Bcl2 signal transduction pathway in a rat model of ulcerative colitis. J. Ethnopharmacol. 154, 88–97. doi: 10.1016/j.jep.2014.03.021
Galli, V., da Silva Messias, R., dos Anjos e Silva, S. D., and Rombaldi, C. V. (2013). Selection of reliable reference genes for quantitative real-time polymerase chain reaction studies in maize grains. Plant Cell Rep. 32, 1869–1877. doi: 10.1007/s00299-013-1499-x
Gantasala, N. P., Papolu, P. K., Thakur, P. K., Kamaraju, D., Sreevathsa, R., and Rao, U. (2013). Selection and validation of reference genes for quantitative gene expression studies by real-time PCR in eggplant (Solanum melongena L). BMC Res. Notes 6:312. doi: 10.1186/1756-0500-6-312
He, Y., Yan, H., Hua, W., Huang, Y., and Wang, Z. (2016). Selection and validation of reference genes for quantitative real-time PCR in Gentiana macrophylla. Front. Plant Sci. 7:945. doi: 10.3389/fpls.2016.00945
Hu, X. M., Tanaka, S., Onda, K., Yuan, B., Toyoda, H., Ma, R., et al. (2014). Arsenic disulfide induced apoptosis and concurrently promoted erythroid differentiation in cytokine-dependent myelodysplastic syndrome-progressed leukemia cell line F-36p with complex karyotype including monosomy 7. Chin. J. Integr. Med. 20, 387–393. doi: 10.1007/s11655-013-1514-7
Huang, M., Lin, H. S., Lee, Y. S., and Ho, P. C. (2014). Evaluation of meisoindigo, an indirubin derivative: in vitro antileukemic activity and in vivo pharmacokinetics. Int. J. Oncol. 45, 1724–1734. doi: 10.3892/ijo.2014.2548
Jacob, F., Guertler, R., Naim, S., Nixdorf, S., Fedier, A., Hacker, N. F., et al. (2013). Careful selection of reference genes is required for reliable performance of RT-qPCR in human normal and cancer cell lines. PLoS ONE 8:e59180. doi: 10.1371/journal.pone.0059180
Jain, M., Nijhawan, A., Tyagi, A. K., and Khurana, J. P. (2006). Validation of housekeeping genes as internal control for studying gene expression in rice by quantitative real-time PCR. Biochem. Biophys. Res. Commun. 345, 646–651. doi: 10.1016/j.bbrc.2006.04.140
Kasai, K., Kanno, T., Akita, M., Ikejiri-Kanno, Y., Wakasa, K., and Tozawa, Y. (2005). Identification of three shikimate kinase genes in rice: characterization of their differential expression during panicle development and of the enzymatic activities of the encoded proteins. Planta 222, 438–447. doi: 10.1007/s00425-005-1559-8
Kim, B. R., Nam, H. Y., Kim, S. U., Kim, S. I., and Chang, Y. J. (2003). Normalization of reverse transcription quantitative-PCR with housekeeping genes in rice. Biotechnol. Lett. 25, 1869–1872. doi: 10.1023/A:1026298032009
Kozera, B., and Rapacz, M. (2013). Reference genes in real-time PCR. J. Appl. Genet. 54, 391–406. doi: 10.1007/s13353-013-0173-x
Li, B., and Dewey, C. N. (2011). RSEM: accurate transcript quantification from RNA-Seq data with or without a reference genome. BMC Bioinformatics 12:323. doi: 10.1186/1471-2105-12-323
Li, J., Jia, H., Han, X., Zhang, J., Sun, P., Lu, M., et al. (2016). Selection of reliable reference genes for gene expression analysis under abiotic stresses in the desert biomass willow, Salix psammophila. Front. Plant Sci. 7:1505. doi: 10.3389/fpls.2016.01505
Li, L., Liang, H. Q., Liao, S. X., Qiao, C. Z., Yang, G. J., and Dong, T. Y. (1993). Chemical studies of strobilanthes cusia. Acta Pharmaceutica Sinica 238–240. doi: 10.16438/j.0513-4870.1993.03.016
Li, M. Y., Song, X., Wang, F., and Xiong, A. S. (2016). Suitable reference genes for accurate gene expression analysis in parsley (Petroselinum crispum) for abiotic stresses and hormone stimuli. Front. Plant Sci. 7:1481. doi: 10.3389/fpls.2016.01481
Li, Q. F., Sun, S. S. M., Yuan, D. Y., et al. (2010). Validation of candidate reference genes for the accurate normalization of real-time quantitative RT-PCR data in rice during seed development. Plant Mol. Biol. Rep. 28:49. doi: 10.1007/s11105-009-0124-1
Li, Y., Ligr, M., McCarron, J. P., Daniels, G., Zhang, D., Zhao, X., et al. (2011). Natura-alpha targets forkhead box m1 and inhibits androgen-dependent and -independent prostate cancer growth and invasion. Clin. Cancer Res. 17, 4414–4424. doi: 10.1158/1078-0432.CCR-11-0431
Lin, Y. K., See, L. C., Huang, Y. H., Chang, Y. C., Tsou, T. C., Leu, Y. L., et al. (2012). Comparison of refined and crude indigo naturalis ointment in treating psoriasis: randomized, observer-blind, controlled, intrapatient trial. Arch. Dermatol. 148, 397–400. doi: 10.1001/archdermatol.2011.1091
Liu, D., Shi, L., Han, C., Yu, J., Li, D., and Zhang, Y. L. (2012). Validation of reference genes for gene expression studies in virus-infected Nicotiana benthamiana Using quantitative real-time, PCR. PLoS ONE 7:e46451. doi: 10.1371/journal.pone.0046451
Lo, W. Y., and Chang, N. W. (2013). An indirubin derivative, indirubin-3′-monoxime suppresses oral cancer tumorigenesis through the downregulation of survivin. PLoS ONE 8:e70198. doi: 10.1371/journal.pone.0070198
Mallona, I., Lischewski, S., Weiss, J., Hause, B., and Egea-Cortines, M. (2010). Validation of reference genes for quantitative real-time PCR during leaf and flower development in Petunia hybrida. BMC Plant Biol. 10:4. doi: 10.1186/1471-2229-10-4
Nakashima, K., Ito, Y., and Yamaguchi-Shinozaki, K. (2009). Transcriptional regulatory networks in response to abiotic stresses in Arabidopsis and grasses. Plant Physiol. 149, 88–95. doi: 10.1104/pp.108.129791
National Pharmacopoeia Committee (2015). Pharmacopoeia of the People's Republic of China Vol 1 [S]. Beijing: National Pharmacopoeia Committee.
Nolan, T., Hands, R. E., and Bustin, S. A. (2006). Quantification of mRNA using real-time RT-PCR. Nat. Protoc. 1, 1559–1582. doi: 10.1038/nprot.2006.236
Pfaffl, M. W. (2001). A new mathematical model for relative quantification in real-time RT-PCR. Nucleic Acids Res. 29:e45. doi: 10.1093/nar/29.9.e45
Qi, S., Yang, L., Wen, X., Hong, Y., Song, X., Zhang, M., et al. (2016). Reference gene selection for RT-qPCR analysis of flower development in Chrysanthemum morifolium and Chrysanthemum lavandulifolium. Front. Plant Sci. 7:287. doi: 10.3389/fpls.2016.00287
Reid, K. E., Olsson, N., Schlosser, J., Peng, F., and Lund, S. T. (2006). An optimized grapevine RNA isolation procedure and statistical determination of reference genes for real-time RT-PCR during berry development. BMC Plant Biol. 6:27. doi: 10.1186/1471-2229-6-27
Rozen, S., and Skaletsky, H. (2000). Primer3 on the WWW for general users and for biologist programmers. Methods Mol. Biol. 132, 365–386. doi: 10.1385/1-59259-192-2:365
Ruijter, J. M., Ramakers, C., Hoogaars, W. M., Karlen, Y., Bakker, O., van den Hoff, M. J., et al. (2009). Amplification efficiency: linking baseline and bias in the analysis of quantitative PCR data. Nucleic Acids Res. 37:e45. doi: 10.1093/nar/gkp045
Schluttenhofer, C., Pattanaik, S., Patra, B., and Yuan, L. (2014). Analyses of Catharanthus roseus and Arabidopsis thaliana WRKY transcription factors reveal involvement in jasmonate signaling. BMC Genomics 15:502. doi: 10.1186/1471-2164-15-502
Stone, J. D., and Storchova, H. (2015). The application of RNA-seq to the comprehensive analysis of plant mitochondrial transcriptomes. Mol. Genet. Genomics 290, 1–9. doi: 10.1007/s00438-014-0905-6
Sun, X. B., Sheng, J. R., and Wang, D. P. (2008). Research progress of chemical constituents and pharmacological activities for Baphicacanthus cusia (Nees)bremek. J. Guangxi Teach. Educ. Univ. 4, 66–69. doi: 10.16601/j.cnki.issn1001-8743.2008.04.015
Suzuki, H., Kaneko, T., Mizokami, Y., Narasaka, T., Endo, S., Matsui, H., et al. (2013). Therapeutic efficacy of the Qing Dai in patients with intractable ulcerative colitis. World J. Gastroenterol. 19, 2718–2722. doi: 10.3748/wjg.v19.i17.2718
Tian, C., Jiang, Q., Wang, F., Wang, G. L., Xu, Z. S., and Xiong, A. S. (2015). Selection of suitable reference genes for qPCR normalization under abiotic stresses and hormone stimuli in carrot leaves. PLoS ONE 10:e117569. doi: 10.1371/journal.pone.0117569
Tran, L. S., Nishiyama, R., Yamaguchi-Shinozaki, K., and Shinozaki, K. (2010). Potential utilization of NAC transcription factors to enhance abiotic stress tolerance in plants by biotechnological approach. GM Crops 1, 32–39. doi: 10.4161/gmcr.1.1.10569
Trapnell, C., Williams, B. A., Pertea, G., Mortazavi, A., Kwan, G., et al. (2010). Transcript assembly and quantification by RNA-Seq reveals unannotated transcripts and isoform switching during cell differentiation. Nat. Biotechnol. 28, 511–515. doi: 10.1038/nbt.1621
Tuteja, N. (2007). Abscisic Acid and abiotic stress signaling. Plant Signal. Behav. 2, 135–138. doi: 10.4161/psb.2.3.4156
Vandesompele, J., De Preter, K., Pattyn, F., Poppe, B., Van Roy, N., De Paepe, A., et al. (2002). Accurate normalization of real-time quantitative RT-PCR data by geometric averaging of multiple internal control genes. Genome Biol. 3:H34. doi: 10.1186/gb-2002-3-7-research0034
VanGuilder, H. D., Vrana, K. E., and Freeman, W. M. (2008). Twenty-five years of quantitative PCR for gene expression analysis. BioTechniques 44, 619–626. doi: 10.2144/000112776
Veau, B., Courtois, M., Oudin, A., Chenieux, J. C., Rideau, M., and Clastre, M. (2000). Cloning and expression of cDNAs encoding two enzymes of the MEP pathway in Catharanthus roseus. Biochim. Biophys. Acta 1517, 159–163. doi: 10.1016/S0167-4781(00)00240-2
Wan, H., Yuan, W., Ruan, M., Ye, Q., Wang, R., Li, Z., Zhou, G., et al. (2011). Identification of reference genes for reverse transcription quantitative real-time PCR normalization in pepper (Capsicum annuum L.). Biochem. Biophys. Res. Commun. 416, 24–30. doi: 10.1016/j.bbrc.2011.10.105
Wang, C. H., Zheng, L. P., Tian, H., and Wang, J. W. (2016). Synergistic effects of ultraviolet-B and methyl jasmonate on tanshinone biosynthesis in Salvia miltiorrhiza hairy roots. J. Photochem. Photobiol. B 159, 93–100. doi: 10.1016/j.jphotobiol.2016.01.012
Wang, E., Wang, K., Chen, D., Wang, J., He, Y., Long, B., et al. (2015). Evaluation and selection of appropriate reference genes for real-time quantitative pcr analysis of gene expression in Nile Tilapia (Oreochromis niloticus) during vaccination and infection. Int. J. Mol. Sci. 16, 9998–10015. doi: 10.3390/ijms16059998
Wang, Z., Gerstein, M., and Snyder, M. (2009). RNA-Seq: a revolutionary tool for transcriptomics. Nat. Rev. Genet. 10, 57–63. doi: 10.1038/nrg2484
Wu, X. X., Chen, X. F., Dan, J., Cao, Y., Gao, S. H., Guo, Z. Y., et al. (2016). Characterization of anti-leukemia components from Indigo naturalis using comprehensive two-dimensional K562/cell membrane chromatography and in silico target identification. Sci. Rep. 6:25491. doi: 10.1038/srep25491
Wu, Y. Q., Qian, B., Zhang, R. P., Zou, C., and Liu, G. (2005). Chemical studies of Baphicacanthus cusia (Nees)Bremek. Chinese Traditional. Herb. Drugs 7, 27–28. doi: 10.4028/www.scientific.net/AMR.550-553.1759
Wu, Z. J., Tian, C., Jiang, Q., Li, X. H., and Zhuang, J. (2016). Selection of suitable reference genes for qRT-PCR normalization during leaf development and hormonal stimuli in tea plant (Camellia sinensis). Sci. Rep. 6:19748. doi: 10.1038/srep19748
Xie, F., Xiao, P., Chen, D., Xu, L., and Zhang, B. (2012). miRDeepFinder: a miRNA analysis tool for deep sequencing of plant small RNAs. Plant Mol. Biol. 80, 75–84. doi: 10.1007/s11103-012-9885-2
Zhang, M., Zhang, M. W., Zhang, L., and Zhang, L. (2015). Methyl jasmonate and its potential in cancer therapy. Plant Signal. Behav. 10:e1062199. doi: 10.1080/15592324.2015.1062199
Zhang, W., Yang, J., Zi, J., Zhu, J., Song, L., and Yu, R. (2015). Effects of adding vindoline and MeJA on production of vincristine and vinblastine, and transcription of their biosynthetic genes in the cultured CMCs of Catharanthus roseus. Nat. Prod. Commun. 10, 2095–2096.
Keywords: Baphicacanthus cusia, hormone stimuli, plant organ, qPCR, reference gene
Citation: Huang Y, Tan H, Yu J, Chen Y, Guo Z, Wang G, Zhang Q, Chen J, Zhang L and Diao Y (2017) Stable Internal Reference Genes for Normalizing Real-Time Quantitative PCR in Baphicacanthus cusia under Hormonal Stimuli and UV Irradiation, and in Different Plant Organs. Front. Plant Sci. 8:668. doi: 10.3389/fpls.2017.00668
Received: 07 January 2017; Accepted: 11 April 2017;
Published: 03 May 2017.
Edited by:
Roger Deal, Emory University, USAReviewed by:
Ai-Sheng Xiong, Nanjing Agricultural University, ChinaPalakolanu Sudhakar Reddy, International Crops Research Institute for the Semi-Arid Tropics, India
Copyright © 2017 Huang, Tan, Yu, Chen, Guo, Wang, Zhang, Chen, Zhang and Diao. This is an open-access article distributed under the terms of the Creative Commons Attribution License (CC BY). The use, distribution or reproduction in other forums is permitted, provided the original author(s) or licensor are credited and that the original publication in this journal is cited, in accordance with accepted academic practice. No use, distribution or reproduction is permitted which does not comply with these terms.
*Correspondence: Lei Zhang, zhanglei@smmu.edu.cn
Yong Diao, diaoyong@hqu.edu.cn
†These authors have contributed equally to this work.