 Moran Oliva
 Einat Bar3
 Rinat Ovadia
 Gad Galili
 Michal Oren-Shamir
- 1Department of Ornamental Plants and Agricultural Biotechnology, Agricultural Research Organization, Volcani Center, Rishon LeZion, Israel
- 2Department of Plant Sciences, The Weizmann Institute of Science, Rehovot, Israel
- 3Department of Vegetable Crops, Newe Ya’ar Research Center, Agricultural Research Organization, Ramat Yishay, Israel
- 4Department of Fruit Tree Science, Agricultural Research Organization, Volcani Center, Rishon LeZion, Israel
Phenylalanine (Phe) is a precursor for a large group of plant specialized metabolites, including the fragrant volatile benzenoid–phenylpropanoids (BPs). In plants, the main pathway leading to production of Phe is via arogenate, while the pathway via phenylpyruvate (PPY) is considered merely an alternative route. Unlike plants, in most microorganisms the only pathway leading to the synthesis of Phe is via PPY. Here we studied the effect of increased PPY production in petunia on the formation of BPs volatiles and other specialized metabolites originating from Phe both in flowers and leaves. Stimulation of the pathway via PPY was achieved by transforming petunia with PheA∗, a gene encoding a bacterial feedback insensitive bi-functional chorismate mutase/prephenate dehydratase enzyme. PheA∗ overexpression caused dramatic increase in the levels of flower BP volatiles such as phenylacetaldehyde, benzaldehyde, benzyl acetate, vanillin, and eugenol. All three BP pathways characterized in petunia flowers were stimulated in PheA∗ flowers. In contrast, PheA∗ overexpression had only a minor effect on the levels of amino acids and non-volatile metabolites both in the leaves and flowers. The one exception is a dramatic increase in the level of rosmarinate, a conjugate between Phe-derived caffeate and Tyr-derived 3,4-dihydroxyphenylacetate, in PheA∗ leaves. PheA∗ petunia flowers may serve as an excellent system for revealing the role of PPY in the production of BPs, including possible routes directly converting PPY to the fragrant volatiles. This study emphasizes the potential of the PPY route in achieving fragrance enhancement in flowering plants.
Introduction
The fragrant volatile benzenoid–phenylpropanoids (BPs) are part of a large group of plant specialized metabolites originating from the aromatic amino acid (AAA) phenylalanine (Phe). Additional metabolites originating from Phe include flavonoids, anthocyanin pigments, as well as phenolic soluble metabolites with anti-microbial and anti-oxidant characteristics (Vogt, 2010; Dudareva et al., 2013). The shikimate pathway serves as a bridge between primary metabolism and the biosynthesis of AAAs and specialized metabolites derived from them (Tzin and Galili, 2010). The linking metabolite between the shikimate and AAA pathways is chorismate (Figure 1). Chorismate is also a branching point between the Trp and Tyr-Phe biosynthetic pathways suggesting that it may be a regulatory point in the synthesis of each. In plants, most of the carbon flux originating from the shikimate pathway is directed toward the synthesis of Phe and its downstream phenylpropanoids (Tzin and Galili, 2010; Yoo et al., 2013).
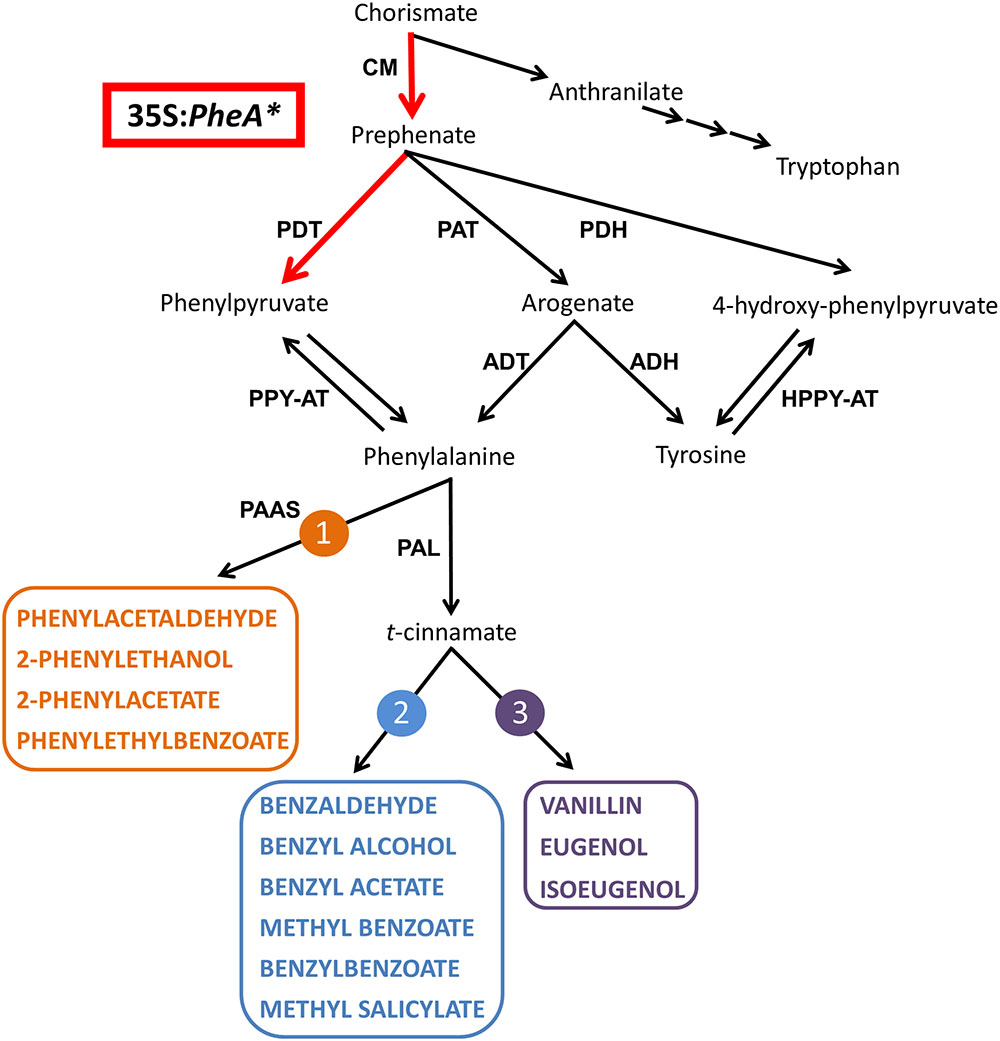
FIGURE 1. A schematic diagram of the AAA and BP metabolic networks in petunia flowers. The enzymatic steps performed by the bi-functional feedback insensitive PheA∗ enzyme are marked in red. Enzymes are marked in bold capital letters. The volatile compounds are marked by colored bold capital letters. Multiple arrows mark several biochemical reactions. The three BP volatile metabolic pathways originating from Phe in petunia flowers are marked in orange (1), blue (2), and purple (3). ADH, arogenate dehydrogenase; ADT, arogenate dehydratase; CM, chorismate mutase; HPPY-AT, hydroxyphenylpyruvate aminotransferase; PAAS, phenylacetaldehyde synthase; PAL, phenylalanine ammonia lyase; PAT, prephenate aminotransferases; PDH, prephenate dehydrogenase; PDT, prephenate dehydratase; PPY-AT, phenylpyruvate aminotransferase.
The Phe-Tyr biosynthesis pathways have been studied extensively in recent years and were shown to be tightly connected and inter-regulated (Maeda and Dudareva, 2012; Yoo et al., 2013; Schenck et al., 2015). In petunia, they begin with the transition of chorismate to prephenate (Figure 1) and continue through several parallel pathways to generate Phe and Tyr. Two of the parallel pathways share arogenate as an intermediate that is then transformed either into Phe or Tyr. Two additional pathways are via 4-hydroxyphenylpyruvate (4-HPPY) for the formation of Tyr, and via phenylpyruvate (PPY) for the formation of Phe (Figure 1). In addition to being a precursor to Phe, PPY has also been shown to be a Phe catabolic product and precursor for BP volatiles, as was shown in rose flowers (Watanabe et al., 2002; Hirata et al., 2012).
In plants, the main pathway leading to production of Phe is via arogenate, while the PPY-Phe pathway is considered merely an alternative route. Several studies in plants present evidence showing that the PPY-Phe is in fact active. For example, etiolated Arabidopsis seedlings respond to light by enhancement of PPY levels in the cytosol, leading to enhanced Phe biosynthesis (Warpeha et al., 2006). Another example is induction of the PPY-Phe route following inhibition of the arogenate-Phe pathway both in Petunia × hybrida flowers (Yoo et al., 2013) and Nicotiana benthamiana leaves (de la Torre et al., 2014). Furthermore, in petunia flowers high flux through the shikimate pathway, either by feeding experiments (Maeda et al., 2010) or by metabolic engineering (Oliva et al., 2015), activated the PPY-Phe route.r
Unlike plants, in most microorganisms the only pathway leading to the synthesis of Phe is via PPY (Prabhu and Hudson, 2010; Yoo et al., 2013). In one family of bacteria (Enterobacteriaceae), a bi-functional enzyme, PheA, converts chorismate via prephenate to PPY (Zhang et al., 1998; Tzin et al., 2009). In Arabidopsis seedlings, overexpression of the bacterial PheA enzyme in a feedback insensitive form (PheA∗) led to the accumulation of Phe and Phe-derived metabolites (Tzin et al., 2009).
Petunia serves as a model for studying the regulation of AAA biosynthesis (Colquhoun et al., 2010; Maeda et al., 2011) and for the biosynthesis and regulation of AAA-derived metabolites, including volatile BPs (Colquhoun and Clark, 2011; Sheehan et al., 2012; Dudareva et al., 2013; Muhlemann et al., 2014). Recently, we showed that overproduction of the AAAs in the purple petunia (cv. V26) resulted in increased levels of Phe-derived volatiles, but had no effect on anthocyanin pigmentation (Oliva et al., 2015).
The major group of volatiles synthesized by petunia flowers is BPs, with lesser amounts of terpenoids and short-chain fatty acids (Pichersky et al., 2006; Dudareva et al., 2013; Muhlemann et al., 2014). The BP volatiles of petunia include biosynthesis of several structural backbones of either benzenoid (C6–C1) or phenylpropanoid (C6–C2/3), synthesized via three parallel metabolic pathways. One is derived directly from Phe, and the other two branching from t-cinnamate or p-coumarate (Muhlemann et al., 2014; Figure 1).
In the formation of BPs, Phe serves as a substrate for the two enzymes, phenylacetaldehyde synthase leading to pathway no. 1 and Phe ammonia lyase (PAL), leading to pathways 2 and 3 (Figure 1; Vogt, 2010; Muhlemann et al., 2014). Both in Arabidopsis and petunia, PPY was shown to serve as a Phe precursor (Tzin et al., 2009; Yoo et al., 2013). However, in rose flowers, it was shown that the reverse reaction can occur, converting Phe to PPY, which is then converted into 2-phenylethanol via several BP pathways (Watanabe et al., 2002; Hirata et al., 2012, 2016). A similar observation was obtained in melon fruit tissue fed with labeled Phe (Gonda et al., 2010). Recently, the aminotransferase PhPPY-AT was identified in petunia and was shown to have higher affinity to Phe production from PPY in comparison to the reverse reaction (Yoo et al., 2013).
The pivotal role of Phe in synthesizing fragrant BPs, anthocyanins, and phenolic soluble metabolites via the arogenate pathway in petunia flowers has been studied extensively. However, there is only scarce evidence for the role of the PPY pathway in the biosynthesis of volatiles and pigmented molecules. Here, we focused on the effect of directing carbon flux toward PPY, bypassing the arogenate pathway, on the production of specialized metabolites, and in particular BPs. This was done by overexpressing the bacterial feedback insensitive PheA∗ gene in the purple petunia cultivar V26, and following its effect on the specialized metabolic profile of the leaves and flowers. PheA∗ flowers accumulated significantly high levels of fragrant BP volatiles, emphasizing the potential of the PPY route, normally of minor importance in plants, in enhancing fragrance production.
Materials and Methods
Plant Material, Growth, and Tissue Sampling
Petunia (Petunia × hybrida) Vilm V26 wild-type (WT) cultivar (Napoli and Ruehle, 1996) was used to generate transgenic PheA∗ and control plants. WT and transgenic plants were grown as described in Oliva et al. (2015).
Leaves were collected from plants before flowering. Petals were collected, if not mentioned otherwise, 1–2 days post-anthesis, at mid-day (12:00–14:00). When night analysis was performed, samples were collected at midnight (23:00–24:00). Samples for metabolomics profiling were frozen in liquid nitrogen and stored at -80°C.
Stable Transformation
Sterile petunia plants were grown from surface sterilized seed on solidified MS medium (Murashige and Skoog, 1962) supplemented with 3% (w/v) sucrose. Transformation was performed as published earlier (Oliva et al., 2015).
Plasmid Construction, Transgene Validation by Immunoblot Analysis
The PheA∗ construct, which was used for generating transgenic petunia PheA∗ plants, was described previously (Tzin et al., 2009). It contains a 35S CaMV promoter, a Rubisco small subunit-3A plastid transit peptide (TP) fused in frame to 5′ end of the truncated PheA feedback insensitive bi-functional bacterial gene. The PheA∗ construct lacks the regulatory C-terminal domain, making the enzyme feedback insensitive to Phe. Three copies of the hemagglutinin (HA) epitope tag were fused to the 3′ end of PheA∗ for tracking the protein. For controls, WT plants were transformed with the same plasmid used for transformation, containing only the kanamycin resistance cassette. PheA∗ construct was introduced into Agrobacterium tumefaciens strain EHA-105.
To determine the levels of the transgenic enzyme and to select lines for characterization, immunoblots were performed as previously described (Stepansky and Galili, 2003), using monoclonal anti-HA antibodies (Santa Cruz Biotechnology Inc, Dallas, TX, USA) with the following modifications. For leaf protein extraction, the ratio of tissue weight/protein extraction buffer (PEB) was 1 g:1 v, while for petal protein extraction, the ratio was 1 g:3 v. Protein quantification was determined using the Pierce © bicinchoninic acid (BCA) protein assay kit (Thermo Fisher Scientific, USA).
GC-MS Extraction, Derivatization, and Profiling of Polar Soluble, Non-volatile Extracts
Samples (n = 3) of leaves and petals of the petunia PheA∗ and control plants were used for analysis of the semi-polar and polar soluble metabolites by gas chromatography-mass spectrometry (GC-MS), as previously described (Tzin et al., 2012; Oliva et al., 2015). The data was analyzed using Xcalibur software v.1.4 (Thermo Finnigan), and the compounds were identified by comparison of their retention index (RI) and mass spectrum to those generated by authentic standards analyzed using the same column and similar conditions. If standards were not available, compounds were putatively identified by comparison of their RI and mass spectrum to those present in the mass spectra GMD VAR5 library of Max-Planck-Institute for Plant Physiology, Golm, Germany, and the commercial mass spectra library NIST051. The response values for metabolites resulting from the Xcalibur processing method were normalized to the ribitol internal standard.
Statistics
Statistical significance was determined either by a t-test or by one-way ANOVA test, using JMP software or by Metaboanalyst2 (Xia et al., 2009; Xia and Wishart, 2011). Hierarchical clustering was performed on absolute levels of volatile metabolites using Expander software (Ulitsky et al., 2010).
GC-MS Analysis of Volatiles Metabolites
Petunia corollas were harvested for analysis of internal pools volatiles at 1–2 days post-anthesis at mid-day (12:00–14:00), to minimize possible effects of rhythmicity, frozen and ground to powder. Upon analysis, 100–200 mg of powdered sample were added into a 10 ml glass vial [DuPont autosampler vial (DuPont Performance Elastomers) with a solid-top polypropylene cap (Alltech)] containing 1 ml of 20% (w/v) NaCl solution (to stop enzymatic activity), 0.3 μg of 2-heptanone (as an internal standard) and 5 mM of sodium meta bisulfide, to avoid sample browning. The vial was sealed and stored at room temperature to reach equilibrium of the gas phase, for 12–24 h until analyzed. Solid-phase micro extraction (SPME) sampling was conducted according to Davidovich-Rikanati et al. (2008), with minor modifications. A 65 μm fused silica fiber coated with polydimethylsiloxane/divinylbenzene (PDMS/DVB) (Supelco Inc) was used. Samples were pre-heated to 50°C, agitated for 5 min at 500 rpm, before insertion of fiber and exposure to the sample headspace. After 25 min the SPME syringe was introduced into the injector port of the GC-MS apparatus for further analysis. Volatile compounds were separated on a GC-MS apparatus (Agilent Technologies) equipped with an Rtx-5 SIL MS (30 m × 30.25 mm × 30.25 μm) fused-silica capillary column (Restek Co.). Helium was used as a carrier gas (0.8 ml/min). The injector temperature was 250°C, set for splitless injection. The oven was set to 50°C for 1 min, and then the temperature was increased to 180°C at a rate of 5°C/min, then to 260°C at 20°C/min. Thermal desorption was allowed for 10 min. The detector temperature was set at 280°C. The mass range was recorded from 41 to 250 m/z, with electron energy of 70 eV. A mixture of straight-chain alkanes (C7–C23) was injected into the column under the aforementioned conditions for determination of retention times. The identification and quantification of the volatiles was done according to Davidovich-Rikanati et al. (2008), with the exception that the area used in the calculation for quantification, was of the major peak area, multiplied by a correction factor ratio.
Volatiles’ Annotation Using MSDchem
Compounds were identified by comparison of their retention times and mass spectra to both their retention index (RI) and mass spectra of authentic standards. When no authentic standards were available, RI and mass spectra were compared with MS libraries. The levels of phenethyl acetate, phenylethyl alcohol, eugenol, benzyl alcohol, benzeneacetaldehyde, and benzaldehyde were quantified using calibration curves obtained from authentic standards.
Anthocyanins and Flavonoids Extraction and Separation by HPLC
Petunia petals were collected at 1–2 days post-anthesis at mid-day (0.1–0.3 g) and frozen in liquid nitrogen. Procedure for anthocyanin extraction and analysis in HPLC was performed according to Oliva et al. (2015).
Results
Generation of Transgenic PheA∗ Petunia Lines and Metabolic Characterization of Their Leaves
Petunia × hybrida V26 plants were transformed with the bacterial feedback insensitive bi-functional chimeric PheA gene (marked as PheA∗) under the 35S promoter, targeted to the chloroplast by a TP (Tzin et al., 2009). This bacterial chimeric PheA∗ enzyme includes two functional domains, encoding for two enzymatic activities in the AAA biosynthesis pathway. The N-terminal domain encodes for a chorismate mutase (CM) activity, catalyzing the transition from chorismate to prephenate, and the C-terminus encodes for the prephenate dehydratase (PDT) activity, catalyzing the transition from prephenate to PPY (Figure 1). The PheA∗ enzyme was engineered so that it lacks the regulatory C-terminal domain causing it to be feedback insensitive and enabling direction of the carbon flux toward PPY (Tzin et al., 2009).
Five independently transformed petunia lines were selected for metabolic analysis. Two forms of the PheA∗ polypeptide, including the immature form (∼40 kDa) and cleaved mature form (34 kDa) were detected by the HA antibodies (Figure 2A and Supplementary Figure S1). These results were similar to previously observed results in Arabidopsis PheA∗ leaves (Tzin et al., 2009).
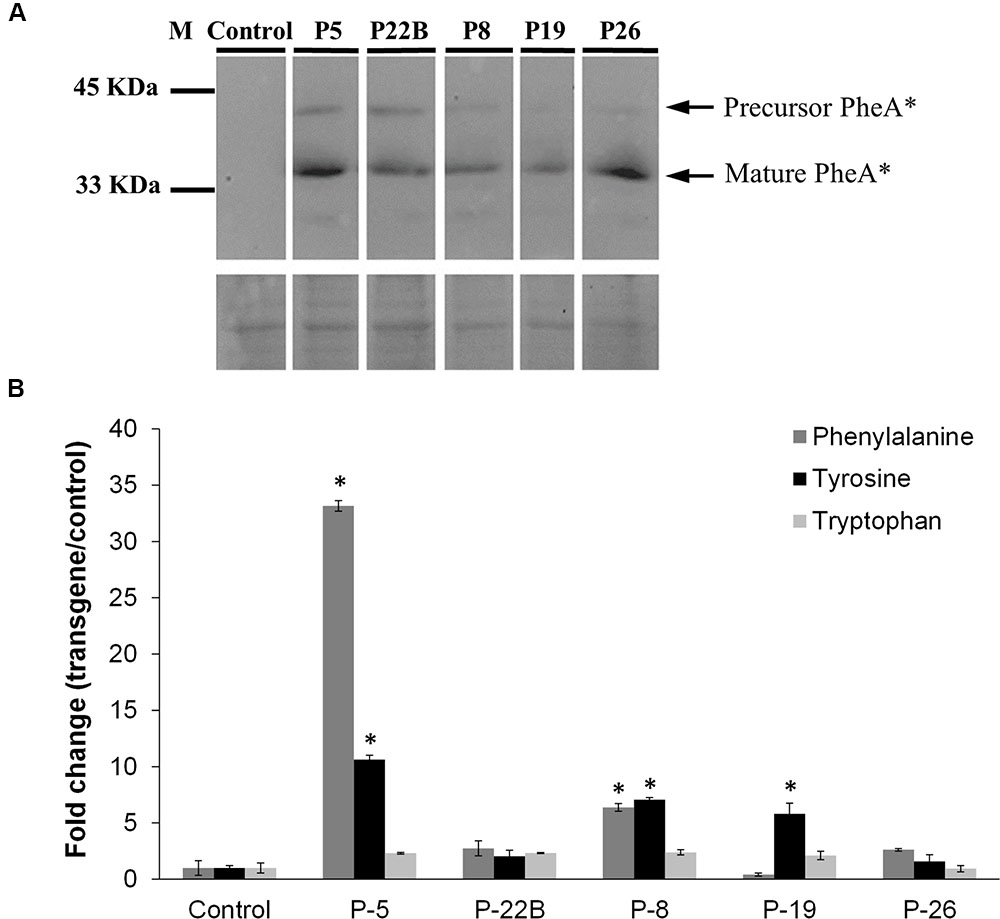
FIGURE 2. Effect of PheA∗ protein abundance on the AAAs and shikimate pathway intermediates in the leaves. (A) Accumulation of PheA∗ protein in the leaves of the five transgenic plants. Immunoblot analysis was performed using anti-HA antibody (1:1000). Lower panel indicates similar protein loading by Amido-black staining. (B) AAA levels in the leaves of the PheA∗ lines. Results are presented as fold change enhancement (n = 3). Asterisks indicate p ≤ 0.05 statistically significant difference between the PheA∗ line and control, using ANOVA followed by Dunnett’s post hoc test. Bars on top of the histograms indicate standard errors.
Leaves from the five selected lines and from control plants (transgenic plants expressing only the kanamycin resistance gene) were subjected to GC-MS analysis to detect metabolites related to the AAA pathway that accumulate in the transgenic lines. There was no clear correlation between Phe levels and PheA∗ levels in the five transgenic lines: the highest Phe level was in line 5, with a relatively high level of PheA∗. However, the second line with a significantly higher level of Phe was line 8, with a relatively low level of PheA∗. Tyr levels were significantly higher in three of the five transgenic lines, up to 10-fold higher in line 5. Here too, Line 26 had a relatively high level of PheA∗ with no significant increase both in Phe and Tyr levels (Figure 2B). As expected, Trp levels remained unaltered in the PheA∗ lines (Figure 2B).
Several AAA precursors along the shikimate and AAA pathways accumulated to higher levels in PheA∗ leaves, in comparison to the control (Table 1). 4-HPPY was higher in lines 8 and 19. PPY, the direct product of PheA∗ enzyme, accumulated significantly in leaves of PheA∗ 5. 3-Phenyllactate, synthesized directly from PPY (Watanabe et al., 2002; Bedewitz et al., 2014; Figure 6) accumulated to significantly higher levels in the transgenic lines 5 and 8 (Table 1).
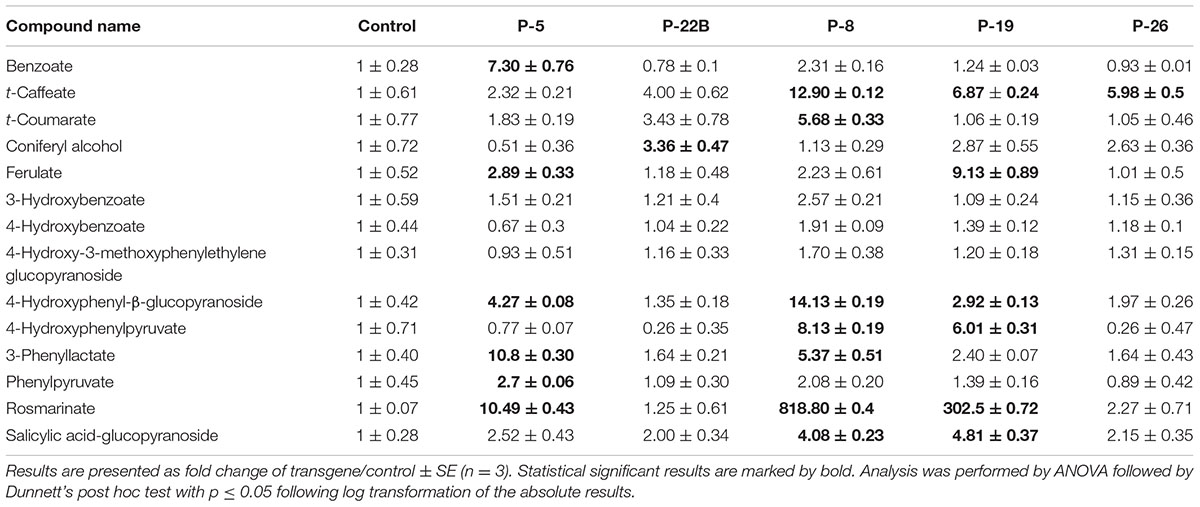
TABLE 1. Effect of PheA∗ protein abundance on metabolites derived from the shikimate, AAA, and AAA-derived pathways in leaves.
To evaluate changes in additional AAA-derived specialized metabolites in the transgenic leaves, we determined their fold change enhancement in comparison to controls (Table 1). The levels of a few of the identified phenylpropanoid metabolites increased in the PheA∗ lines, but most remained unaltered. The most significant effect detected was a dramatic increase in levels of rosmarinate, a conjugate between Phe-derived caffeate and Tyr-derived 3,4-dihydroxyphenylacetate (Petersen et al., 2009; Lee and Facchini, 2011), with 818- and 302-fold increase in PheA∗ lines 8 and 19, respectively. Other significant enhancements were in the levels of benzoate (line 5), 4-hydroxyphenyl-β-glucopyranoside (lines 5, 8, 19), ferulate (line 5, 19), t-caffeate (lines 8, 19, 26), and t-coumarate (line 8).
Effect of PheA∗ Accumulation in Flowers on the Levels of PPY, AAAs, and Their Downstream Non-volatile Metabolites
The abundance of the PheA∗ protein in the flower petals varied slightly between the five transgenic lines with a maximum of 2.5-fold (Figure 3A). As in the leaves, both the non-cleaved and the cleaved forms of the PheA∗ enzyme were detected. Several additional bands were also detected, in the high expressing lines, which may be a result of a degradation process.
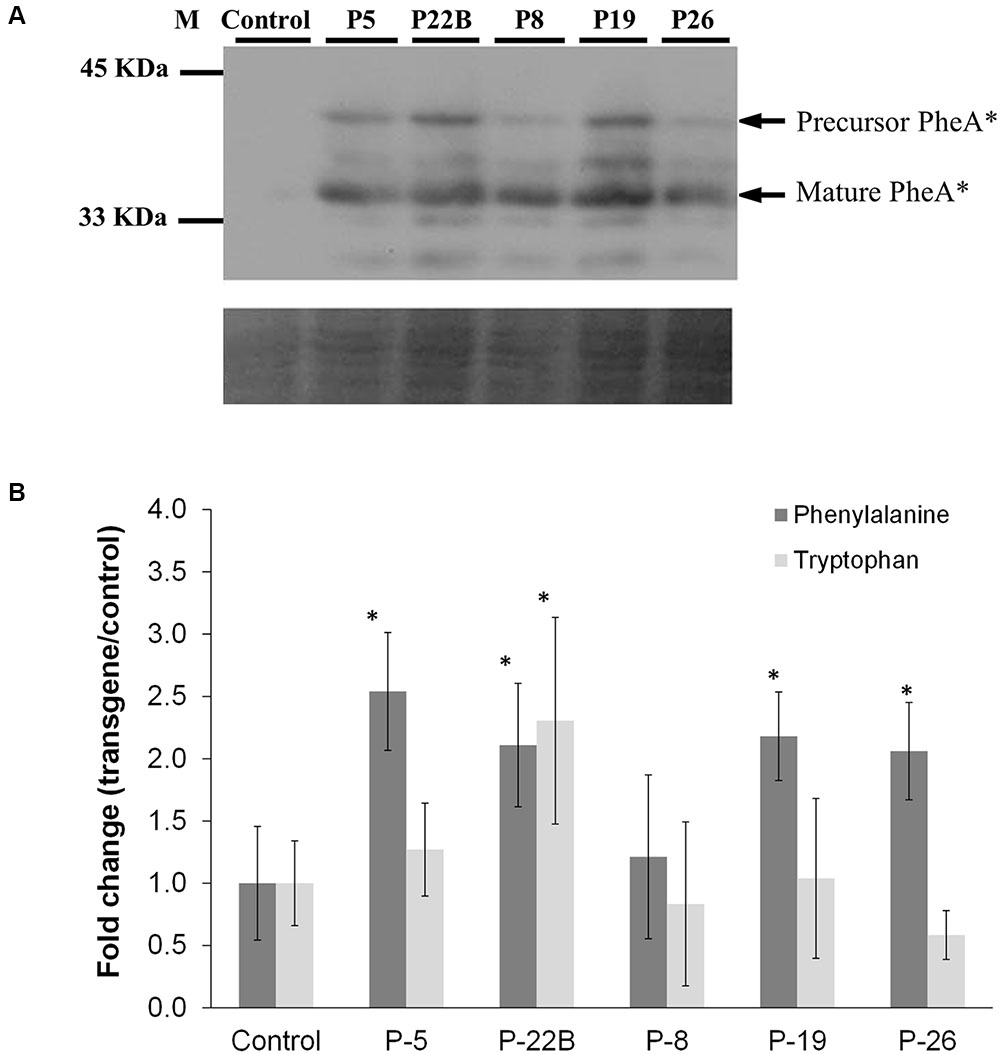
FIGURE 3. Effect of PheA∗ protein abundance on the levels of the AAAs in PheA∗ flowers. (A) Accumulation of PheA∗ protein in the flower petals of the five transgenic plants. Immunoblot analysis was performed using anti-HA antibody (1:1000). Lower panel indicates similar protein loading by Amido-black staining. (B) Levels of the AAAs in flowers of control and the five PheA∗ transgenic lines. Results are presented as fold change in transgenic vs. control flowers (n = 3). Tyrosine was not identified. Asterisks indicate a statistically significant difference between the PheA∗ lines and control, using t-test with p ≤ 0.05. Bars on top of the histograms indicate standard errors.
The metabolic analysis was carried out on flowers, 1–2 days post-anthesis. Analysis of AAA levels showed mild but significant enhancement in Phe levels in four of the five PheA∗ lines (Figure 3B). Tyr was not detected in the PheA∗ and control petals. No significant change was observed in Trp levels, as expected, apart from a slight increase in line 22B.
Most of the non-volatile phenolic metabolites in the flower petals remained unchanged in the PheA∗ lines, while some increased up to threefold (mainly t-caffeate, 4-caffeoyl-trans-quinate, and 4-hydroxyphenyl-β-glucopyranoside) (Supplementary Table S1A). Total anthocyanin levels did not increase in all five PheA∗ lines, in comparison to control (results not shown). Analysis of changes in the flavonoids-anthocyanins pigments was conducted on PheA∗ 26 line only (Supplementary Table S1B). The flavonols quercetin and kaempferol, intermediates in the flavonoid-anthocyanin pathway, were slightly reduced. No significant change was observed in the quantity or quality of the anthocyanidins, composing the flower pigments, delphinidin, petunidin, and malvidin (Supplementary Table S1B). This result is similar to the effect of overproduction of Phe in petunia by the bacterial feedback insensitive AroG∗ enzyme (Oliva et al., 2015).
Effect of PheA∗ Abundance on the Volatile Metabolic Profile of the Flower Petals
Changes in the internal pools of volatiles synthesized by petunia PheA∗ petals were characterized by GC-MS SPME analysis. The identified volatiles included BP volatiles, short chain fatty acids and terpenoids (Supplementary Table S2). Their abundance in the different lines is presented in a hierarchical clustering heat-map and the characterized lines grouped into clusters I and II, and the identified volatiles in clusters A and B (Figure 4). PheA∗ lines 8, 19, and 26 were clustered into one group (I) and PheA∗ lines 5, 22B and the control line (named Empty 21) into another group (II) (Figure 4 and Supplementary Table S2). Within group II, the control line was sub-clustered separately. Transgenic lines in cluster I (8, 19, 26) show a common pattern of high accumulation of volatiles mostly from group B. Lines grouped to cluster II (22B, 5, and control), showed enhanced levels of volatiles from group A2. Most of the BP volatiles were clustered into group B. The only two BP volatiles clustered in group A were p-cresol and benzene di-methanol, both possible catabolic products of phenolic compounds. The highest levels of BP volatiles were in lines 8, 19, and 26, in cluster I.
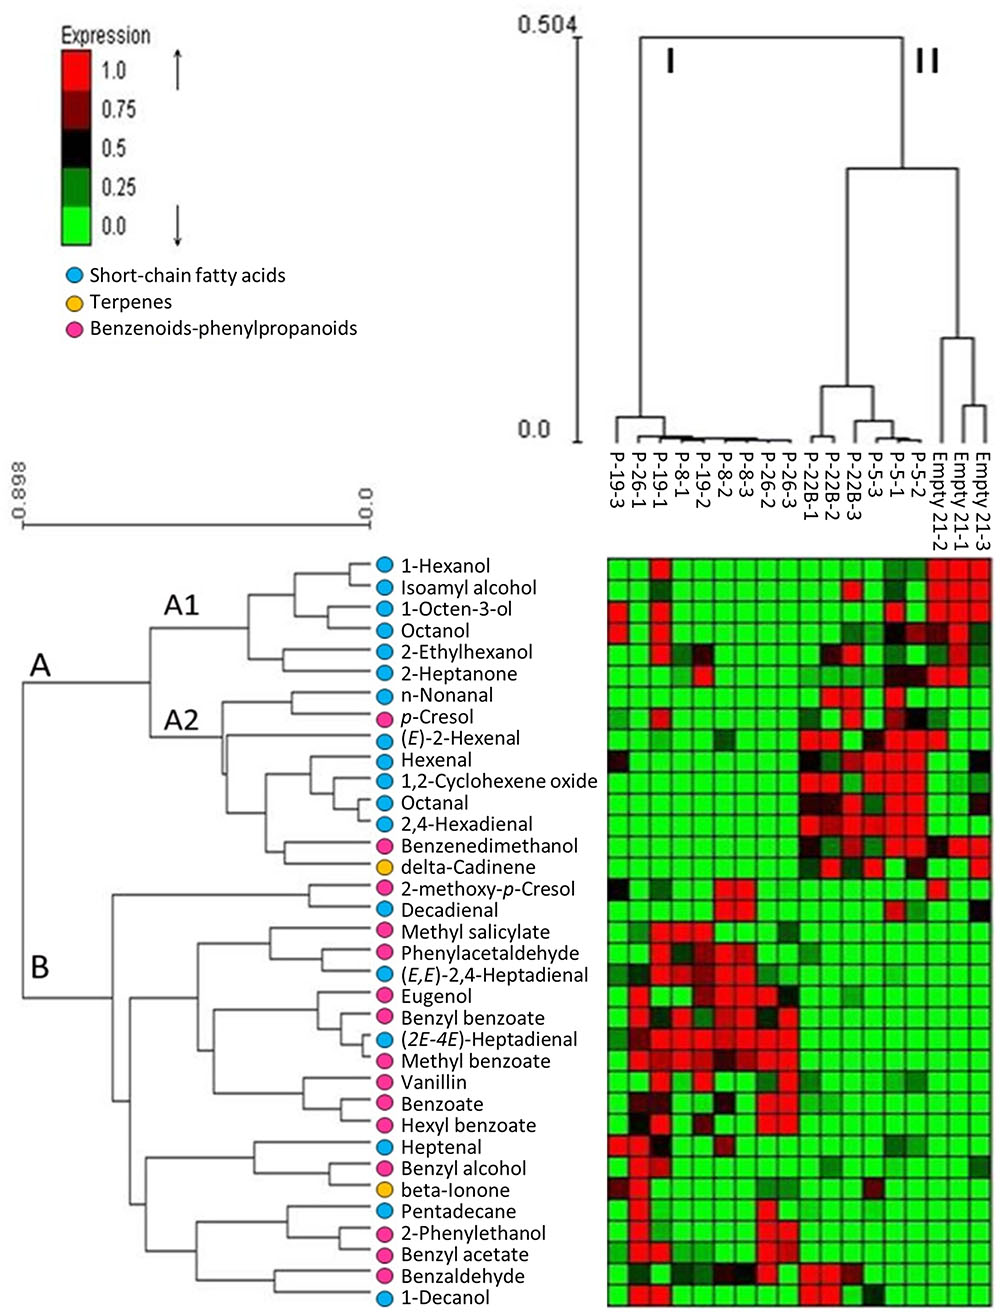
FIGURE 4. Effect of PheA∗ transgene on the internal pools of volatile metabolites in the petals. Results are presented by heat map hierarchical clustering of the volatiles. Analysis was performed in Expander (Ulitsky et al., 2010). Each column represents a sample from either PheA∗ or control (Empty 21) flowers (n = 3). Each row represents a volatile. Values of volatiles’ internal pools were centered and scaled for the analysis and are presented by virtual colors as shown in the color key. Supplementary Table S2 presents the original absolute volatile internal pool levels. All volatiles were coded for their groups by key color. Benzenoid–phenylpropanoid volatiles marked by pink circles, short-chain fatty acids and terpenoids were marked by blue and yellow circle, respectively.
Other volatiles which were grouped into cluster A2 are terpenoids and short-chain fatty acids. The short-chain fatty acids accumulated to higher levels in cluster II (lines 5, 22B, and control). These volatiles are known to be formed as a result of membrane degradation and not due to biosynthesis processes.
The five transgenic lines can be divided into two groups, based on the fold change increase in their total BP volatiles. The fold increase in total BP volatiles in lines 8, 19, and 26 was above 15-fold, while in lines 5 and 22B, the fold increase was statistically insignificant (Figure 5A). This is in accordance with the heat map results, clustering lines 8, 19, and 26 separately from lines 5 and 22B, and further apart from control (Figure 4). Lines 8, 19, and 26 had higher accumulation of total BP volatiles than lines 5 and 22B, even though PheA∗ abundance was similar between the two groups (Figures 3A, 5A).
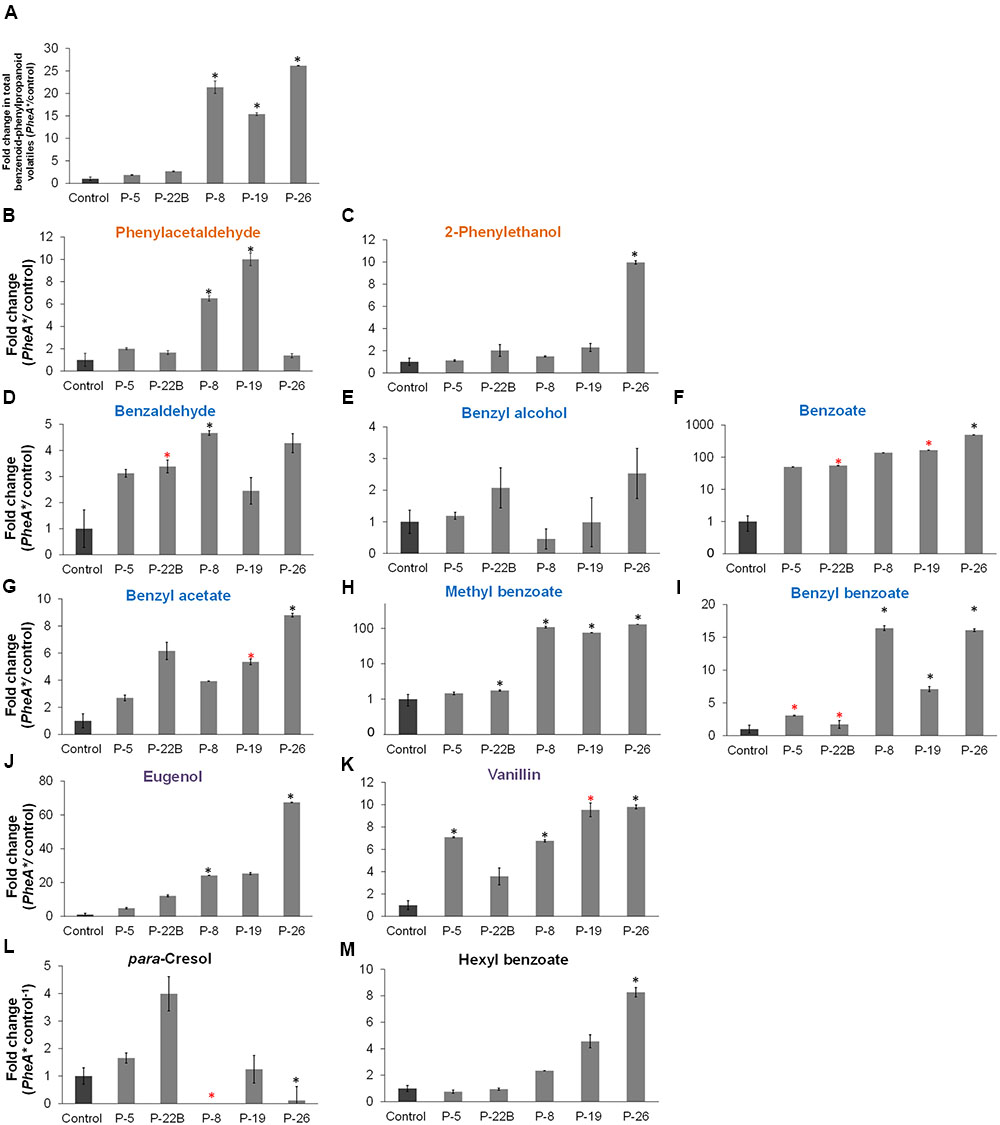
FIGURE 5. Effect of the PheA∗ transgene on the Benzenoid–Phenylpropanoid volatiles in the petals. (A) Fold enhancement of total BP volatiles in PheA∗ lines in comparison to control (n = 3). (B–M) Fold enhancement of specific BP volatiles. Results are presented according to their biosynthesis in the three BP pathways in petunia petals. Volatiles names are colored according to their pathway as presented in Figure 1 (orange, blue, and purple). Volatiles synthesized directly from Phe (B,C), volatiles synthesized from cinnamate (D–I), and volatiles synthesized in the pathway begins with ferulate (J,K). (L,M) BPs whose biosynthetic pathways have not been identified in petunia. Black and red asterisks indicate statistically significant differences (p ≤ 0.05 and p ≤ 0.1, respectively) between the PheA∗ lines and the control, using ANOVA followed by Dunnett’s post hoc test after log transformation. Bars on top of the histograms indicate standard errors.
The BP volatiles derived from all three pathways in PheA∗ flowers (Figure 1) accumulated to significantly higher levels in comparison to control flowers, with a variability seen between the five transgenic lines (Figure 5). Line 26 accumulated the highest levels in most of the BP volatiles (Figure 5A). Two of the volatiles from the BP pathway 1 that initiates with phenylacetaldehyde (Figure 1) were enhanced (phenylacetaldehyde in lines 8 and 19, and 2-phenylethanol in line 26, with a 10-fold enhancement; Figures 5B,C). Five volatiles synthesized from the pathway 2 mediated by t-cinnamate increased in part of the transgenic lines, including benzaldehyde, benzoate, benzyl acetate, methyl benzoate, and benzyl benzoate (Figures 5D–I). The highest fold increase was in benzoate and methyl benzoate, with up to 100-fold increase in methyl benzoate and up to 500-fold increase in benzoate. Two volatiles synthesized from the pathway beginning with p-coumarate, eugenol and vanillin, increased up to 70- and 10-fold, respectively in part of the PheA∗ lines (Figures 5J,K). The levels of p-cresol and hexyl benzoate (Figures 5K,L) increased in part of the transgenic lines up to eightfold. Both metabolites have been identified previously in petunia flowers (Oliva et al., 2015) but their biosynthetic pathway is still not known.
Discussion
Production of Phe via PPY is a well-known route in microorganisms (Zhang et al., 1998) but has only recently been elucidated in plants (Tzin et al., 2009, 2015; Yoo et al., 2013). Overexpressing the feedback insensitive bacterial bi-functional CM/PDT gene, PheA∗, directing carbon flux toward the PPY-Phe route, enabled further understanding of this route, and in particular the effect of increased PPY production on specialized metabolism both in the leaves and flowers.
The most significant effect of PheA∗ overexpression in petunia, was the dramatic increase in their BP volatiles (Figures 4, 5) from all three pathways present in petunia flowers (Figure 1). The level of total BPs in three of the five transgenic lines increased more than 25-fold in comparison to controls, with 500- and 100-fold increases in benzoate and methyl benzoate, respectively (Figures 5F,H). These results are particularly striking when we compare the metabolic profile of these PheA∗ flowers to flowers from of the same cultivar (P. hybrida V26) overexpressing the AroG∗ gene (Oliva et al., 2015). AroG∗ is a bacterial feedback insensitive enzyme with the activity of DAHPS (deoxy-arabino-heptulosonate 7-phosphate synthase), the first enzyme in the shikimate pathway (Tzin et al., 2012).
The enhancement in the levels of total BP volatiles in PheA∗ petunia was similar to those of the AroG∗ flowers, even though the increase in Phe levels in the PheA∗ flowers (2- to 2.5-fold) was about 10-fold lower than in AroG∗ flowers (Figure 3B, Oliva et al., 2015). Since we expect the BP production pathways to be identical in the transgenic PheA∗ and AroG∗ petunia flowers, we assume that the higher levels of Phe in AroG∗ was due to a higher production rate of Phe in these flowers in comparison to PheA∗. The low increase in Phe levels in PheA∗ flowers is in agreement with previous studies that have shown that most of the carbon flux in petunia is directed via the arogenate-Phe pathway and not via PPY (Figure 1; Maeda et al., 2010; Yoo et al., 2013). It is important to state that Phe levels are rate limiting in the production of BPs in petunia, since feeding of petunia cut flowers with external Phe caused an increase in internal BP pools to levels much higher than those in both AroG∗ and PheA∗ flowers (Oliva et al., 2015). Further proof for the importance of Phe levels for BP production is the fact that knockdown mutants of Phe-Tyr biosynthetic enzymes in petunia flowers reduced Phe levels and also caused a dramatic decrease in the levels of BP volatiles (Colquhoun et al., 2010; Maeda et al., 2010, 2011).
In addition to low Phe levels, the levels of non-volatile metabolites downstream of Phe and Tyr were also very mild in PheA∗ flowers, in comparison to AroG∗ flowers (Supplementary Table S1; Oliva et al., 2015). The equivalent levels of BP internal pools in AroG∗ and PheA∗ flowers, despite the differences in Phe and non-volatile phenylpropanoid levels, suggest that there may be an alternative pathway for direct synthesis of BPs from PPY. Several such pathways have been proposed, including direct synthesis of phenylacetaldehyde from PPY (Watanabe et al., 2002; Hirata et al., 2016) and possible direct synthesis of benzaldehyde from PPY (Orlova et al., 2006). Existence of such pathways in petunia may explain the dramatic increase in fragrant volatiles in PheA∗ flowers, in contrast to the low accumulation of non-volatile metabolites downstream of Phe. Since feeding experiments with labeled PPY are problematic because PPY can converts spontaneously to benzaldehyde in the feeding solution (Orlova et al., 2006), PheA∗ flowers are advantageous in studying the conversion of PPY to volatile BPs. In PheA∗, PPY is enhanced in planta in the relevant site of production inside the cells. Conversion of PPY to specified BPs may involve enzymes (Hirata et al., 2016), or perhaps, similar to what was suggested in lactic acid bacteria (Groot and de Bont, 1998), to occur spontaneously in the cells. Testing the metabolic effect of inhibiting PAL activity in PheA∗ flowers may help resolve this issue. Increased accumulation of BPs in PheA∗ flowers in which PAL activity is inhibited will be proof to direct production of BPs from PPY.
Similar to petunia, tomato AroG∗ transformation caused a significant increase both in non-volatile and volatile BPs in the fruit (Tzin et al., 2013, 2015), while PheA∗ transformation affected mainly the volatile metabolites (Tzin et al., 2015). However, unlike petunia flowers, the increase in volatiles in PheA∗ tomato was significantly lower than that in AroG∗ fruit. This suggests that BPs formation from PPY may differ between petunia flowers and tomato fruit.
The five PheA∗ transgenic lines are clearly divided into two groups (lines 5 and 22B in one group and lines 8, 19, and 26 in the second group) based both on their total BP values (Figure 5A) and on the hierarchical heat-map, clustering all volatiles (Figure 4). Interestingly, the metabolic analysis of petunia leaves from the five transgenic PheA∗ lines, revealed a similar division between the lines, with lines 5 and 22B having a related pattern and differing from lines 8 and 19 (Table 1). Line 26 was unique, since based on the leaf metabolic profile it did not fit either of the two groups, but based on the flower metabolic profile line 26 clustered with lines 8 and 19 (Table 1 and Figure 4). In an attempt to understand the possible differences between the two groups, we summarized the metabolic changes both in leaves and flowers in the two lines, 5 and 8, as representatives of the two groups (Figure 6).
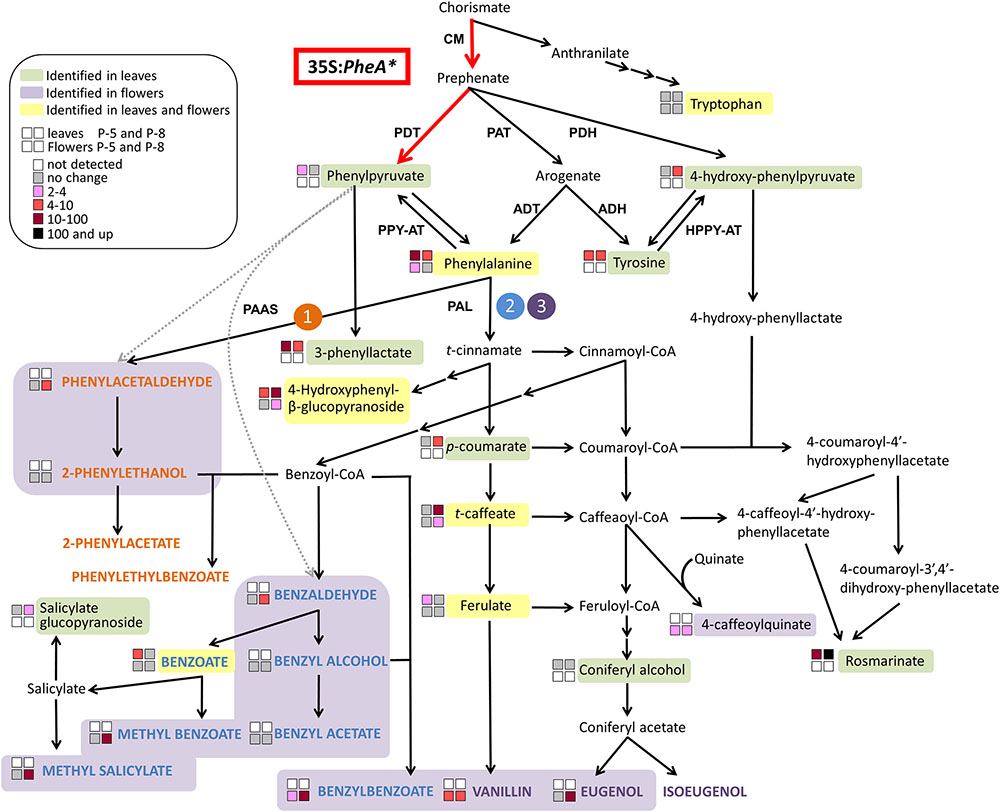
FIGURE 6. A metabolic map describing the effect of overexpression of PheA∗ on the metabolic profile of petunia flowers and leaves in the two transgenic lines 5 and 8. The BP volatile metabolic pathways originating from Phe in petunia flowers are marked by orange (1), blue (2), and purple (3). The volatile compounds are marked by colored bold capital letters. Enzymatic steps performed by the bi-functional feedback insensitive PheA∗ enzyme are marked in red. Enzymes are marked in bold capital letters. Multiple arrows mark several biochemical reactions. Dotted gray arrows mark reactions that have been shown in other organisms (production of phenylacetaldehyde from PPY in rose, and production of benzaldehyde from PPY in lactic acid bacteria or spontaneously) and may yet be revealed in petunia. A dashed line separates between primary to specialized metabolites. ADH, arogenate dehydrogenase; ADT, arogenate dehydratase; CM, chorismate mutase; HPPY-AT, hydroxyphenylpyruvate aminotransferase; PAAS, phenylacetaldehyde synthase; PAL, phenylalanine ammonia lyase; PAT, prephenate aminotransferases; PDH, prephenate dehydrogenase; PDT, prephenate dehydratase; PPY-AT, phenylpyruvate aminotransferase.
The three metabolites along the AAA biosynthetic pathway that accumulated to higher levels in PheA∗ leaves but were not identified in the flowers were PPY, Tyr, and 4-HPPY (Figure 6). The two lines, 5 and 8, differed already at this biosynthetic level, with increased PPY only in line 5 and increased 4-HPPY only in line 8. 3-Phenyllactate, synthesized from PPY, accumulated in the leaves of both lines, but to a higher degree in line 5. Tyr levels were elevated to similar levels in both lines. The most significant metabolic effect in petunia leaves due to PheA∗ overexpression was accumulation of rosmarinate (Figure 6). Petunia leaves have been shown to accumulate high rosmarinate levels following cold stress (Pennycooke et al., 2005), and microbial attack (Szabo et al., 1999). Here we show that both lines accumulated rosmarinate, but there was a dramatic difference between them with a 10-fold increase in line 5 and an 800-fold increase in line 8, in comparison to the control (Figure 6).
The changes in the leaf metabolic profile of the five transgenic lines suggest that the group represented by line 8, has a strong carbon shift toward the synthesis of 4-HPPY and its downstream metabolite rosmarinate (Figure 6). Increased accumulation of 4-HPPY has also been suggested to occur in Arabidopsis PheA∗ plants, since these plants accumulate high levels of homogenisate, a metabolites produced from 4-HPPY (Tzin et al., 2009). Interestingly, the same group of transgenic lines, represented by line eight, accumulating high levels of rosmarinate in their leaves, also accumulated higher levels of BPs in their flowers (Table 1 and Figures 5, 6).
One possible explanation for the increase in 4-HPPY and rosmarinate in petunia leaves and 4-HPPY-derived metabolites in Arabidopsis leaves, is a “leak” of prephenate from the bifunctional enzyme PheA∗, which is then converted to 4-HPPY either directly or via arogenate and tyrosine (Figure 6). This may occur since PheA has been shown to have a stronger CM activity in comparison to PDT (Zhang et al., 1998), possibly resulting in more prephenate molecules for each PPY formed. Therefore, in case of increased PheA∗ activity in the group represented by line 8, more prephenate will be available for the synthesis of 4-HPPY.
A second possible explanation is based on a recent study characterizing the activity of PPY-AT. PPY-AT was shown to convert PPY to Phe, in a reaction coupled to the deamination of Tyr and formation of 4-HPPY and Phe (Yoo et al., 2013). Here too, increased activity of PheA∗, causing an increase in PPY synthesis, may result, due to the coupled reaction with tyrosine, in increased concentrations of 4-HPPY and Phe (Figure 6).
Conclusion
Overproduction of PheA∗ in petunia plants resulted in a dramatic increase both in the BP volatiles produced in flowers and in 4-HPPY-derived metabolites, in particular rosmarinate, in their leaves. The comparison between the PheA∗ transgenic lines emphasized this dual metabolic result in petunia, since the group of PheA∗ lines with a higher production of BPs was that with higher production of 4-HPPY and rosmarinate. Future detailed studies using labeled PPY or chorismate in PheA∗ petunia may reveal the processes occurring in the flowers and leaves resulting in the metabolic profiles described, and in particular pathways for production of fragrant BPs directly from PPY.
Author Contributions
MO and MO-S designed the experiments. MO, EB, and RO conducted the experiments. MO, MO-S, and EL interpreted and prepared the manuscript. AP and GG revised the manuscript. All authors have read and approved the manuscript for publication.
Funding
This work was supported by a grant from the Israel Agriculture Ministry Chief Scientist (grant number 256095713).
Conflict of Interest Statement
The authors declare that the research was conducted in the absence of any commercial or financial relationships that could be construed as a potential conflict of interest.
Acknowledgments
We thank Dr. O. Tzfadia for his help in constructing the heat map hierarchical clustering of the volatiles. Thanks to N. Manela, A. Fadida, M. Meir, S. Zinzinathos, and Y. Rozoi for technical assistance. Thanks to Dr. I. Gonda, Dr. R. Rekanati-Davidovitch, A. Nissim-Levi, Dr. H. Peled-Zehavi, Dr. R. Rotkopf, Prof. A. Aharoni, Dr. S. Malitsky, and Dr. S. Meir for scientific support and advice.
Supplementary Material
The Supplementary Material for this article can be found online at: http://journal.frontiersin.org/article/10.3389/fpls.2017.00769/full#supplementary-material
FIGURE S1 | Original Gel Describing the Effect of PheA∗ protein abundance on the AAAs and shikimate pathway intermediates in the leaves. Accumulation of PheA∗ protein in the leaves of the five transgenic plants. Immunoblot analysis was performed using anti-HA antibody (1:1000). Lower panel indicates similar protein loading by Amido-black staining.
Abbreviation
AAA, aromatic amino acids; BP, benzenoids–phenylpropanoids; PAL, phenylalanine ammonia lyase; Phe, phenylalanine; PPY, phenylpyruvate; Trp, tryptophan; Tyr, tyrosine.
Footnotes
References
Bedewitz, M. A., Góngora-Castillo, E., Uebler, J. B., Gonzales-Vigil, E., Wiegert-Rininger, K. E., Childs, K. L., et al. (2014). A root-expressed L-phenylalanine: 4-hydroxyphenylpyruvate aminotransferase is required for tropane alkaloid biosynthesis in Atropa belladonna. Plant Cell 26, 3745–3762. doi: 10.1105/tpc.114.130534
Colquhoun, T. A., and Clark, D. G. (2011). Unraveling the regulation of floral fragrance biosynthesis. Plant Signal. Behav. 6, 378–381. doi: 10.4161/psb.6.3.14339
Colquhoun, T. A., Schimmel, B. C. J., Kim, J. Y., Reinhardt, D., Cline, K., and Clark, D. G. (2010). A petunia chorismate mutase specialized for the production of floral volatiles. Plant J. 61, 145–155. doi: 10.1111/j.1365-313X.2009.04042.x
Davidovich-Rikanati, R., Lewinsohn, E., Bar, E., Iijima, Y., Pichersky, E., and Sitrit, Y. (2008). Overexpression of the lemon basil alpha-zingiberene synthase gene increases both mono- and sesquiterpene contents in tomato fruit. Plant J. 56, 228–238. doi: 10.1111/j.1365-313X.2008.03599.x
de la Torre, F., El-Azaz, J., Avila, C., and Canovas, F. M. (2014). Deciphering the role of aspartate and prephenate aminotransferase activities in plastid nitrogen metabolism. Plant Physiol. 164, 92–104. doi: 10.1104/pp.113.232462
Dudareva, N., Klempien, A., Muhlemann, J. K., and Kaplan, I. (2013). Biosynthesis, function and metabolic engineering of plant volatile organic compounds. New Phytol. 198, 16–32. doi: 10.1111/nph.12145
Gonda, I., Bar, E., Portnoy, V., Lev, S., Burger, J., Schaffer, A. A., et al. (2010). Branched-chain and aromatic amino acid catabolism into aroma volatiles in Cucumis melo L. fruit. J. Exp. Bot. 61, 1111–1123. doi: 10.1093/jxb/erp390
Groot, M. N. N., and de Bont, J. A. M. (1998). Conversion of phenylalanine to benzaldehyde initiated by an aminotransferase in Lactobacillus plantarum. Appl. Environ. Microbiol. 64, 3009–3013.
Hirata, H., Ohnishi, T., Ishida, H., Tomida, K., Sakai, M., Hara, M., et al. (2012). Functional characterization of aromatic amino acid aminotransferase involved in 2-phenylethanol biosynthesis in isolated rose petal protoplasts. J. Plant Physiol. 169, 444–451. doi: 10.1016/j.jplph.2011.12.005
Hirata, H., Ohnishi, T., Tomida, K., Ishida, H., Kanda, M., Sakai, M., et al. (2016). Seasonal induction of alternative principal pathway for rose flower scent. Sci. Rep. 6:20234. doi: 10.1038/srep20234
Lee, E.-J., and Facchini, P. J. (2011). Tyrosine aminotransferase contributes to benzylisoquinoline alkaloid biosynthesis in opium poppy. Plant Physiol. 157, 1067–1078. doi: 10.1104/pp.111.185512
Maeda, H., and Dudareva, N. (2012). The shikimate pathway and aromatic amino acid biosynthesis in plants. Annu. Rev. Plant Biol. 63, 73–105. doi: 10.1146/annurev-arplant-042811-105439
Maeda, H., Shasany, A. K., Schnepp, J., Orlova, I., Taguchi, G., Cooper, B. R., et al. (2010). RNAi suppression of arogenate dehydratase1 reveals that phenylalanine is synthesized predominantly via the arogenate pathway in petunia petals. Plant Cell 22, 832–849. doi: 10.1105/tpc.109.073247
Maeda, H., Yoo, H., and Dudareva, N. (2011). Prephenate aminotransferase directs plant phenylalanine biosynthesis via arogenate. Nat. Chem. Biol. 7, 19–21. doi: 10.1038/nchembio.485
Muhlemann, J. K., Klempien, A., and Dudareva, N. (2014). Floral volatiles: from biosynthesis to function. Plant Cell Environ. 37, 1936–1949. doi: 10.1111/pce.12314
Murashige, T., and Skoog, F. (1962). A revised medium for rapid growth and bio assays with tobacco tissue cultures. Physiol. Plant 15, 473–497.
Napoli, C. A., and Ruehle, J. (1996). New mutations affecting meristem growth and potential in Petunia hybrida Vilm. J. Hered. 87, 371–377.
Oliva, M., Ovadia, R., Perl, A., Bar, E., Lewinsohn, E., Galili, G., et al. (2015). Enhanced formation of aromatic amino acids increases fragrance without affecting flower longevity or pigmentation in Petunia × hybrida. Plant Biotechnol. J. 13, 125–136. doi: 10.1111/pbi.12253
Orlova, I., Marshall-Colon, A., Schnepp, J., Wood, B., Varbanova, M., Fridman, E., et al. (2006). Reduction of benzenoid synthesis in petunia flowers reveals multiple pathways to benzoic acid and enhancement in auxin transport. Plant Cell 18, 3458–3475.
Pennycooke, J. C., Cox, S., and Stushnoff, C. (2005). Relationship of cold acclimation, total phenolic content and antioxidant capacity with chilling tolerance in petunia (Petunia × hybrida). Environ. Exp. Bot. 53, 225–232. doi: 10.1016/j.envexpbot.2004.04.002
Petersen, M., Abdullah, Y., Benner, J., Eberle, D., Gehlen, K., Hücherig, S., et al. (2009). Evolution of rosmarinic acid biosynthesis. Phytochemistry 70, 1663–1679. doi: 10.1016/j.phytochem.2009.05.010
Pichersky, E., Noel, J. P., and Dudareva, N. (2006). Biosynthesis of plant volatiles: nature’s diversity and ingenuity. Science 311, 808–811. doi: 10.1126/science.1118510
Prabhu, P. R., and Hudson, A. O. (2010). Identification and partial characterization of an L-tyrosine aminotransferase (TAT) from Arabidopsis thaliana. Biochem. Res. Int. 2010:549572. doi: 10.1155/2010/549572
Schenck, C. A., Chen, S. Y., Siehl, D. L., and Maeda, H. A. (2015). Non-plastidic, tyrosine-insensitive prephenate dehydrogenases from legumes. Nat. Chem. Biol. 11, 52–57. doi: 10.1038/nchembio.1693
Sheehan, H., Hermann, K., and Kuhlemeier, C. (2012). Color and scent: how single genes influence pollinator attraction. Cold Spring Harb. Symp. Quant. Biol. 77, 117–133.
Stepansky, A., and Galili, G. (2003). Synthesis of the Arabidopsis bifunctional lysine-ketoglutarate reductase/saccharopine dehydrogenase enzyme of lysine catabolism is concertedly regulated by metabolic and stress-associated signals. Plant Physiol. 133, 1407–1415. doi: 10.1104/pp.103.026294
Szabo, E., Thelen, A., and Petersen, M. (1999). Fungal elicitor preparations and methyl jasmonate enhance rosmarinic acid accumulation in suspension cultures of Coleus blumei. Plant Cell Rep. 18, 485–489. doi: 10.1007/s002990050608
Tzin, V., and Galili, G. (2010). The biosynthetic pathways for shikimate and aromatic amino acids in Arabidopsis thaliana. Arabidopsis Book 8:e0132. doi: 10.1199/tab.0132
Tzin, V., Malitsky, S., Aharoni, A., and Galili, G. (2009). Expression of a bacterial bi-functional chorismate mutase/prephenate dehydratase modulates primary and secondary metabolism associated with aromatic amino acids in Arabidopsis. Plant J. 60, 156–167. doi: 10.1111/j.1365-313X.2009.03945.x
Tzin, V., Malitsky, S., Zvi, M. M. B., Bedair, M., Sumner, L., Aharoni, A., et al. (2012). Expression of a bacterial feedback-insensitive 3-deoxy-d-arabino-heptulosonate 7-phosphate synthase of the shikimate pathway in Arabidopsis elucidates potential metabolic bottlenecks between primary and secondary metabolism. New Phytol. 194, 430–439. doi: 10.1111/j.1469-8137.2012.04052.x
Tzin, V., Rogachev, I., Meir, S., Moyal Ben Zvi, M., Masci, T., Vainstein, A., et al. (2015). Altered levels of aroma and volatiles by metabolic engineering of shikimate pathway genes in tomato fruits. AIMS Bioengin. 2, 75–92. doi: 10.3934/bioeng.2015.2.75
Tzin, V., Rogachev, I., Meir, S., Zvi, M. M. B., Masci, T., Vainstein, A., et al. (2013). Tomato fruits expressing a bacterial feedback-insensitive 3-deoxy-d-arabino-heptulosonate 7-phosphate synthase of the shikimate pathway possess enhanced levels of multiple specialized metabolites and upgraded aroma. J. Exp. Bot. 64, 4441–4452. doi: 10.1093/jxb/ert250
Ulitsky, I., Maron-Katz, A., Shavit, S., Sagir, D., Linhart, C., Elkon, R., et al. (2010). Expander: from expression microarrays to networks and functions. Nat. Protoc. 5, 303–322. doi: 10.1038/nprot.2009.230
Warpeha, K. M., Lateef, S. S., Lapik, Y., Anderson, M., Lee, B.-S., and Kaufman, L. S. (2006). G-protein-coupled receptor 1, G-protein Gα-subunit 1, and prephenate dehydratase 1 are required for blue light-induced production of phenylalanine in etiolated Arabidopsis. Plant Physiol. 140, 844–855. doi: 10.1104/pp.105.071282
Watanabe, S., Hayashi, K., Yagi, K., Asai, T., Mactavish, H., Picone, J., et al. (2002). Biogenesis of 2-phenylethanol in rose flowers: incorporation of [2H8]l-phenylalanine into 2-phenylethanol and its β-D-glucopyranoside during the flower opening of Rosa ‘Hoh-Jun’ and Rosa damascena Mill. Biosci. Biotechnol. Biochem. 66, 943–947. doi: 10.1271/bbb.66.943
Xia, J., and Wishart, D. S. (2011). Metabolomic data processing, analysis, and interpretation using MetaboAnalyst. Curr. Protoc. Bioinformatics 34:14.10.1–14.10.48. doi: 10.1002/0471250953.bi1410s34
Xia, J. G., Psychogios, N., Young, N., and Wishart, D. S. (2009). MetaboAnalyst: a web server for metabolomic data analysis and interpretation. Nucleic Acids Res. 37, W652–W660. doi: 10.1093/nar/gkp356
Yoo, H., Widhalm, J. R., Qian, Y. C., Maeda, H., Cooper, B. R., Jannasch, A. S., et al. (2013). An alternative pathway contributes to phenylalanine biosynthesis in plants via a cytosolic tyrosine: phenylpyruvate aminotransferase. Nat. Commun. 4:2833. doi: 10.1038/ncomms3833
Keywords: benzenoid–phenylpropanoid, fragrant volatiles, phenylpyruvate, PheA∗, specialized metabolism
Citation: Oliva M, Bar E, Ovadia R, Perl A, Galili G, Lewinsohn E and Oren-Shamir M (2017) Phenylpyruvate Contributes to the Synthesis of Fragrant Benzenoid–Phenylpropanoids in Petunia × hybrida Flowers. Front. Plant Sci. 8:769. doi: 10.3389/fpls.2017.00769
Received: 10 January 2017; Accepted: 24 April 2017;
Published: 12 May 2017.
Edited by:
Soren K. Rasmussen, University of Copenhagen, DenmarkReviewed by:
Chung-Jui Tsai, University of Georgia, USADanièle Werck, Centre National de la Recherche Scientifique, France
Copyright © 2017 Oliva, Bar, Ovadia, Perl, Galili, Lewinsohn and Oren-Shamir. This is an open-access article distributed under the terms of the Creative Commons Attribution License (CC BY). The use, distribution or reproduction in other forums is permitted, provided the original author(s) or licensor are credited and that the original publication in this journal is cited, in accordance with accepted academic practice. No use, distribution or reproduction is permitted which does not comply with these terms.
*Correspondence: Michal Oren-Shamir, vhshamir@agri.gov.il