 Atiako K. Acheampong1,2
 Chuanlin Zheng1Tamar Halaly1Lisa Giacomelli3Yumiko Takebayashi4
 Yusuke Jikumaru4
 Yuji Kamiya4
 Amnon Lichter5
 Etti Or1*
- 1Department of Fruit Tree Sciences, Institute of Plant Sciences, Agricultural Research Organization, Volcani Center, Bet Dagan, Israel
- 2Department of Horticulture, Faculty of Agriculture Environment and Food Sciences, The Hebrew University of Jerusalem, Rehovot, Israel
- 3Research and Innovation Centre-Fondazione Edmund Mach, San Michele all’Adige, Italy
- 4RIKEN Plant Science Center, Yokohama, Japan
- 5Institute of Postharvest and Food Sciences, Department of Postharvest Science of Fresh Produce, Agricultural Research Organization, Volcani Center, Bet Dagan, Israel
Gibberellin (GA) application is routinely used in the table grape industry to increase berry size and cluster length. Although grapevine cultivars show a wide range of growth responsiveness to GA3 application, the reasons for these differences is unclear. To shed light on this issue, two commercial grapevine cultivars with contrasting berry response to GA were selected for comparative analysis, in which we tested if the differences in response: (1) is organ-specific or cultivar-related; (2) will be reflected in qualitative/quantitative differences in transcripts/proteins of central components of GA metabolism and signaling and levels of GA metabolites. Our results showed that in addition to the high response of its berries to GA, internodes and rachis of cv. Black finger (BF) presented a greater growth response compared to that of cv. Spring blush (SB). In agreement, the results exposed significant quantitative differences in GA signaling components in several organs of both cultivars. Exceptionally higher level of all three functional VvDELLA proteins was recorded in young BF organs, accompanied by elevated VvGID1 expression and lower VvSLY1b transcripts. Absence of seed traces, low endogenous GA quantities and lower expression of VvGA20ox4 and VvGA3ox3 were also recorded in berries of BF. Our results raise the hypothesis that, in young organs of BF, low expression of VvSLY1b may be responsible for the massive accumulation of VvDELLA proteins, which then leads to elevated VvGID1 levels. This integrated analysis suggests causal relationship between endogenous mechanisms leading to anomalous GA signaling repression in BF, manifested by high quantities of VvDELLA proteins, and greater growth response to GA application.
Introduction
Unlike seeded grapevine (Vitis vinifera L.) cultivars, which have considerably high endogenous GA levels (Lavee, 1960; Kato et al., 1998; Agüero et al., 2000; Perez et al., 2000), berries of the usually small, stenospermocarpic varieties contain low GA quantities since they carry only seed traces, as a result of endosperm abortion following fertilization which leads to cessation of seed development (Iwahori et al., 1967; Cheng et al., 2013). GA application is therefore routinely used to stimulate stenospermocarpic berry development to a commercially acceptable size, and also for rachis stretching and cluster thinning (Weaver, 1958, 1965; Harrell and Williams, 1987). Issues of differential varietal responsiveness to such GA application have been reported in berries and other vegetative tissues/organs, including rachis and shoot (Weaver, 1958; Hagiwara et al., 1980; Mullins et al., 1992; Agüero et al., 2000). For example, while ‘Thompson seedless’ (TS) berries, required 3–4 applications of 30–45 μM of GA for a twofold increase in size (Dreier et al., 1998), application of 290 μM of GA3 increased ‘Emperatriz’ berry size by only 20% (Agüero et al., 2000). Similar differences were recorded in response of internodes and rachis (Hagiwara et al., 1980). We previously showed that GA response in grapevine is organ specific (Acheampong et al., 2015), but it is unclear whether varietal differences in GA response is limited to certain tissue/organ types or it is a whole-plant phenomenon.
Varietal differences in response to GA may possibly result from variations in GA signaling components and/or availability of bioactive GA. Studies in model plants have shown that GA activates its response pathway by binding to its receptors, GID1s. This complex then targets DELLAs, the major negative regulators of the GA-response, for degradation by the 26S proteasome through binding with SLY1, GA-specific F-box proteins (Hirano et al., 2008; Sun, 2010, 2011). The grapevine genome encodes three DELLA proteins (VvDELLA1, VvDELLA2, and VvDELLA3), which are redundantly expressed in vegetative and reproductive organs (Acheampong et al., 2015). VvDELLA1 transcripts and proteins were highest in internodes, rachis and tendrils, but were undetected in seeds and berries. Gain-of-function mutation in this gene conferred GA-insensitive phenotype in most organs, but had no effect on berry size (Boss and Thomas, 2002; Chaib et al., 2010). The specific function of VvDELLA2 in grapevine has not been elucidated yet, but its in vitro function, its ability to complement orthologous Arabidopsis mutants, and the high transcripts and proteins quantities in most organs of TS suggested a central role for this gene in regulating GA-related physiological processes in grapevine organs. Based on similar functional tests, low abundance in mature organs and higher abundance in developing tissues, it was proposed that VvDELLA3 regulate GA-mediated processes in young organs (Acheampong et al., 2015). Two functional grapevine GID1 homologs, VvGID1a and VvGID1b, exhibited spatial and temporal expression redundancies, and were down-regulated upon GA application. The two functional VvSLY1 paralogs in grapevine exhibited inverse temporal expression profiles during organ growth and development, and were downregulated by GA (Acheampong et al., 2015).
To investigate the potential involvement of allelic variability or quantitative differences in VvDELLAs, and other GA signaling components, in modulating differences in response to GA between stenospermocarpic grape varieties, we carried out a comprehensive comparative study of their sequence, their nature of interaction and their quantities in cv. Black finger (BF) (Perl et al., 1995), which berries are considered by growers to be highly responsive to GA and cv. Spring blush (SB) (Spiegel-Roy et al., 1994), considered non-responsive to GA. We complemented our study by comparisons of levels of bioactive GAs and of regulatory GA metabolism genes. Our results suggest a central role of VvDELLA accumulation in regulating the varietal differences in response to GA.
Materials and Methods
Field Experiment and Sampling
The cultivars selected for this study, BF and SB, are known for consistent differences in response of the berries to GA, in different vineyards of different growers in different regions and growing seasons. Both cultivars are progenies of crosses between varieties in which at least one of the parents is of stenospermocarpic genetic background. BF was obtained from cross between the seeded cv. Barlinka and stenospermocarpic cv. Centennial [cv. GoldB x cv. Q25-6 (F2 of cv. Emperor × cv. Sultana muscata)]. SB is a progeny of cv. Superior (stenospermocarpic variety) and cv. Ruby seedless [cv. Emperor × cv. Pirovano 75 (progeny of cv. Muscatel of Alexandria × cv. Thompson seedless)].
All experiments were conducted in the 2010 and replicated in 2011 growing seasons except one experiment (response to GA1 and GA4), which was carried out in 2013. The experiments were initiated on 10-year-old BF vines in Lachish, Israel (N31°33′33; E34°51′26) and 10-year-old SB vineyard located in Avigdor, Israel (N31°71′19; E34°74′04). These vineyards are only 19 km apart, and present similar topographic and environmental parameters. Vines are grafted on cv. Richter 110 and trained on high cordon suspensions on Y-shaped trellis. The canes were pruned to 15 buds with 6 to 7 canes per vine. Irrigation was by drippers spaced 50 cm apart. Irrigation regime was controlled by the grower according to standard commercial practices, which are evaporation-dependent, and ran between 30 and 80% of evaporation in the spring and summer, respectively. Nitrogen was supplied in the water as 200 kg ha-1 of 12% ammonium sulfate from bloom to fruit set, and 1700 L ha-1 of 2-2-10 (NPK) solution was supplied in the same manner from fruit set to harvest.
Separate experiments were conducted to examine the effect of applications of bioactive GAs and a GA biosynthesis inhibitor, PAC, on the elongation of internodes and rachis, berry enlargement, and on pistil development. Samples for transcript, protein and GA quantitation were also taken from the same vineyards. To account for possible variations due to geographical location of vineyards, each experiment was compared to the corresponding Triton X-100 control treatments in the same vineyard. To correct for differences due to location of vines in the vineyards, each experiment consisted of three blocks of eight-vine plots, arranged in a randomized complete-block design. Pooled tissues, sampled as outlined below from each block separately, represented a biological replicate. Morphological responses of internodes, rachis and berries to various growth regulators were determined for organs borne on vines in all three blocks.
Treatment with Bioactive GAs and PAC
Gibberellin and paclobutrazol treatment regimes of organs are as previously described (Acheampong et al., 2015), and summarized below. For each experiment, three groups of eight uniform 15 cm shoots, and inflorescences with tightly packed flowers [stage 15, E-L 15, on the Modified Eichhorn and Lorenz system (Coombe, 1995)] were selected on vines of similar vigor for internode and rachis, respectively. For pistil experiments, inflorescences with closed flowers (E-L 17) were treated at about 2 weeks before full bloom. Clusters with berries of 2–3 mm diameter (E-L 27) were selected for berry experiments. Organs received a single Triton X-100 (0.025%)-formulated GA3 (Pro-Gibb 4%; Abbott Laboratories, Chicago, IL, United States), or 10 mg/L each of GA1 and GA4 (OlChemIm Ltd, Olomouc, Czechia), or 0.8 mM PAC (CULTAR 25 SC, Syngenta AG, Basel, Switzerland) application. To allow for effective inhibition of GA biosynthesis, PAC was applied 96 h before GA3 and Triton X-100 treatments. Accordingly, in PAC-GA treatment, samples received GA3 application 96 h after PAC treatment. These PAC-GA treatments were included to verify that the effect of PAC on organ development was mostly GA-biosynthesis related.
Morphological response of organs to bioactive GAs and PAC
Internodes, rachises, and berries were treated as described above. Pre-treatment lengths of rachises, and weights of berries were recorded. Increment in length of rachises and the newest internodes arising after treatment, were monitored at 5-day intervals, while berry weights were assessed at 10-day intervals for 40 days. For each treatment regime, rachis and internode measurements were carried out on all 25 treated organs, while berry weight was measure on 150 berries sampled from clusters on vines in all three replicate blocks. For calculation, the initial length of new internodes was assumed to be 0.5 mm.
Sampling for GA response and signaling analyses
Organs and tissues (three replicates of eight internodes and rachis, and berries from six clusters, sampled from different vines of each block) were collected 6 and 24 h after GA treatments. The 6 h samplings were before 14:00, whereas the 24 h samplings were before 08:00 of the following day to minimize circadian effects on gene expression.
Sampling for temporal and spatial analyses, and GA quantitation
Sampling of young internodes was carried out from the most distal internodes from the base of young shoots at E-L 15, while young rachises were sampled from inflorescence at E-L 15. Internodes and rachises at similar developmental stage were marked and sampled at véraison and were defined as mature internodes and rachis. Young leaves and tendrils were defined as those borne on the 1st and 2nd nodes (from the shoot tip), while mature leaves and tendrils were sampled from the 12th node. Pistils, free from other floral parts, were sampled from inflorescence at E-L 17, while berries (2–3 mm diameter) were sampled at E-L 27, and subsequently at 10 and 30 days after the first sampling; herein referred to as 0, 10, and 30 DAF, respectively. Organs, sampled separately from each block, were pooled and each of the three pools represented the biological replication. Roots were obtained from single node cuttings immersed in water for about 21 days. Samplings were done at 09:00 to minimize circadian effects on gene expression.
Nucleic Acid Extraction
Genomic DNA (gDNA) was extracted from leaves of BF and SB using modified cetyltrimethyl ammonium bromide (CTAB) methods of Russell et al. (1992). Total RNA was extracted and cDNA synthesized as previously described (Acheampong et al., 2010). Briefly, 3 g of plant material was homogenized in liquid nitrogen and incubated for 10 min at 65°C in CTAB buffer [2% polyvinylpyrrolidone (PVP, 40000), 2% CTAB, 0.1M Tris (pH 8), 25 mM EDTA (pH 8), 2 mM NaCl, 2% β-mercaptoethanol]. The mixture was clarified by centrifuging at 10,000 rpm for 10 min, and the supernatant mixed with Chloroform:Isoamyl alcohol (24:1). The mixture was again centrifuged as above. RNA was precipitated from the aqueous upper layer by mixing with 3.3 M LiCl solution and incubating at 4°C overnight. RNA was pelleted by centrifuging at 10,000 for 20 min, 4°C, and resuspended in SSTE [1 M NaCl, 10 mM Tris (pH 8), 0.5% sodium dodecyl sulfate] solution. Phenol:chloroform:isoamyl alcohol (25:24:1) was added and centrifuged at 13,000 rpm for 5 min. To the upper aqueous layer was added chloroform:isoamyl alcohol (24:1), and centrifuged as above. RNA was precipitated by mixing with two-volumes of ethanol, and incubating at -20°C overnight. RNA was pelleted by centrifuging at 13,000 rpm, 4°C, for 15 min. Pellets were washed with 70% ethanol, and resuspended in 30 μL DNase/RNase-free water. First-strand cDNA was synthesized using Moloney Murine Leukemia Virus Reverse Transcriptase (M-MLV RT) (Promega Corporation, Madison, WI, United States) according to the manufacturer’s instructions.
Gene Cloning and Plasmid Construction
Full-length ORFs of all genes were PCR-amplified from a mix of cDNA from different organs. Sequences of primers used to clone all genes are listed in Supplementary Table S1. Primers for gene cloning were designed using the web-based Primer3 (ver. 0.4.0) software (Untergasser et al., 2012). PCR fragments to be cloned into Entry vectors were amplified with primers having the recommended recombination overhangs. Cloning of genes for gene-specific polyclonal antibody production, and full-length proteins was as previously described (Acheampong et al., 2015).
For the yeast two-hybrid assay, pGBKT7 and pGADT7 (Clontech, Mountain View, CA, United States) were used as bait and prey expression vectors, respectively. Cultivar-specific alleles of VvGID1s, VvDELLAs, and VvSLY1s were PCR-amplified from cDNA from both cultivars using Phusion High-Fidelity DNA Polymerase (New England Biolabs Inc., Ipswich, MA, United States). cDNA from both VvGID1 and VvSLY1 proteins were expressed in pGBKT7 as fusions with GAL4 DNA binding domain (DNA-BD), while VvDELLA proteins were expressed in pGADT7rec as fusions with the GAL4 activation domain (AD). Cloning into both DNA-BD and AD vectors was carried out using In-fusion HD Cloning Kit (Clontech Laboratories Inc., Mountain View, CA, United States) according to manufacturer’s protocol. In details, the coding sequences of VvGID1a and VvGID1b were PCR-amplified, with primer sets VvGID1a-1/VvGID1a-2 and VvGID1b-1/VvGID1b-2, respectively. Each VvGID1 PCR fragment was inserted into pGBKT7 digested with EcoRI/BamHI. Likewise, VvSLY1a and VvSLY1b coding sequences were first PCR-amplified with primer sets VvSLY1a-1/VvSLY1a-2 and VvSLY1b-1/VvSLY1b-2, respectively, and then inserted into pGBKT7 upon EcoRI/BamHI digestion. For VvDELLAs, their coding sequences were PCR-amplified, with primer sets VvDELLA1-1/VvDELLA1-2, VvDELLA2-1/VvDELLA2-2, and VvDELLA3-1/VvDELLA3-2, respectively. The PCR products were inserted into pGADT7 after proper restriction digestion using EcoIR1/BamHI. Varietal-specific clones, identified after sequencing, were selected and used for Yeast 2-hybrid assays. Primers for yeast two-hybrid cloning were designed using the Clontech Online Tools for In-fusion Cloning1, and are listed in Supplementary Table S1.
Yeast 2-Hybrid Analyses
Yeast 2-hybrid analyses and β-galactosidase liquid assays were carried out as described previously (Boneh et al., 2012), with slight modifications. The cultures were diluted 1:2 with SC-Leu/Trp medium and 10 μL plated onto three selective medium plates: SC-Leu/Trp, SC-Leu/Trp/His with 5 mM 3-amino-1,2,4-triazole (3-AT), and similar plates with 100 μM GA3 (for VvDELLA–VvGID1 interactions).
Quantitative Real-Time PCR (qRT-PCR) Analyses
The transcript levels of VvGID1s, VvDELLAs, VvSLY1s, and VvGASAs were measured by quantitative real-time PCR (qRT-PCR) as previously described (Acheampong et al., 2015), while and VvGA2oxs, VvGA3oxs, and VvGA20oxs expressions were by qRT-PCR using EvaGreen DNA-binding dye (Biotium Inc., Hayward, CA, United States) on the 96.96 Dynamic Array Integrated Fluidic Circuits (IFCs) (Fluidigm, San Francisco, CA, United States). Expressions of genes were normalized to transcripts of previously characterized, non-GA regulated VvGAPDH (Reid et al., 2006; Giacomelli et al., 2013). Relative transcripts of GA metabolism genes are presented as normalized relative expression (NRE) (Pfaffl, 2001). Whereas VvGA2oxs, VvGA3oxs, and VvGA20oxs expressions were determined for samples collected in the 2010 growing season, all other expression analyses were carried out on tissues collected in both 2010 and 2011 growing seasons. Primers used were designed from nucleotide sequences of accession numbers in Section 2.10, using Primer3 (ver. 0.4.0) software (Untergasser et al., 2012), and are listed in Supplementary Table S1 and our previous publications (Giacomelli et al., 2013; Acheampong et al., 2015).
Antibody Production
Expression of recombinant proteins in BL21-CodonPlus (DE3) RIPL strains (Strategene, Santa Clara, CA, United States), and production of polyclonal antibodies was previously detailed (Acheampong et al., 2015). Full-length VvDELLA proteins, used as sizing standards to locate endogenous VvDELLA proteins, were also expressed and purified as previously described (Acheampong et al., 2015), and quantified using BSA standards.
Protein Extraction and Immunoblot Analyses of VvDELLA Proteins
Total protein was extracted from samples collected in both 2010 and 2011 growing seasons by the previously described protocol of Wang et al. (2006) with slight modifications. Samples (0.5 g) were first homogenized in liquid nitrogen in the presence of polyvinylpolypyrrolidone (PVPP). The protein pellets obtained were dissolved in SDS-PAGE sample buffer containing 0.15 M Tris (pH 6.8), 1.2% SDS, 30% glycerol, 2.14 M β-mercaptoethanol (Sigma-Aldrich, St Louis, MO, United States). Extracted proteins were quantified by band intensities confirmed by fractionating on 10% SDS-PAGE gel, and staining with Coomassie protein staining buffer (0.1% Coomassie Brilliant Blue R-250, 50% methanol and 10% glacial acetic acid). Equal amounts of proteins were separated by 10% SDS-PAGE and transferred to PROTEAN nitrocellulose transfer membrane (Whatman GmbH, Dassel, Germany) using the Mini-Protean Transfer system (Bio-Rad Laboratories, Hercules, CA, United States). Immunoblot assays are as previously described (Acheampong et al., 2015). Band intensities were analyzed using ImageJ 1.48v software (Schneider et al., 2012).
Quantitation of Endogenous Gibberellins
Extraction and quantitation of endogenous gibberellins from tissues collected in 2010 growing season were carried as previously described (Acheampong et al., 2015). Quantities of 2H2-labeled GA species used as the Internal Standard are provided in Supplementary Table S2.
Statistical Analyses
Unless otherwise stated, all experiments were conducted in a completely randomized block designs. Data are presented in tables and bar graphs as the mean ± standard error (SE) or standard deviation (SD). Statistical significance for gene expression data between cultivars was determined by Student’s t-test, whereas differences among organs of a cultivar were analyzed by one-way Analysis of Variance (ANOVA) followed by Tukey HSD multiple comparison tests (JMP 13.1.0 software, SAS Institute, Cary, NC, United States), and significant values set at α = 0.05 (see Supplementary File S2). For GA metabolism genes, the ANOVA and Student’s t-test analyses were performed on log2(NRE). Data from field experiments was also statistically analyzed by ANOVA (α = 0.05).
Accession Numbers
GenBank Accession numbers of sequences referred to in this study were obtained from the Genoscope2) predictions of the 12x genome of V. vinifera libraries, and are as follows: VvGID1a (GSVIVT01022014001), VvGID1b (GSVIVT01011037001), VvDELLA1 (GSVIVT01011710001), VvDELLA2 (GSVIVT01030735001), VvDELLA3 (GSVIVT01015465001), VvSLY1a (GSVIVT01000213001), VvSLY1b (GSVIVT01009408001), VvGASA1 (GSVIVT01009902001), VvGASA2 (GSVIVT01011412001), VvGASA3 (GSVIVT01033563001), VvGASA4 (GSVIVT01008003001), VvGASA5 (GSVIVT01009384001), VvGASA6 (GSVIVT01034477001).
The cultivar-specific alleles of GA signaling genes cloned and analyzed in this study, have been deposited on NCBI with the following accession numbers: VvDELLA1_BF (KY765590), VvDELLA1_SB (KY765591), VvDELLA2_BF (KY765592), VvDELLA2_SB (KY765593), VvDELLA3_BF_1 (KY765594), VvDELLA3_BF_2 (KY765595), VvDELLA3_SB_1 (KY765596), VvDELLA3_SB_2 (KY765597), VvGID1a_BF (KY765598), VvGID1a_SB (KY765599), VvGID1b_BF_1 (KY765600), VvGID1b_BF_2 (KY765601), VvGID1b_SB_1 (KY765602), VvGID1b_SB_2 (KY765603), VvSLY1a_BF (KY765604), VvSLY1a_SB (KY765605), VvSLY1b_BF (KY765606), VvSLY1b_SB_1 (KY765607), VvSLY1b_SB_2 (KY765608).
Results
Response of Organs of BF and SB to Exogenous GA3 and PAC
The cultivars selected for this study, BF and SB, are known for reproducible differences in response of the berries to GA, in different vineyards of different growers, in different regions and years. To investigate the scope of varietal differences in grapevines, we carried out a comparison of the responses of vegetative and reproductive organs of BF and SB to application of predetermined, informative concentration of GA3. For these analyses, which required many mature vines, we selected the closest BF and SB vineyards available, with very similar topographic and environmental parameters, and carried out the analysis over two consecutive growing seasons.
Since GA signaling and metabolism occur predominantly in young, growing tissues (Silverstone et al., 1997; Chandler et al., 2002; Kaneko et al., 2003), we restricted our comparative analyses to only young organs of both cultivars. Compared to the control, GA3 treatments resulted in 2.1- and 1.6-fold increase in internode elongation of BF and SB, respectively, while PAC treatments caused a 3.7- and 2-fold reduction in internode length of both cultivars (Figures 1A–D). Whereas GA3 treatment produced 5- and 1.8-fold increases in rachis lengths of BF and SB, respectively, PAC treatment resulted in approximately 2-fold reduction in both cultivars (Figures 1E–H). In contrast, GA3 application yielded a 3-fold increase in berry weight of BF, but did not significantly alter berry size of SB (Figures 1I–L). PAC treatment led to a 2-fold decrease in berry weight of SB, and a 1.3-fold change in berry weight of BF. To verify that the effect of PAC (which may also affect ABA biosynthesis) was mostly GA-biosynthesis related, PAC-GA treatments were included, in which GA3 was applied 96 h after PAC treatment. The PAC-GA data show that, for all organs of both cultivars, the effect of PAC was either partially or fully rescued by the GA treatment. It is interesting to note that at 20 days after treatment, the growth rate of triton-treated control rachis of SB was more than 5-fold greater than corresponding rachis of BF (Figures 1E–H). Growth rate of triton-treated internodes and berries are relatively similar for both cultivars after 20 and 30 days, respectively (Figures 1A–D,I–L).
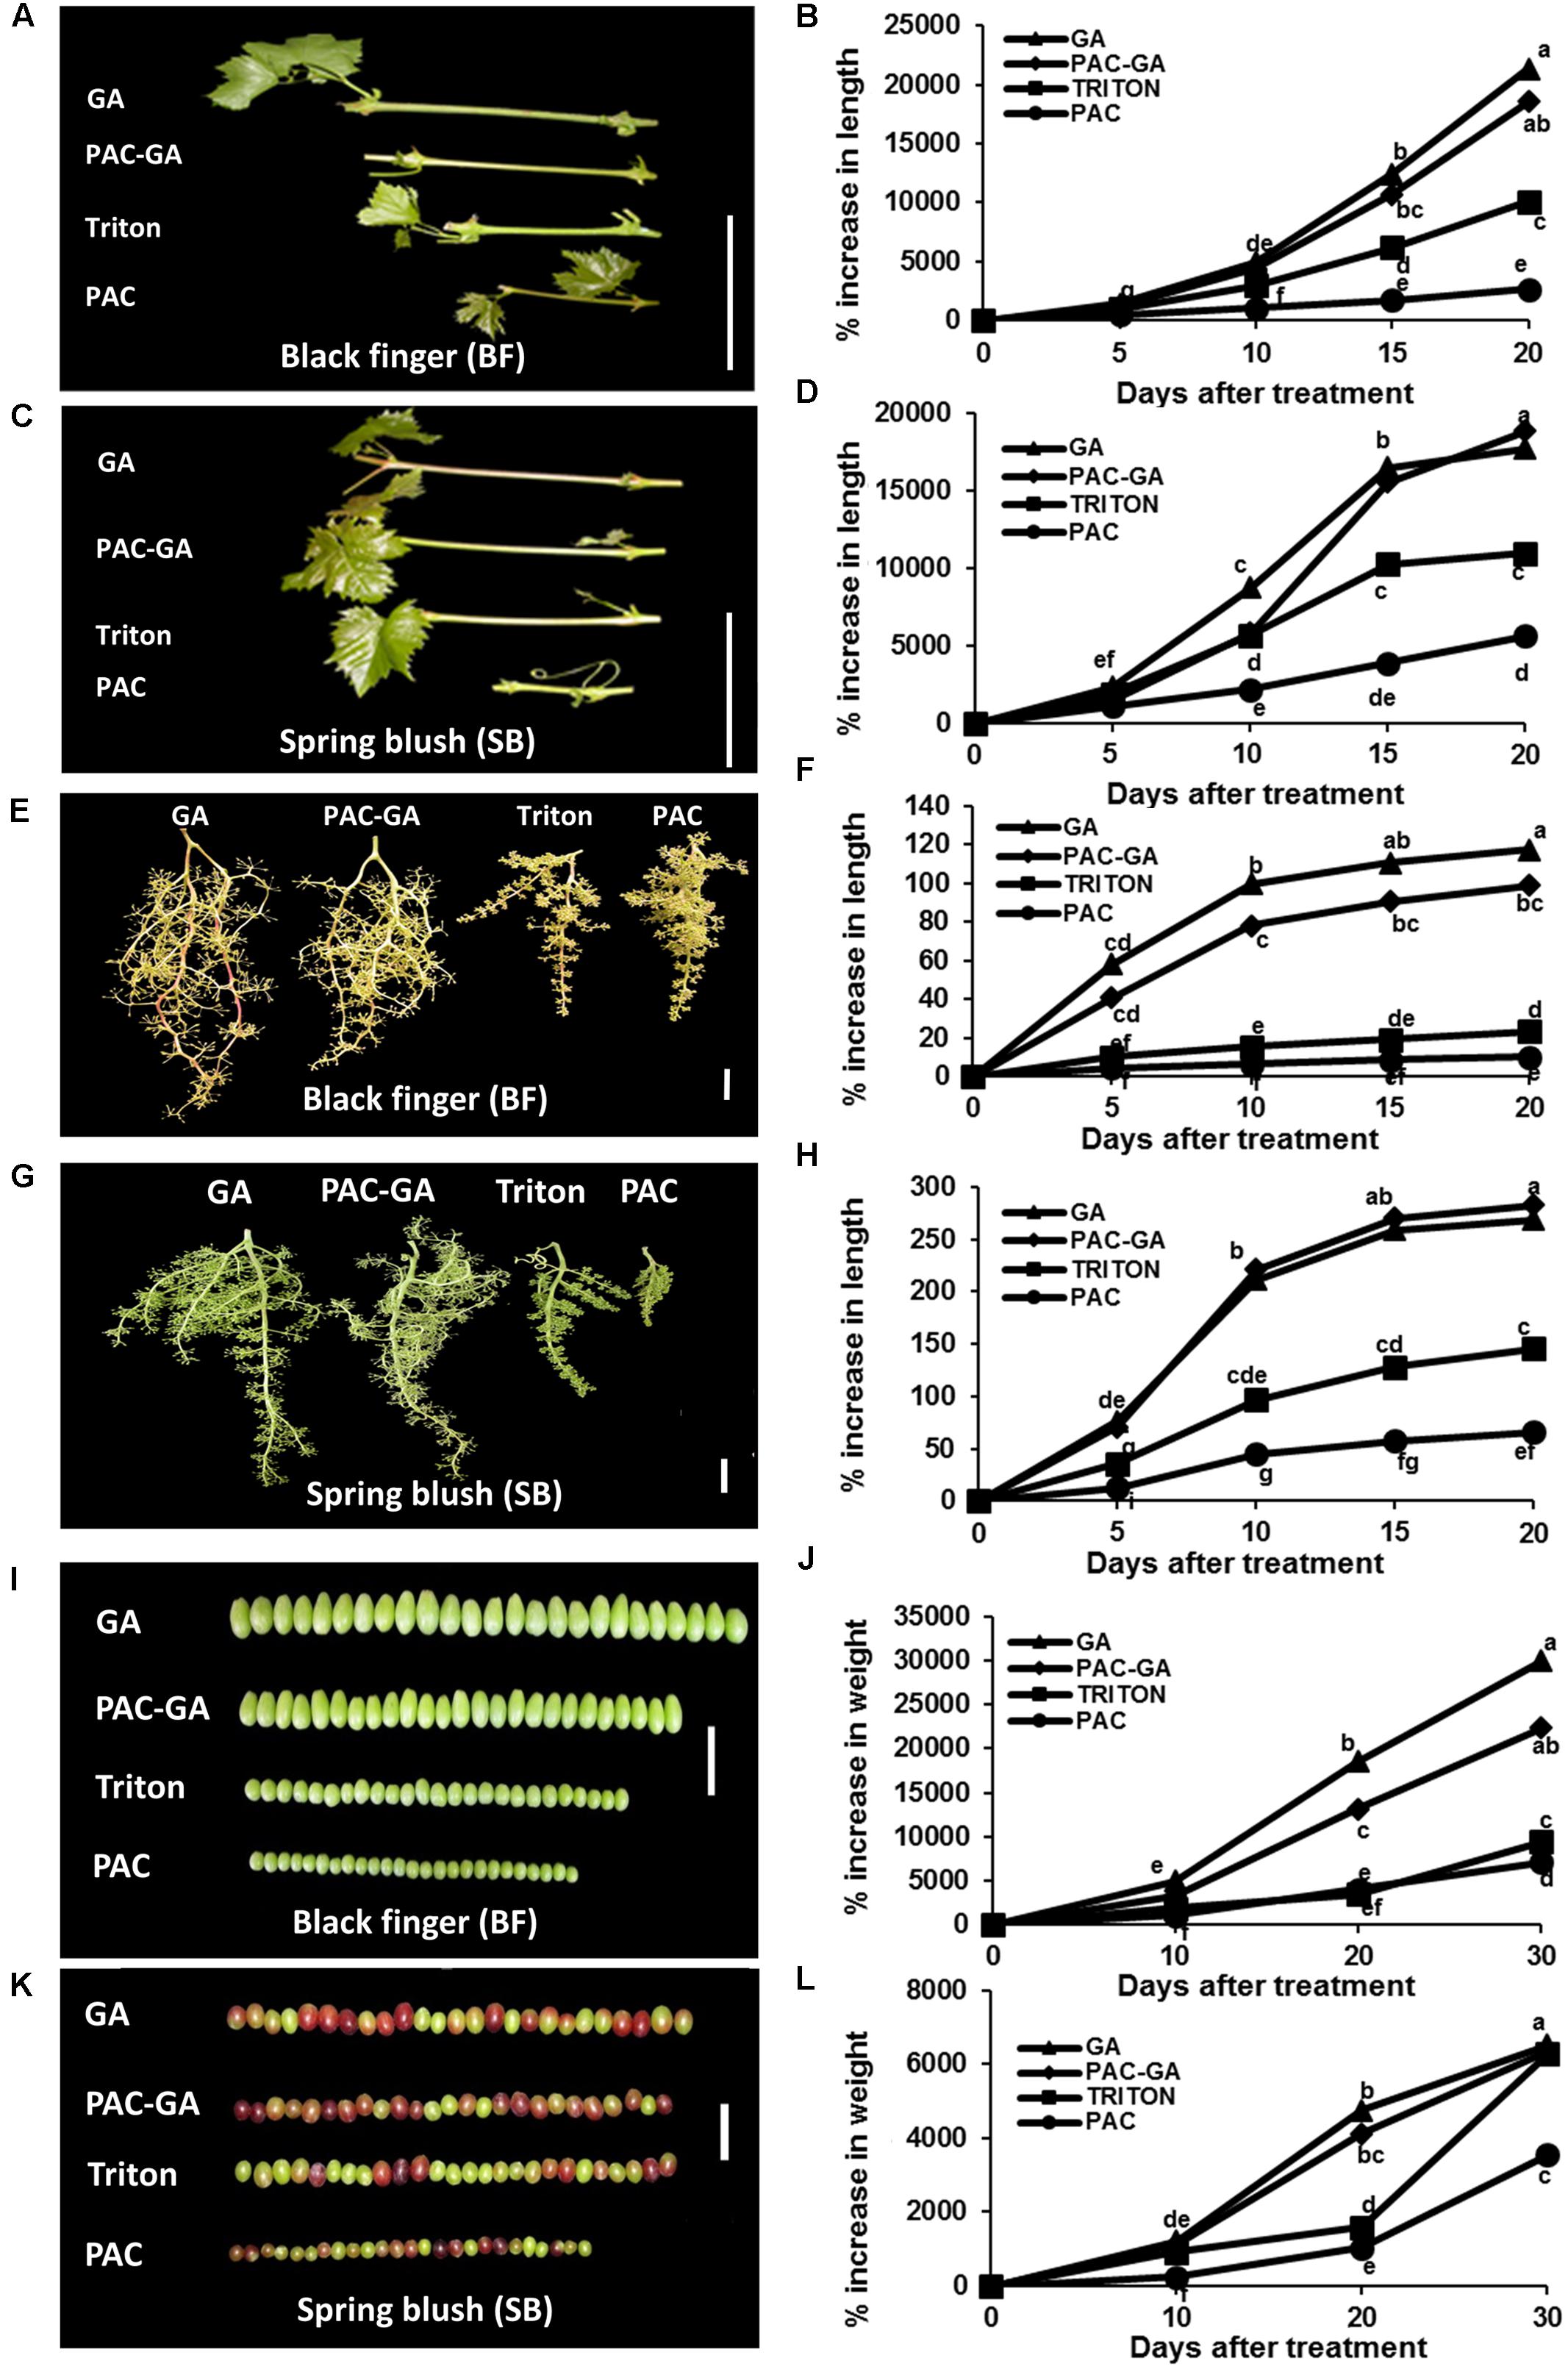
FIGURE 1. Effect of GA3 and PAC on size of organs of V. vinifera cv. Black finger (BF) and cv. Spring blush (SB). Altered response of organs of BF (A,B,E,F,I,J) and SB (C,D,G,H,K,L) to GA3 and GA biosynthesis inhibitor, PAC treatments during the 2010 growing season (similar results were obtained in experiments carried out in 2011 growing season). GA3 and PAC (0.8 mM) included Triton X-100 (0.025%). Internodes and rachises were treated with 121 μM GA3, while berries were treated with 90 μM GA3. Tissues/organs were dipped or sprayed until run-off. Increase in size was monitored at specific time intervals. Young shoots and inflorescences with tightly packed flowers (stage 15, E-L 15, on the Modified Eichhorn and Lorenz system) were selected for internodes and rachis experiments, respectively. Clusters with berries of 2–3 mm diameter (E-L 27) were selected for berry experiments. (A,C) Gross morphology of representative internodes of BF and SB after 20 days of treatment. (E,G) Gross morphology of representative rachises of BF and SB after 20 days of treatment. (I,K) Gross morphology of representative berries of BF and SB after 30 days of treatment. (B,D) Average per cent increase in length of new internodes arising after treatment. Increase in length of internode is expressed as per cent increase of initial length, which was assumed to be 0.5 mm. (F,H) Average per cent increment (as a factor of pre-treatment length) in length of rachises of BF and SB. (J,L) Average per cent increase in berry weight relative to mean weight at time of treatment (0 day). Data points with different letters indicate significantly different values according to Tukey HSD LSMean test at α = 0.05 and 25 measurements, except for berries with 150 measurements. Bar = 5 cm.
Response of VvGASA Genes to Exogenous GA3 and PAC
Some Arabidopsis GASA genes exhibit markedly different responses to GA3 (Aubert et al., 1998), and function downstream of DELLA and PIFs to regulate GA signaling and response (Zhang and Wang, 2008). To evaluate whether the varietal differences in GA response described above result from factors downstream or upstream of VvGASA genes, we analyzed VvGASA transcripts in GA3- and PAC-treated rachis and berries of BF and SB (Supplementary Figure S1). In rachis of BF, PAC treatment increased VvGASA1 transcripts by 2.5-fold but reduced VvGASA2 and VvGASA3 expressions by 1.8- and 2-fold, respectively, and had no effect on VvGASA4, VvGASA5, and VvGASA6 expressions. Similarly, rachis of SB exhibited upregulation of VvGASA1 transcripts by 3.7-fold but no change in expression of the other VvGASA paralogs. Application of GA3 to rachis of BF increased VvGASA3 and VvGASA4 expressions by 3.2- and 2.4-fold, respectively, but had no effect on other VvGASA genes. GA3 treatment increased VvGASA1, VvGASA3, and VvGASA4 transcripts in SB rachis by 3.7-, 3-, and 4-fold, respectively, reduced VvGASA5 expression by 2.6-fold and had no effect on expression of VvGASA6.
Paclobutrazol treatment of BF berries had no effect on expression of VvGASA genes, except VvGASA4 and VvGASA5 whose expressions were 1.7-fold down- and upregulated, respectively. Conversely, PAC application to berries of SB increased VvGASA1, VvGASA5, and VvGASA6 transcript by 7-, 1.7-, and 2.7-fold, respectively, and reduced VvGASA3 transcript by 1.5-fold. When berries of BF were treated with GA3, expression of VvGASA2, VvGASA3, and VvGASA4 was increased by 1.7-, 4-, and 6-fold, respectively, while VvGASA1, VvGASA5, and VvGASA6 expressions were decreased by approximately 2-fold. Similar treatment to SB berries resulted in 2-fold increase in VvGASA2 and VvGASA6 transcripts, and a 2.8-fold upregulation of VvGASA4 expression.
The significant varietal differences of VvGASA expressions in response to GA may indicate that varietal differences in organ response is mediated by factors upstream of the VvGASA genes. Thus, similar to other plants in which GA signaling regulates GA-related plant growth (Achard and Genschik, 2009), it is hypothesized that variations in response to GA3 may, at least partly, be determined by qualitative and/or quantitative variations of the signaling components.
Allelic Variations Did Not Influence Interactions between GA Signaling Components
To check whether the differences in GA response between BF and SB are the result of allelic variation that may affect the quality of interaction and hence GA-mediated VvDELLA degradation, all alleles of the previously characterized grapevine VvDELLAs, VvGID1s, and VvSLY1s (Acheampong et al., 2015) in both BF and SB were sequenced. Functional interactions between the GA signaling components were also analyzed by Y2H assays. Nucleotide sequence analyzes showed cultivar-specific point mutations in VvGID1a, VvGID1b, VvSLY1a, and VvSLY1b genes (Supplementary Figures S2A–D). Yet, these mutations did not result in changes in coded amino acids as these amino acid sequences were similar to previously sequenced genes of TS (Acheampong et al., 2015). There were no cultivar-specific differences in the nucleotide or amino acid sequences of VvDELLA1. However, there were substitutions in sequences of VvDELLA2 of both cultivars at positions 22 (A-G substitution), 35 (C-G substitution), 1161 (A-G substitution), and 1426 (C-T substitution) (Supplementary Figure S2E). The first two resulted in S8G (Ser at position 8 of BF replaced by Gly in SB), and A12G (Ala at position 12 replaced by Gly) substitutions (Supplementary Figure S2F). Deletion of nucleotide sequence GGC (number 46-48) in VvDELLA2 of BF, compared to SB, resulted in the in-frame deletion of Gly at position 16. Two alleles of VvDELLA3 differed between the cultivars in nucleotide substitutions G-C at positions 38 and 394, A-T at position 390, A-C at position 1092 and 1538, and T-C substitution at 1320 (Supplementary Figure S2G). While sequence variations between alleles of BF did not result in changes in amino acids, there was S13T (Ser–Thr) amino acid substitutions at position 13 of SB. Comparing BF ORF to ORFs of both alleles of SB, there were Ser–Thr and Glu–Gln substitutions at positions 13 (S13T) and 132 (E132Q), respectively (Supplementary Figure S2H).
These varietal changes in amino acid sequences of VvDELLA2 and VvDELLA3 did not result in significant differences in strength of interaction with VvGID1s (Figure 2A) or VvSLY1s (Figure 2B) in Y2H assays. Similar to clones of TS (Acheampong et al., 2015), both VvGID1 homologs interacted with each of the VvDELLA2 clones from both cultivars in a GA-dependent manner, while VvGID1b did not interact with any of the VvDELLA3 alleles, even in the presence of GA3. Compared to VvSLY1a, VvSLY1b interacted stronger with all VvDELLA homologs and alleles.
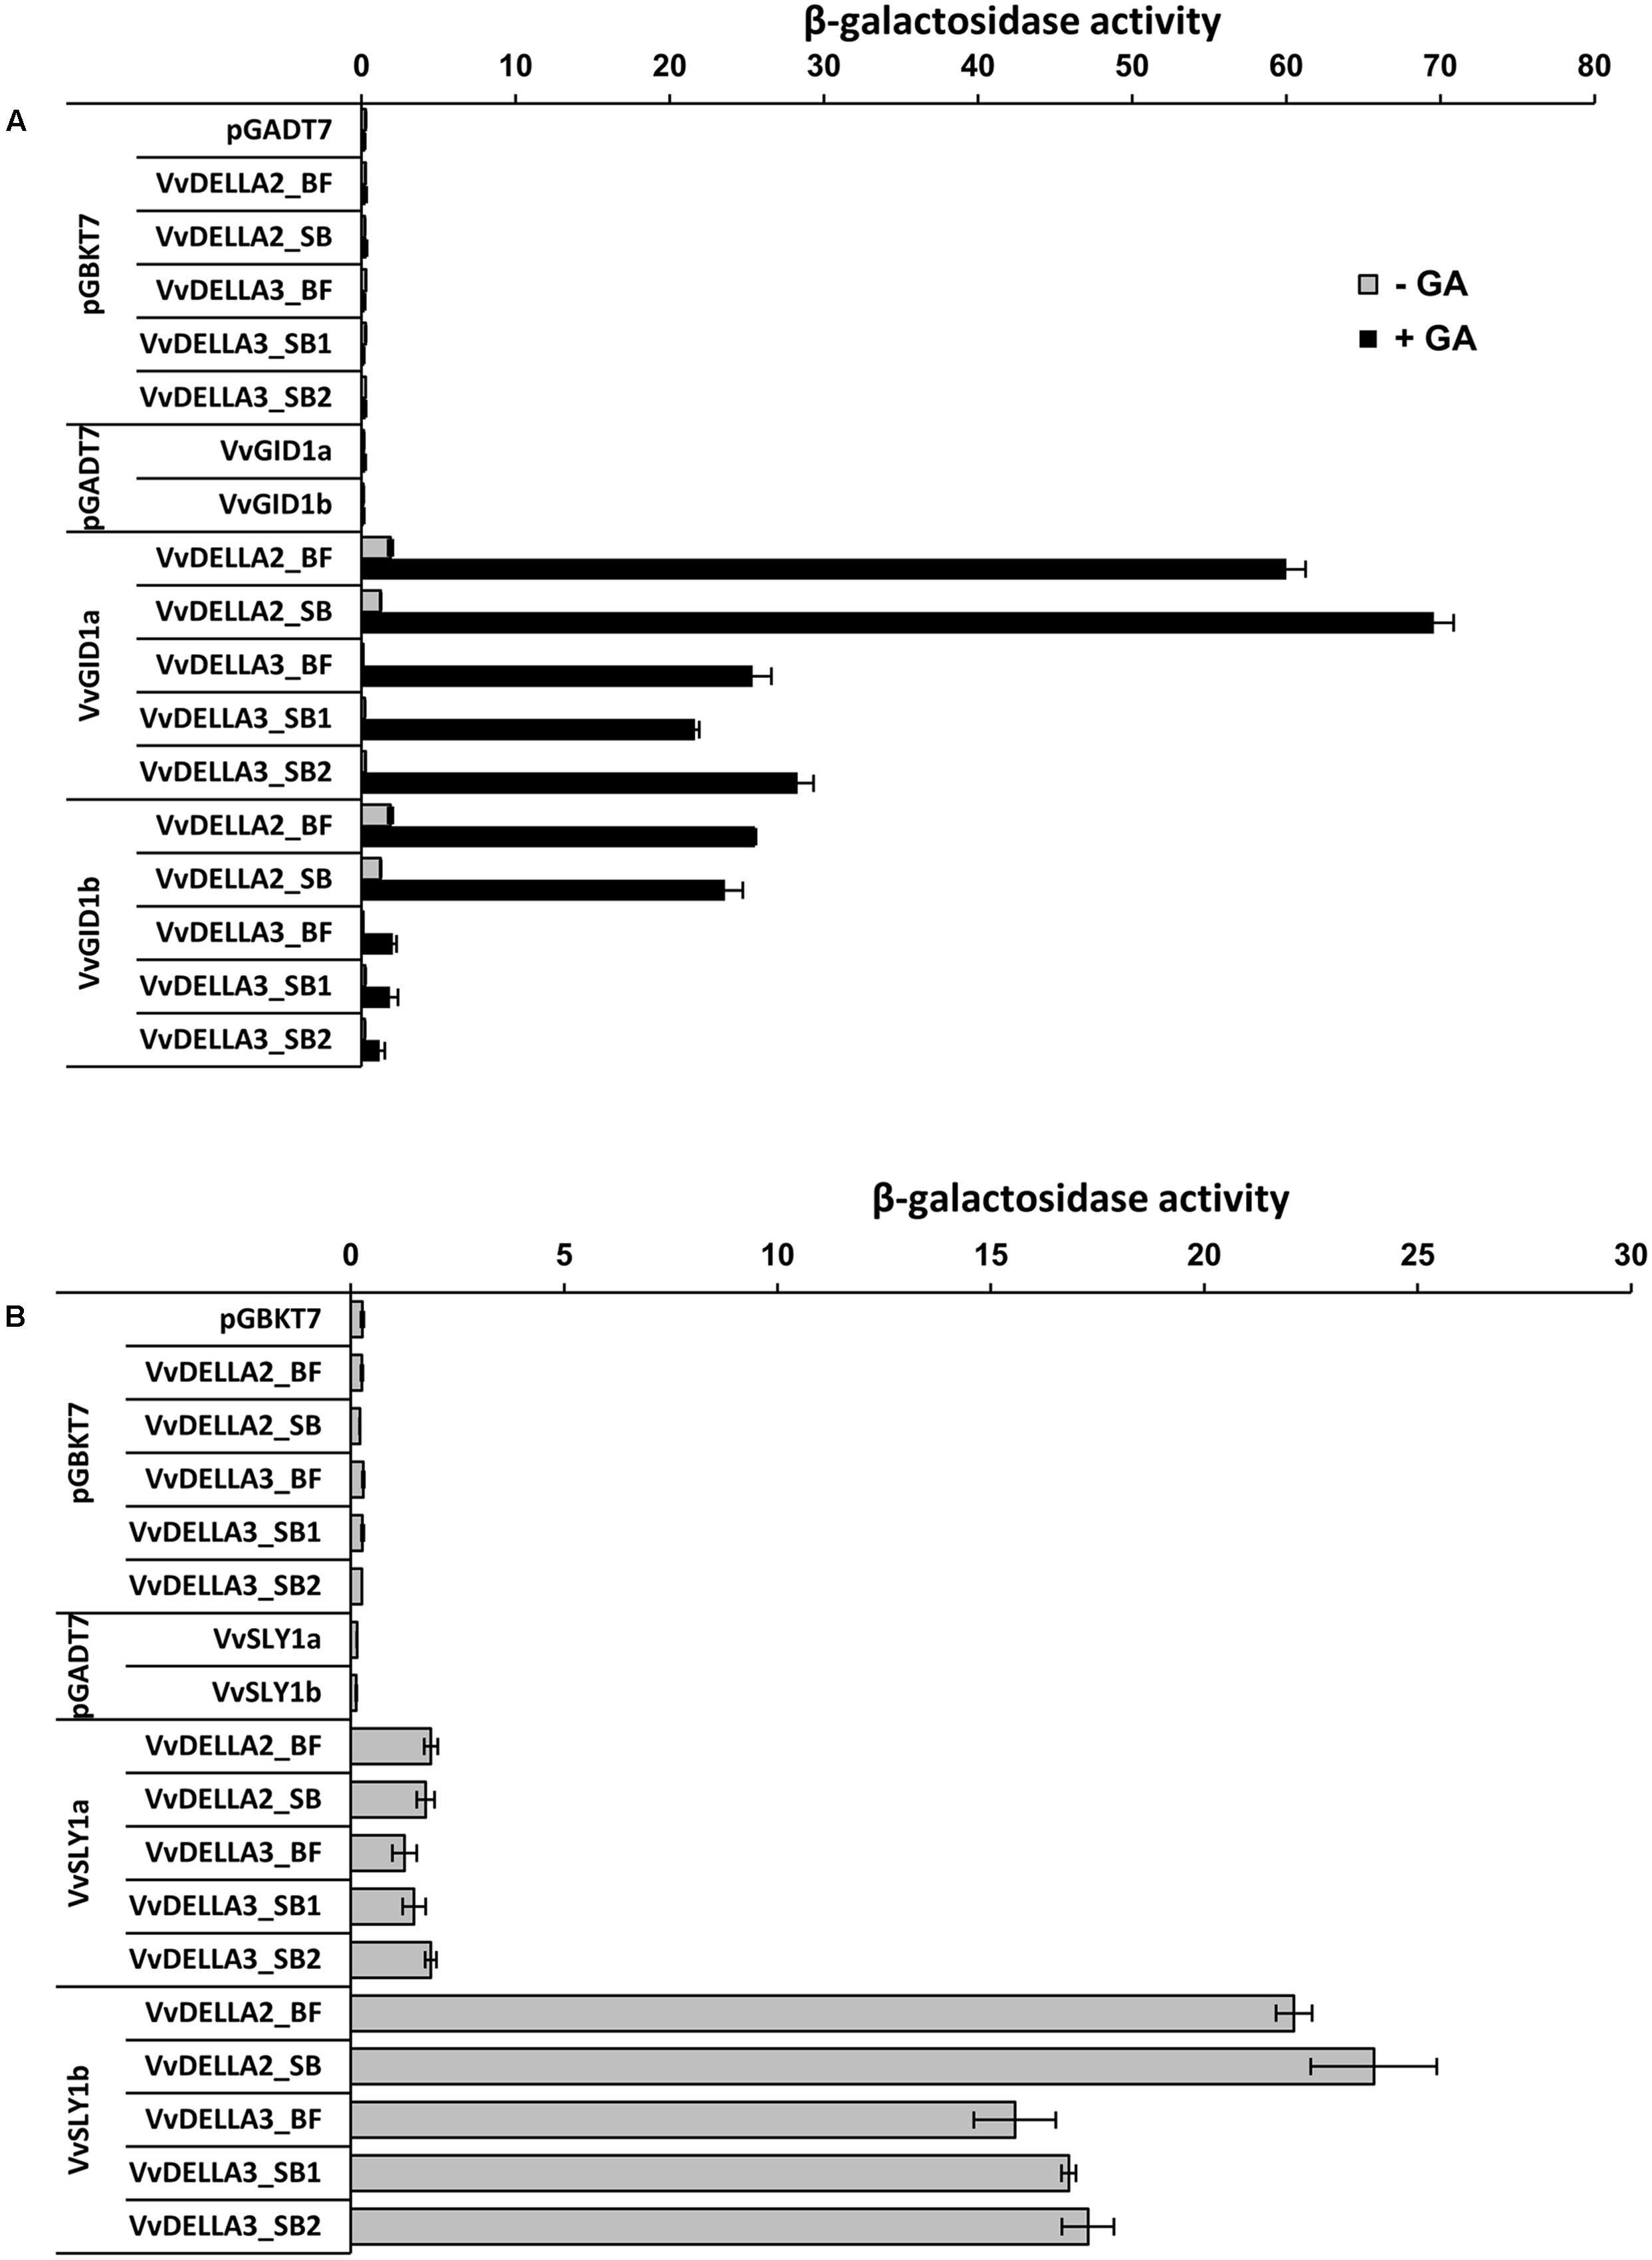
FIGURE 2. Different alleles of VvDELLAs isolated from cv. Black finger (BF) and cv. Spring blush (SB) interact with VvGID1s and VvSLY1s in Y2H assays. (A) Interaction between VvDELLAs and VvGID1s proceed in a GA-dependent manner. The addition of 100 μM GA3 to the medium enhanced GID1–DELLA interactions. (B) Interaction between VvDELLAs and VvSLY1s. VvDELLA3_SB1 and VvDELLA3_SB2 represent the two alleles of VvDELLA3 isolated from SB. The bars represent the mean ± SE of at three replicates.
Results of qRT-PCR analyses show that there was no obvious effect of GA3 or PAC treatments on the expressions of all three VvDELLA genes in both cultivars after 6 and 24 h (Supplementary Figure S3). VvDELLA1, which did not have any sequence variation between the cultivars, was included in this analysis as a control. It should be noted that the VvDELLA3 expression results represent total VvDELLA3 expression of both alleles.
Organs of BF, the Cultivar with Higher Response to GA3, Accumulated Remarkably Higher Levels of VvDELLA Proteins
Since both loss-of-function and gain-of-function DELLA mutants display impaired GA signaling and are defective in GA response (Dill et al., 2001; Ikeda et al., 2001; King et al., 2001; Boss and Thomas, 2002), we assumed that varietal differences in VvDELLA quantities may result in differences in response to GA: a variety with higher VvDELLA quantities will exhibit greater growth repression and subsequently higher response to GA application, compared to variety with lower quantities. Accordingly, transcript and protein levels of the previously characterized VvDELLAs paralogs were determined in both cultivars.
Similar to other grapevine cultivars (Boss and Thomas, 2002; Acheampong et al., 2015), the VvDELLAs were expressed in all organs of BF and SB (Figure 3). As previously described for TS (Acheampong et al., 2015), VvDELLA1 and VvDELLA2 were the most predominant homologs in both BF and SB. Generally, VvDELLA2 and VvDELLA3 transcripts were higher in SB compared to BF organs of similar developmental stage. The only exceptions were in internodes, rachis and berries at 10 DAF where VvDELLA3 expressions were similar in both organs, and in young and mature leaves where VvDELLA3 was 1.5- and 4-fold higher in BF.
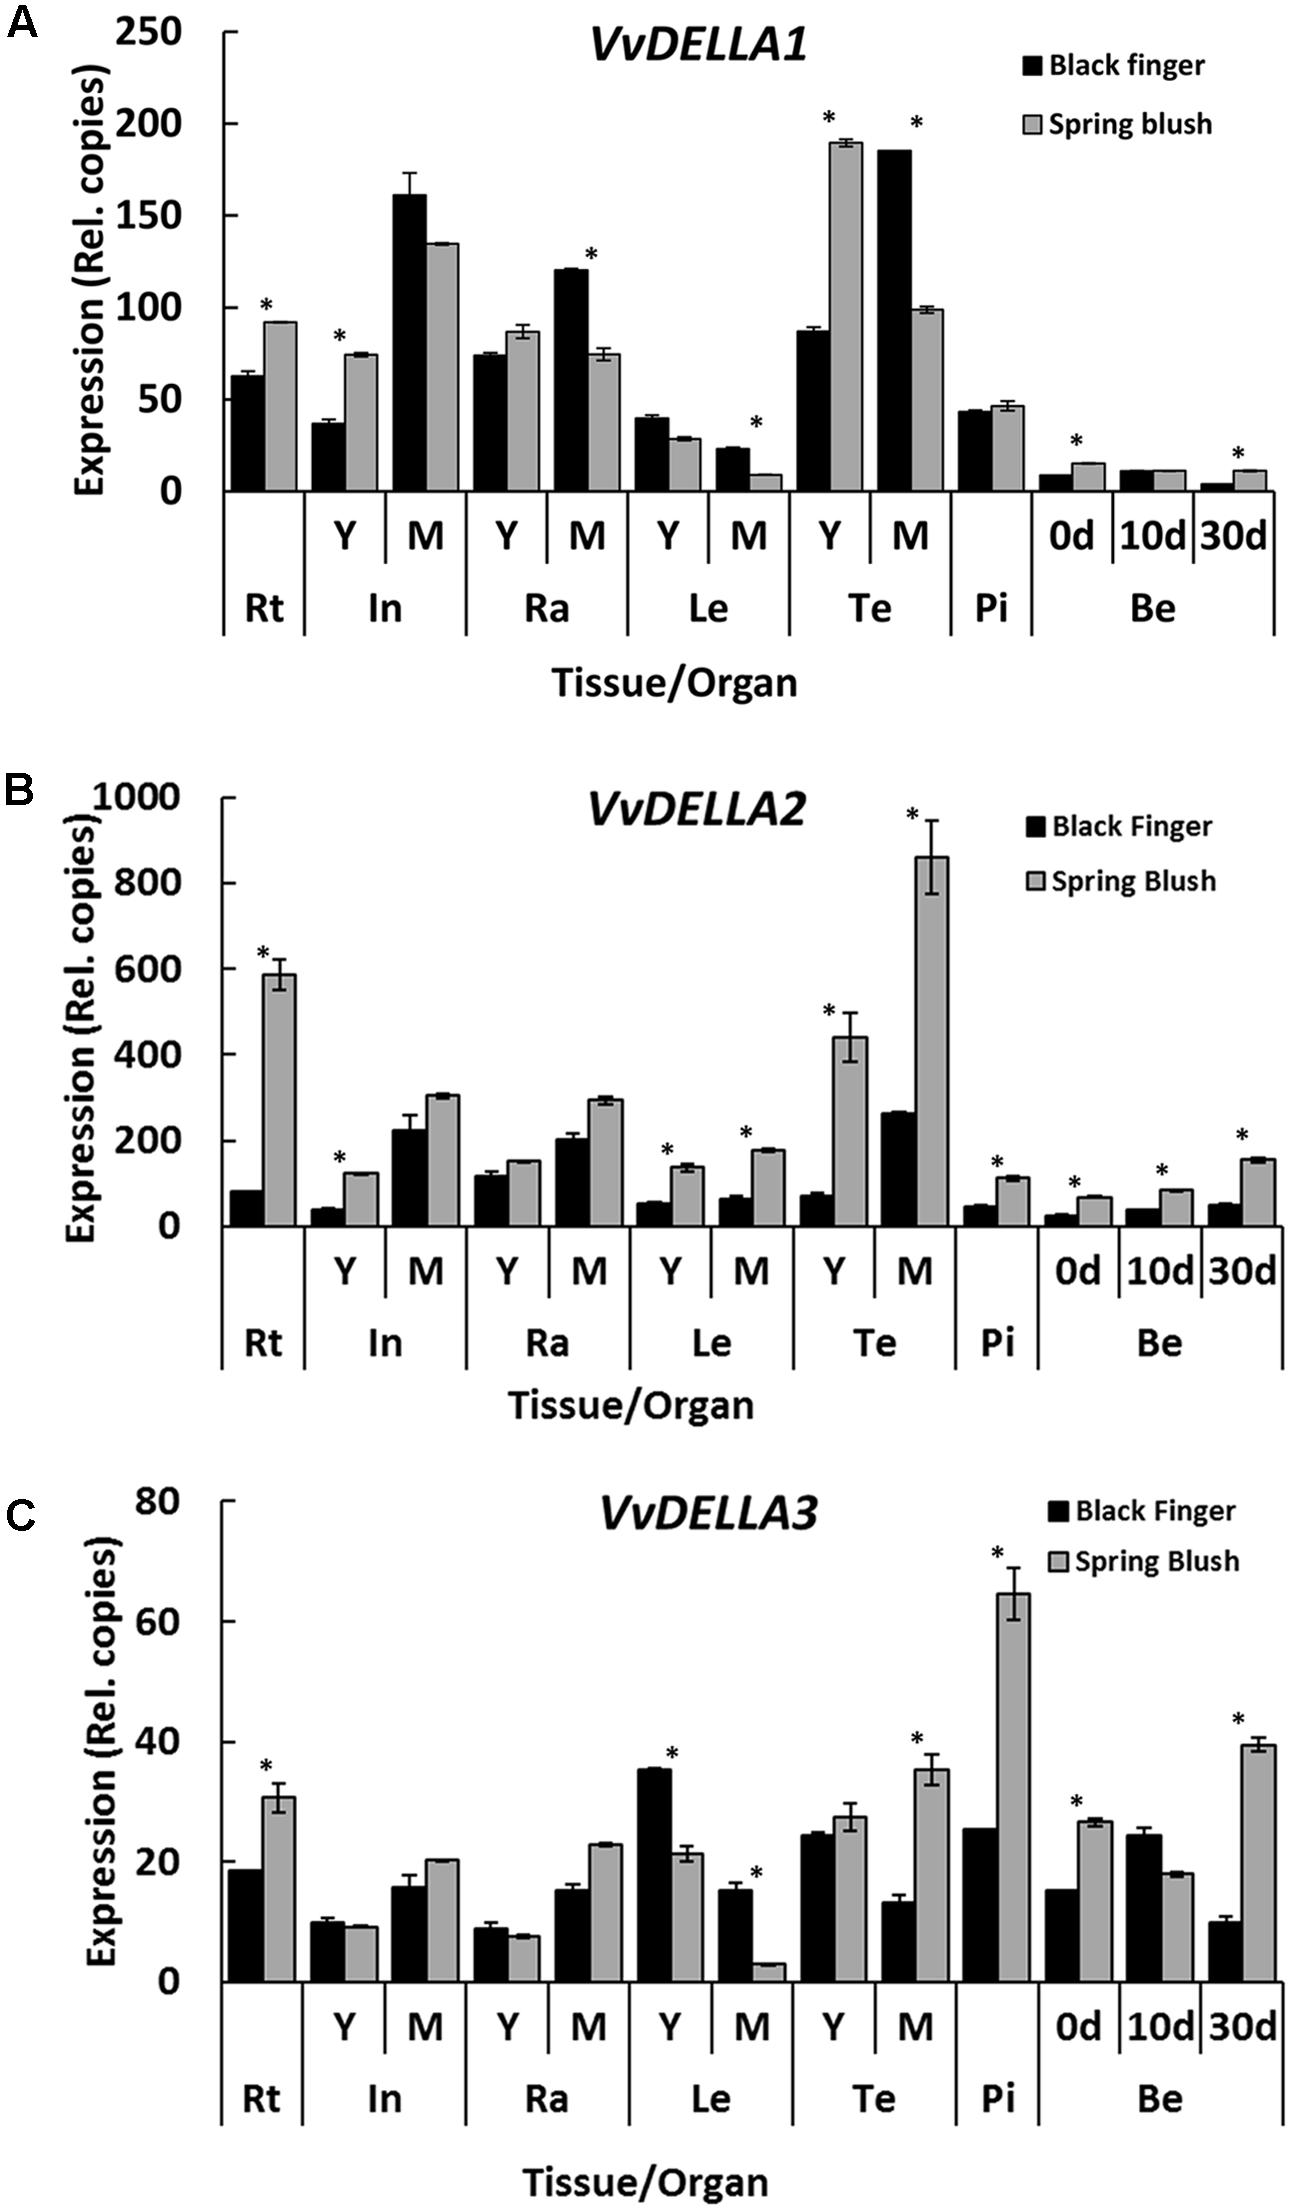
FIGURE 3. Spatio-temporal expression profile of VvDELLA paralogs in V. vinifera cv. Black finger (BF) and cv. Spring blush (SB). Spatial and temporal expression profiles of VvDELLA1 (A), VvDELLA2 (B), and VvDELLA3 (C) in BF and SB organs sampled during the 2010 growing season. Total RNA was extracted from pooled samples, and the absolute mRNA levels of each gene were determined by real-time quantitative RT-PCR (qRT-PCR) and normalized against VvGAPDH. To ensure accurate quantitation of transcript levels, primers of similar efficiencies were used, and calibration curves determined from known copy numbers of single plasmid containing all qRT-PCR amplicons. The bars represent the mean ± SE. of three biological repeats with two technical repeats each. Asterisks (∗) indicates relative expression levels that are significantly different (Student’s t-test; P < / > 0.05) between both cultivars. Statistical significance of relative expression values among organs of individual cultivars were calculated using Tukey HSD LSMean test at α = 0.05, and presented in Supplementary File S2. In, internodes; Ra, rachis; Le, leaves; Te, tendrils; Pi, pistils; Be, berries; 0 d, berries sampled at 2–3 mm diameter (E-L 27); 10 d, berries sampled 10 days after E-L 27; 30 d, Berries sampled 30 days after E-L 27; Y, young; M, mature. The experiment was repeated during 2011 growing season.
The fact that in grapevines and other model plants DELLA is mostly regulated by its protein turnover and not transcript quantities (Dill et al., 2004; Arana et al., 2011; Acheampong et al., 2015), prompted us to determine quantities of VvDELLA proteins in both cultivars. Results of immunoblot analyzes, using the gene specific anti-VvDELLA polyclonal antibodies show considerably higher levels of the three VvDELLA proteins in all young organs of BF, compared to SB organs at similar developmental stage (Figure 4).
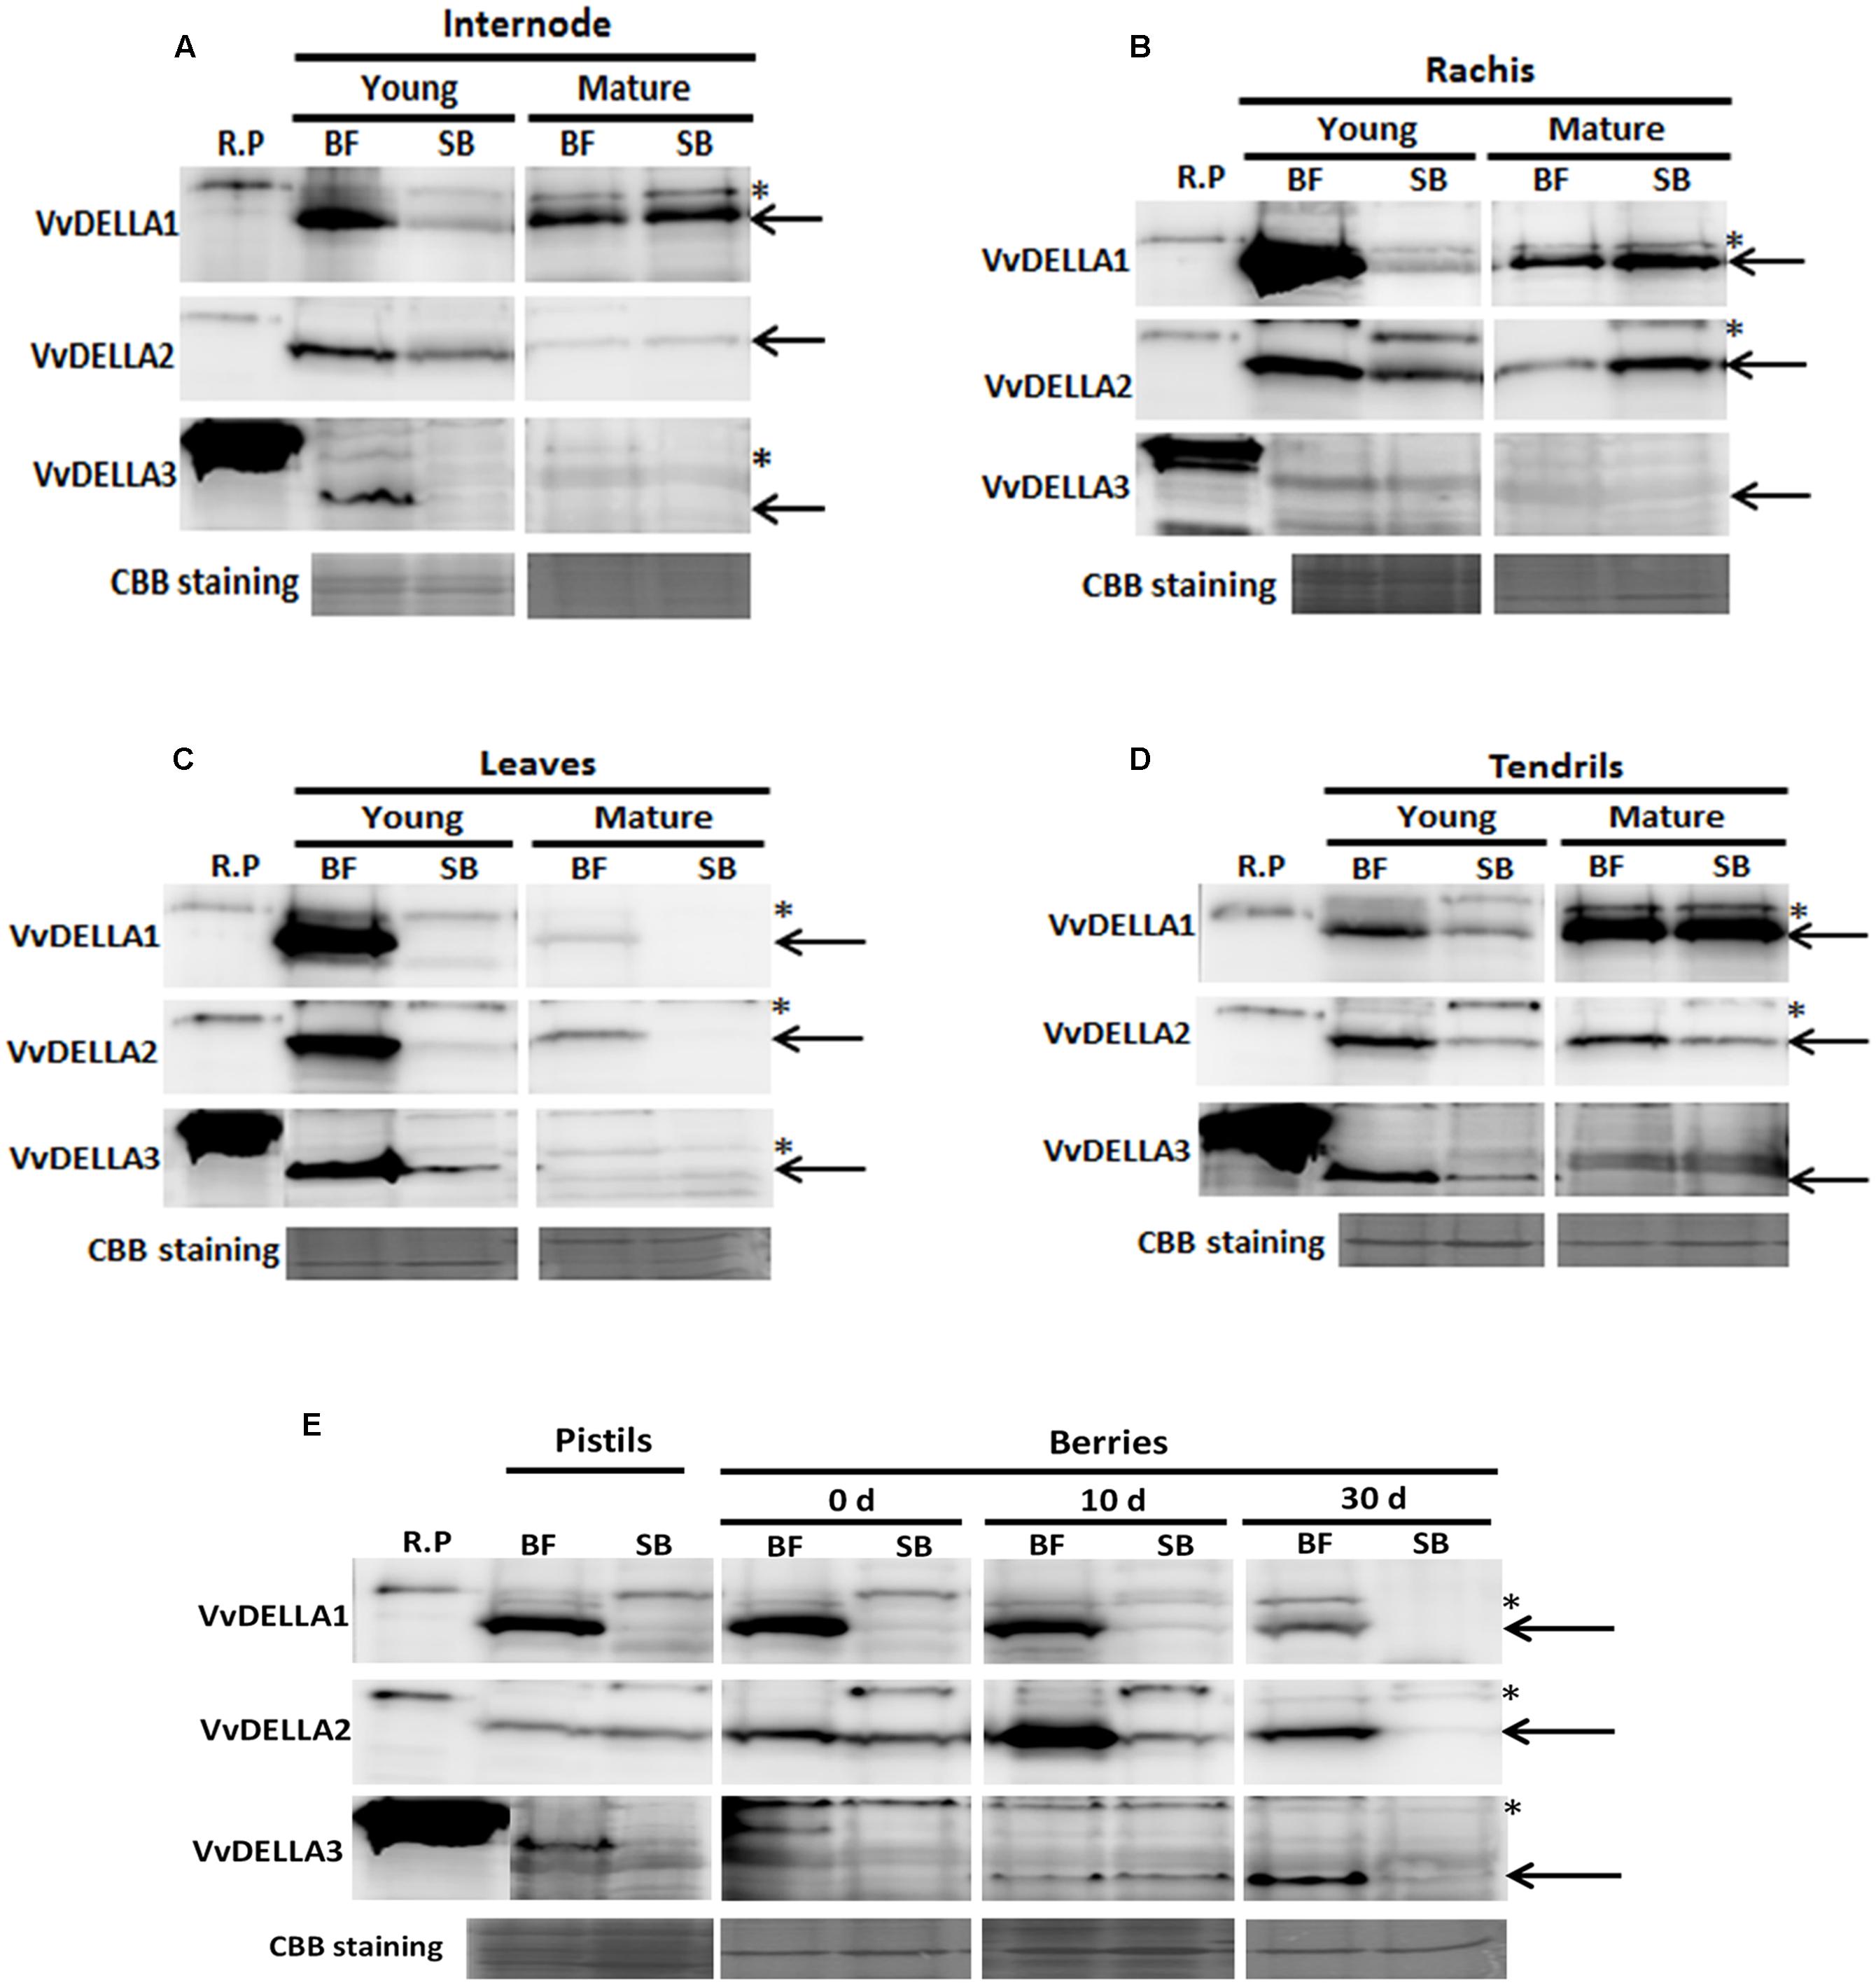
FIGURE 4. Spatio-temporal profile of VvDELLA proteins in V. vinifera cv. Black finger (BF) and cv. Spring blush (SB). Blots of total protein extracted from internodes (A), rachises (B), leaves (C), tendrils (D), pistils and berries (E) at different developmental stages. Sampling of the tissues was carried out in 2010. Blots were incubated with affinity-purified, gene-specific, anti-VvDELLA polyclonal antibodies. Recombinant full-length proteins (R.P.) (3.75 ng each of VvDELLA1 and VvDELLA2 and 37.5 ng of VvDELLA3) were used as sizing controls. Coomassie Brilliant Blue-stained (CBB) proteins were used as loading control. In all lanes except R.P., solid black arrows show band of interest, and asterisked-bands (∗) indicate non-specific proteins detected by the anti-VvDELLA antibodies. Differences in sizes of R.P. and endogenous VvDELLA proteins result from V5 and 6xHis tags on the R.P. 0 d, berries sampled at 2–3 mm diameter (E-L 27); 10 d, berries sampled 10 days after E-L 27; 30 d, berries sampled 30 days after E-L 27. Similar results were obtained when samples collected in 2011 growing season were analyzed.
Levels of VvDELLA1, VvDELLA2, and VvDELLA3 proteins were 20-, 4-, and 38-fold higher in young internodes of BF, compared to SB (Figure 4A), and decreased during BF internode development. In general, VvDELLA levels in mature internodes were similar in both varieties. VvDELLA1 and VvDELLA2 were 38- and 6-fold higher in young rachis of BF compared to SB, whereas VvDELLA3 was not detected in both young and mature rachis of both varieties (Figure 4B). VvDELLA1 and VvDELLA2 protein level decreased during BF rachis maturation, but in SB the protein quantities of these genes increased, and were 2- and 22-fold higher in mature rachis of SB compared to BF.
While high levels of VvDELLA1 and VvDELLA2 proteins were detected in young leaves of BF, these proteins were not detected in young SB leaves (Figure 4C). VvDELLA3 was 16-fold higher in young leaves of BF compared to SB. Generally, VvDELLA levels decreased as leaves of both cultivars mature. All three VvDELLA proteins were not detected in mature leaves of SB. Similar to most organs, VvDELLA1, VvDELLA2, and VvDELLA3 were 3-, 5-, and 11-fold higher in young tendrils of BF than SB (Figure 4D). Whereas VvDELLA1 accumulated during tendril development of both cultivars, the quantities of VvDELLA2 were unchanged, while VvDELLA3 reduced. VvDELLA1 was similar in both mature tendrils of BF and SB, while VvDELLA2 was 4-fold higher in BF than SB. VvDELLA3 was not detected in mature rachis of both cultivars.
VvDELLA1 was present in substantially high level in BF pistils but was barely detected in pistils of SB (Figure 4E). VvDELLA2 and VvDELLA3 quantities were similar in pistils of both cultivars. While VvDELLA1 was not detected in berries of SB, significantly high levels of the protein was present throughout berry development of BF. VvDELLA2 was present in both BF and SB berries but was significantly higher in BF berries at all analyzed time points (8-, 73-, and 203-fold, respectively, higher in BF in berries at 0, 10, and 30 DAF). Interestingly, whereas VvDELLA2 protein accumulation was low and gradually decreased during SB berry development, the quantities of this protein in berries of BF peaked at 10 DAF. VvDELLA3 was undetected in both cultivars at 0 DAF, similar at 10 DAF, but was 30-fold higher in BF at 30 DAF. Similar to VvDELLA2 in BF, the levels of VvDELLA3 in berries of SB was highest at 10 DAF, while the levels of the protein in BF progressively increased during development of BF berries.
One potential explanation for the higher levels of DELLA proteins in BF was that GA signaling and GA-dependent proteolysis of VvDELLA is impaired in young organs of BF. As both exogenous and endogenous bioactive GAs regulate DELLA proteins accumulation and GID1 transcripts by negative feedback mechanism in grapevine and other species (Ueguchi-Tanaka et al., 2005; Griffiths et al., 2006; Voegele et al., 2011; Lange et al., 2012; Acheampong et al., 2015), we evaluated the possibility of altered GA signaling by analyzing the levels of VvGID1s transcripts and VvDELLA proteins in BF and SB in response to GA. In accordance with the negative feedback regulation, GA application downregulated VvGID1 transcripts, while PAC upregulated expression of the genes in organs of both cultivars (Supplementary Figures S4A–D). Similar results were obtained in the 2011 growing season (data not shown). Immunoblot analyses of young organs also show that both VvDELLA1 and VvDELLA2 proteins were significantly reduced in response to GA (Figure 5). Whereas VvDELLA1 was very low in internodes of SB, it was very high in untreated internodes of BF. GA treatment caused a 6-fold reduction in levels of this protein in internodes of BF. The same treatment resulted in 12- and 3-fold reduction in VvDELLA2 quantities in internodes of BF and SB, respectively. Similar GA treatments also led to significant reduction in protein levels of VvDELLA1 and VvDELLA2 in rachis and pistils of both cultivars. Due to a limiting amount of sampled tissues, similar in planta assay could not be conducted to ascertain the GA-dependent VvDELLA3 degradation. While these results suggest that GA signaling and GA-dependent proteolysis of VvDELLA are functional in both varieties, they do not exclude potential differences in efficiency of such proteolysis.
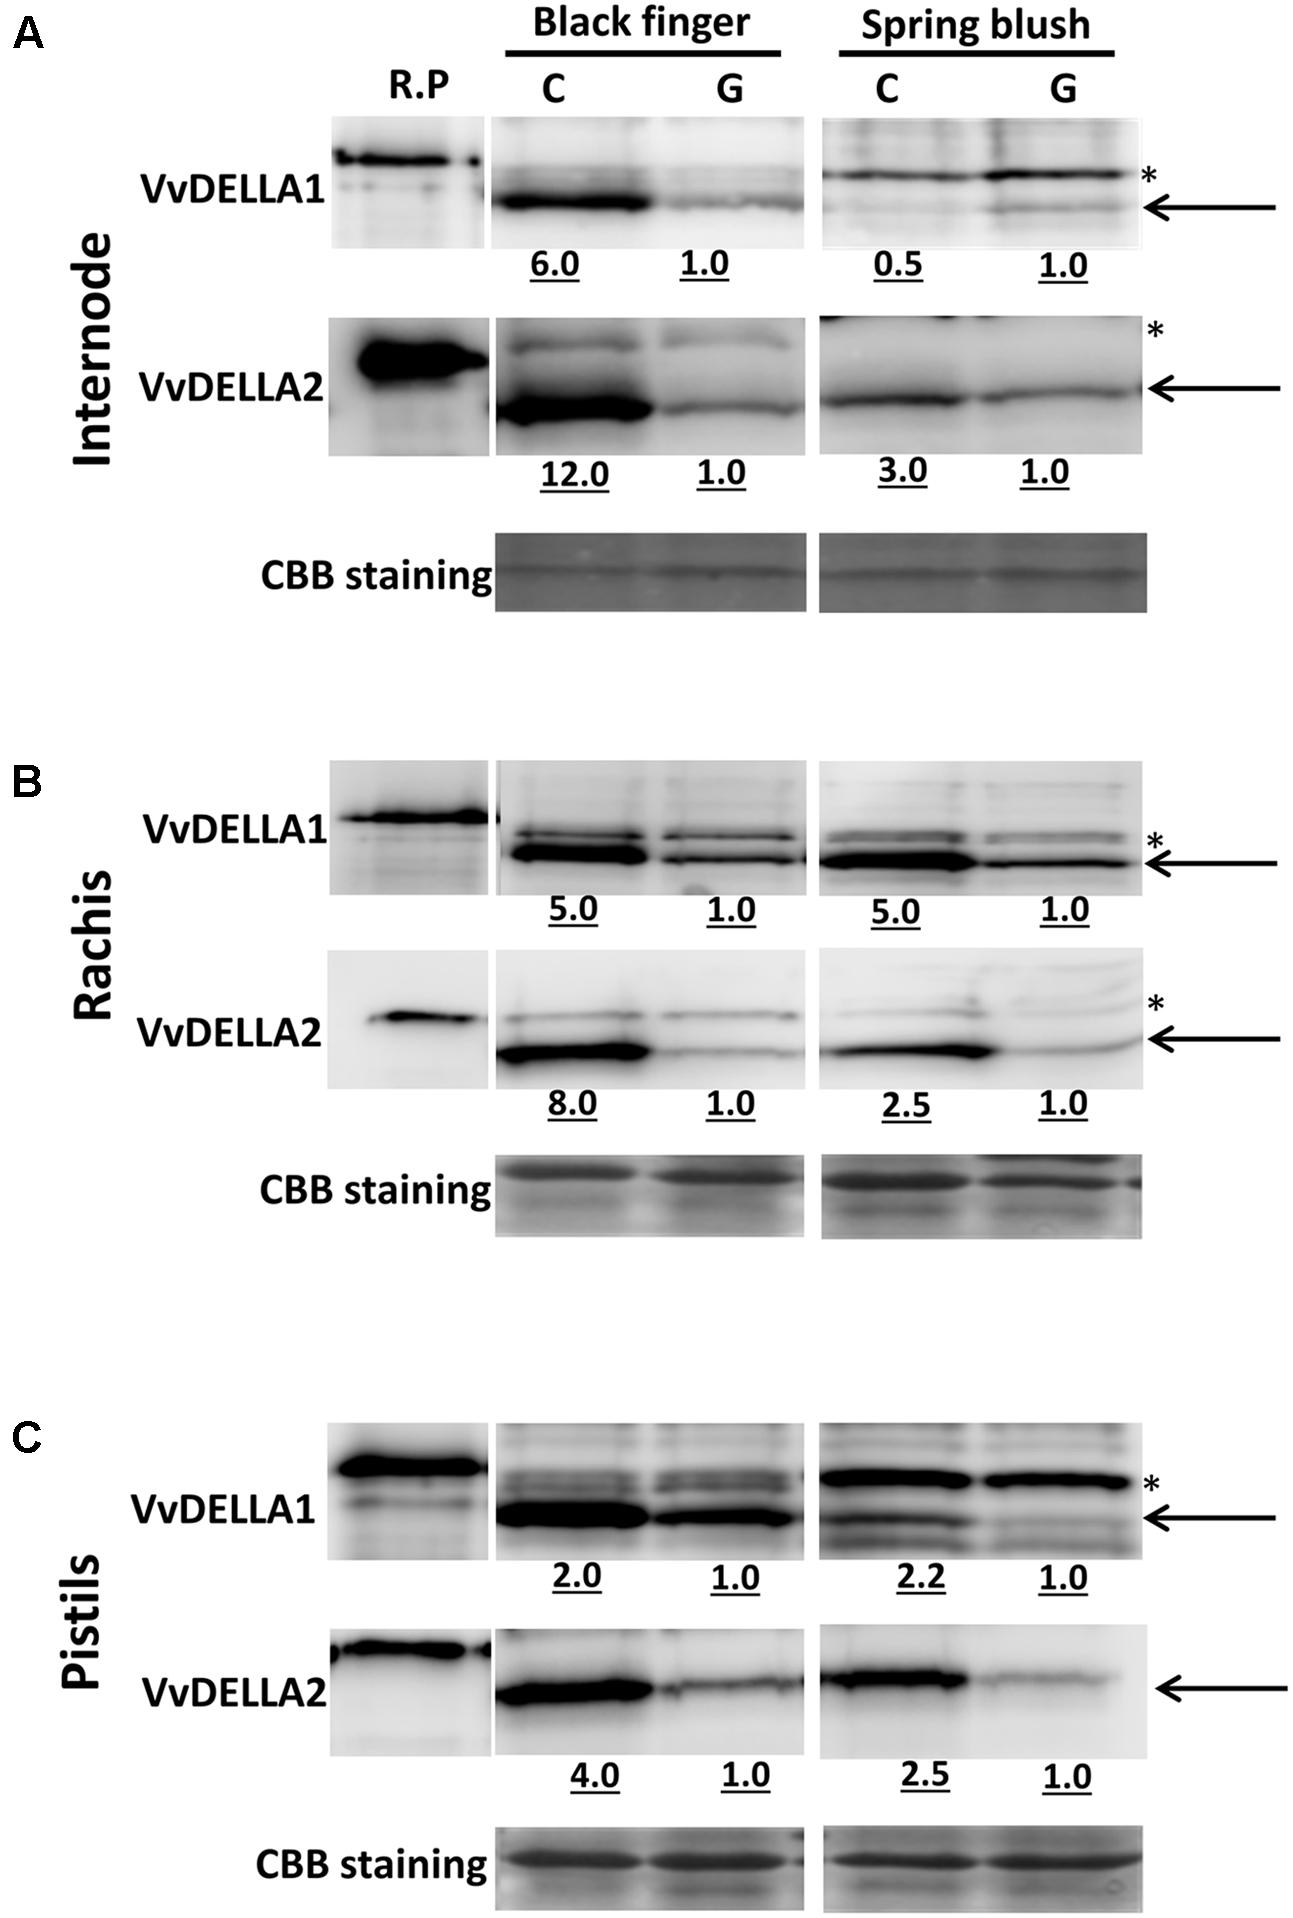
FIGURE 5. Effect of GA3 application on VvDELLA accumulation in V. vinifera cv. Black finger (BF) and cv. Spring blush (SB). GA3-induced degradation of VvDELLA1 and VvDELLA2 proteins in internodes (A), rachis (B), and pistils (C) of BF and SB collected during the 2010 growing season. Immunoblot analyzes of VvDELLA proteins in organs were carried out using protein-specific, affinity-purified, anti-VvDELLA polyclonal antibodies. Total proteins were extracted from organs treated for 6 h with GA3 (G, 121 μM for rachis, and 90 μM for pistils). Control (C) samples were treated with Triton X-100 (0.025%). Physiological stage at which organs were treated is detailed in “Materials and Methods.” Recombinant full-length proteins (R.P.) (3.75 ng each of VvDELLA1 and VvDELLA2) were used as size controls. In all lanes except R.P., solid black arrows show band of interest, and Asterisked-bands indicate non-specific proteins detected by the anti-VvDELLA antibodies. Differences in sizes of R.P. and endogenous VvDELLA proteins result from tags on the R.P. Underlined numbers indicate intensity of bands relative to GA3-treated samples as determined by ImageJ. Consistent results were obtained when the experiment was repeated during the 2011 growing season.
To investigate other sources for the observed varietal differences in VvDELLA accumulation, we analyzed factors such as mRNA quantities of GID1s and SLY1s, and levels of endogenous GAs; all of which mediate changes in DELLA proteolysis/accumulation in different species (Dill et al., 2001; King et al., 2001; McGinnis et al., 2003; Sasaki et al., 2003; Griffiths et al., 2006; Willige et al., 2007; Li et al., 2011).
BF, the Cultivar with Higher Response to GA3, Had Lower Level of VvSLY1b Transcript
Young organs/tissues of SB generally presented higher VvSLY1 transcripts than corresponding organs of BF (Figures 6A,B). Compared to BF, VvSLY1b transcript was 3-fold higher in young internode, pistils and young berries of SB, and 6-, 2-, and 12-fold higher in young rachis, leaves and tendrils of SB. VvSLY1b in mature internodes, rachis and tendrils, was 4-, 3-, and 6-fold, respectively, higher in SB, compared to BF. VvSLY1a expression was, however, only marginally higher in SB pistils (1.2-fold), young rachis (1.2-fold) and berries at 0 and 10 days (1.6- and 1.4-fold, respectively), and slightly lower in young leaves and tendrils of SB (0.2- and 0.3-fold, respectively). However, with the exception of mature tendrils, VvSLY1a was lower in mature organs of SB than BF, with leaves recording the highest differences of 3-fold. It is worth-noting that both cultivars displayed the inverse temporal expression profiles of VvSLY1 homologs, similar to the previously described profile of TS (Acheampong et al., 2015).
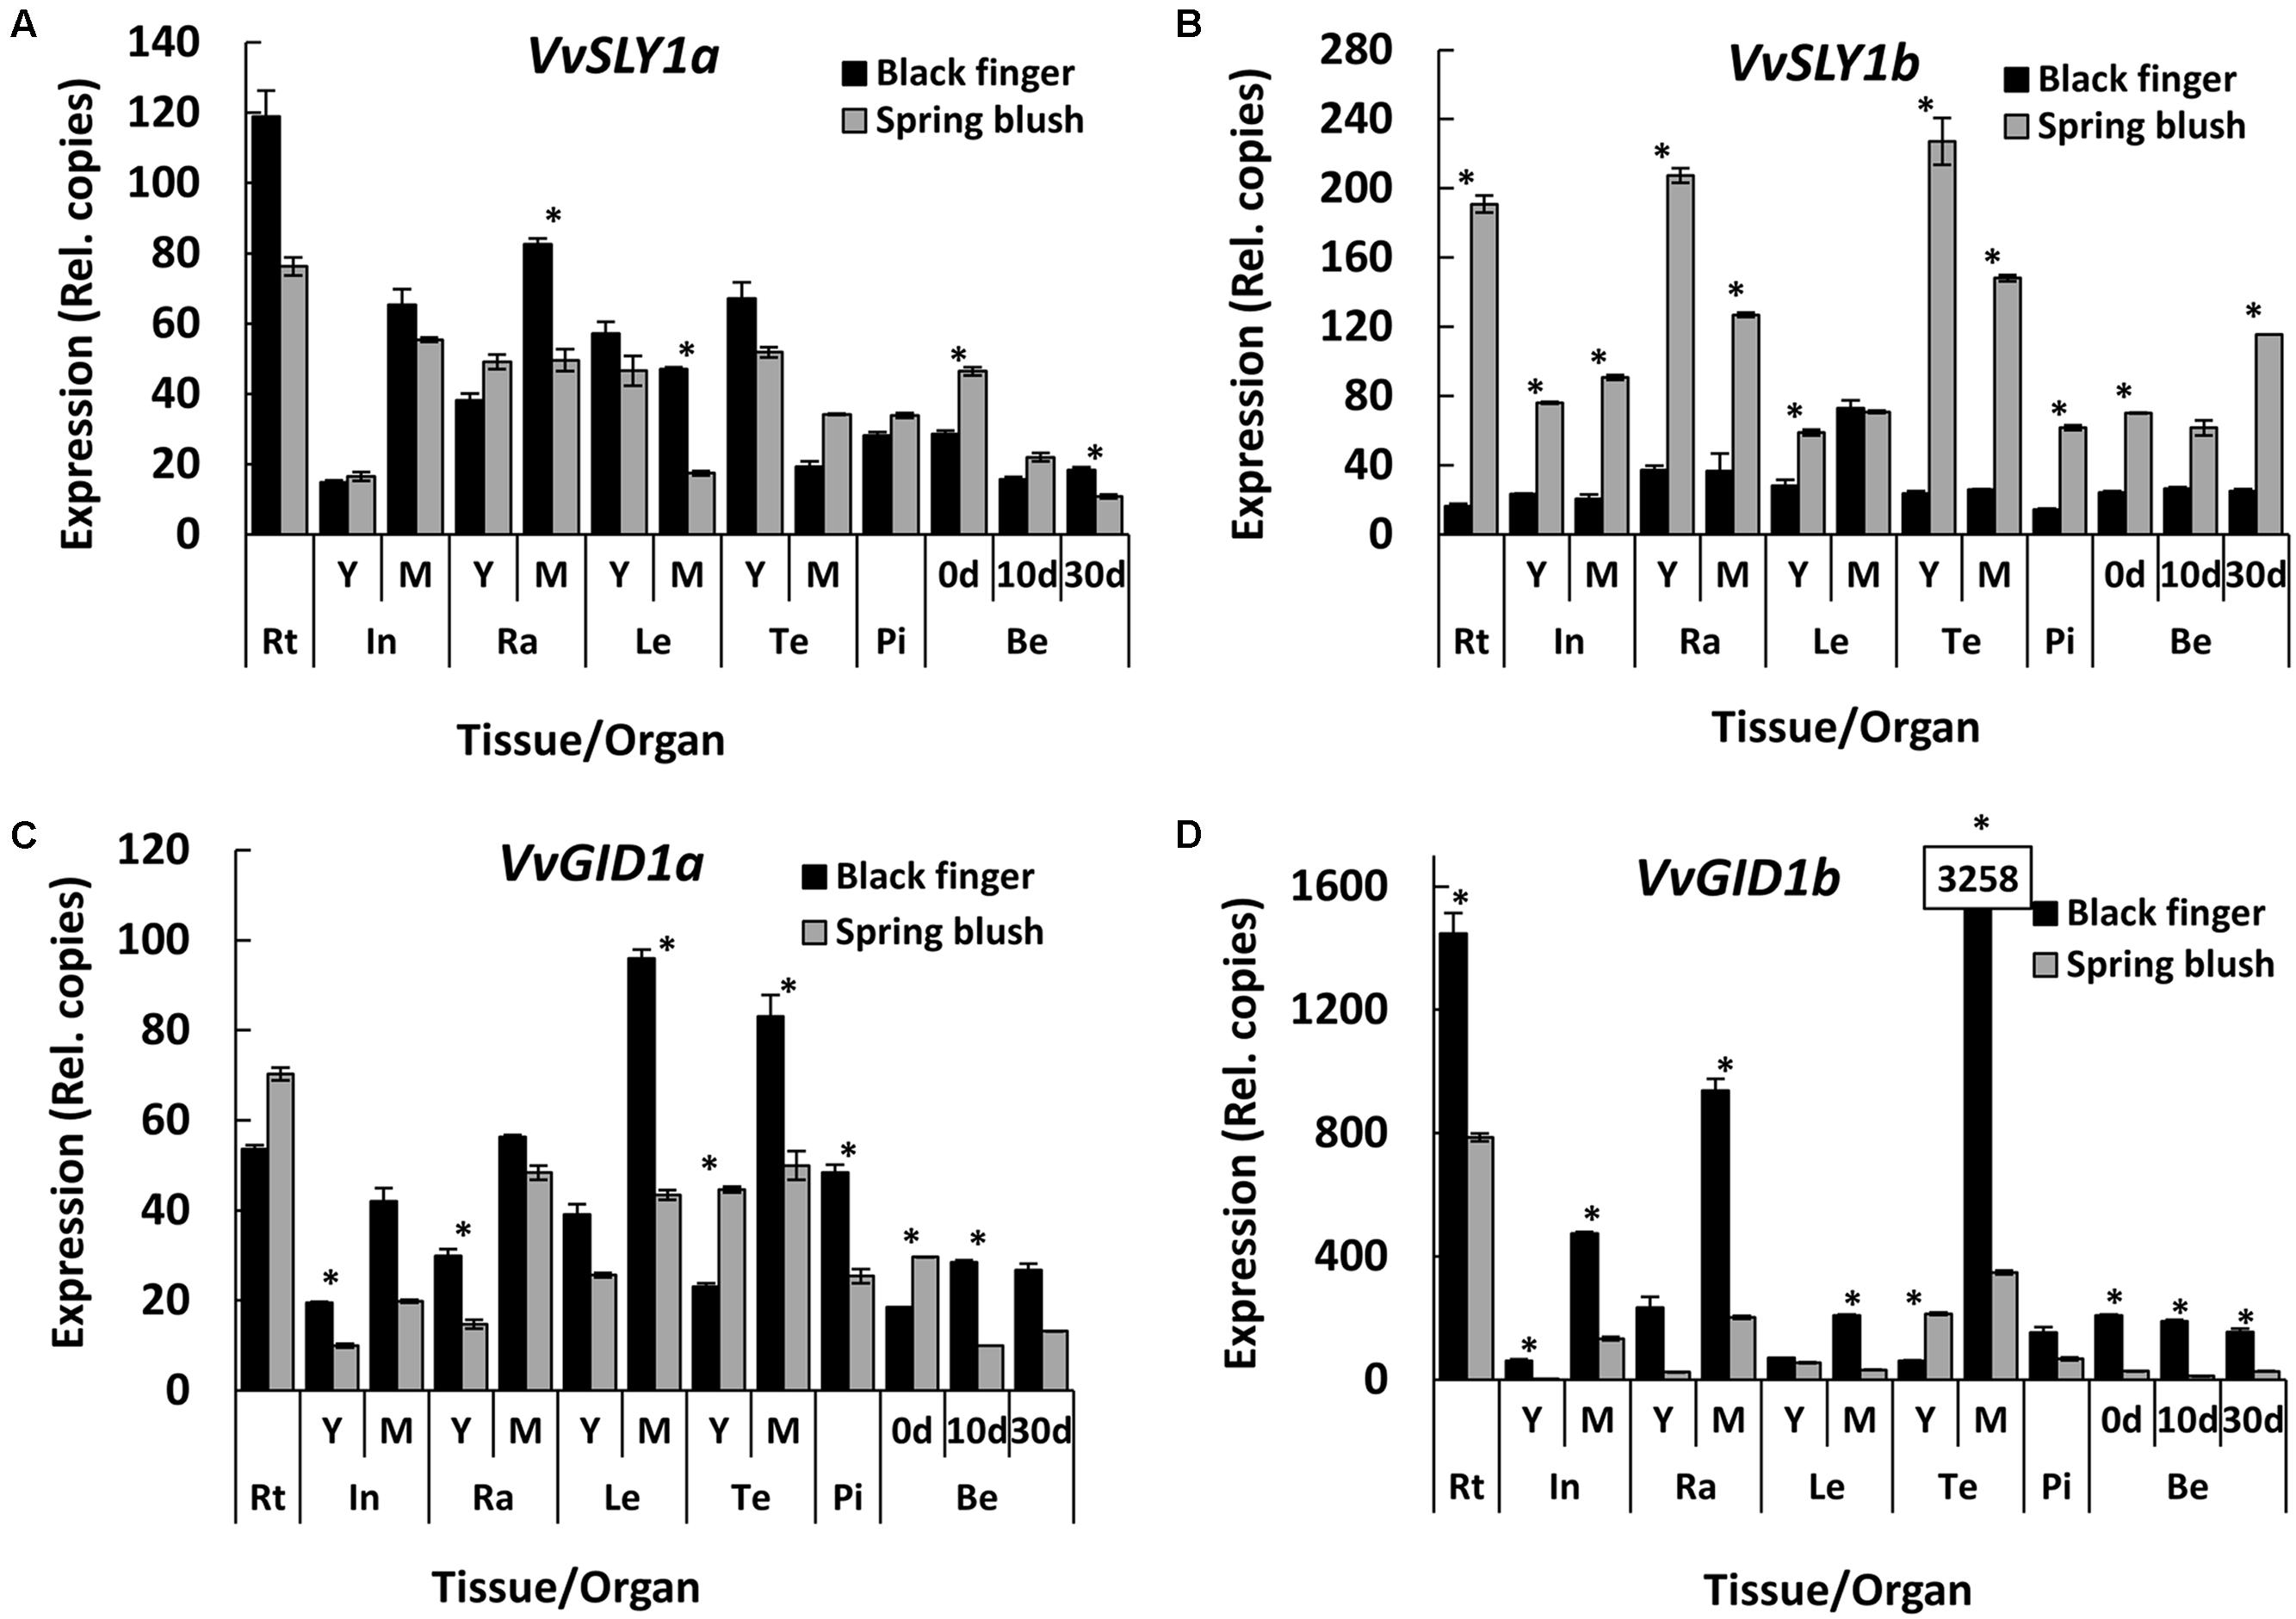
FIGURE 6. Spatio-temporal expression profiles of VvGID1 and VvSLY1 paralogs in V. vinifera cv. Black finger (BF) and cv. Spring blush (SB). Spatial and temporal expression profiles of VvSLY1a (A), VvSLY1b (B), VvGID1a (C), and VvGID1b (D) in BF and SB organs collected during the 2010 growing season. Total RNA was extracted from pooled samples, and the absolute mRNA levels of each gene were determined by real-time quantitative RT-PCR (qRT-PCR) and normalized against VvGAPDH. To ensure accurate quantitation of transcript levels, primers of similar efficiencies were used, and calibration curves determined from known copy numbers of single plasmid containing all qRT-PCR amplicons. The bars represent the mean ± SE. of three biological repeats with two technical repeats each. Asterisks (∗) indicates relative expression levels that are significantly different (Student’s t-test; P < / > 0.05) between both cultivars. Statistical significance of relative expression values among organs of individual cultivars were calculated using Tukey HSD LSMean test at α = 0.05, and presented in Supplementary File S2. In, internodes; Ra, rachis; Le, leaves; Te, tendrils; Pi, pistils; Be, berries; 0 d, berries sampled at 2–3 mm diameter (E-L 27); 10 d, berries sampled 10 days after E-L 27; 30 d, berries sampled 30 days after E-L 27; Y, young; M, mature. Similar results were obtained from samples collected during the 2011 growing season.
Since SLY1 is a central regulator of DELLA proteins degradation (McGinnis et al., 2003; Sasaki et al., 2003; Dill et al., 2004; Sun, 2010), the results raise the possibility that higher accumulation of all three VvDELLAs, detected in BF, may be the consequence of lower levels of their common regulator, VvSLY1b, and hence lower efficiency of DELLA degradation in the untreated organs. Interestingly, Y2H assays show stronger interactions between VvSLY1b and VvDELLA genes cloned from BF and SB, compared to VvSLY1a (Acheampong et al., 2015) (Figure 2B).
BF, the Cultivar with Higher Response to GA3 Had Higher Level of VvGID1 Transcript
As DELLA proteins were increased in gid1 mutants of rice and Arabidopsis (Ueguchi-Tanaka et al., 2005; Griffiths et al., 2006; Willige et al., 2007), we explored the possibility that the varietal differences in VvDELLA accumulation may result from differences in expression of VvGID1 in the cultivars. We found higher levels of VvGID1 expression in organs of BF, compared to SB (Figures 6C,D). The only exceptions were in young tendrils, where VvGID1a (Figure 6C) and VvGID1b (Figure 6D) were 2- and 3-fold higher in SB, respectively. For most organs, there was higher expression of VvGID1b, and varietal difference in expression was higher for VvGID1b than VvGID1a. VvGID1a and VvGID1b mRNA quantities in young internodes of BF were 2- and 20-fold higher than in SB. Similarly, VvGID1a and VvGID1b expression in rachis of BF was 2- and 10-fold, respectively, greater than in SB. Transcript levels of VvGID1a in young berries (10–30 DAF) of BF were at least 2-fold higher than in SB berries at similar stage, and VvGID1b was 6-fold higher in BF at all developmental stages of berries. In light of the above, a possibility was raised that a greater number of GA receptors in BF may contribute to increased GA response in this cultivar, due to increased number of GA-VvGID1-VvDELLA complexes upon GA application, resulting in higher efficiency of VvDELLA degradation.
SB, the Cultivar with Lower Response to Exogenous GA3, Had Higher Levels of GA4 in Developing Berries
The quantities of endogenous bioactive GA1 and GA4 are presented in Figure 7. The levels of other GA species are presented in Supplementary Table S3 (for internodes, rachis leaves, and tendrils) and Supplementary Table S4 (for pistils and berries). In general, the analysis suggested that: (1) the levels of the different bioactive GA species either decreased or remained constant as organs of both BF and SB developed; (2) except in leaves and berries, GA1 levels were higher in young organs of BF than corresponding organs of SB; (3) GA4 levels were considerably higher in most organs of SB.
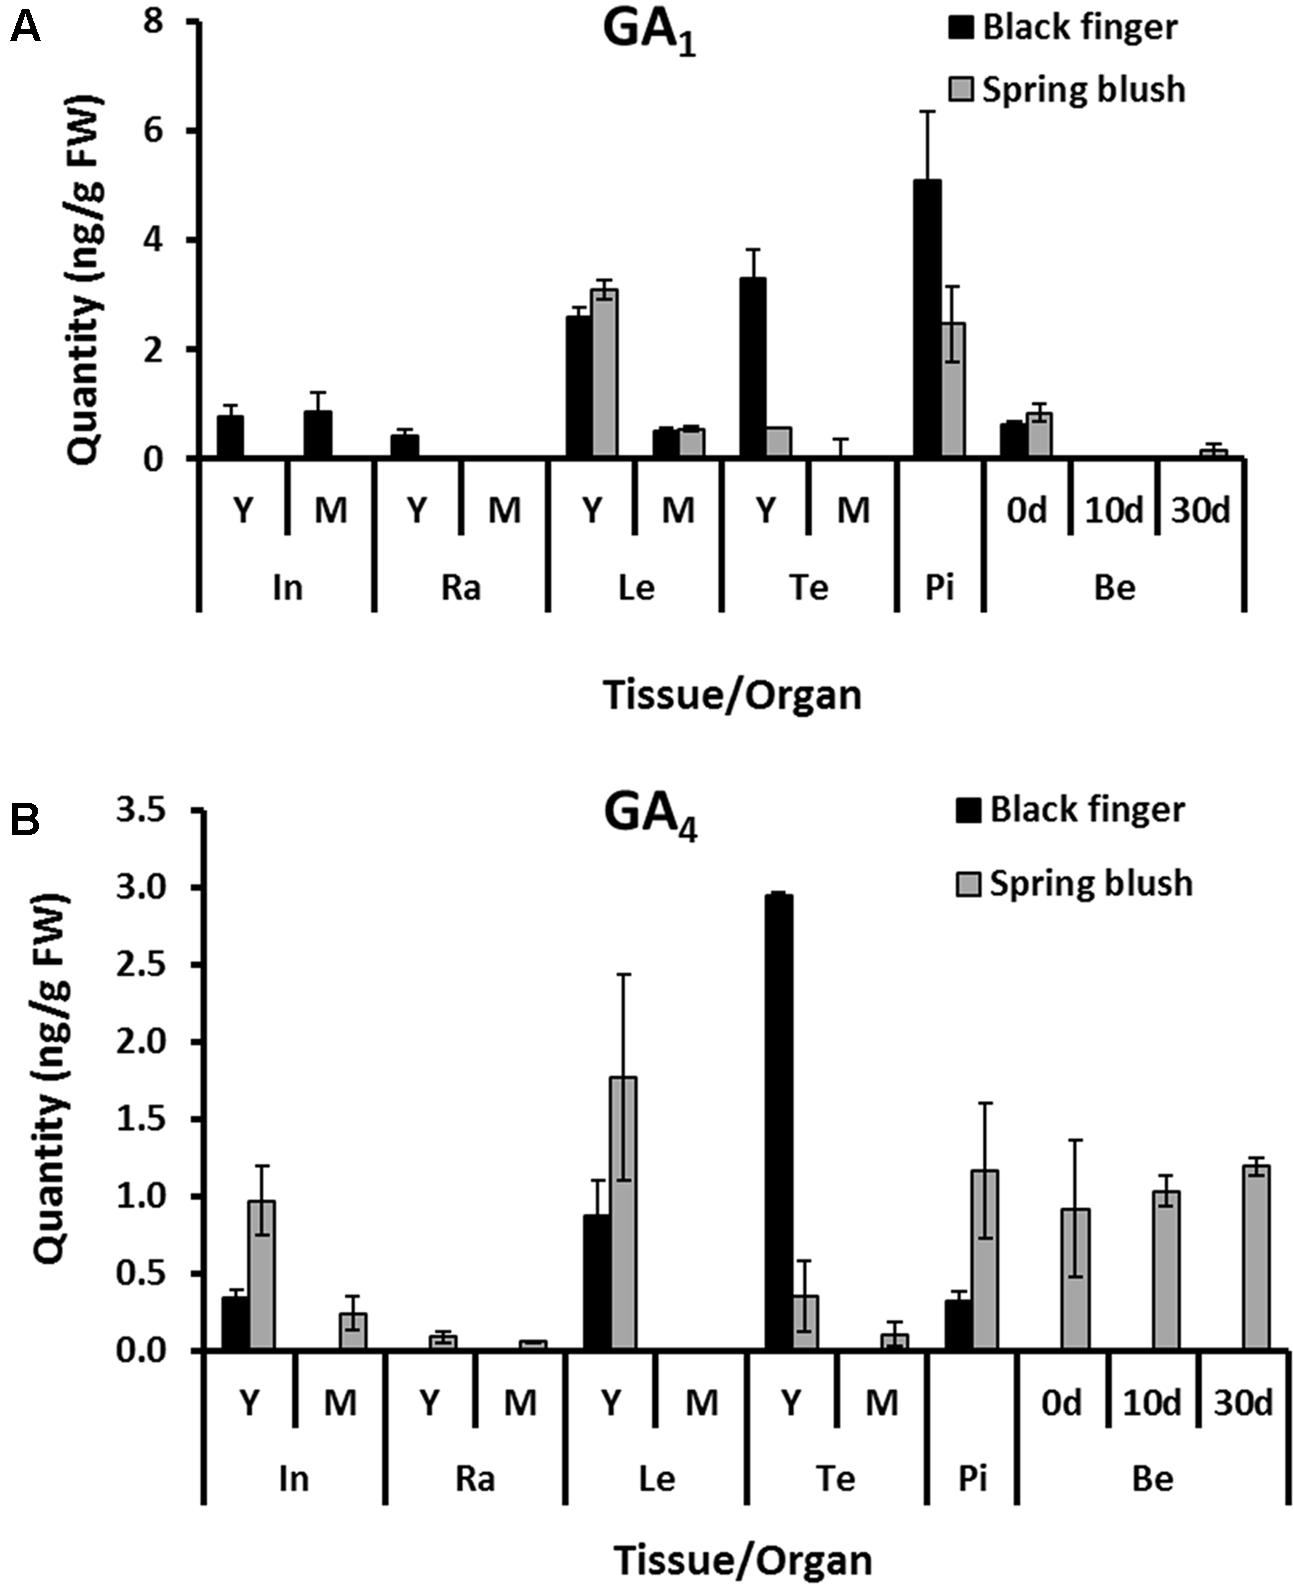
FIGURE 7. Spatio-temporal accumulation of endogenous bioactive GAs in V. vinifera cv. Black finger (BF) and cv. Spring blush (SB). Quantification of endogenous GA1 (A) and GA4 (B) in organs of BF (black-filled bars) and SB (gray-filled bars) at different developmental stages. Bioactive GAs were extracted from 0.5 g fresh weigh of homogenized tissue, and quantified using triple quadrupole mass spectrometer coupled to an Ultra High Performance Liquid Chromatography (UHPLC) system equipped with an octylphenyl column. The bars represent the mean ± SD. of three biological replicates of extractions. In, internodes; Ra, rachis; Le, leaves; Te, tendrils; Pi, pistils; Be, berries; 0 d, berries sampled at 2–3 mm diameter (E-L 27); 10 d, Berries sampled 10 days after E-L 27; 30 d, berries sampled 30 days after E-L 27; Y, young; M, mature. Samples were collected during the 2010 growing season.
Internodes
While GA4 was detected in internodes of both cultivars, GA1 was present only in BF internodes. GA4 was threefold lower in young internodes of BF and undetected in its mature internodes. In young internodes, higher level of GA8 (the deactivation product of GA1) was detected in SB, but no significant difference was recorded for GA34 (the deactivation product of GA4), despite the higher GA4 level in SB. GA8 was not detected in mature internodes of both cultivars, while GA34 was detected in only mature internodes of SB.
Rachis
Accumulation of GA1 in young rachises of BF was evident, accompanied by significant quantities of GA8. In SB, however, both GA1 and GA8 were not detected in young rachis. In mature rachis, both GA1 and GA8 were not detected in both cultivars. While both developmental stages of rachis of SB presented GA4, it was not detected in young or mature rachis of BF.
Pistils and Berries
In pistils of both cultivars, GA1 was the more abundant bioactive GA and was twofold higher in BF. GA4, on the other hand, was fourfold higher in SB. There was, however, no significant difference between the quantities of both GA8 and GA34 in pistils of both cultivars. During the pistil-berry transition (fruit set), there was a significant decrease in quantities of GA1, which was accompanied by more than twofold increase in GA8 accumulation, in both cultivars. As berries of both cultivars developed, GA1 quantities dropped to levels below detection, and this was accompanied by a corresponding decrease in GA8. Notably, unlike berries of BF, which had no detectable quantity of GA4, a steady level of GA4 was recorded in the pistils and throughout berry development of SB. A convex profile of GA34 was recorded, which peaked at 10 DAF and dropped toward 30 DAF.
Leaves and Tendrils
The bioactive GA profiling in other vegetative organs presented notable findings. In young leaves, GA1 and GA8 levels were comparable in both cultivars but GA4 and GA34 levels were twofold higher in SB. In young tendrils, however, both GA1 and GA4 levels were sevenfold higher in BF. In mature tendrils, GA1 and GA4 were not detected in both cultivars. Deactivation products were higher in BF tendrils.
While GA signaling components are likely to play the central role in mediating the response to GA application, quantities of endogenous bioactive GAs may also modulate the response to GA. It is expected that cultivar with lower level of endogenous bioactive GAs will display stronger response to GA application. However, the varietal differences in total endogenous bioactive GAs were not congruent with the proposed hypothesis and were unable to fully explain the observed varietal differences in the responses of organs to GA.
SB, the Cultivar with Lower Response to Exogenous GA3, Presented Higher Expression of GA Metabolism Genes in Developing Berries
The significant differences in endogenous GAs in the berries of BF and SB point to potential differences in GA biosynthesis or degradation between the cultivars. To elucidate the molecular sources of the varietal differences in bioactive GA quantities described above, the spatio-temporal transcript levels of the rate-limiting 2-oxoglutarate-dependent dioxygenases (2-ODDs) gene families of grapevine (VvGA20ox, VvGA3ox, VvGA2ox) (Giacomelli et al., 2013; Jung et al., 2014) were quantified by qRT-PCR (Figures 8A–C and Supplementary Figure S5). For consistency, the nomenclature of genes used in this study is same as reported in our previous study (Giacomelli et al., 2013).
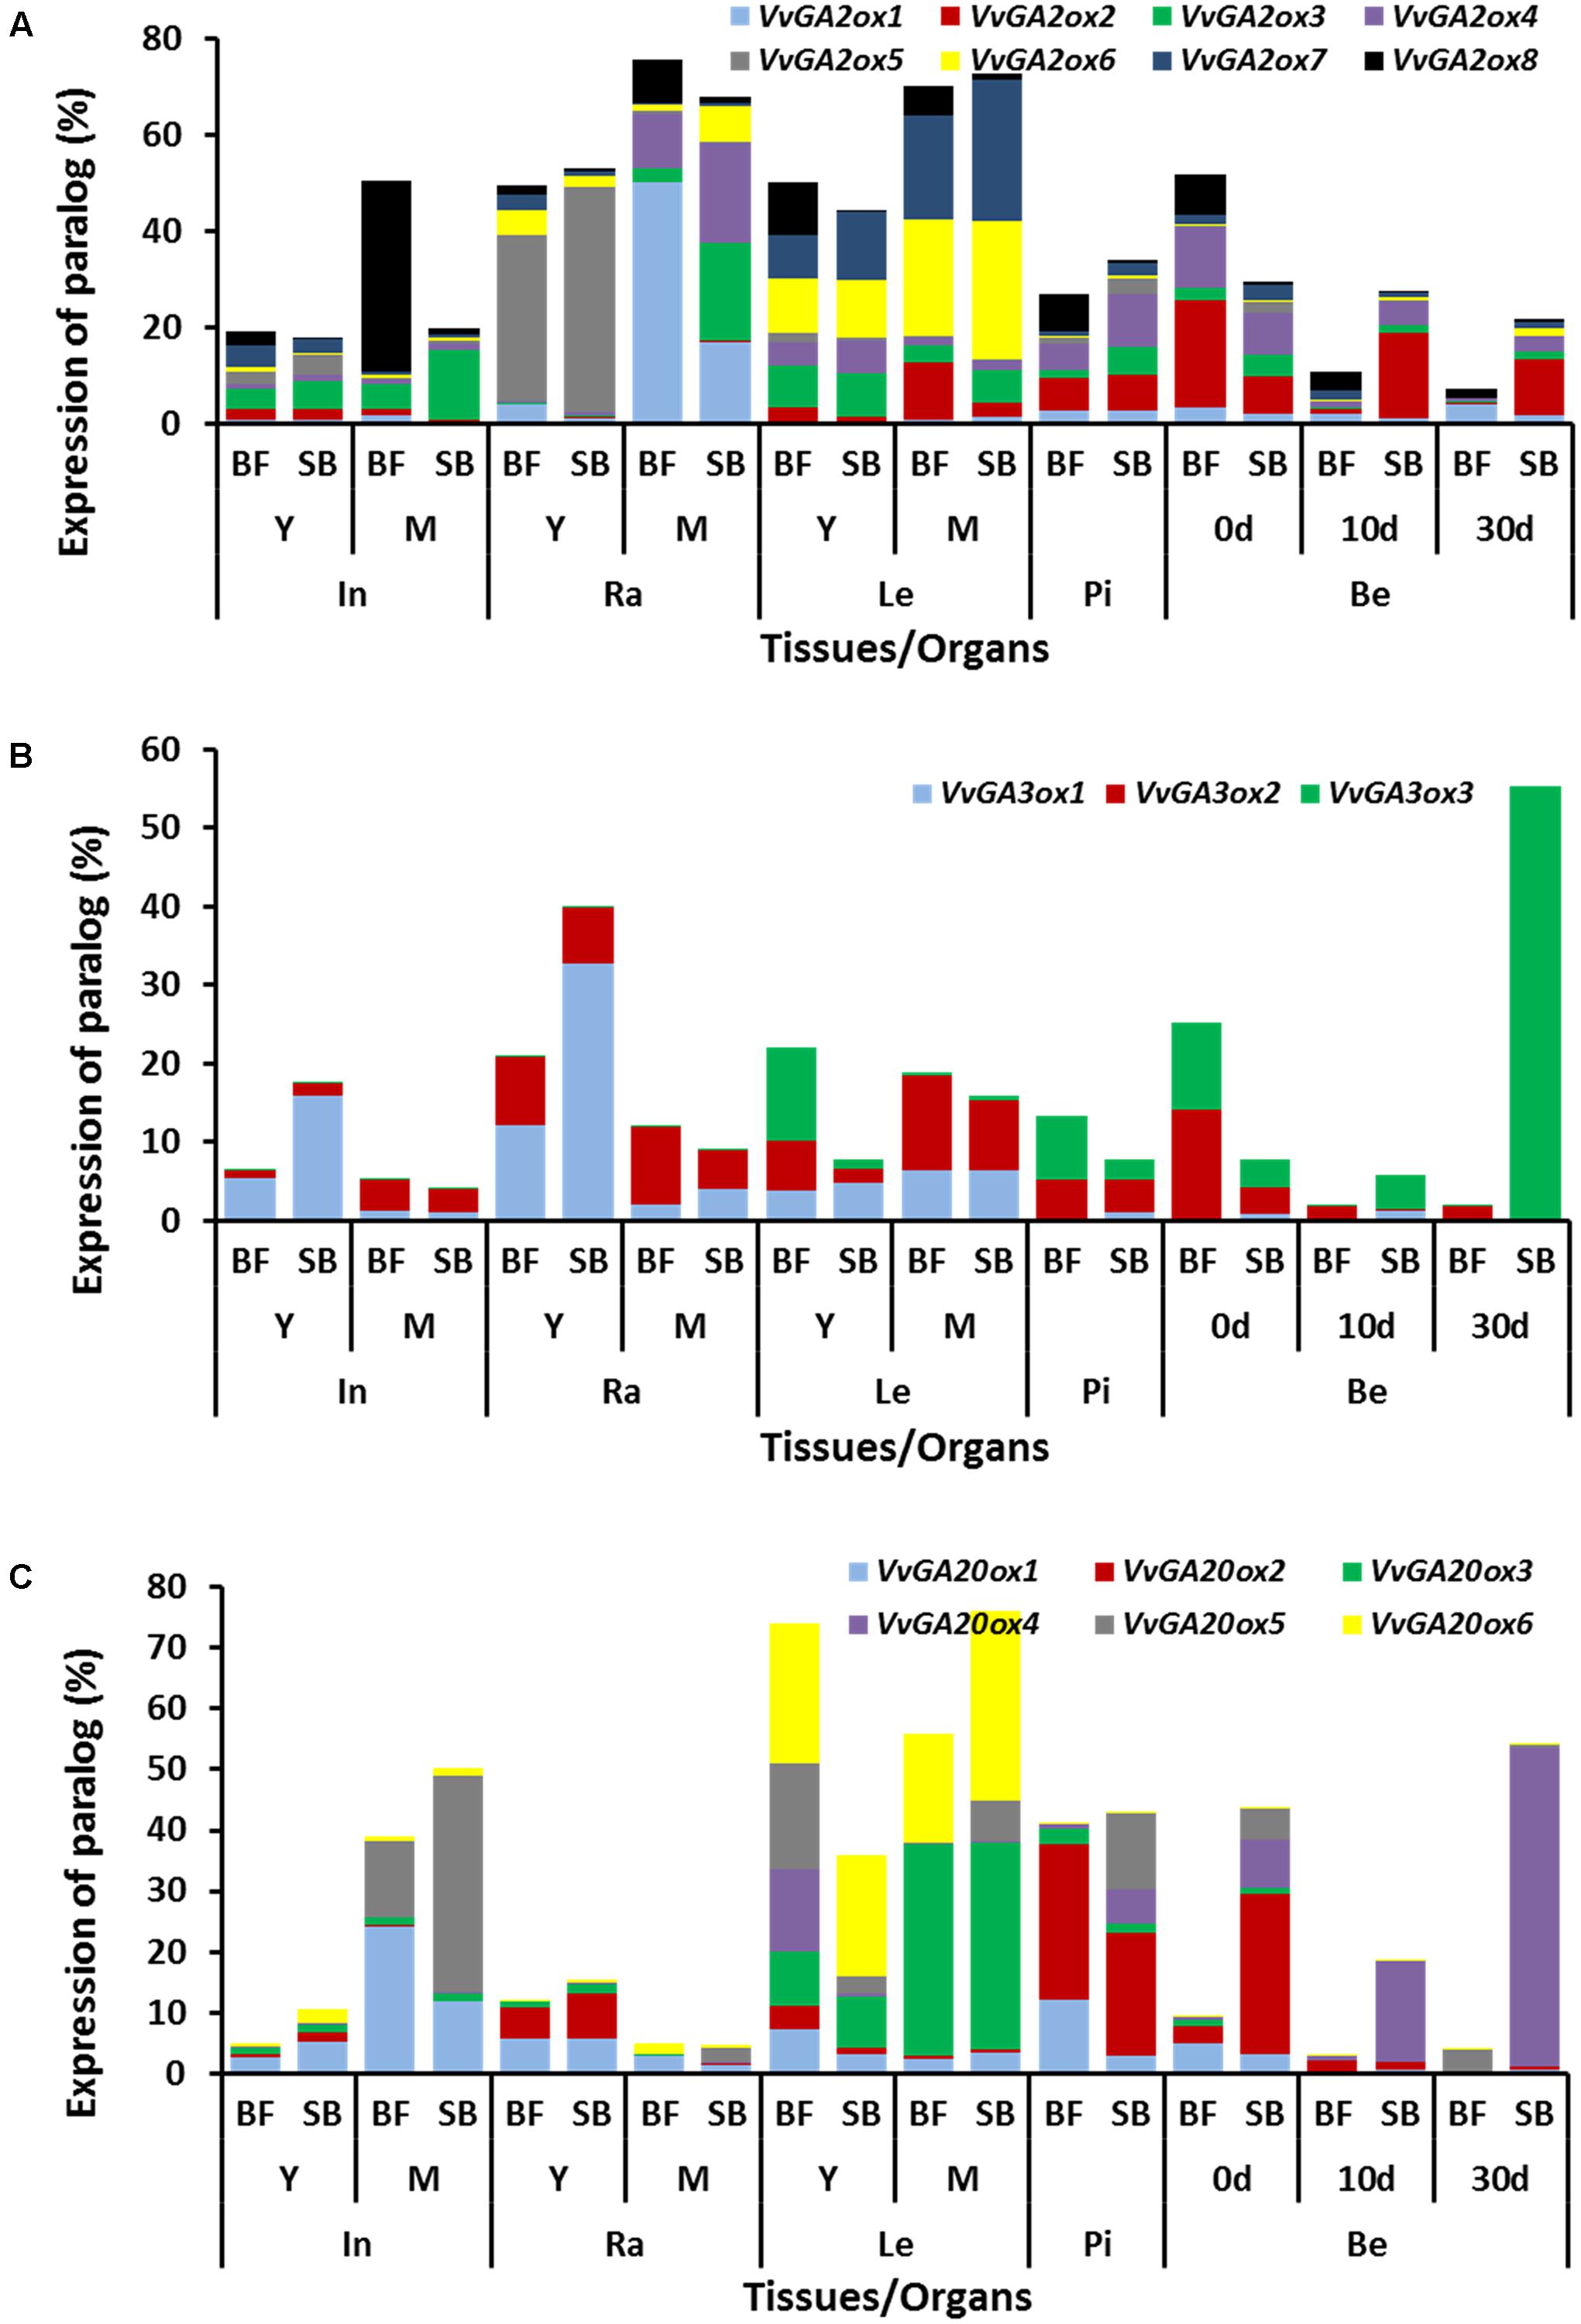
FIGURE 8. Spatio-temporal expression profiles of GA metabolism genes in V. vinifera cv. Black finger (BF) and cv. Spring blush (SB). Spatial and temporal expression profiles of VvGA2ox (A), VvGA3ox (B), and VvGA20ox (C) paralogs in organs of BF and SB collected during the 2010 growing season. Y-axis is the normalized relative expression (NRE) (Giacomelli et al., 2013) of the respective paralog, expressed as a per cent of the total NRE of that paralog in all organs analyzed. NREs were calculated, as described by Giacomelli et al. (2013), from the average of three biological replicates of relative transcripts normalized against the expression of VvGAPDH, which is unaffected by GA. Transcripts were measured by qRT-PCR using EvaGreen DNA-binding dye on the 96.96 Dynamic Array Integrated Fluidic Circuits (IFCs). In, internodes; Ra, rachis; Le, leaves; Te, tendrils; Pi, pistils; Be, berries; 0 d, berries sampled at 2–3 mm diameter (E-L 27); 10 d, berries sampled 10 days after E-L 27; 30 d, berries sampled 30 days after E-L 27; Y, young; M, mature. Full description of experimental procedure is given in Section “Materials and Methods.” Graphs of the spatial and temporal expression profiles of the individual metabolism genes are presented in Supplementary Figure S5, and detailed statistical significance provided in Supplementary File S2.
Pistils and Berries
In pistils, VvGA20ox1 expression was 4-fold higher in BF compared to SB, while VvGA2ox3 and VvGA2ox4 were 3-fold higher in SB. Substantial quantities of VvGA20ox5 mRNA were also detected in pistils of SB, but not detected in BF. There were considerable varietal differences in the expressions of VvGA20ox2, VvGA20ox4, VvGA3ox3, VvGA2ox2, VvGA2ox4, and VvGA2ox8 in berries. Compared to BF, SB berries showed higher transcripts of VvGA20ox2 (8-fold, 0 DAF), VvGA20ox4 (10- to 60-fold, 0–30 DAF), and VvGA3ox3 (which was not detected in BF at 10–30 DAF and presented the highest expressed in SB berries, compared to all other tissues). While only one biosynthetic gene was significantly higher in BF berries (VvGA3ox2: 4-fold in 0–30 DAF), two deactivation genes had higher transcript levels in this cultivar, compared to SB (VvGA2ox1: 2-fold in 0–30 DAF; and VvGA2ox8: 6-, 3-, 2-fold in 0, 10, and 30 DAF, respectively). Two additional deactivation genes, VvGA2ox2 and VvGA2ox4, were higher in BF at 0 DAF (3- and 1.3-fold, respectively), and then higher in SB at 10 and 30 DAF (30-fold and 3-fold in SB at 10–30 DAF, compared with BF).
Internodes
In young internodes of SB, expression of VvGA20ox1 and VvGA3ox1 were 2- to 3-fold higher than in young internodes of BF. In mature internodes of SB, transcript levels of VvGA20ox5 and VvGA2ox3 were 3- and 2-fold higher, while that of VvGA20ox1 and VvGA2ox8 were 2- and 20-fold lower than in mature internodes of BF.
Rachis
In young rachis of SB, VvGA2ox6 and VvGA3ox1 mRNA levels were 2- and 3-fold higher than in young rachis of BF. In mature rachis of SB VvGA2ox3, VvGA2ox4, and VvGA2ox6 expressions were 10-, 2-, and 3-fold higher than in mature rachis of BF, while transcript of VvGA3ox2, VvGA2ox1, and VvGA2ox8 were 2-, 3-, and 5-fold higher in mature BF rachis.
Leaves
Expressions of VvGA20ox1, VvGA2ox2 were twofold higher in young leaves of BF, while VvGA20ox5 and VvGA3ox2 were, respectively, fivefold and threefold higher in BF.
Some of the GA metabolism genes also displayed potential organ specificity (Figure 8 and Supplementary Figure S5). VvGA20ox1 and VvGA2ox8 were highest expressed in internodes, VvGA2ox1 and VvGA2ox5 mainly expressed in rachis, VvGA20ox3, VvGA20ox6, VvGA2ox6, and VvGA2ox7 were mainly expressed in leaves, and VvGA20ox2, VvGA20ox4, VvGA3ox3, VvGA2ox2 were mainly expressed in pistils and berries.
Seed Traces Are Present in SB, the Cultivar with Lower Response to GA3
Since seed traces of stenospermocarpic cultivar are considered the primary source of GA in the grape berry after endosperm abortion (Conde et al., 2007), it was envisioned that berry variations in bioactive GA content may be influenced by differences in size or presence of seed traces. Analyses of 100 30-day-old berries, sampled randomly from 20 clusters, revealed the presence of seed traces in all berries of SB, while berries of BF had no visible seed traces. Representative berries with these phenotypes are shown in Figure 9.
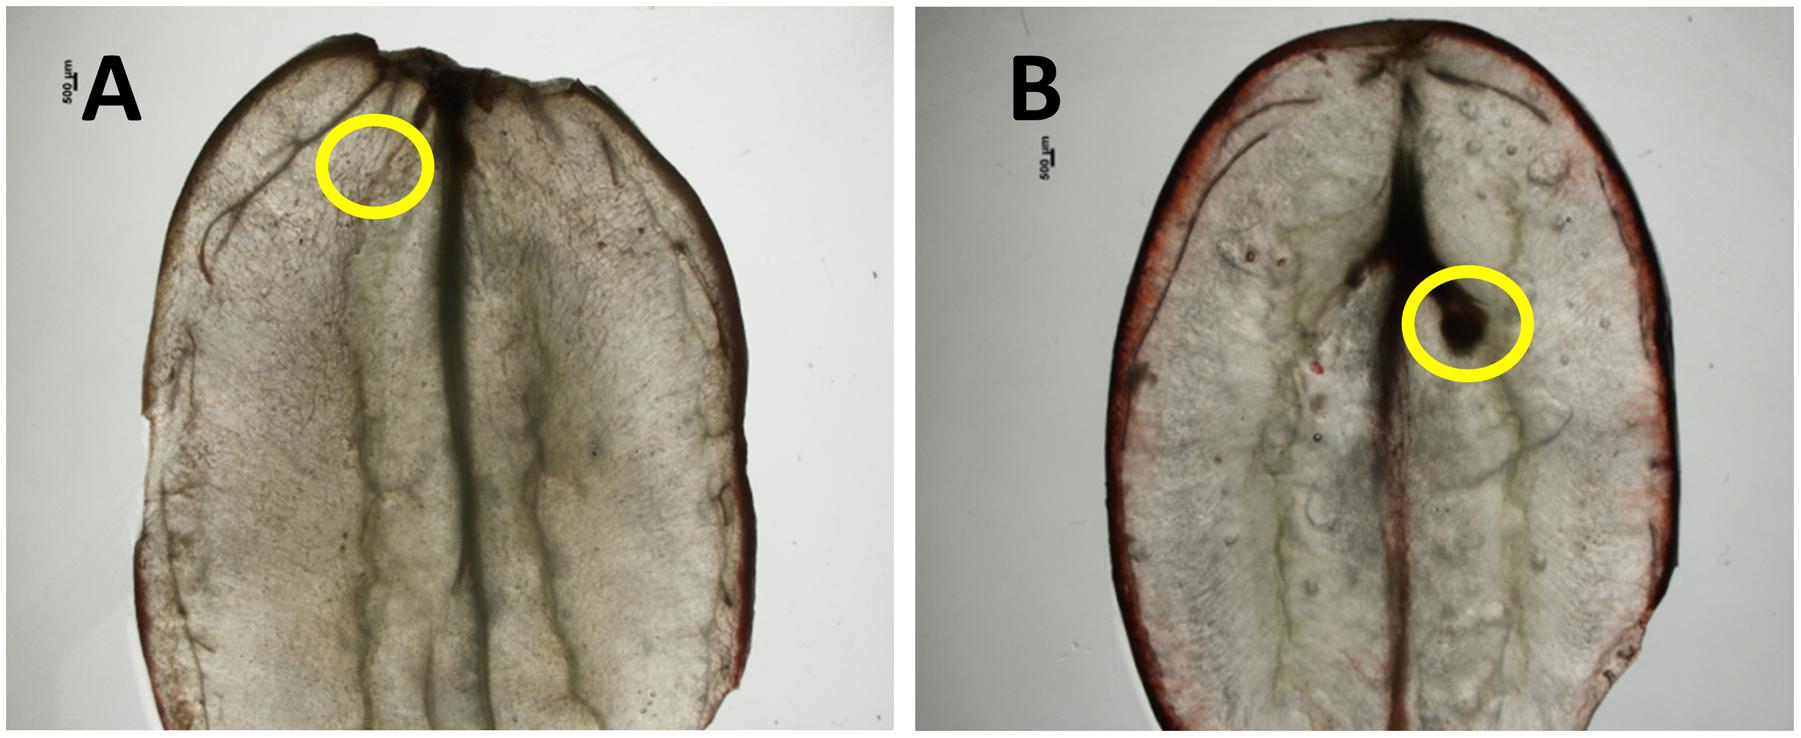
FIGURE 9. Seed traces in berries of V. vinifera cv. Black finger (BF) and cv. Spring blush (SB). Anatomy of representative berries of BF (A) and SB (B), harvested at 30 days after fruit set, and showing presence or absence of seed trace. Yellow circles indicate position of seed trace. Bar = 500 μm.
Comparative Response of Organs of BF and SB to Application of GA1 and GA4
Based on the fact that different bioactive GA species appear to vary widely in their effects on different plant species, as well as mutants of the same species (Brian et al., 1962; Lange et al., 2005, 2012; Griffiths et al., 2006; Chandler et al., 2008), GA1 was identified as the more effective bioactive GA in enlarging berries of certain seedless cultivars (Weaver, 1961; Paleg et al., 1964), and quantities of GA4 was higher in most organs of SB than in BF (Figure 4), it was speculated that in a specific organ/tissue, the different grapevine cultivars may contain different bioactive GA species, which may also lead to varietal differences in GA response. To this end, young internodes, rachises and berries of both cultivars were treated with GA1 and GA4. The results show that in both cultivars, application of GA1 and GA4 produced similar effect in all three organs (Supplementary Figure S6). This is irrespective of the fact that the endogenous levels of these GA species are markedly different in the different organs of both cultivars. Compared to controls, GA1 and GA4 did not significantly increase internode lengths of BF and SB (Supplementary Figures S6A,B). Both GA1 and GA4 produced a 3-fold increase in rachis length of BF, and slightly increased the length of SB rachis (Supplementary Figures S6C,D). While the weight of SB berries was unaffected by GA1 and GA4 application, BF berries were increased by 1.5-fold (Supplementary Figures S6E,F).
Discussion
In addition to organ/tissue-specific response to GA within a grapevine cultivar (Agüero et al., 2000; Acheampong et al., 2015), varietal-specific differences in organ response have also been reported (Weaver, 1958, Weaver et al., 1962; Agüero et al., 2000; Cheng et al., 2013). Varietal differences in GA response may be a complex phenomenon. Naturally, the primary potential targets for regulation of response are GA metabolism and signaling. However, factors such as penetrability, cell wall composition, cell surface GA receptors, cell number, and cell enlargement capability cannot be discounted. The molecular mechanism regulating these response differences have neither been verified nor explored. As a first step toward understanding this phenomenon, the current comparative study focuses on the potential involvement of GA signaling and metabolism on such differential responses.
Response of BF to GA3 Is Generally Greater than SB
The differential response of berries of BF and SB to GA was based on well-established information from extension service officers and growers, from different growing regions and many growing seasons. To avoid potential local effects, we selected the closest BF and SB vineyards, which shared very similar geographic, topographic and environmental parameters. In addition, we used GA concentrations verified to produce differential response, repeated the experiments over two growing seasons, and calculated responses relative to the triton-treated organs growing in the same vineyard.
The fact that the response of BF to GA3 is higher than that of SB in all organs analyzed (Figure 1) suggests that varietal-related responses to GA may be regulated by similar mechanisms in both vegetative and reproductive organs. Response to PAC was, however, organ- and cultivar-dependent; with comparable responses recorded for rachis, while response of internodes and berries were higher for BF and SB, respectively. Similar to TS and seeded varieties (Agüero et al., 2000; Acheampong et al., 2015), different organs exhibited different degrees of response to GA and PAC in each cultivar.
The combined PAC-GA treatment was included in the current analysis as a qualitative support to the assumption that the effect observed in the PAC treatment mainly resulted from its effect on GA biosynthesis, since other effects of PAC are well documented (Buta and Spaulding, 1991; Ahmad et al., 2015). However, it is worth noting that the combined PAC-GA treatment present the following complications: (1) two separate treatments are involved in that combined treatment, with a time-lapse between the treatments; (2) the assumption that the PAC pre-treatment completely inhibited GA biosynthesis, and that there was complete exhaustion of endogenous bioactive GAs prior to GA application was not experimentally determined in these grapevine cultivars. Without prior knowledge regarding the rate and efficiency of the inhibition and degradation of endogenous GAs, the response of organs after PAC-GA treatments may reflect a combination of unknown quantities of endogenous GA and known concentration of the applied GA. Therefore, we did not use data from this treatment regime to analyze quantitative variations in response of both cultivars; thus, avoiding over-simplified quantitative consideration which may be biologically misleading.
It is important to note that while berries of SB appear to be non-responsive to GA, compared to BF, SB cannot be considered a GA insensitive variety, since the rachis and internodes respond to GA (Figure 1).
Varietal Differences in GA3 Response Could Not Be Attributed to Specific Bioactive GA Species
Similar to Arabidopsis (Griffiths et al., 2006) and pumpkins (Lange et al., 2005, 2012), we found high levels of GA4 in most organs of both varieties; suggesting that it is the major bioactive GA regulating growth in grapevines. Even though specific GA species have been reported to elicit growth of specific organs in grapevine and other plant species (Paleg et al., 1964; Kato et al., 1998; Ross et al., 2000; Spielmeyer et al., 2002; Wolbang et al., 2004; Griffiths et al., 2006; Hu et al., 2008), our results of on-field experiment show that both GA1 and GA4 affect organ growth similarly (Supplementary Figure S6), suggesting that the differential response does not involve differences in perception of a specific bioactive GA.
Varietal Differences in GA3 Response Was Not the Result of Allelic Variation of Signaling Components
When signaling components are considered as the potential source for differential response, both their availability (quantitative differences) and proper biological function (qualitative changes) have the potential to regulate the response. Quantitative and qualitative determinants to GA response have been reported in GA response mutants of model plants (Dill et al., 2001; King et al., 2001; Sasaki et al., 2003; Griffiths et al., 2006; Hirano et al., 2010; Yamamoto et al., 2010). In the current comparative study, Y2H assays showed that different cultivar-specific alleles of VvDELLA proteins (Supplementary Figure S2) did not differ in their interaction with VvGID1s or VvSLY1s (Figure 2). Moreover, immunoblot analyses verified GA-dependent VvDELLA1 and VvDELLA2 protein degradation in various organs (Figure 5), suggesting that allelic differences between varieties neither affects the nature of biological activity nor results in detectible perturbation of the degradation machinery of VvDELLA proteins in response to GA in planta.
Varietal Differences in Response to GA3 May Be a Consequence of Differences in Quantity of GA Signaling Components
Marked differences in quantities of VvDELLA were recorded in young organs of BF, compared to SB (Figure 4). Differences in quantities of DELLA were suggested as the cause for differences in response to GA between Arabidopsis ecotypes. Col-0 displayed a more severe fertility phenotype than Ler. Additionally, Col-0 rga gai mutant was entirely male sterile while the equivalent Ler mutant was fertile. It was suggested that differences in quantities of RGL1, RGL2, and RGL3 was responsible for the differential response (Plackett et al., 2014). It was also shown that rescue of microspore development in GA-deficient ga1-3, required knockout of three DELLAs (RGA, RGL1, RGL2) in Ler (Cheng et al., 2004), while knockout of RGA alone was sufficient in Col-0 (Tyler et al., 2004). This may suggest higher level of RGL1 and RGL2 in Ler. Marked reduction of DELLA proteins level resulted in enhanced growth also in a GA deficient ga1-3 background, supporting its central role in growth response (Dill and Sun, 2001). Here, it is suggested that the differences in quantities of VvDELLA in BF and SB may be the main factor regulating the varietal differences in organs response to GA application. It is assumed that the higher VvDELLA levels in young organs of BF results in greater repression of GA-mediated growth, and its degradation, through GA application, results in greater growth response in organs of this cultivar, compared to SB, as further detailed in the Section “Integrative Working Hypothesis of Potential Factors Influencing BF Behavior.”
The significant accumulation of all three VvDELLA in young BF organs could be due to: (1) higher transcription or translation or post-translational modification of all three proteins; (2) lower endogenous bioactive GAs; (3) decreased efficiency of the GA-induced proteolytic degradation mechanism of VvDELLA proteins. Expression data (Figure 3) does not support the first assumption as VvDELLA transcripts in most organs appear higher in SB. It is unlikely that factors that affect translation in cis will be similarly mutated in all three genes. However, the probability of a mutation in a regulator that affect translation or post-translational modification in trans cannot be discounted. Higher or comparable levels of bioactive GAs in most BF organs, apart from leaves and berries, rules out the second scenario as a probable primary cause. The fact that application of GA induced VvDELLA1 and VvDELLA2 degradation suggests that the VvDELLA degradation machinery is functional in BF. Thus, we assume that the most likely cause of the high accumulation of all three VvDELLAs in young BF organs may be lower efficiency of the VvDELLAs degradation, a mechanism that is expected to be shared by all three VvDELLAs. Such limited efficiency may be the result of lower quantities of a modulator required specifically for VvDELLA degradation.
Interestingly, in mature organs from both cultivars there was no consistent difference in VvDELLA protein levels. As previously suggested for TS (Acheampong et al., 2015), it is possible that as organs mature and growth rate declines, VvDELLAs do not play significant roles in regulation of organ growth, and their quantities in this developmental stage may not reflect the varietal differences in response of young organs.
The Potential Role of VvSLY1 as a Trigger for the Varietal Differences in VvDELLA Levels
The natural suspect is VvSLY1, whose role in GA-mediated DELLA degradation and organ response has been demonstrated in model plants (McGinnis et al., 2003; Sasaki et al., 2003). Compared to wild type, sly1-10 (Arabidopsis) or gid2 (rice) loss-of-function mutants were shown to accumulate more DELLA proteins (McGinnis et al., 2003; Sasaki et al., 2003; Dill et al., 2004). In agreement, a significantly lower level of VvSLY1b transcript was recorded in BF, compared to SB and TS. The grapevine genome uniquely encodes two functional VvSLY1 homologs while the genomes of other angiosperms have been reported to carry single SLY1 gene. However, we assume that VvSLY1b rather than VvSLY1a has a role in regulating the varietal differences in VvDELLA accumulation and hence GA response in the analyzed organs. This assumption is based on that fact that: (1) while VvSLY1b transcript was significantly higher in SB organs, VvSLY1a was only marginally higher in young rachis and berries of SB, and presented no significant difference in young internodes (Figures 6A,B); (2) current Y2H data (Figure 2A) and results from our previous publication (Acheampong et al., 2015) indicate that interaction between VvSLY1a and VvDELLA proteins is at least sevenfold less than interactions between VvSLY1b and VvDELLA proteins. As VvSLY1b has a stronger affinity for all three VvDELLA proteins than VvSLY1a, varietal differences in its expression may significantly affect the degradation efficiency of all VvDELLA. It should, however, be stated that, in the absence of solid experimental data, the contribution of VvSLY1a to varietal differences in GA response cannot be completely discounted.
In light of the above, the suggested hypothetical scenario is that relatively low availability of VvSLY1b in young organs of BF results in fewer VvDELLA–VvSLY1b complexes, thus decreasing efficiency of polyubiquitination and degradation by the 26S proteasome, and increasing VvDELLA accumulation in these organs. In support of this hypothesis, Arabidopsis sly1-d mutants, with enhanced DELLA–SLY1 interaction than wild type, accumulated less DELLA proteins and enhanced GA signaling in rga-Δ17 mutant lines (Dill et al., 2004). The observed varietal difference in VvSLY1b transcript could be due to mutation(s) in an element which regulate transcription from the VvSLY1b promoter, in cis or in trans. The nature of the difference is yet unclear and will require further analyses.
The Consequences of Higher Expression of VvGID1
In addition to lower VvSLY1b transcript and higher VvDELLAs, BF presented higher transcript levels of the GA receptors, VvGID1s, suggesting availability of more receptor molecules and thus greater response of organs to GA. In support, rice lines over-expressing GID1 showed higher response to GA3 application than wild type controls (Ueguchi-Tanaka et al., 2005). Additionally, variations in phenotype of Arabidopsis mutants were attributed to the differential expression of Arabidopsis GID1 homologs (Suzuki et al., 2009).
The observed varietal differences in the VvGID1 transcripts in BF and SB could have resulted from differences in levels of bioactive GA, differences in VvDELLA accumulation, or both. Support for endogenous bioactive GA regulation of GID1 expression by negative feedback was formerly presented (Ueguchi-Tanaka et al., 2005; Griffiths et al., 2006; Li et al., 2011; Voegele et al., 2011; Acheampong et al., 2015). While we observed inverse correlation between GA4 levels and VvGID1b transcripts in organs of SB and BF, levels of GA1 did not show the same trend. In addition, no differential growth response was observed in different organs upon application of GA1 and GA4 to BF and SB (Supplementary Figure S6). Hence, our data is only consistent with DELLA-mediated regulation of VvGID1 expression. Solid support for the latter can be drawn from findings in Arabidopsis (Cao et al., 2006; Griffiths et al., 2006) and rice (Ueguchi-Tanaka et al., 2008) in which GID1 transcripts were upregulated by DELLA. Since GA signaling is highly conserved in higher plants (Harberd et al., 2009; Sun, 2010), it is likely that a similar scenario may be occurring in grapevine.
Absence of Seed Traces in BF May Result from GA1-Induced Fruit Set and Limit GA Level in the Berry
The variations in size of seed traces in stenospermocarpic varieties is primarily determined by the genotype and also affected by environmental factors (Cabezas et al., 2006; Doligez et al., 2013). The absence of visible seed traces in BF suggests that it is in the smallest end of that size spectrum. Alternatively, it may suggest that fruit set in BF is induced without fertilization, despite its stenospermocarpic genetic background. This could be due to the uniquely high level of GA1 in the pistils (Figure 7). Indeed, in stenospermocarpic varieties, GA induces fruit set in a fertilization-independent manner when flowers are emasculated at least 2 weeks before anthesis and treated with GA3 (Or et al., unpublished). Support for GA1 induced parthenocarpy can be drawn from studies showing that GA1 level was higher in tomato pat-3/pat-4 parthenocarpic mutants, compared to wild types (Fos et al., 2001). Moreover, application of GA1 led to induction of parthenocarpic berries in seeded grapevine cultivars (Kato et al., 1998), and resulted in parthenocarpic growth of unpollinated Madrigal tomato carpels (Fos et al., 2000). The reason for the high GA1 in BF is yet unclear. However, in view of the uniquely high VvDELLA accumulation in this cultivar, causal link should be considered. Modifications in bioactive GA quantities resulting from high DELLA accumulation have been reported in mutants of grapevines and other species (Boss and Thomas, 2002; Chandler et al., 2002; Itoh et al., 2005; Busov et al., 2006; Griffiths et al., 2006; Boccaccini et al., 2014).
Interestingly, varietal differences in response to PAC and total endogenous bioactive GAs measured were not congruent with varietal differences in the responses of different organs of BF and SB to GA. In berries, however, both growth response to PAC and endogenous bioactive GA measurements correlated with the response to GA. As suggested above, the lower level of GA in BF, which may further contribute to its high response to GA application, can be associated to the absence of seed traces, which are the main sources of bioactive GAs in stenospermocarpic cultivars (Conde et al., 2007). In agreement with this hypothesis, (1) the absence of seed traces in BF correlated with low levels of bioactive GA (both GA1 and GA4) in the berries; (2) the presence of seed traces in the berries of SB was accompanied by higher bioactive GA4 quantities, possibly resulting from the upregulation of GA biosynthetic genes, VvGA20ox4 and VvGA3ox3 (Figure 9). It is important to note that even though berries of SB do not respond to GA, this cannot be considered a GA insensitive variety since the rachis and internodes clearly respond to GA (Figure 1). Alternatively, it can be considered as normal/less responsive variety, compared to BF. Yet, sufficient endogenous GA produced by its seed rudiments during berry development may be the cause for the lack of response of its berries to GA.
Integrative Working Hypothesis of Potential Factors Influencing BF Behavior
While both BF and SB have a functional DELLA degradation machinery in the presence of GA, there are significant differences in quantities of central components of the GA signaling cascade in these cultivars. Our results show that, compared to SB, BF (1) presents higher response to GA; (2) accumulate very high amounts of all three VvDELLAs; (3) presents high and low transcripts of VvGID1 and VvSLY1b, respectively. Such coordinated and significant differences in quantities of central components of GA-VvGID1-VvDELLA-VvSLY complex, which directly regulates VvDELLA degradation, raise the hypothesis that the difference in the number of the complexes formed may be the primary factor regulating the observed GA-response phenotypes in organs of both cultivars. The following scenario is proposed to account for the differences in response: low quantities of bioactive GA in untreated organs results in limited number of GA-VvGID1-VvDELLA-VvSLY complexes, despite the availability of VvGID1 and VvSLY1b. Therefore, VvDELLA degradation is limited and DELLA proteins accumulate and are active. When GA is applied, and VvGID1 and VvSLY1b are available, VvDELLA degradation is enhanced due to increased formation of GA-VvGID1-VvDELLA-VvSLY. The higher response of BF organs, compared to SB, is the result of modified behavior in both situations. Under limited GA availability, the number of GA-VvGID1-VvDELLA-VvSLY complexes is further limited, due significantly lower level of VvSLY1b. When GA is applied, VvDELLA degradation and inactivation are further enhanced due to (1) higher probability of GA-VvGID1-VvDELLA-VvSLY formation in the presence of higher level of VvGID1; (2) increased formation of GA-VvGID1-VvDELLA, which suppress DELLA action by non-proteolytically blocking of the transcriptional activity of DELLA (Ariizumi et al., 2008; Hauvermale et al., 2014). These modifications in availability of GA-VvGID1-VvDELLA-VvSLY complexes in BF result in enhanced growth inhibition, when GA is limited, and enhanced growth response when GA is supplied.
Alternatively, it can be argued that higher number of cells in untreated organs of BF is responsible for its higher response to GA. Difference in cell enlargement capability may also be considered: where cell expansion is limited in SB or enhanced in BF. However, such assumptions do not account for the smaller size of untreated BF organs and their slower growth rate as compared to SB. In addition, the varietal differences in quantities of central GA signaling components are not unidirectional.
The remarkable differences detected in GA response and levels of central GA signaling components among varieties of this perennial crop, which is not often analyzed thoroughly, expose both the complexity of the system and its strong reliance on the mechanisms discovered in model plants.
Author Contributions
AA, AL, and EO contributed to the conception and design of the work. AA, CZ, TH, LG, YT, YJ, and YK involved in acquisition and analysis of data. AA, LG, YJ, AL, and EO were involved in drafting the manuscript. All authors were involved in final approval of version submitted. All authors are accountable for all aspects of the work relating to accuracy and integrity.
Funding
This work was supported by the Chief Scientist, Ministry of Agriculture, Israel (grant number 204-0943 to EO and AL) and by the United States–Israel Binational Agricultural Research and Development Fund (BARD grant no. IS-4018-07 to EO, AL, and T-pS).
Conflict of Interest Statement
The authors declare that the research was conducted in the absence of any commercial or financial relationships that could be construed as a potential conflict of interest.
Acknowledgment
We are grateful to Prof. Shimon Lavee of Institute of Plant Sciences, Agricultural Research Organization, Volcani Center, for his valuable input and suggestion.
Supplementary Material
The Supplementary Material for this article can be found online at: http://journal.frontiersin.org/article/10.3389/fpls.2017.00850/full#supplementary-material
FILE S2 | Statistical analyses for expression profiles of GA signaling and metabolism genes.
Footnotes
- ^ http://www.clontech.com/US/Support/xxclt_onlineToolsLoad.jsp?citemId=https://www.takara-bio.co.jp/infusion_primer/infusion_primer_form.php§ion=16260&xxheight=1800
- ^ http://www.genoscope.cns.fr/spip/Vitis-vinifera-e.html
Abbreviations
BF, Black finger; DAF, days after fruit set; GA, gibberellins; PAC, paclobutrazol; SB, Spring blush; VvGID1, Vitis vinifera GIBBERELLIN-INSENSITIVE DWARF1; VvSLY1, Vitis vinifera SLEEPY1.
References
Achard, P., and Genschik, P. (2009). Releasing the brakes of plant growth: how GAs shutdown DELLA proteins. J. Exp. Bot. 60, 1085–1092. doi: 10.1093/jxb/ern301
Acheampong, A. K., Hu, J., Rotman, A., Zheng, C., Halaly, T., Takebayashi, Y., et al. (2015). Functional characterization and developmental expression profiling of gibberellin signalling components in Vitis vinifera. J. Exp. Bot. 66, 1463–1476. doi: 10.1093/jxb/eru504
Acheampong, A. K., Rotman, A., Zheng, C., Keren, A., Halaly, T., Crane, O., et al. (2010). “A method for isolating total RNA from mature buds and other woody tissues of Vitis vinifera,” in Methodologies and Results in Grapevine research, eds H. M. S. Delrot, E. Or, L. Babaresco, and S. Grando (Dordrecht: Springer), 301–307.
Agüero, C., Vigliocco, A., Abdala, G., and Tizio, R. (2000). Effect of gibberellic acid and uniconazol on embryo abortion in the stenospermocarpic grape cultivars Emperatriz and Perlon. Plant Growth Regul. 30, 9–16. doi: 10.1023/A:1006207614388
Ahmad, I., Dole, J. M., and Whipker, B. E. (2015). Paclobutrazol or uniconazole effects on ethylene sensitivity of potted ornamental plants and plugs. Sci. Hortic. 192, 350–356. doi: 10.1016/j.scienta.2015.04.032
Arana, M. V., Marín-de la Rosa, N., Maloof, J. N., Blázquez, M. A., and Alabadí, D. (2011). Circadian oscillation of gibberellin signaling in Arabidopsis. Proc. Natl. Acad. Sci. U.S.A. 108, 9292–9297. doi: 10.1073/pnas.1101050108
Ariizumi, T., Murase, K., Sun, T., and Steber, C. M. (2008). Proteolysis-independent downregulation of DELLA repression in Arabidopsis by the gibberellin receptor GIBBERELLIN INSENSITIVE DWARF1. Plant Cell 20, 2447–2459. doi: 10.1105/tpc.108.058487
Aubert, D., Chevillard, M., Dorne, A. M., Arlaud, G., and Herzog, M. (1998). Expression patterns of GASA genes in Arabidopsis thaliana: the GASA4 gene is up-regulated by gibberellins in meristematic regions. Plant Mol. Biol. 36, 871–883. doi: 10.1023/A:1005938624418
Boccaccini, A., Santopolo, S., Capauto, D., Lorrai, R., Minutello, E., Serino, G., et al. (2014). The DOF Protein DAG1 and the DELLA Protein GAI cooperate in negatively regulating the AtGA3ox1 Gene. Mol. Plant 7, 1486–1489. doi: 10.1093/mp/ssu046
Boneh, U., Biton, I., Zheng, C., Schwartz, A., and Ben-Ari, G. (2012). Characterization of potential ABA receptors in Vitis vinifera. Plant Cell Rep. 31, 311–321. doi: 10.1007/s00299-011-1166-z
Boss, P. K., and Thomas, M. R. (2002). Association of dwarfism and floral induction with a grape ‘green revolution’ mutation. Nature 416, 847–850. doi: 10.1038/416847a
Brian, P. W., Hemming, H. G., and Lowe, D. (1962). Relative activity of the gibberellins. Nature 193, 946–948. doi: 10.1038/193946a0
Busov, V., Meilan, R., Pearce, D. W., Rood, S. B., Ma, C., Tschaplinski, T. J., et al. (2006). Transgenic modification of gai or rgl1 causes dwarfing and alters gibberellins, root growth, and metabolite profiles in Populus. Planta 224, 288–299. doi: 10.1007/s00425-005-0213-9
Buta, J. G., and Spaulding, D. W. (1991). Effect of paclobutrazol on abscisic acid levels in wheat seedlings. J. Plant Growth Regul. 10, 59–61. doi: 10.1007/bf02279312
Cabezas, J. A., Cervera, M. T., Ruiz-García, L., Carreño, J., and Martínez-Zapater, J. M. (2006). A genetic analysis of seed and berry weight in grapevine. Genome 49, 1572–1585. doi: 10.1139/g06-122
Cao, D., Cheng, H., Wu, W., Soo, H. M., and Peng, J. (2006). Gibberellin mobilizes distinct DELLA-dependent transcriptomes to regulate seed germination and floral development in Arabidopsis. Plant Physiol. 142, 509–525. doi: 10.1104/pp.106.082289
Chaib, J., Torregrosa, L., Mackenzie, D., Corena, P., Bouquet, A., and Thomas, M. R. (2010). The grape microvine–a model system for rapid forward and reverse genetics of grapevine. Plant J. 62, 1083–1092. doi: 10.1111/j.1365-313X.2010.04219.x
Chandler, P. M., Harding, C. A., Ashton, A. R., Mulcair, M. D., Dixon, N. E., and Mander, L. N. (2008). Characterization of gibberellin receptor mutants of barley (Hordeum vulgare L.). Mol. Plant 1, 285–294. doi: 10.1093/mp/ssn002
Chandler, P. M., Marion-Poll, A., Ellis, M., and Gubler, F. (2002). Mutants at the slender1 locus of barley cv himalaya. Molecular and physiological characterization. Plant Physiol. 129, 181–190. doi: 10.1104/pp.010917
Cheng, C., Xu, X., Singer, S. D., Li, J., Zhang, H., Gao, M., et al. (2013). Effect of GA3 treatment on seed development and seed-related gene expression in grape. PLoS ONE 8:e80044. doi: 10.1371/journal.pone
Cheng, H., Qin, L., Lee, S., Fu, X., Richards, D. E., Cao, D., et al. (2004). Gibberellin regulates Arabidopsis floral development via suppression of DELLA protein function. Development 131, 1055–1064. doi: 10.1242/dev.00992
Conde, C., Silva, P., Fontes, N., Dias, A. C. P., Tavares, R. M., Sousa, M. J., et al. (2007). Biochemical changes throughout grape berry development and fruit and wine quality. Food 1, 1–22. doi: 10.1186/s12864-016-2660-z
Coombe, B. G. (1995). Adoption of a system for identifying grapevine growth stages. Aust. J. Grape Wine Res. 1, 100–110. doi: 10.1111/j.1755-0238.1995.tb00086.x
Dill, A., Jung, H. S., and Sun, T. (2001). The DELLA motif is essential for gibberellin-induced degradation of RGA. Proc. Natl. Acad. Sci. U.S.A. 98, 14162–14167. doi: 10.1073/pnas.251534098
Dill, A., and Sun, T.-P. (2001). Synergistic derepression of gibberellin signaling by removing RGA and GAI function in Arabidopsis thaliana. Genetics 159, 777–785.
Dill, A., Thomas, S. G., Hu, J., Steber, C. M., and Sun, T. (2004). The Arabidopsis F-box protein SLEEPY1 targets gibberellin signaling repressors for gibberellin-induced degradation. Plant Cell 16, 1392–1405. doi: 10.1105/tpc.020958
Doligez, A., Bertrand, Y., Farnos, M., Grolier, M., Romieu, C., Esnault, F., et al. (2013). New stable QTLs for berry weight do not colocalize with QTLs for seed traits in cultivated grapevine (Vitis vinifera L.). BMC Plant Biol. 13:e217. doi: 10.1186/1471-2229-13-217
Dreier, L. P., Hunte, J. J., and Ruffner, H. P. (1998). Invertase activity, grape berry development and cell compartmentation. Plant Physiol. Biochem. 36, 865–872. doi: 10.1016/S0981-9428(99)80004-7
Fos, M., Nuez, F., and García-Martínez, J. L. (2000). The gene pat-2, which induces natural parthenocarpy, alters the gibberellin content in unpollinated tomato ovaries. Plant Physiol. 122, 471–479. doi: 10.1104/pp.122.2.471
Fos, M., Proaño, K., Nuez, F., and García-Martínez, J. L. (2001). Role of gibberellins in parthenocarpic fruit development induced by the genetic system pat-3/pat-4 in tomato. Physiol. Plant. 111, 545–550. doi: 10.1034/j.1399-3054.2001.1110416.x
Giacomelli, L., Rota-Stabelli, O., Masuero, D., Acheampong, A. K., Moretto, M., Caputi, L., et al. (2013). Gibberellin metabolism in Vitis vinifera L. during bloom and fruit-set: functional characterization and evolution of grapevine gibberellin oxidases. J. Exp. Bot. 64, 4403–4419. doi: 10.1093/jxb/ert251
Griffiths, J., Murase, K., Rieu, I., Zentella, R., Zhang, Z. L., Powers, S. J., et al. (2006). Genetic characterization and functional analysis of the GID1 gibberellin receptors in Arabidopsis. Plant Cell 18, 3399–3414. doi: 10.1105/tpc.106.047415
Hagiwara, K., Ryugo, K., and Olmo, H. P. (1980). Comparison between responsiveness of selected grape clones to gibberellin applications and their endogenous levels in breaking buds and maturing berries. Am. J. Enol. Vitic. 31, 309–313.
Harberd, N. P., Belfield, E., and Yasumura, Y. (2009). The Angiosperm gibberellin-GID1-DELLA growth regulatory mechanism: how an “inhibitor of an inhibitor” enables flexible response to fluctuating environments. Plant Cell 21, 1328–1339. doi: 10.1105/tpc.109.066969
Harrell, D. C., and Williams, L. E. (1987). The influence of girdling and gibberellic acid application at fruitset on ruby seedless and thompson seedless grapes. Am. J. Enol. Vitic. 38, 83–88.
Hauvermale, A. L., Ariizumi, T., and Steber, C. M. (2014). The roles of the GA receptors GID1a, GID1b, and GID1c in sly1-independent GA signaling. Plant Signal. Behav. 9:e28030. doi: 10.4161/psb.28030
Hirano, K., Asano, K., Tsuji, H., Kawamura, M., Mori, H., Kitano, H., et al. (2010). Characterization of the molecular mechanism underlying gibberellin perception complex formation in rice. Plant Cell 22, 2680–2696. doi: 10.1105/tpc.110.075549
Hirano, K., Ueguchi-Tanaka, M., and Matsuoka, M. (2008). GID1-mediated gibberellin signaling in plants. Trends Plant Sci. 13, 192–199. doi: 10.1016/j.tplants.2008.02.005
Hu, J., Mitchum, M. G., Barnaby, N., Ayele, B. T., Ogawa, M., Nam, E., et al. (2008). Potential sites of bioactive gibberellin production during reproductive growth in Arabidopsis. Plant Cell 20, 320–336. doi: 10.1105/tpc.107.057752
Ikeda, A., Ueguchi-Tanaka, M., Sonoda, Y., Kitano, H., Koshioka, M., Futsuhara, Y., et al. (2001). Slender rice, a constitutive gibberellin response mutant, is caused by a null mutation of the SLR1 gene, an ortholog of the height-regulating gene GAI/RGA/RHT/D8. Plant Cell 13, 999–1010. doi: 10.1105/tpc.13.5.999
Itoh, H., Shimada, A., Ueguchi-Tanaka, M., Kamiya, N., Hasegawa, Y., Ashikari, M., et al. (2005). Overexpression of a GRAS protein lacking the DELLA domain confers altered gibberellin responses in rice. Plant J. 44, 669–679. doi: 10.1111/j.1365-313X.2005.02562.x
Iwahori, S., Weaver, R. J., and Pool, R. M. (1967). Gibberellin-like activity in berries of seeded and seedless tokay grapes. Plant Physiol. 43, 333–337. doi: 10.1104/pp.43.3.333
Jung, C. J., Hur, Y. Y., Jung, S.-M., Noh, J.-H., Do, G.-R., Park, S.-J., et al. (2014). Transcriptional changes of gibberellin oxidase genes in grapevines with or without gibberellin application during inflorescence development. J. Plant Res. 127, 359–371. doi: 10.1007/s10265-013-0623-x
Kaneko, M., Itoh, H., Inukai, Y., Sakamoto, T., Ueguchi-Tanaka, M., Ashikari, M., et al. (2003). Where do gibberellin biosynthesis and gibberellin signaling occur in rice plants? Plant J. 35, 104–115. doi: 10.1046/j.1365-313x.2003.01780.x
Kato, K., Ohara, H., Takahashi, E., Matsui, H., and Nakayama, M. (1998). “Endogenous gibberellin-induced(parthenocarpy)in grape berries,” in Proceedings of the XXV International Horticultural Congress, Part 4: Culture Techniques with Special Emphasis on Environmental Implications: ISHS, Brussels, 69–74.
King, K. E., Moritz, T., and Harberd, N. P. (2001). Gibberellins are not required for normal stem growth in Arabidopsis thaliana in the absence of GAI and RGA. Genetics 159, 767–776.
Lange, M. J. P., Knop, N., and Lange, T. (2012). Stamen-derived bioactive gibberellin is essential for male flower development of Cucurbita maxima L. J. Exp. Bot. 63, 2681–2691. doi: 10.1093/jxb/err44
Lange, T., Kappler, J., Fischer, A., Frisse, A., Padeffke, T., Schmidtke, S., et al. (2005). Gibberellin biosynthesis in developing pumpkin seedlings. Plant Physiol. 139, 213–223. doi: 10.1104/pp.105.064162
Lavee, S. (1960). Effect of gibberellic acid on seeded grapes. Nature 185, 395. doi: 10.1371/journal.pone.0080044
Li, H., Wang, Y., Li, X., Gao, Y., Wang, Z., Zhao, Y., et al. (2011). A GA-insensitive dwarf mutant of Brassica napus L. correlated with mutation in pyrimidine box in the promoter of GID1. Mol. Biol. Rep. 38, 191–197. doi: 10.1007/s11033-010-0094-2
McGinnis, K. M., Thomas, S. G., Soule, J. D., Strader, L. C., Zale, J. M., Sun, T., et al. (2003). The Arabidopsis SLEEPY1 gene encodes a putative F-box subunit of an SCF E3 ubiquitin ligase. Plant Cell 15, 1120–1130. doi: 10.1105/tpc.010827
Mullins, M. G., Bouquet, A., and Williams, L. E. (1992). Biology of the Grapevine. Cambridge: Cambridge University Press.
Paleg, L., Aspinall, D., Coombe, B., and Nicholls, P. (1964). Physiological effects of gibberellic acid. VI. Other gibberellins in three test systems. Plant Physiol. 39, 286–290. doi: 10.1104/pp.39.2.286
Perez, F. J., Viani, C., and Retamales, J. (2000). Bioactive gibberellins in seeded and seedless grapes: identification and changes in content during berry development. Am. J. Enol. Vitic. 51, 315–318.
Perl, A., Spiegel-Roy, P., Baron, I., and Sahar, N. (1995). ARO 149 – A Grapevine Cultivar Registered as “Black-finger”. Israel Application No. 2466.
Pfaffl, M. W. (2001). A new mathematical model for relative quantification in real-time RT-PCR. Nucleic Acids Res. 29:e45. doi: 10.1093/nar/29.9.e45
Plackett, A. R. G., Ferguson, A. C., Powers, S. J., Wanchoo-Kohli, A., Phillips, A. L., Wilson, Z. A., et al. (2014). DELLA activity is required for successful pollen development in the Columbia ecotype of Arabidopsis. New Phytol. 201, 825–836. doi: 10.1111/nph.12571
Reid, K. E., Olsson, N., Schlosser, J., Peng, F., and Lund, S. T. (2006). An optimized grapevine RNA isolation procedure and statistical determination of reference genes for real-time RT-PCR during berry development. BMC Plant Biol. 6:27. doi: 10.1186/1471-2229-6-27
Ross, J. J., O’Neill, D. P., Smith, J. J., Kerckhoffs, L. H., and Elliott, R. C. (2000). Evidence that auxin promotes gibberellin A1 biosynthesis in pea. Plant J. 21, 547–552. doi: 10.1046/j.1365-313x.2000.00702.x
Russell, J. R., Hosein, F., Johnson, E., Waugh, R., and Powell, W. (1992). Genetic differentiation of cocoa (Theobroma cacao L.) populations revealed by RAPD analyis. Mol. Ecol. 2, 89–97. doi: 10.1111/j.1365-294X.1993.tb00003.x
Sasaki, A., Itoh, H., Gomi, K., Ueguchi-Tanaka, M., Ishiyama, K., Kobayashi, M., et al. (2003). Accumulation of phosphorylated repressor for gibberellin signaling in an F-box mutant. Science 299, 1896–1898. doi: 10.1126/science.1081077
Schneider, C. A., Rasband, W. S., and Eliceiri, K. W. (2012). NIH Image to ImageJ: 25 years of image analysis. Nat. Methods 9, 671–675. doi: 10.1038/nmeth.2089
Silverstone, A. L., Chang, C., Krol, E., and Sun, T. (1997). Developmental regulation of the gibberellin biosynthetic gene GA1 in Arabidopsis thaliana. Plant J. 12, 9–19. doi: 10.1046/j.1365-313X.1997.12010009.x
Spiegel-Roy, P., Baron, I., Sahar, N., and Perl, A. (1994). ARO 637 – A Grapevine Cultivar Registered as “Spring Blush”. Israel Application No. 2042.
Spielmeyer, W., Ellis, M., and Chandler, P. M. (2002). Semidwarf (sd-1), “green revolution” rice, contains a defective gibberellin 20-oxidase gene. Proc. Natl. Acad. Sci. U.S.A. 99, 9043–9048. doi: 10.1073/pnas.132266399
Sun, T. (2010). Gibberellin-GID1-DELLA: a pivotal regulatory module for plant growth and development. Plant Physiol. 154, 567–570. doi: 10.1104/pp.110.161554
Sun, T. (2011). The molecular mechanism and evolution of the GA-GID1-DELLA signaling module in plants. Curr. Biol. 21, R338–R345. doi: 10.1016/j.cub.2011.02.036
Suzuki, H., Park, S., Okubo, K., Kitamura, J., Ueguchi-Tanaka, M., Iuchi, S., et al. (2009). Differential expression and affinities of Arabidopsis gibberellin receptors can explain variation in phenotypes of multiple knock-out mutants. Plant J. 60, 48–55. doi: 10.1111/j.1365-313X.2009.03936.x
Tyler, L., Thomas, S. G., Hu, J., Dill, A., Alonso, J. M., Ecker, J. R., et al. (2004). DELLA proteins and gibberellin-regulated seed germination and floral development in Arabidopsis. Plant Physiol. 135, 1008–1019. doi: 10.1104/pp.104.039578
Ueguchi-Tanaka, M., Ashikari, M., Nakajima, M., Itoh, H., Katoh, E., Kobayashi, M., et al. (2005). GIBBERELLIN INSENSITIVE DWARF1 encodes a soluble receptor for gibberellin. Nature 437, 693–698. doi: 10.1038/nature04028
Ueguchi-Tanaka, M., Hirano, K., Hasegawa, Y., Kitano, H., and Matsuoka, M. (2008). Release of the repressive activity of rice DELLA protein SLR1 by gibberellin does not require SLR1 degradation in the gid2 mutant. Plant Cell 20, 2437–2446. doi: 10.1105/tpc.108.061648
Untergasser, A., Cutcutache, I., Koressaar, T., Ye, J., Faircloth, B. C., Remm, M., et al. (2012). Primer3 - new capabilities and interfaces. Nucleic Acids Res. 40, e115. doi: 10.1093/nar/gks596
Voegele, A., Linkies, A., Müller, K., and Leubner-Metzger, G. (2011). Members of the gibberellin receptor gene family GID1 (GIBBERELLIN INSENSITIVE DWARF1) play distinct roles during Lepidium sativum and Arabidopsis thaliana seed germination. J. Exp. Bot. 62, 5131–5147. doi: 10.1093/jxb/err214
Wang, W., Vignani, R., Scali, M., and Cresti, M. (2006). A universal and rapid protocol for protein extraction from recalcitrant plant tissues for proteomic analysis. Electrophoresis 27, 2782–2786. doi: 10.1002/elps.200500722
Weaver, R. J. (1958). Effect of gibberellic acid on fruit set and berry enlargement in seedless grapes of Vitis vinifera. Nature 181, 851–852. doi: 10.1038/181851b0
Weaver, R. J. (1961). Growth of grapes in relation to gibberellin. Am. Chem. Soc. 28, 89–108. doi: 10.1021/ba-1961-0028.ch010
Weaver, R. J. (1965). Relation of ringing to gibberellin-like activity in berries of Vitis vinifera L. Nature 206, 318–319. doi: 10.1038/206318a0
Weaver, R. J., McCune, S. B., and Hale, C. R. (1962). Effect of plant regulators on set and berry development in certain seedless and seeded varieties of Vitis vinifera L. Vitis 3, 84–96.
Willige, B. C., Ghosh, S., Nill, C., Zourelidou, M., Dohmann, E., Maier, A., et al. (2007). The DELLA domain of GA INSENSITIVE mediates the interaction with the GA INSENSITIVE DWARF1A gibberellin receptor of Arabidopsis. Plant Cell 19, 1209–1220. doi: 10.1105/tpc.107.051441
Wolbang, C. M., Chandler, P. M., Smith, J. J., and Ross, J. J. (2004). Auxin from the developing inflorescence is required for the biosynthesis of active gibberellins in barley stems. Plant Physiol. 134, 769–776. doi: 10.1104/pp.103.030460
Yamamoto, Y., Hirai, T., Yamamoto, E., Kawamura, M., Sato, T., Kitano, H., et al. (2010). A rice gid1 suppressor mutant reveals that Gibberellin is not always required for interaction between its receptor, GID1, and DELLA proteins. Plant Cell 22, 3589–3602. doi: 10.1105/tpc.110.074542
Keywords: DELLA proteins, gene expression, gibberellin, gibberellin signaling, Vitis vinifera, VvSLY1
Citation: Acheampong AK, Zheng C, Halaly T, Giacomelli L, Takebayashi Y, Jikumaru Y, Kamiya Y, Lichter A and Or E (2017) Abnormal Endogenous Repression of GA Signaling in a Seedless Table Grape Cultivar with High Berry Growth Response to GA Application. Front. Plant Sci. 8:850. doi: 10.3389/fpls.2017.00850
Received: 12 January 2017; Accepted: 08 May 2017;
Published: 24 May 2017.
Edited by:
Giuseppe Ferrara, Università degli Studi di Bari Aldo Moro, ItalyReviewed by:
Matthew W. Fidelibus, University of California, Davis, United StatesPablo Carbonell-Bejerano, Instituto de las Ciencias de la Vid y del Vino (CSIC), Spain
Copyright © 2017 Acheampong, Zheng, Halaly, Giacomelli, Takebayashi, Jikumaru, Kamiya, Lichter and Or. This is an open-access article distributed under the terms of the Creative Commons Attribution License (CC BY). The use, distribution or reproduction in other forums is permitted, provided the original author(s) or licensor are credited and that the original publication in this journal is cited, in accordance with accepted academic practice. No use, distribution or reproduction is permitted which does not comply with these terms.
*Correspondence: Etti Or, vhettior@agri.gov.il