 Lu-Xian Liu
 Rui Li
 James R. P. Worth
 Xian Li5
 Pan Li
 Kenneth M. Cameron
 Cheng-Xin Fu
- 1Laboratory of Plant Germplasm and Genetic Engineering, College of Life Sciences, Henan University, Kaifeng, China
- 2Key Laboratory of Conservation Biology for Endangered Wildlife of the Ministry of Education, College of Life Sciences, Zhejiang University, Hangzhou, China
- 3Food Inspection and Testing Institute of Henan Province, Zhengzhou, China
- 4Department of Forest Molecular Genetics and Biotechnology, Forestry and Forest Products Research Institute, Ibaraki, Japan
- 5Zhejiang Provincial Key Laboratory of Horticultural Plant Integrative Biology, Zhejiang University, Hangzhou, China
- 6Department of Botany, University of Wisconsin, Madison, WI, United States
Morella rubra (Myricaceae), also known as Chinese bayberry, is an economically important, subtropical, evergreen fruit tree. The phylogenetic placement of Myricaceae within Fagales and the origin of Chinese bayberry’s domestication are still unresolved. In this study, we report the chloroplast (cp) genome of M. rubra and take advantage of several previously reported chloroplast genomes from related taxa to examine patterns of evolution in Fagales. The cp genomes of three M. rubra individuals were 159,478, 159,568, and 159.586 bp in length, respectively, comprising a pair of inverted repeat (IR) regions (26,014–26,069 bp) separated by a large single-copy (LSC) region (88,683–88,809 bp) and a small single-copy (SSC) region (18,676–18,767 bp). Each cp genome encodes the same 111 unique genes, consisting of 77 different protein-coding genes, 30 transfer RNA genes and four ribosomal RNA genes, with 18 duplicated in the IRs. Comparative analysis of chloroplast genomes from four representative Fagales families revealed the loss of infA and the pseudogenization of ycf15 in all analyzed species, and rpl22 has been pseudogenized in M. rubra and Castanea mollissima, but not in Juglans regia or Ostrya rehderiana. The genome size variations are detected mainly due to the length of intergenic spacers rather than gene loss, gene pseudogenization, IR expansion or contraction. The phylogenetic relationships yielded by the complete genome sequences strongly support the placement of Myricaceae as sister to Juglandaceae. Furthermore, seven cpDNA markers (trnH-psbA, psbA-trnK, rps2-rpoC2, ycf4-cemA, petD-rpoA, ndhE-ndhG, and ndhA intron) with relatively high levels of variation and variable cpSSR loci were identified within M. rubra, which will be useful in future research characterizing the population genetics of M. rubra and investigating the origin of domesticated Chinese bayberry.
Introduction
Chloroplasts (cp) are essential organelles in plant cells for photosynthesis and perform other functions comprising synthesizing starch, fatty acids, pigments and amino acids (Neuhaus and Emes, 2000). Typically, the sizes of chloroplast genomes and their gene arrangement in angiosperms are highly conserved and usually have a circular structure ranging from 120 to 160 kb, with two copies of inverted repeats (IR) region separated by a large single-copy (LSC) region and a small single-copy (SSC) region (Palmer, 1991; Raubeson and Jansen, 2005). Chloroplast genomes generally contain 110–130 distinct genes and these genes exhibit a highly conserved gene order with a majority of which (∼79) encoding proteins that are mostly involved in photosynthesis, whereas the rest of the genes encode approximately 30 transfer RNA (tRNA)s and four ribosomal RNA (rRNA)s (Jansen et al., 2005).
Compared with nuclear and mitochondrial genomes, chloroplast genomes are largely conserved in term of gene content, organization and structure (Raubeson and Jansen, 2005), and the nucleotide substitution rate of chloroplast genes is higher than that of mitochondrial genes, but lower than that of nuclear genes (Wolfe et al., 1987; Drouin et al., 2008). However, evolutionary events such as mutations, duplications, losses and rearrangements of genes have been reported in a number of studies (Lee et al., 2007; Dong et al., 2013; Choi et al., 2016). Due to its relatively small size, simple structure and conserved gene content, the chloroplast genome has been used as ideal research model for evolutionary and comparative genomic studies (Dong et al., 2013). In recent years, comparative studies of chloroplast genomes have been applied to a number of focal species (Young et al., 2011), genera (Greiner et al., 2008a,b), or plant families (Daniell et al., 2006). At higher taxonomic levels, comparative analyses of chloroplast genomes are useful for phylogenetic studies (Moore et al., 2007; Moore et al., 2010), as well as for understanding the genome evolution relating genome size variations, gene and intron losses and nucleotide substitutions. Moreover, chloroplasts have their own independent genome encoding an array of specific proteins, and the nature of non-recombinant and uniparental inheritance makes it a primarily useful tool in genomics and evolutionary research (Cho et al., 2015). Single nucleotide polymorphsims (SNPs) and indels, resulting from translocations, inversions, copy number variation of tandem repeats and rearrangements, are suitable for applying to phylogeny reconstruction (De Las Rivas et al., 2002), DNA barcoding (Hollingsworth et al., 2011), as well as investigating the geographic origin of some important domesticated crops (Arroyo-Garcia et al., 2006; Londo et al., 2006; Delplancke et al., 2013).
In this study, we analyzed the chloroplast genome of Morella rubra Lour. (Myricaceae), also known as Chinese bayberry, which is one of the most popular and valuable fruits in eastern China because of its appealing color, texture, delicious taste and nutritional value (Cheng et al., 2015). From the whole family Myricaceae, M. rubra is the only species to be domesticated as a fruit crop (Lu and Bornstein, 1999). Due to its long cultivation history (>2000 years) in China, as many as 305 accessions have been recorded, of which 268 have been named as cultivars (Zhang and Miao, 1999; Zhang et al., 2009). Wild populations of M. rubra, which are important germplasm resources for Chinese bayberry breeding, are distributed in the subtropical evergreen forests in China, Japan, South Korea and Philippines. Despite the economic importance of Chinese bayberry, its population genetics and domestication origin are still unclear. In fact, even the phylogenetic placement of Morella within Myricaceae, and the family within the order Fagales, remains ambiguous. This is one of the most economically and ecologically important flowering plant orders since it contains a number of domesticated nut and timber species, as well as dominant forest tree species (e.g., chestnut, walnut, hickory, oak, southern beech, birch).
Before 1990, Fagales was generally considered to contain only two families: Betulaceae and Fagaceae (Takhtajan, 1980; Cronquist, 1988). However, several large-scale phylogenetic analyses using DNA sequences (Chase et al., 1993; Soltis et al., 2000; Chen et al., 2016) and cpDNA restriction sites (Manos et al., 1993) have provided evidence for the monophyly of an expanded Fagales, which now comprises seven families: Nothofagaceae, Fagaceae, Myricaceae, Juglandaceae (including Rhoipteleaceae), Casuarinaceae, Ticodendraceae, and Betulaceae (APG III, 2009; APG IV, 2016). Most of the relationships within Fagales are well resolved, but the position of Myricaceae still remains uncertain. For example, some studies placed Myricaceae as sister to (Casuarinaceae + (Ticodendraceae + Betulaceae)) (Manos and Steele, 1997, matK/matK + rbcL; Cook and Crisp, 2005; Sauquet et al., 2012; Xiang et al., 2014; Sun et al., 2016), whereas others supported a sister relationship between Myricaceae and Juglandaceae (Li et al., 2004; Soltis et al., 2007; Larson-Johnson, 2016). Still others found that Myricaceae is sister to all Fagales except Nothofagaceae and Fagaceae (Manos and Steele, 1997, rbcL; Li et al., 2002). Thus, previous studies appear to have been based on insufficient information and thus could not fully resolve the phylogenetic position of Myricaceae.
Here, three individuals of M. rubra (Myricaceae) were selected for complete chloroplast genome sequencing. By comparing these three chloroplast genomes to each other and to previously published chloroplast genomes from other taxa in Fagales, we aim to: (1) characterize and compare the cp genomes among select representatives of Fagales in order to gain insights into evolutionary patterns within the order; (2) resolve the phylogenetic position of Myricaceae; (3) screen and identify appropriate markers of the M. rubra genome for future studies on population genetics and domestication origin.
Materials and Methods
DNA Sequencing and Genome Assembly
Total genomic DNA was isolated from silica-dried leaves of three wild M. rubra plants collected in Guangdong (GZMZ), Fujian (FJZS), and Yunnan (YNML) using a modified CTAB method (Li et al., 2013). The high molecular weight DNA was sheared using a Covaris S220-DNA Sonicator (Covaris, INC., Woburn, MA, United States), yielding fragments of ≤800 bp in length. The quality of fragmentation was checked on an Agilent Bioanalyzer 2100 (Agilent Technologies). Short-insert (500 bp) paired-end libraries were generated by using Genomic DNA Sample Prep Kit (Illumina) according to the manufacturer’s protocol and then sequenced using an Illumina HiSeq 2500 (Beijing Genomics Institute, Shenzhen, China). Resulting sequence fragments were screened by quality in order to remove low-quality sequences (Phred score <30, 0.001 probability error), and all remaining high quality sequences were assembled into contigs using the CLC de novo assembler beta 4.06 (CLC Inc., Rarhus, Denmark) with parameters as follows: minimum contig length of 200, deletion and insertion costs of 3, mismatch cost of 2, bubble size of 98, length fraction, and similarity fraction of 0.9. We obtained the principal contigs representing the chloroplast genome from the total assembled contigs using a BLAST (NCBI BLAST v2.2.31) search with the cp genome sequence of J. regia (GenBank accession number: KT870116) as a reference sequence (Peng et al., 2015). The representative chloroplast sequence contigs were ordered and oriented according to the reference chloroplast genome, and the complete chloroplast sequence of M. rubra was constructed by connecting overlapping terminal sequences.
Genome Annotation and Molecular Marker Identification
The cp genomes of M. rubra were annotated through the online program Dual Organellar Genome Annotator (DOGMA; Wyman et al., 2004). Initial annotation, putative starts, stops, and intron positions were determined according to comparisons with homologous genes of J. regia and Castanea mollissima (GenBank accession number: HQ336406) cp genomes using Geneious v9.0.5 software (Biomatters, Auckland, New Zealand). In addition, all of the identified tRNA genes were further verified by using the corresponding structures predicted by tRNAscan-SE version 1.21 (Schattner et al., 2005) with default settings. The cp genome map of M. rubra was constructed utilizing the OGDRAW program (Lohse et al., 2013).
The three completed chloroplast genome sequences of M. rubra were aligned using MAFFT (Katoh et al., 2002). In order to screen various polymorphic regions among individuals of M. rubra (i.e., below the species level), the average number of nucleotide differences (K) and total number of mutations (Eta) were determined to analyze nucleotide diversity (Pi) using DnaSP v5.0 (Librado and Rozas, 2009).
Repeat Structure and Sequence Analysis
We used the online REPuter software to visualize and locate forward, palindrome, reverse and complement sequences with a minimum repeat size of 30 bp and a sequence identity greater than 90% (Kurtz and Schleiermacher, 1999).
Microsatellite (mono-, di-, tri-, tetra-, penta-, and hexanucleotide repeats) detection was performed using Msatcommander v0.8.2 (Faircloth, 2008). We applied a threshold nine, five, five, three, three, and three repeat units for mono-, di-, tri-, tetra-, penta-, and hexanucleotide SSRs, respectively.
Comparative Chloroplast Genomic Analysis
We downloaded Castanea mollissima, Juglans regia, and Ostrya rehderiana (GenBank accession number: KT454094) chloroplast genome sequences from GenBank, in order to compare the overall similarities among different chloroplast genomes in Fagales. Pairwise alignments among four Fagales cp genomes were implemented in the mVISTA program with LAGAN mode (Frazer et al., 2004) using the annotation of Cucumis sativus (Cucurbitaceae, Cucurbitales; GenBank accession number: DQ865976) as the reference.
Synonymous (KS) and Non-synonymous (KA) Substitution Rates Analysis
The DnaSP v5.0 (Librado and Rozas, 2009) software was employed to analyze the relative rates of sequence divergence in the four Fagales species and the reference sequence. In order to analyze synonymous (KS) and non-synonymous (KA) substitution rates, we extracted the same individual functional protein-coding exons and aligned separately using Geneious v9.0.5. Genes with the same functions were grouped and analyses were carried out on (1) datasets corresponding to those with the same functions, i.e., for atp, pet, ndh, psa, psb, rpl, rpo, and rps; (2) datasets corresponding to singular genes, i.e., for cemA, matK, ccsA, clpP, rbcL, and ycf1; and (3) concatenated common protein-coding genes, except for pseudogenes or lost genes from any species.
Phylogeny Inference
The complete chloroplast genome sequences of eight species from Fagales (10 accessions) were used for phylogenetic analysis, including representatives of five genera of Fagaceae, one genus of Betulaceae, one genus of Juglandaceae, and the three newly sequenced individuals of M. rubra used to represent Myricaceae (Supplementary Table S1). Two species from Cucurbitales (Corynocarpus laevigata and Cucumis sativus) were chosen as outgroup taxa to orient the Fagales tree. In order to investigate the utility of different regions, the phylogeny was inferred using two datasets: (1) the complete chloroplast genome sequences; and (2) a set of 69 protein-coding genes shared by the chloroplast genomes of the 12 accessions. All the gaps were excluded after alignment in both analyses.
All phylogenetic analyses were conducted using maximum-likelihood (ML) and Bayesian inference (BI) methods. ML analyses were implemented in RAxML-HPC v8.1.11 on the CIPRES cluster1 (Miller et al., 2010) using the best-fit nucleotide substitution model (GTR+I+G) determined from jModelTest v2.1.4 (Posada, 2008) for the cp genome dataset and a partitioned model for protein-coding regions. BI analyses were performed in MrBayes v3.2.3 (Ronquist and Huelsenbeck, 2003) using the same model selection criteria for both data sets. Two independent parallel runs of four Metropolis-coupled Monte Carlo Markov Chains (MCMCs) were run with trees sampling every 1000 generations for five million total generations.
Results and Discussion
Genome Content and Organization in M. rubra
We generated a total of 8.5 million paired-end (PE) reads (200 million nucleotides) for M. rubra-GZMZ, and then trimmed and assembled them using the CLC genome assembler pipeline (CLC Bio, Aarhus, Denmark). A total of 290,501 PE reads were concordantly mapped to the final assembly and the mapped cp contigs were selected to merge for constructing a complete M. rubra-GZMZ cp genome map using BLAST (NCBI BLAST v2.2.31). Four initial contigs (contigs 16, 39, 79, and 883 respectively) were selected to generate the M. rubra-GZMZ cp genome sequence with no gaps and no Ns. The cp genome sequence was registered into GenBank with the accession number KY476637.
The complete chloroplast genome of M. rubra-GZMZ is 159,478 bp in length and shares the common feature of comprising two copies of IR (26,014 bp each) that divide the genome into two single-copy regions (LSC 88,683 bp; SSC 18,767 bp; Figure 1). The overall GC content of the total length, LSC, SSC, and IR regions is 36.1, 33.8, 29.2, and 42.6%, respectively. Coding regions (91,795 bp), comprising protein-coding genes (79,949 bp), tRNA genes (2,798 bp) and rRNA genes (9,048 bp) account for 57.56% of the genome, whereas non-coding regions (67,683 bp), including intergenic spaces (49,558 bp) and introns (18,125 bp) account for the remaining 42.44% of the genome.
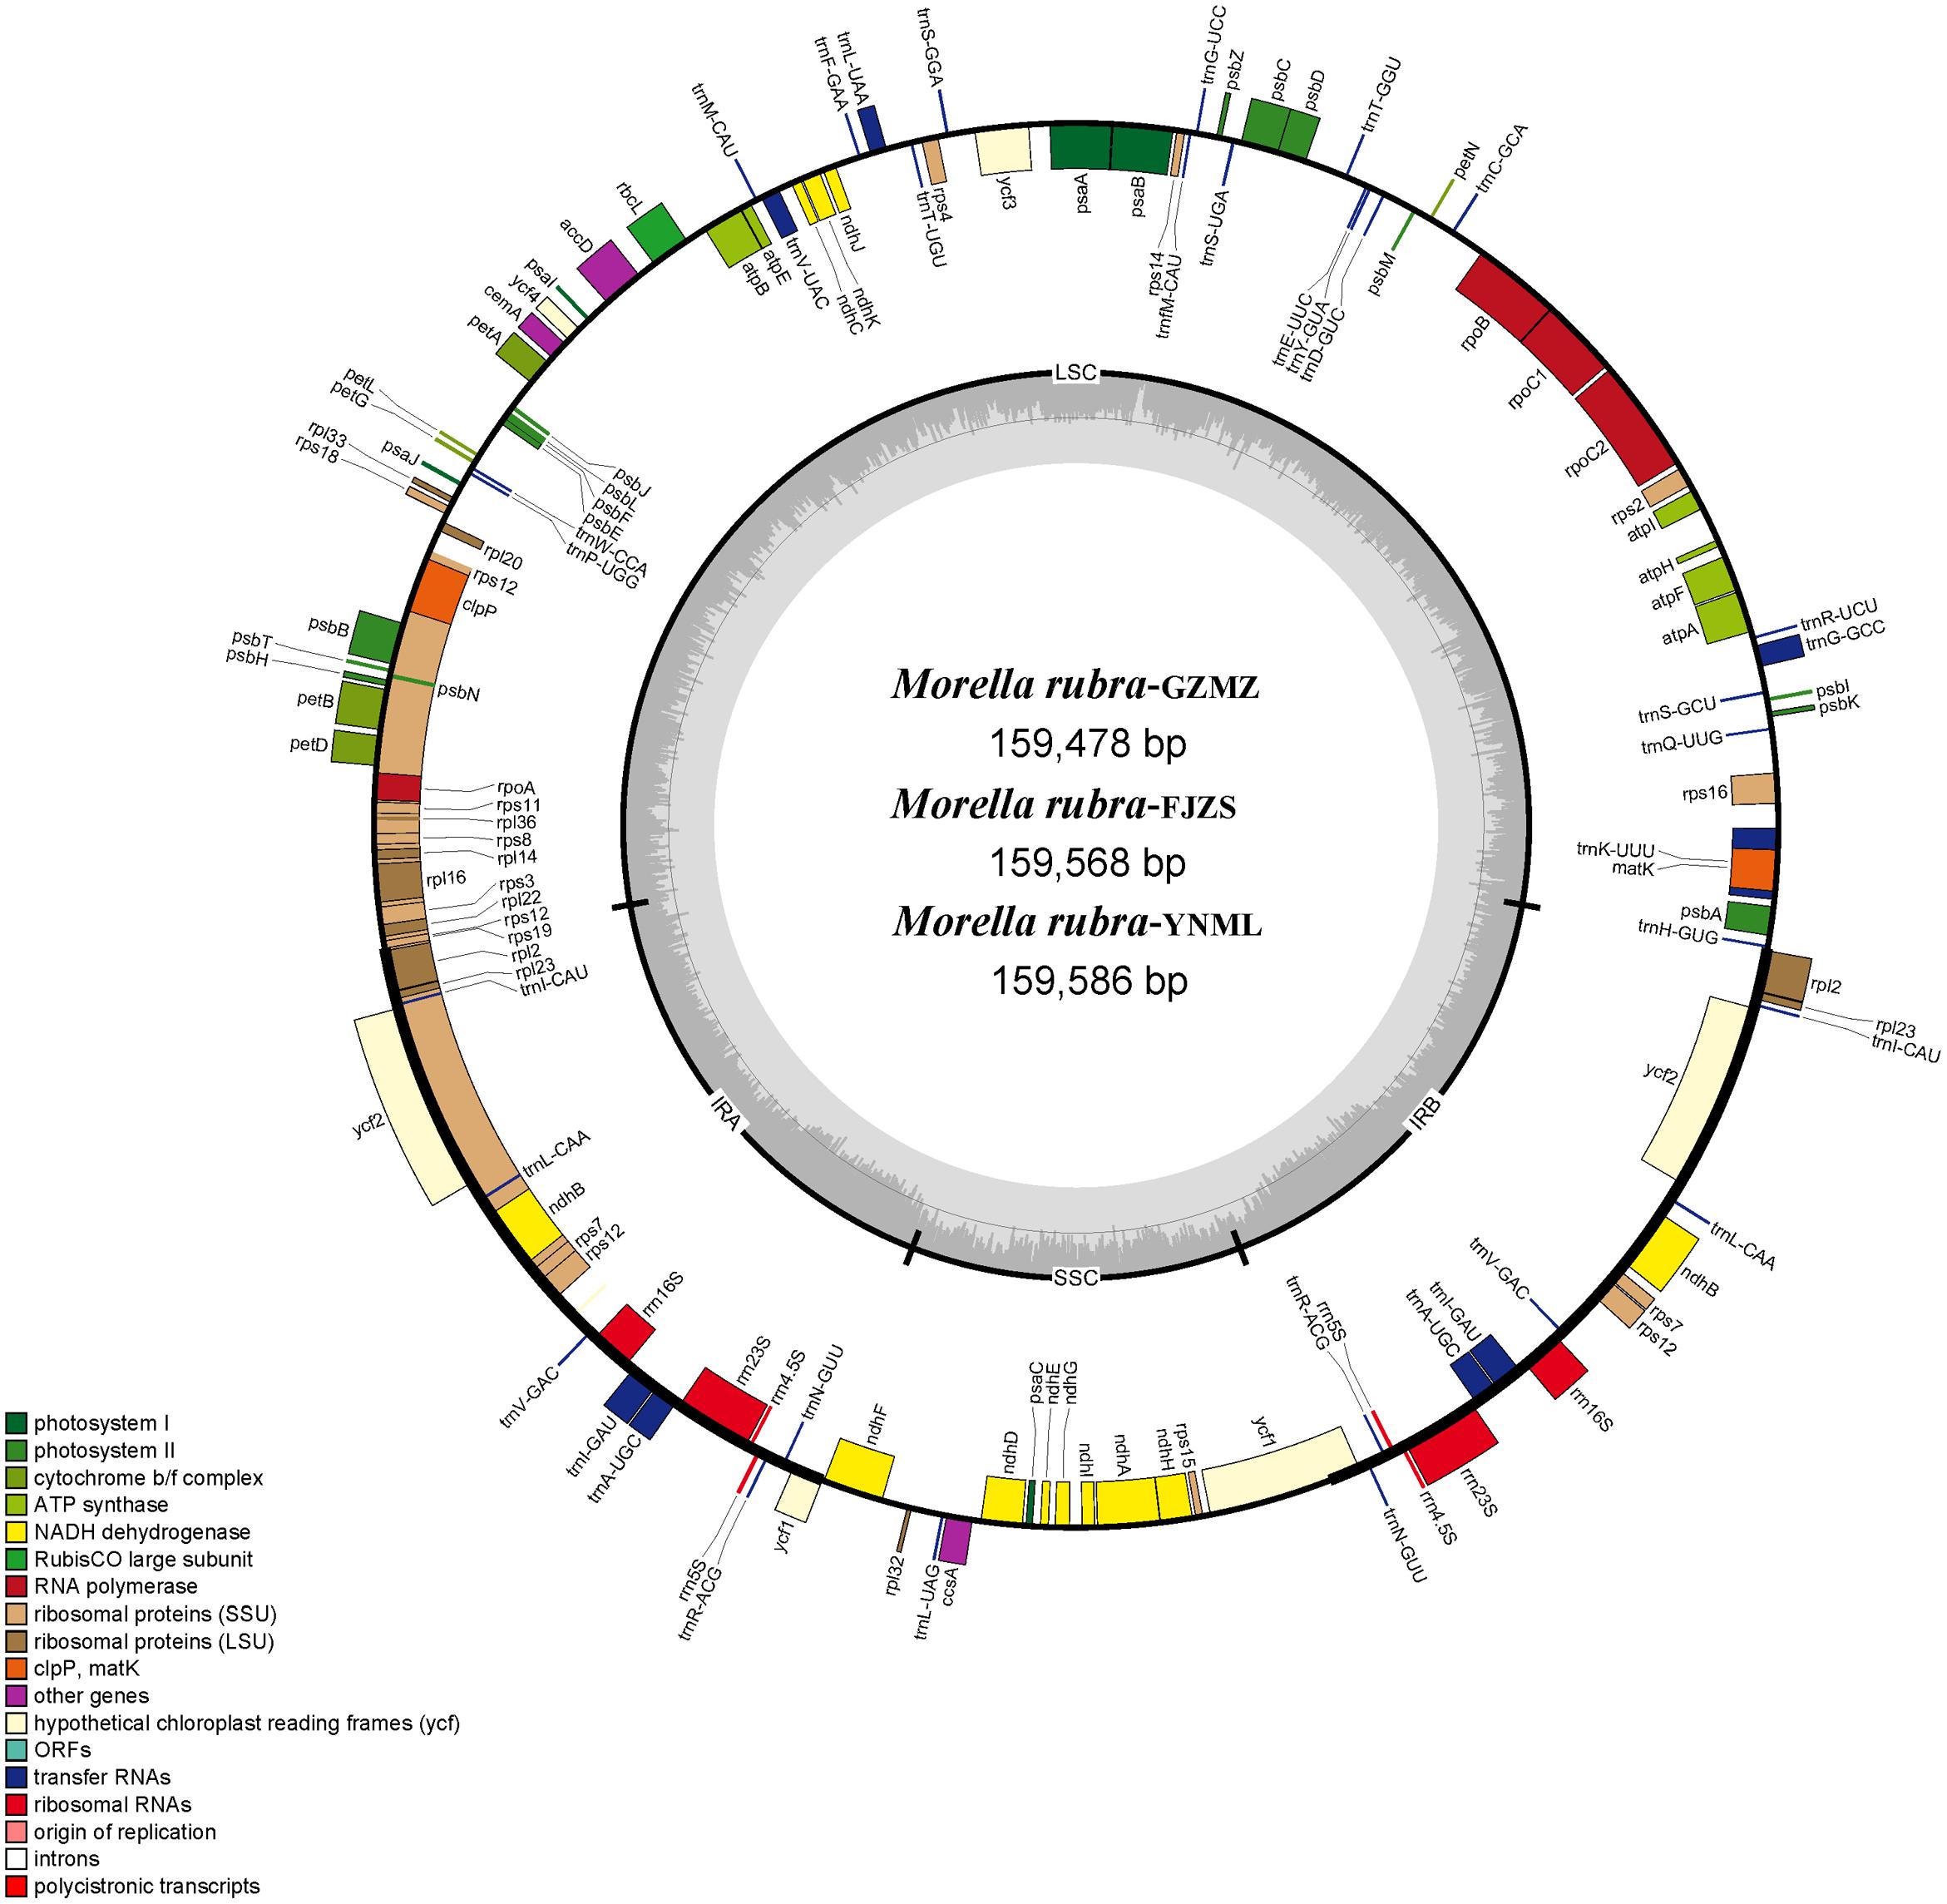
FIGURE 1. Chloroplast genome map of Morella rubra (Myricaceae). The genes inside and outside of the circle are transcribed in the counterclockwise and clockwise directions, respectively. Genes belonging to different functional groups are shown in different colors. The thick lines indicate the extent of the inverted repeats (IRA and IRB) that separate the genomes into small single-copy (SSC) and large single-copy (LSC) regions.
Within the chloroplast genome of M. rubra there are in total 111 genes, including 77 protein-coding genes, 30 tRNA genes, four rRNA genes and 18 duplicated genes (Figure 1 and Tables 1, 2). Among the 111 unique genes, 15 contain one intron (six tRNA genes and nine protein-coding genes) and three (rps12, clpP, and ycf3) contain two introns. The 5′-end exon of the rps12 gene is located in the LSC region, and the intron and 3′-end exon of the gene are situated in the IR region. In addition to the GZMZ accession, we also sequenced the complete cp genomes of M. rubra-FJZS (GenBank accession number: KY476636) and M. rubra-YNML (GenBank accession number: KY476635). These are 159,568 and 159,586 bp in size, respectively, and the genome content and organization of them is nearly the same as the cp genome of M. rubra-GZMZ (Figure 1 and Table 1).
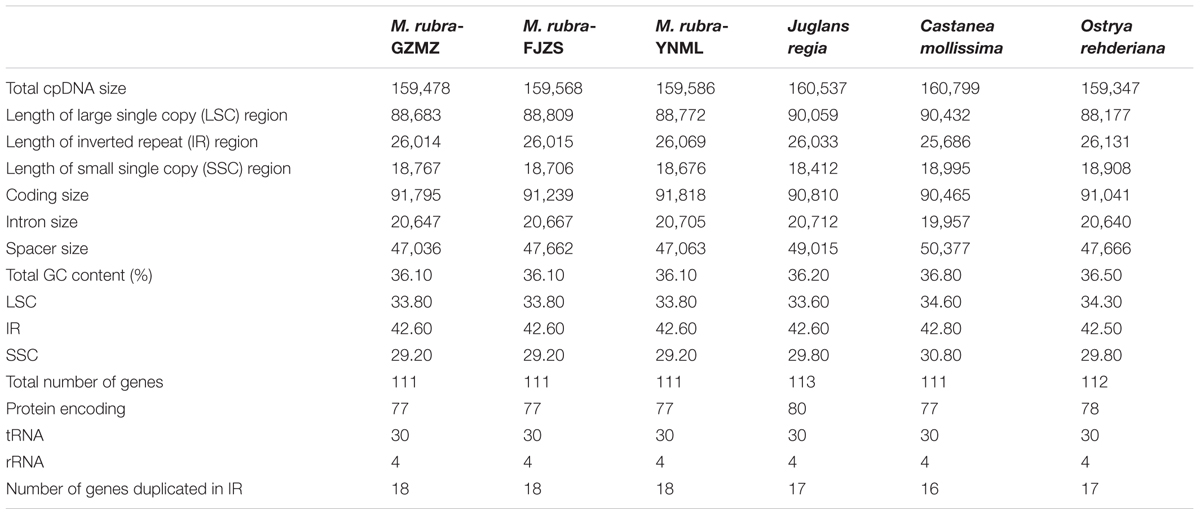
TABLE 1. Comparative analysis of the chloroplast genomes among four families of Fagales, including three different accessions of Morella rubra (Myricaceae) sequenced for this study.
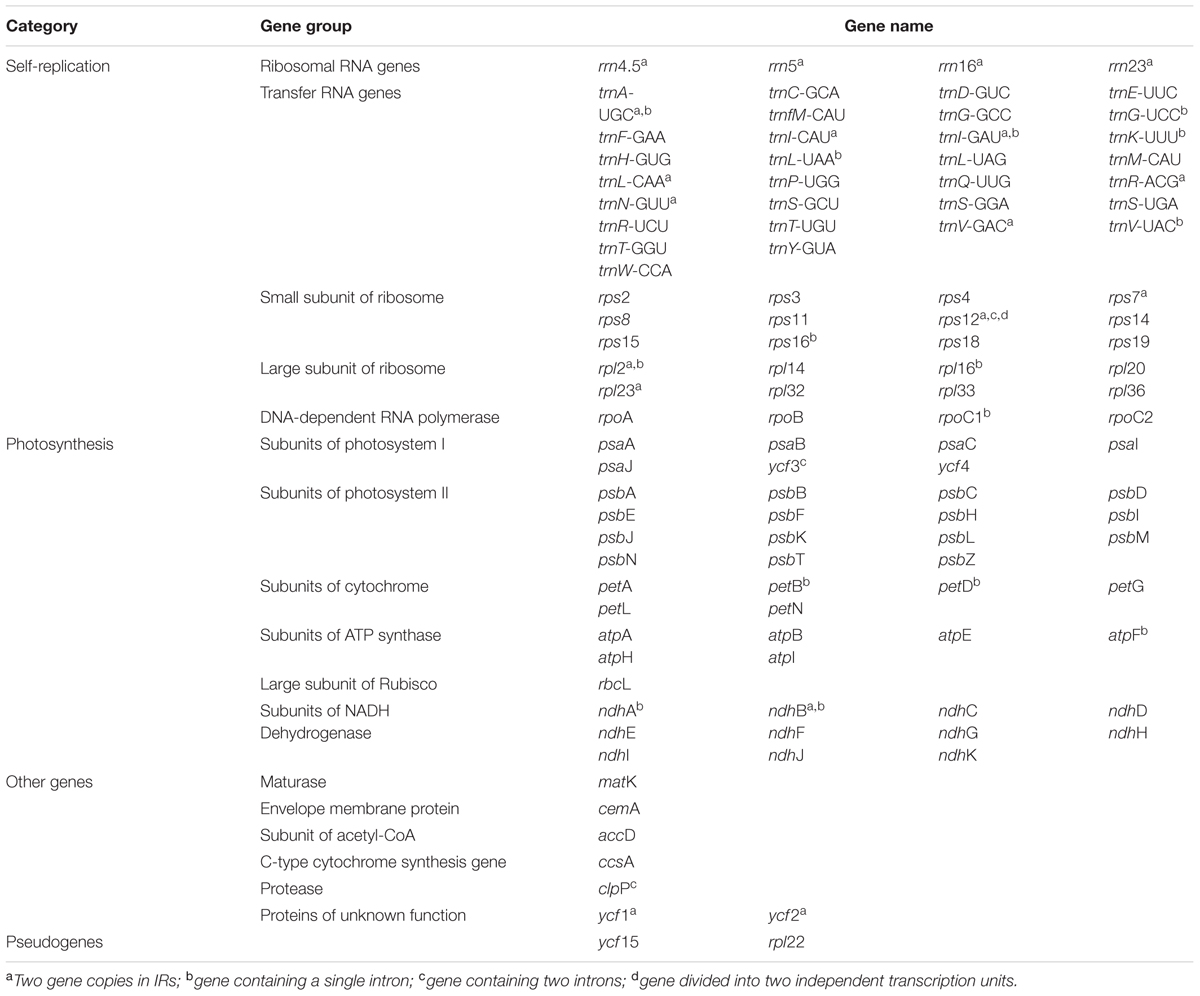
TABLE 2. List of genes present in the M. rubra chloroplast genome.
Genome Organization of Fagales
The chloroplast genome organization is rather conserved within Fagales (Figure 2). We did not detect either translocations or inversions among any of the compared genomes. The IR region in these species is more conserved than the LSC and SSC regions, consistent with other angiosperms (Dong et al., 2013;Lu R. et al., 2016). Variations were detected with the following factors: genome size, gene losses, the pseudogenization of protein-coding genes, and IR expansion and contraction.
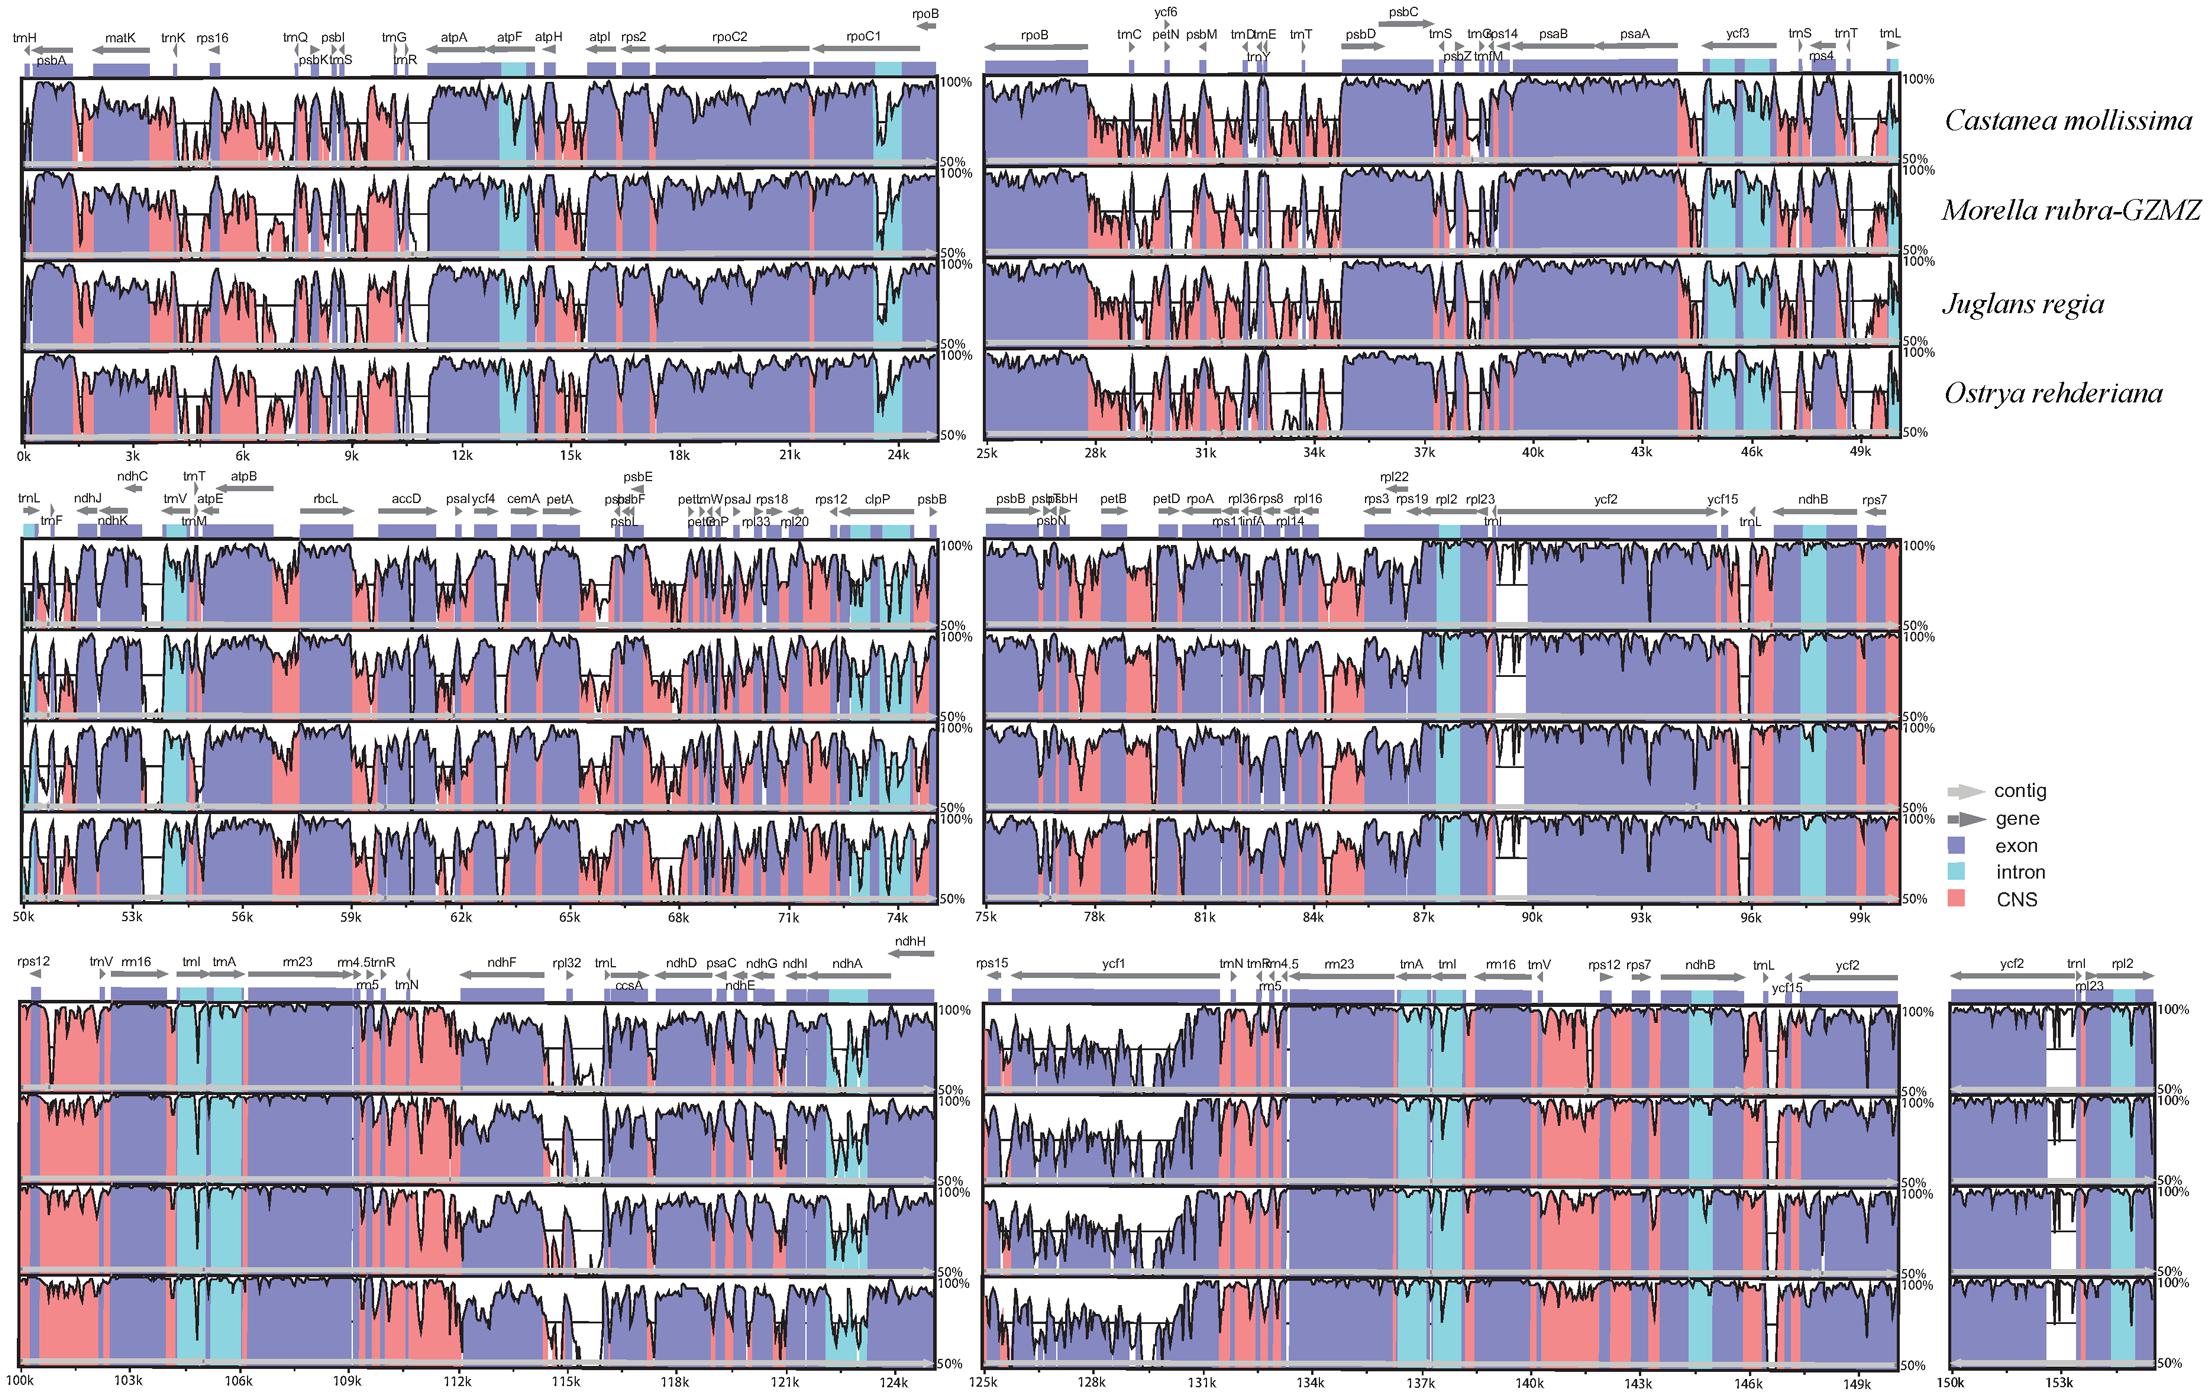
FIGURE 2. Identity plot comparing the chloroplast genomes of four Fagales families using Cucumis sativus as the reference sequence. The vertical scale indicates the percentage of identity, ranging from 50 to 100%. The horizontal axis indicates the coordinates within the chloroplast genome. Genome regions are color codes as protein-coding, rRNA, tRNA, intron, and conserved non-coding sequences (CNS).
Genome Size
Among the representative Fagales species, O.rehderiana exhibits the smallest genome size after comparing with the other three chloroplast genomes. The genome of Castanea mollissima (160,799 bp) is approximately 1.45 kb larger than that of O. rehderiana, 1.32 kb larger than that of M. rubra, and 0.26 kb larger than that of J. regia, as well as it is 5.28 kb larger than that of Cucumis sativus, an outgroup species. The detected sequence length difference is predominantly attributable to the variation in the length of the non-coding regions, especially in terms of intergenic spacer size (Table 1). The M. rubra-GZMZ genome exhibits the smallest non-coding region among the six analyzed chloroplast genomes.
Gene Loss
A single gene, infA, has been lost from all the four analyzed chloroplast genomes. After comparisons with the chloroplast genomes of other Fagales species, this gene also appears to be missing in Castanea pumila (GenBank accession number: KM360048) and Trigonobalanus doichangensis (GenBank accession number: NC023959), although it is present in Quercus edithiae (GenBank accession number: KU382355), Q. rubra (GenBank accession number: NC020152), Castanopsis echinocarpa (GenBank accession number: NC023801), Lithocarpus balansae (GenBank accession number: NC026577), Q. aliena (Lu S. et al., 2016), Q. spinosa (GenBank accession number: NC026907), Q. aquifolioides (GenBank accession number: NC026913), and Q. baronii (GenBank accession number: NC029490). InfA gene was thought to have functions as a translation initiation factor, which assists in the assembly of the translation initiation complex (Wicke et al., 2011). This gene is also possibly transferred to the nucleus and loss of which appears to have independently occurred multiple times during the evolution of land plants (Millen et al., 2001). Dong et al. (2013) reported the two genes including infA and rpl32 had been lost from the chloroplast genome of Paeonia obovata. Therefore, the loss of infA does not represent a unique phenomenon in some species of Fagales.
Gene Pseudogenization
ycf15 has been pseudogenized in all four representatives of Fagales, and rpl22 has been pseudogenized in M. rubra and Castanea mollissima but not in J. regia and O. rehderiana. The ycf15 gene, which has been paid great attention to its function by previous workers (Raubeson et al., 2007; Shi et al., 2013), is located immediately downstream of the ycf2 gene (Dong et al., 2013). Some studies have shown that the ycf15 gene is potentially functional (Shinozaki et al., 1986), but the validity of ycf15 as a protein-coding gene in angiosperms has long been questioned (Tangphatsornruang et al., 2011). The ycf15 presents a pseudogene in all the sequenced chloroplast genome of Fagales except Q. rubra. In Fagales, rpl22 appears as a pseudogene in Myricaceae and Fagaceae because there remain some internal stop codons within the coding region, and not to be pseudogenized in Juglandaceae and Betulaceae. Jansen et al. (2011) reported that rpl22 has been transferred to the nucleus in Fagaceae, whether the rpl22 gene has been transferred to the nucleus in Myricaceae remains to be investigated.
IR Expansion and Contraction
The expansions and contractions of the IR regions and the single-copy (SC) boundary regions often results in genome size variations among various plant lineages (Wang et al., 2008), and may reflect phylogenetic history. For this reason, we paid careful attention to the exact IR/SC border positions and their adjacent genes among the four Fagales species chloroplast genomes that we studied in detail (Figure 3). The ycf1 gene spanned the SSC/IRA region and the pseudogene fragment of ψycf1 varies from 1058 to 1158 bp. The ndhF gene is separated from ψycf1 by spacers except in Castanea mollissima which does not contain a spacer (53 bp in M. rubra, 104 bp in J. regia and 165 bp in O. rehderiana) but shares some nucleotides (6 bp) with the ycf1 pseudogene in our outgroup taxon, Cucumis sativus. The trnH-GUG gene is generally located downstream of the IRA/LSC border, and this gene is separated from the IRB/LSC border by a spacers varies from 8 to 47 bp. However, the rps19 gene does not extend to the IR region among the sampled representatives of Fagales. Thus, the rps19 pseudogene is not observed in Fagales. Although there are expansions and/or contractions of the IR regions detected among the sampled representatives of Fagales, they contribute little to the overall size variations in the chloroplast genomes of these plants.
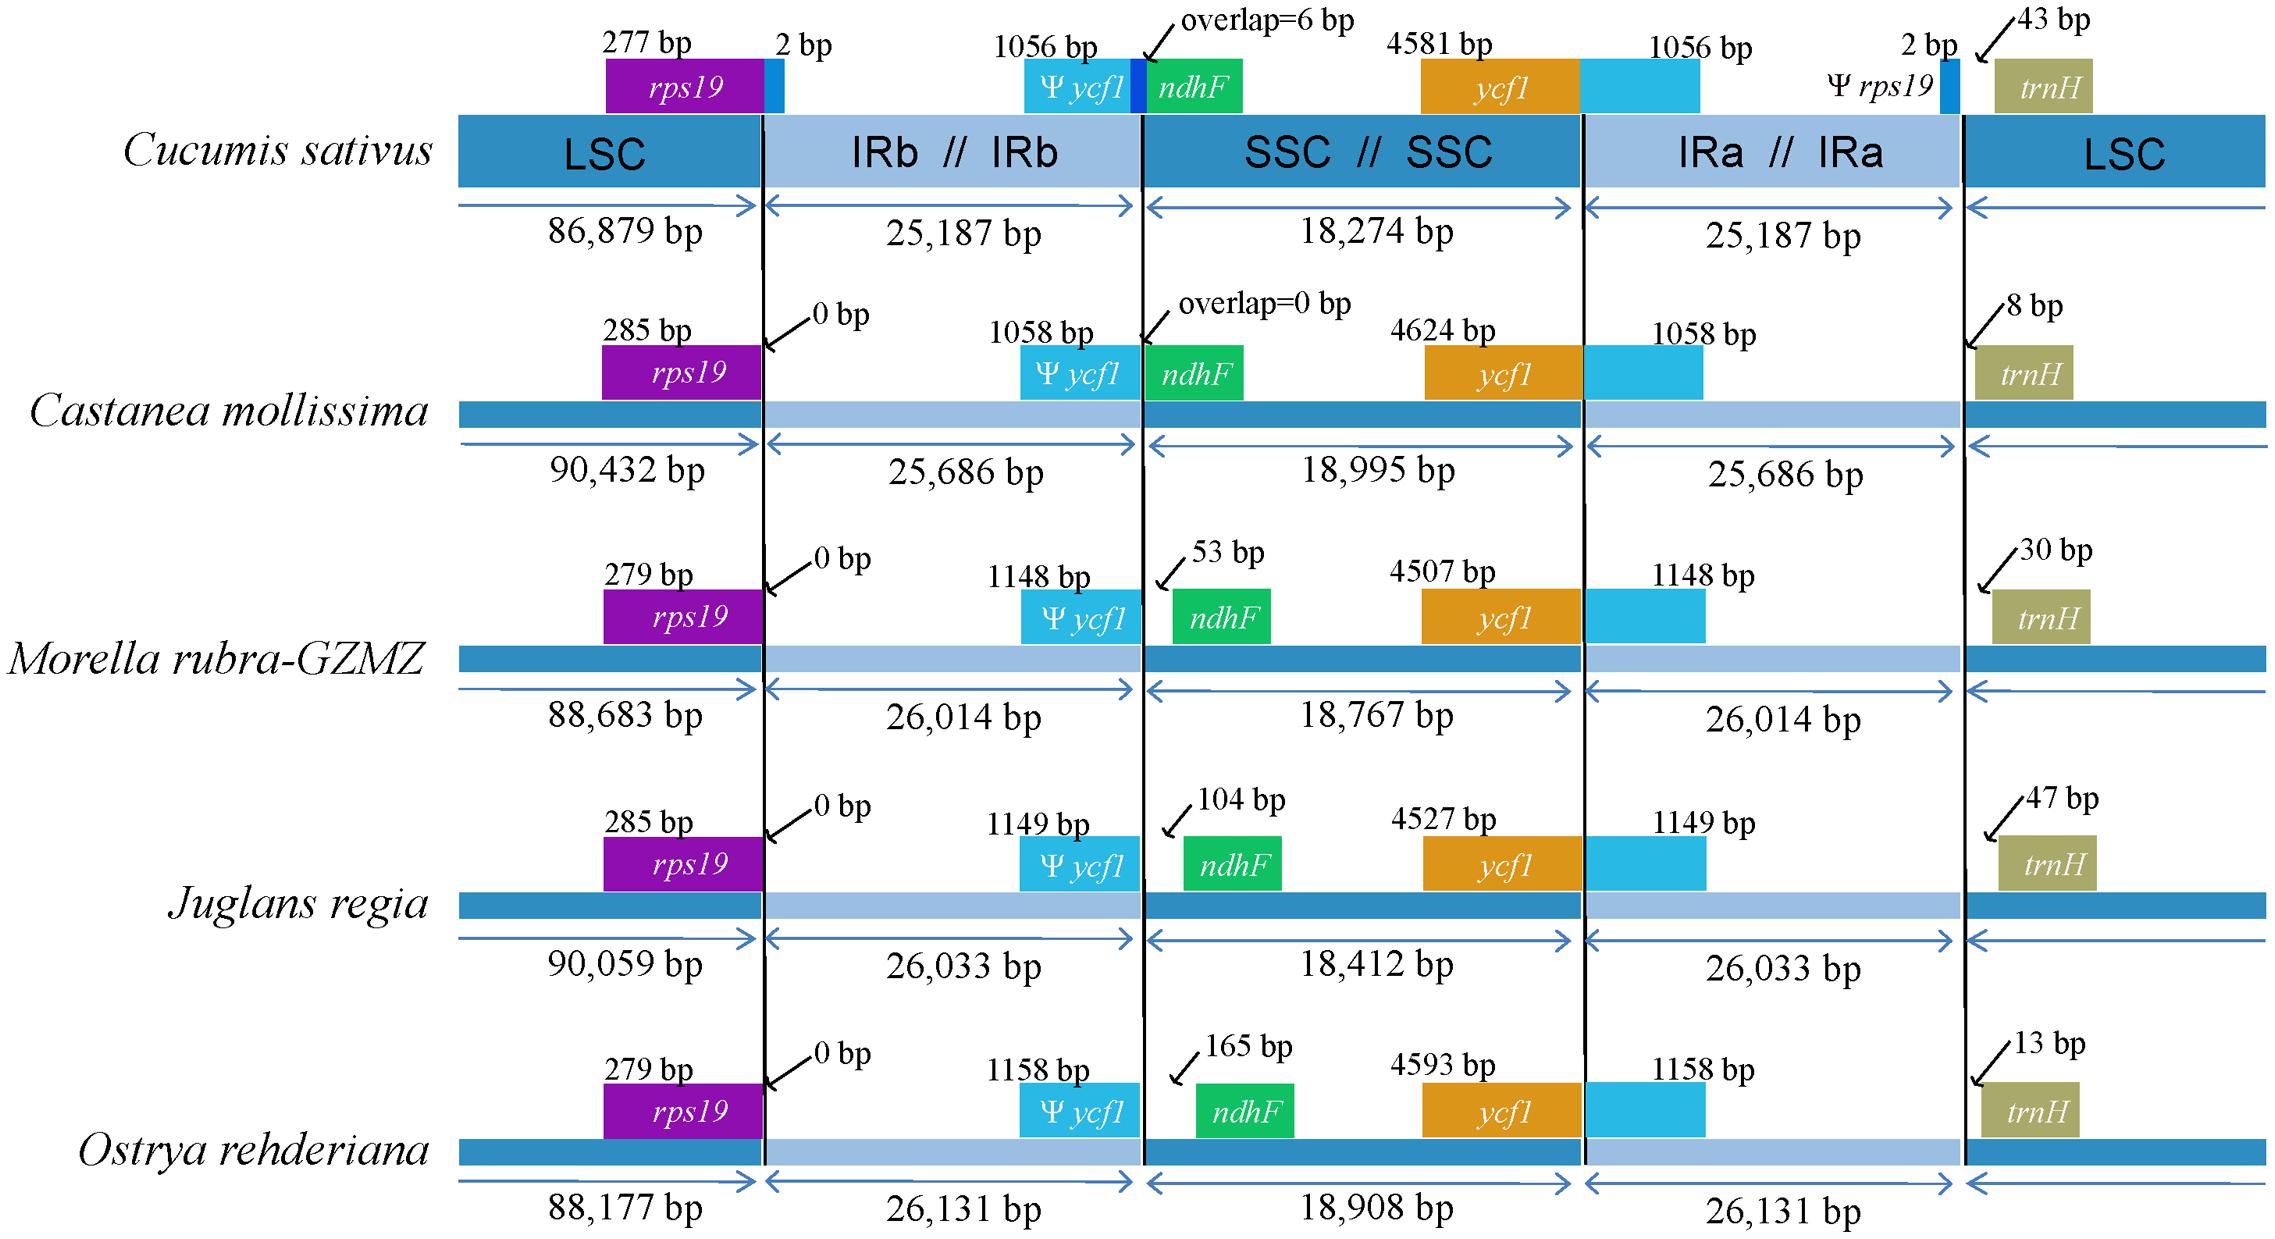
FIGURE 3. Comparison of junction positions between the single copy and IR regions among four Fagales genomes and Cucumis sativus.
Repeat Sequence Analysis and Molecular Marker Identification
Repeat motifs are thought to play an important role in phylogenetic studies and are very useful in the analysis of genome rearrangement (Cavalier-Smith, 2002; Nie et al., 2012). In the chloroplast genome of M. rubra-GZMZ, 39 pairs of repeats (30 bp or longer) containing 22 palindromic repeats, 15 forward repeats, one complement repeat and one reverse repeat were detected using the program REPuter (Kurtz and Schleiermacher, 1999) (Figure 4A). Among these repeats, 33 are 30–40 bp long, four repeats are 41 bp long, one repeat is 44 bp long and one repeat is 57 bp long (Figure 4B). Most of these repeats (53.8%) are distributed in non-coding regions (Table 3), whereas some are found in genes such as ycf1, ycf2, ycf3, psaB, and pasA. Further information about the repeat motifs of M. rubra-FJZS and M. rubra-YNML can be found in Supplementary Tables S2, S3.
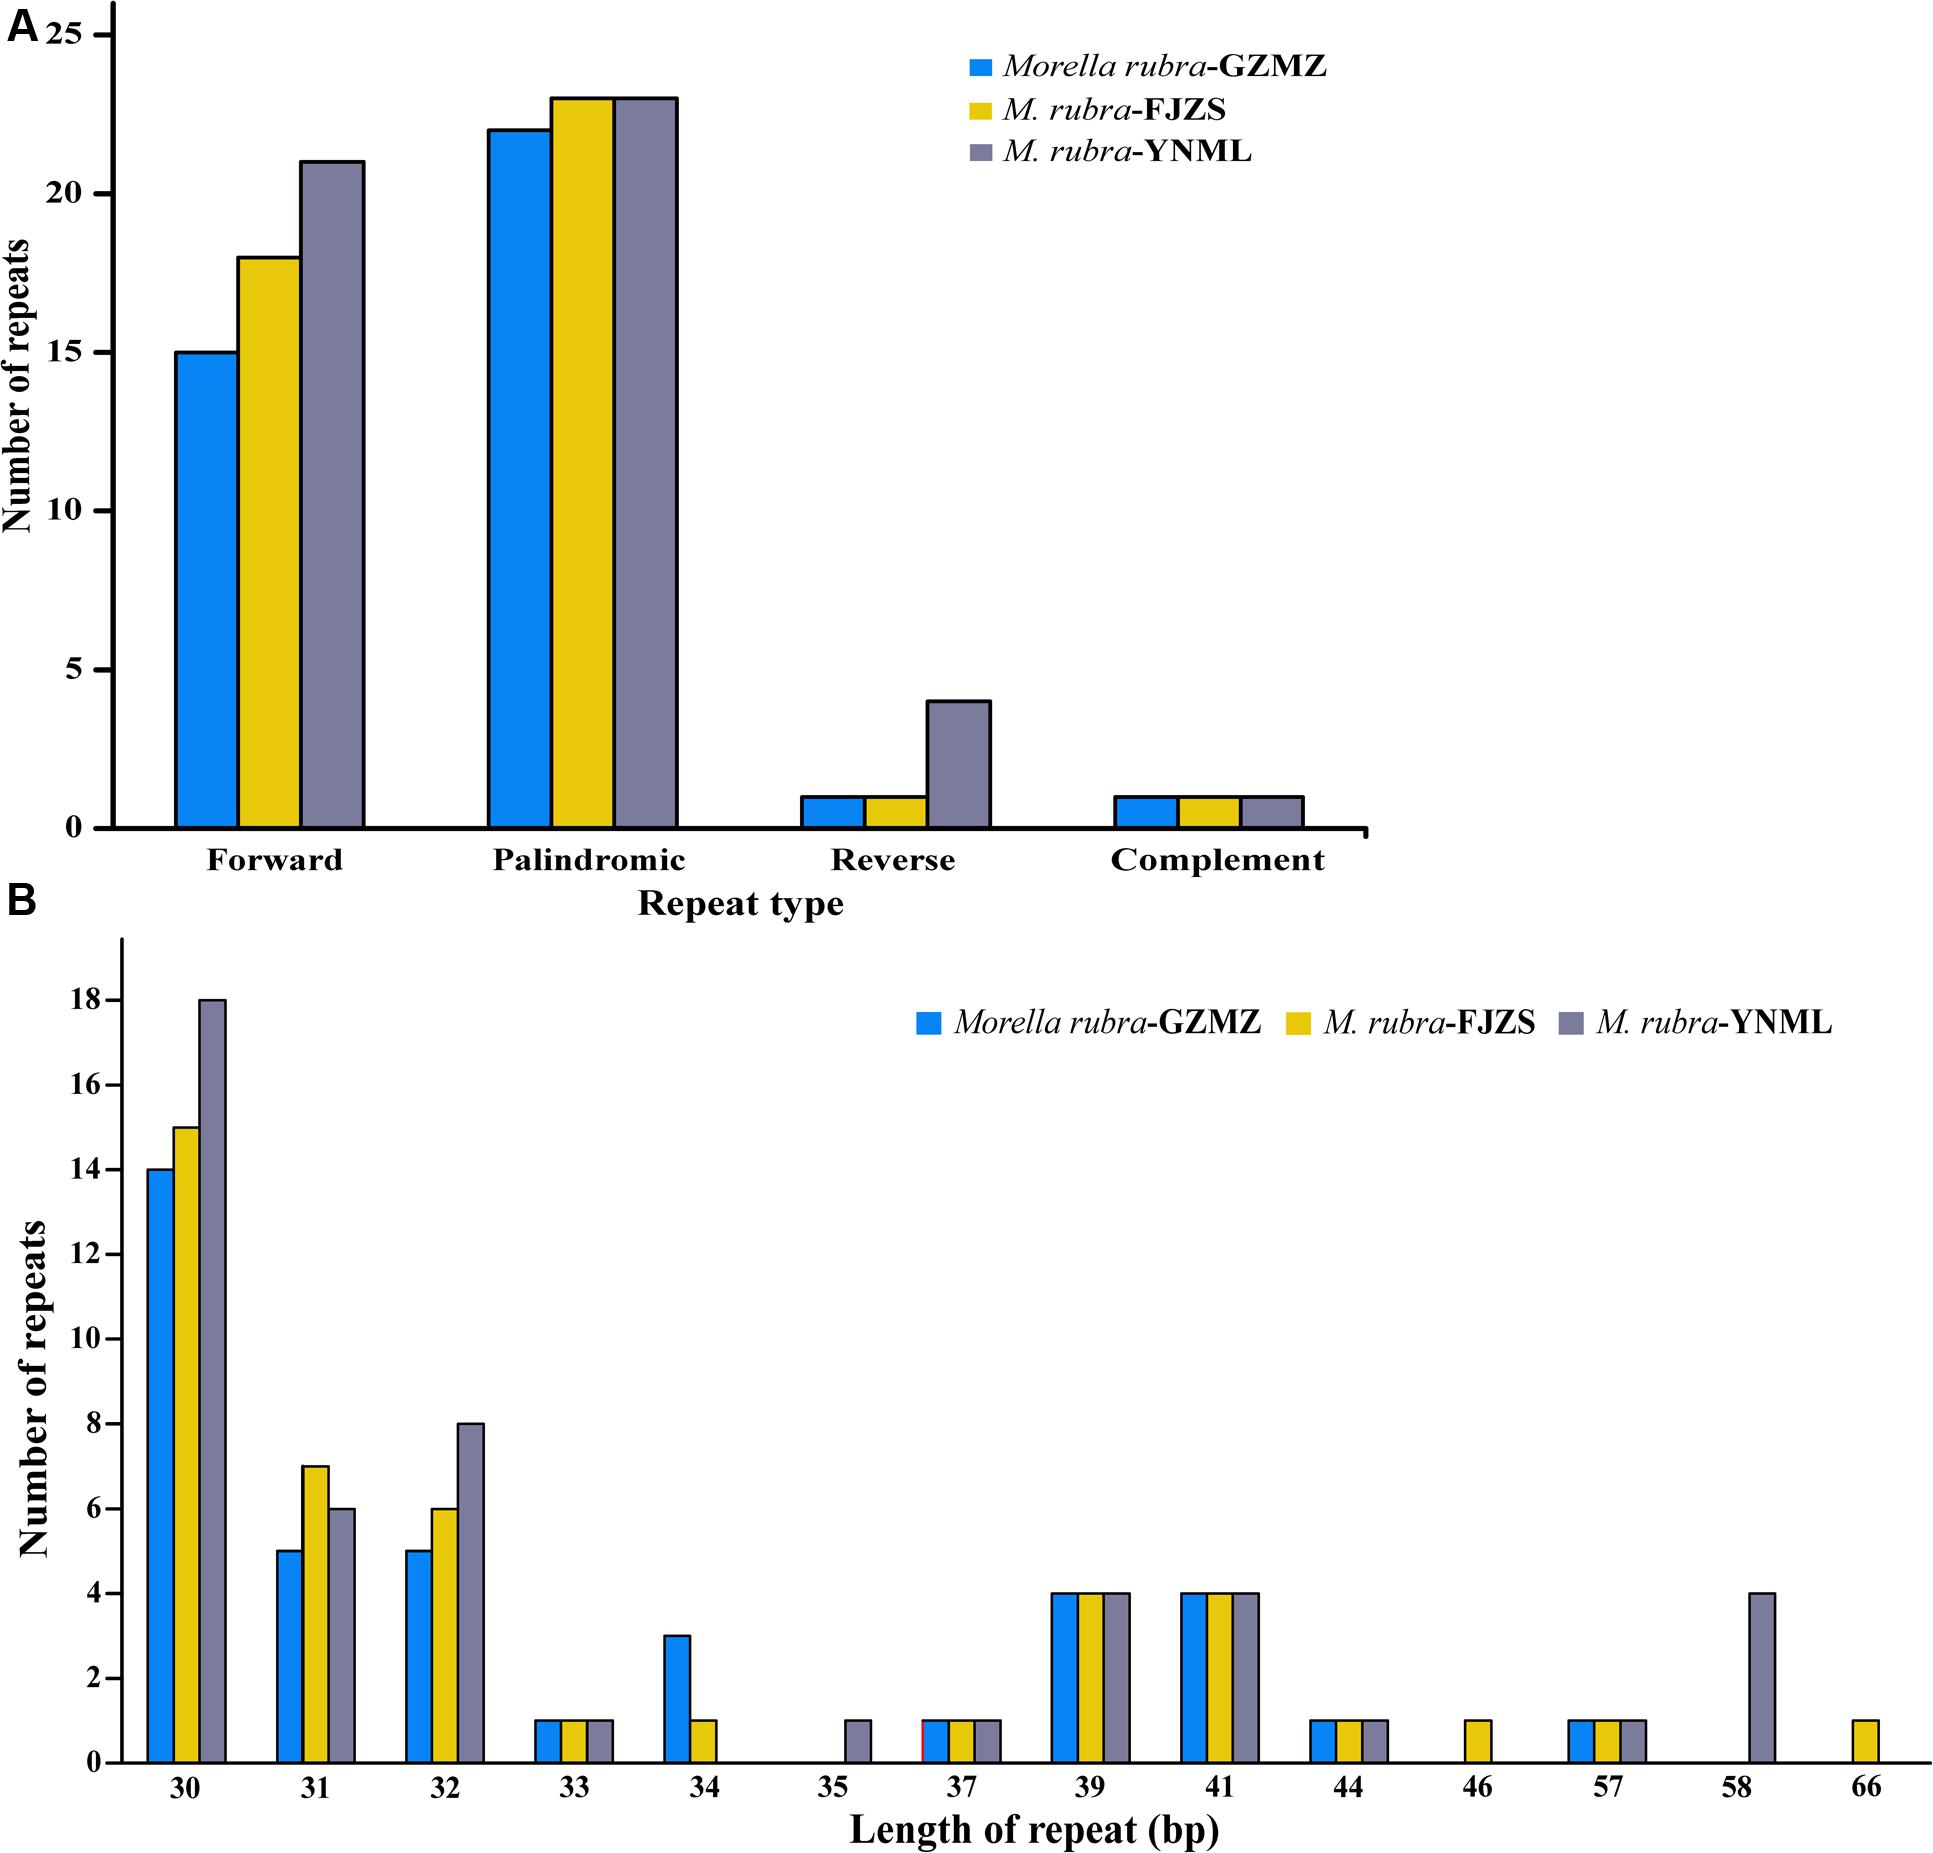
FIGURE 4. Analysis of repeated sequences in the three M. rubra chloroplast genomes. (A) Frequency of repeat types. (B) Frequency of repeats by length.
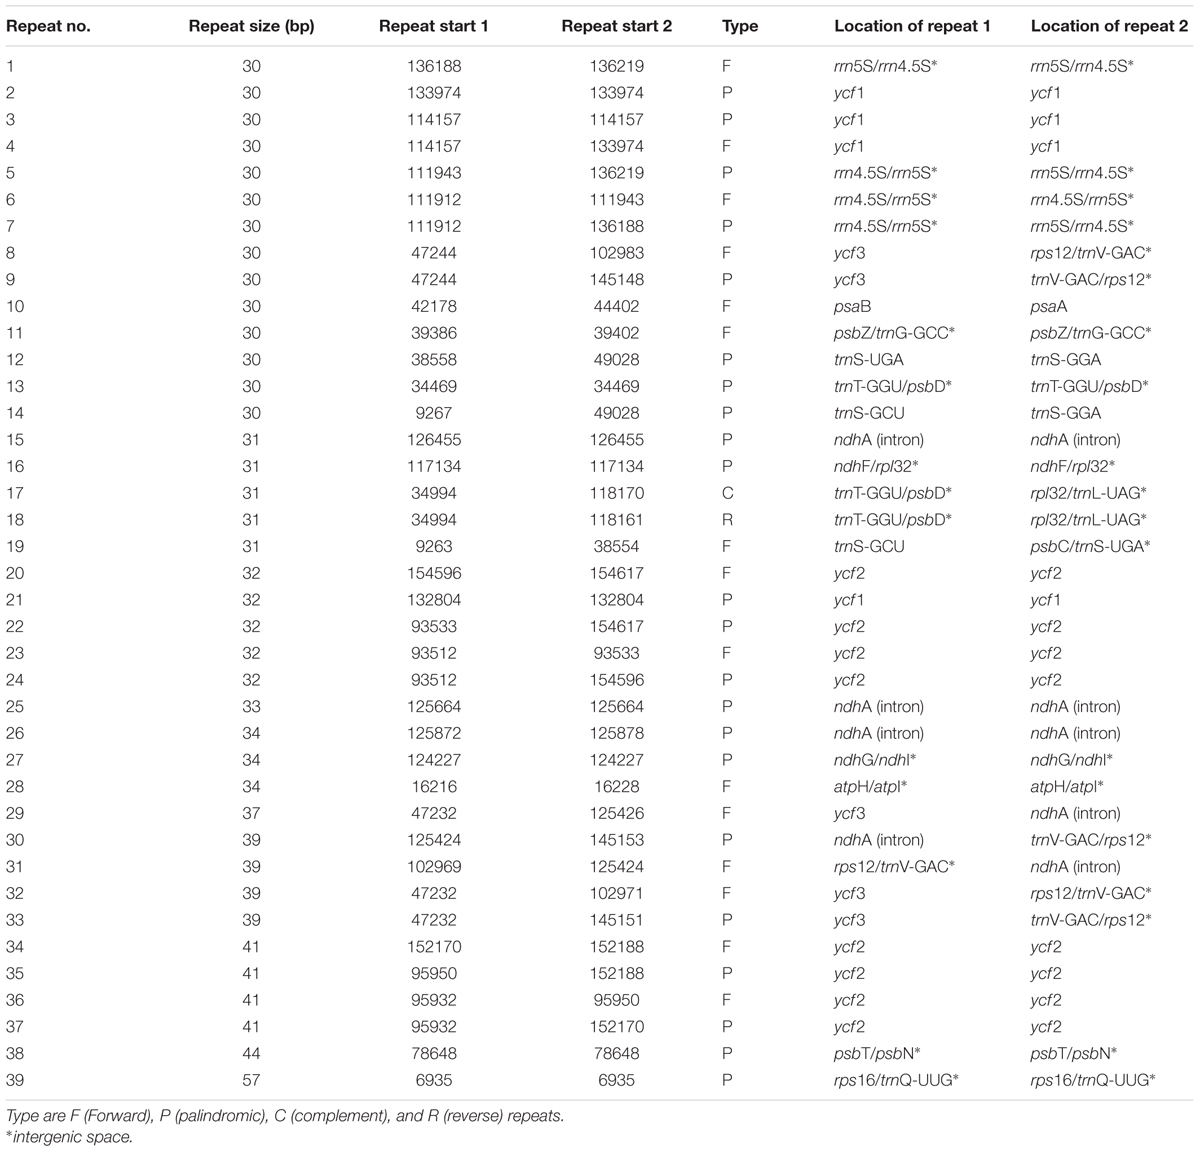
TABLE 3. Repeated sequences in the M. rubra-GZMZ chloroplast genome.
Simple sequence repeats (SSR), also known as microsatellites, are widely distributed over the genome (Chen et al., 2015) and have a high degree of polymorphism (Weber, 1990). As a result, SSRs are widely used as a molecular marker for breeding (Rafalski and Tingey, 1993), population genetics (Perdereau et al., 2014), genetic linkage map construction, and gene mapping (Pugh et al., 2004). In the current study, the distribution, type and presence of microsatellites were studied among the cp genomes of three M. rubra accessions. We did this, in part, because we are interested in developing markers that may be useful in future studies that will address intraspecific variation among natural populations and cultivars of M. rubra across East Asia. A total of 155 perfect microsatellites were identified in the M. rubra-GZMZ cp genome. Among them, 118 were located in the LSC regions, whereas 16 and 21 were found in the IR and SSC regions, respectively (Figure 5A). In addition, 22 SSRs were found in the protein-coding regions, 16 were in the introns and 117 were in intergenic spacers of the M. rubra-GZMZ cp genome (Figure 5B). The distribution and type of microsatellites of M. rubra-FJZS and M. rubra-YNML is shown in Supplementary Figure S1. Among these SSRs, 131 are mononucleotides, 18 are dinucleotides, five are tetranucleotides, and one is a pentanucleotide (Figure 5C). Trinucleotide SSRs are not found in M. rubra-GZMZ or M. rubra-YNML but were detected in M. rubra-FJZS. A majority of the mononucleotides (98.47%) are composed of A/T and most of the dinucleotides (88.89%) are composed of AT/TA (Figure 5C). These results are consistent with the contention that cp SSRs are generally composed of short polyA or polyT repeats (Kuang et al., 2011; Chen et al., 2015). The higher A/T content in cp SSRs also contributes to a bias in base composition, resulting in A/T enrichment (63.9%) in the M. rubra-GZMZ cp genome.
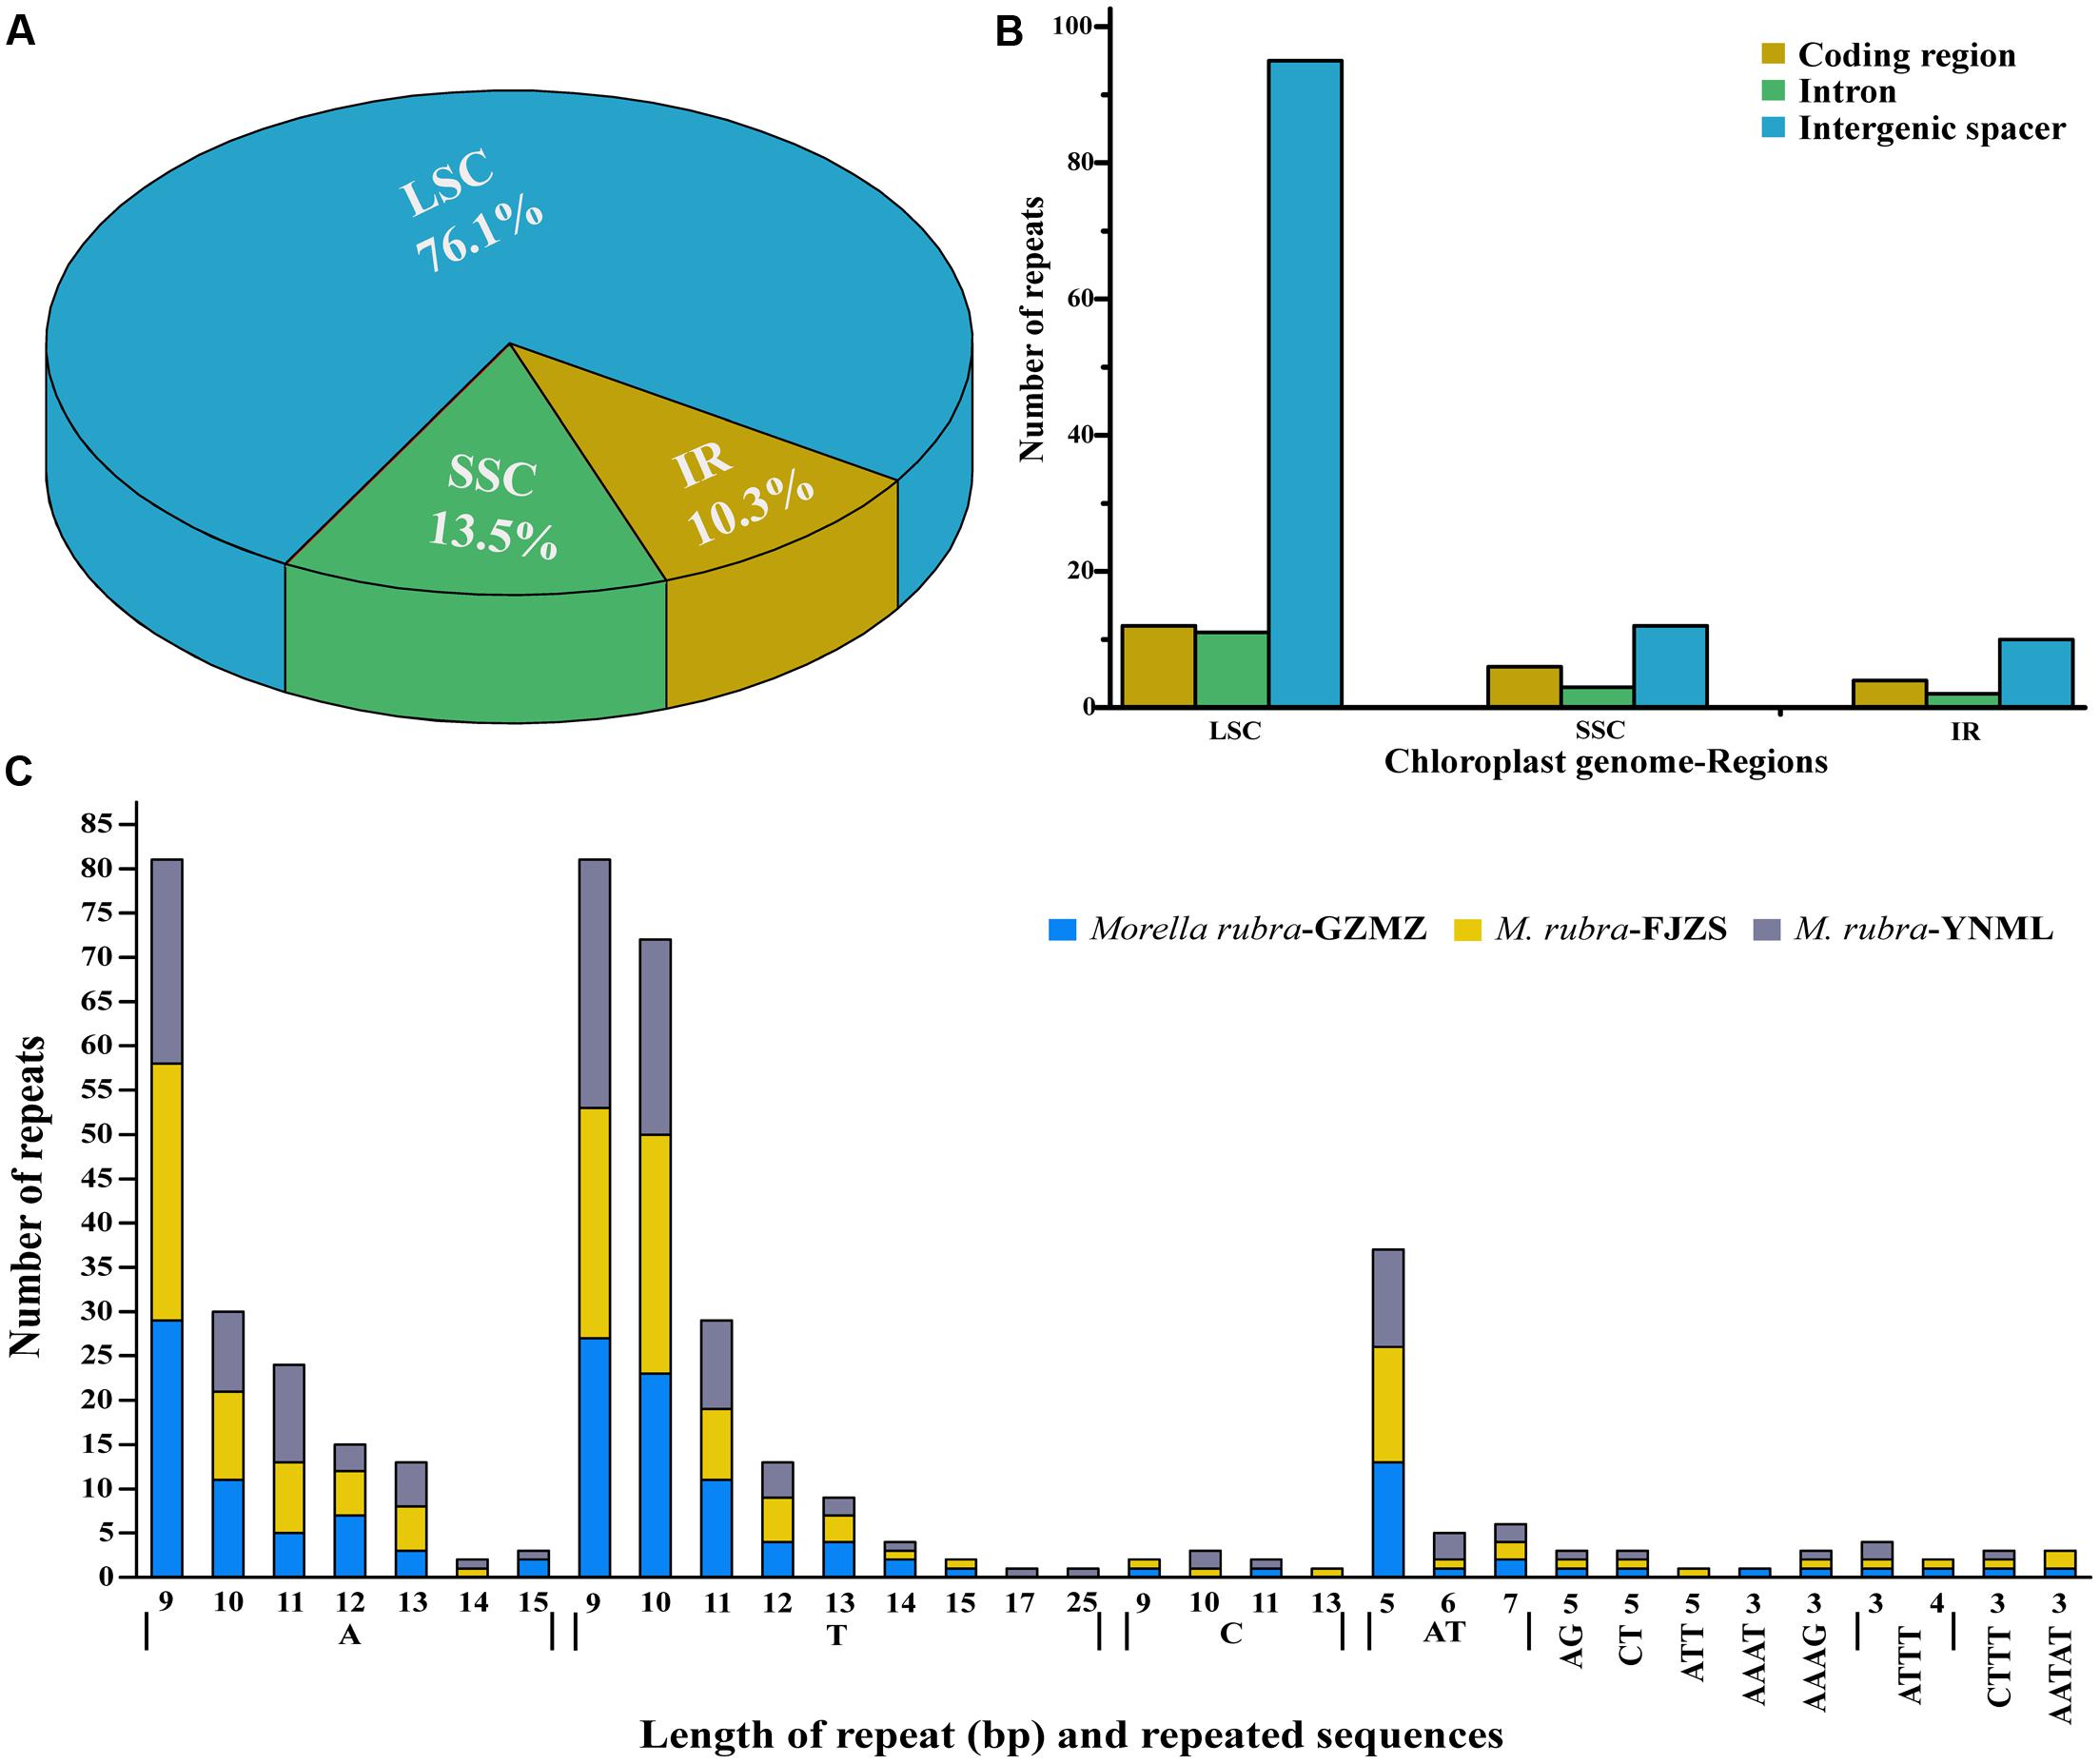
FIGURE 5. The distribution, type, and presence of simple sequence repeats (SSRs) in the cp genome of M. rubra. (A) Presence of SSRs in the LSC, SSC, and IR regions (M. rubra-GZMZ). (B) Presence of SSRs in the protein-coding regions, intergenic spacers and introns of LSC, SSC, and IR regions (M. rubra-GZMZ). (C) Presence of polymers in the cp genome of M. rubra.
The coding genes, non-coding regions and intron regions were compared among the three individuals of M. rubra divergence hotspots. We generated 90 loci (28 coding genes, 52 intergenic spacers, and 10 intron regions) with more than 200 bp in length from three M. rubra individuals and the nucleotide variability (Pi) values calculated with the DnaSP v5.0 software.
Among the values received from the three individuals of M. rubra (M. rubra-GZMZ, M. rubra-FJZS, and M. rubra-YNML) ranged from 0.00029 (ycf2 gene) to 0.01867 (psbA-trnK region) (Figure 6). The IR region is much more conserved than the LSC and SSC regions, and the lower sequence divergence observed in the IRs compared to the SSC or LSC regions for Morella species and other angiosperms is likely due to copy correction between IR sequences by gene conversion (Khakhlova and Bock, 2006; Lu R. et al., 2016). Seven of these variable loci, including trnH-psbA, psbA-trnK, rps2-rpoC2, ycf4-cemA, petD-rpoA, ndhE-ndhG, and ndhA intron, showed high levels of variation. Five of them (trnH-psbA, psbA-trnK, rps2-rpoC2, ycf4-cemA, and petD-rpoA) are located in the LSC, whereas two (ndhE-ndhG and ndhA intron) are in the SSC region (Figure 6).
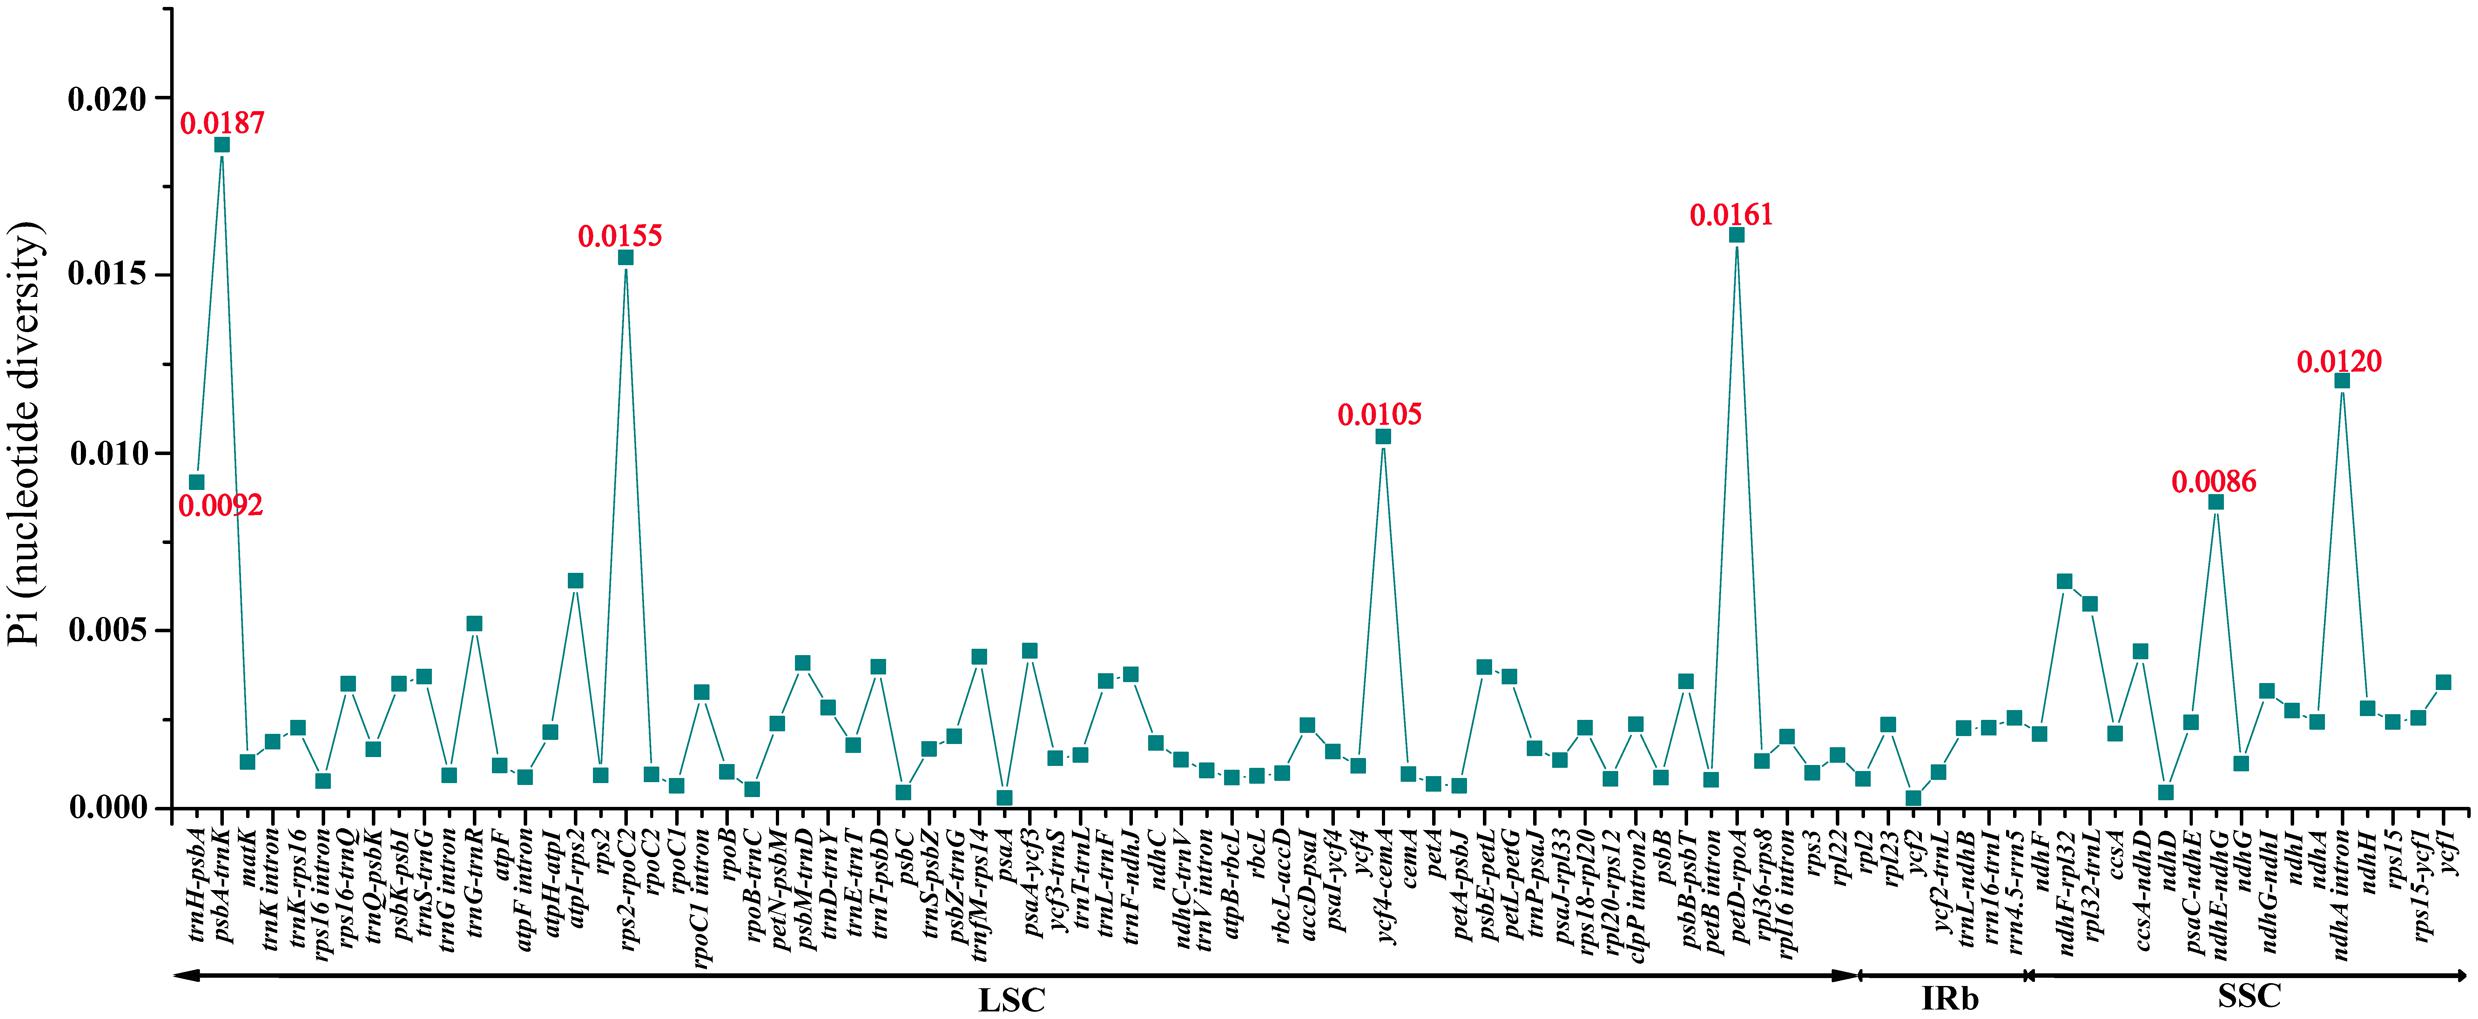
FIGURE 6. Comparative analysis of the nucleotide variability (Pi) values among three M. rubra individuals.
All seven of these variable loci (trnH-psbA, psbA-trnK, rps2-rpoC2, ycf4-cemA, petD-rpoA, ndhE-ndhG, and ndhA intron) show great potential as highly informative phylogenetic markers in M. rubra. The results presented here will be helpful to the study on the domestication origin of Chinese bayberry in the future.
Synonymous (KS) and Non-synonymous (KA) Substitution Rate Analysis
Nonsynonymous (KA) and synonymous (KS) substitutions and their ratio (KA/KS) are important to indicate the rates of evolution and natural selection (Yang and Nielsen, 2000). Synonymous nucleotide substitutions have occurred more frequently than nonsynonymous substitutions, and the KA/KS value is usually less than one in most protein-coding regions (Makalowski and Boguski, 1998). In this study, these parameters were compared among the protein-coding chloroplast genes of the four-representative species of Fagales to investigate genome evolution, with the cp genome of Cucumis sativus as a reference (Table 4). The KA values of the four-representative species ranged from 0.0879 to 0.0962, as well as the KS values ranged from 0.01489 to 0.01605. Both the KA and KS values consistently indicated that Castanea mollissima has evolved a little rapidly than the other three species in Fagales. The KA/KS values of these Fagales species are less than 1, providing the evidence of purifying selection on the chloroplast protein-coding genes of Fagales species.
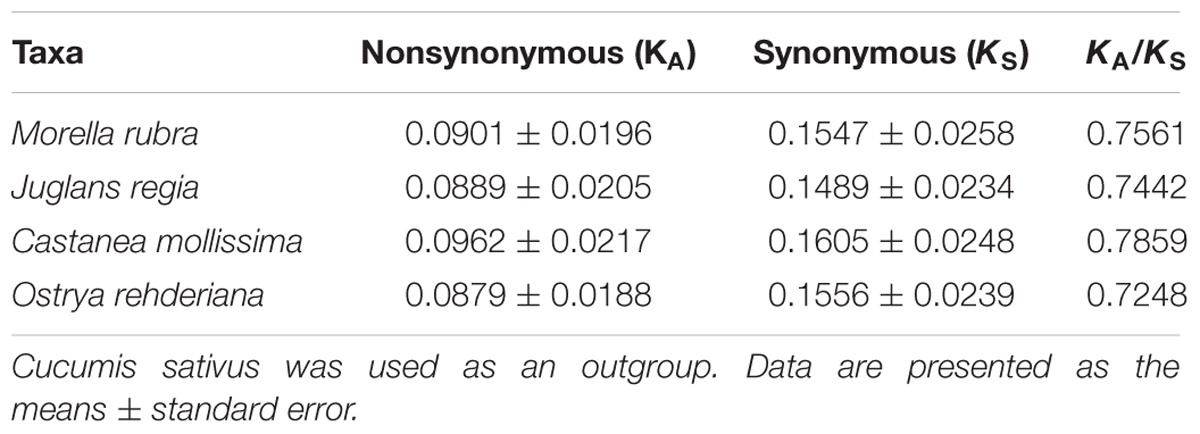
TABLE 4. Substitution rates of 75 protein-coding genes in four Fagales chloroplast genomes.
Variations in evolutionary rates can be related to the function of genes and genome structure (Chang et al., 2006; Jansen et al., 2007; Dong et al., 2013). In Fagales species, the four-sampled genome structure are quite conserved, without any remarkable restructuring being detected. Comparing with the outgroup Cucumis sativus, the KA (F = 293.17, P < 0.001) and KS (F = 245.86, P < 0.001) values shown differ significantly among gene groups classified according to gene functions (Figure 7). The psb, pet, and rbcL genes show the lowest KA values, while the ycf1 gene exhibits the highest KA values. Moreover, the psa gene shows the lowest KS values, whereas ccsA gene exhibits the highest KS values. According to the KA/KS values, we found that the psa, rpo, atp, clpP, and ycf1 genes are under positive selection in Fagales.
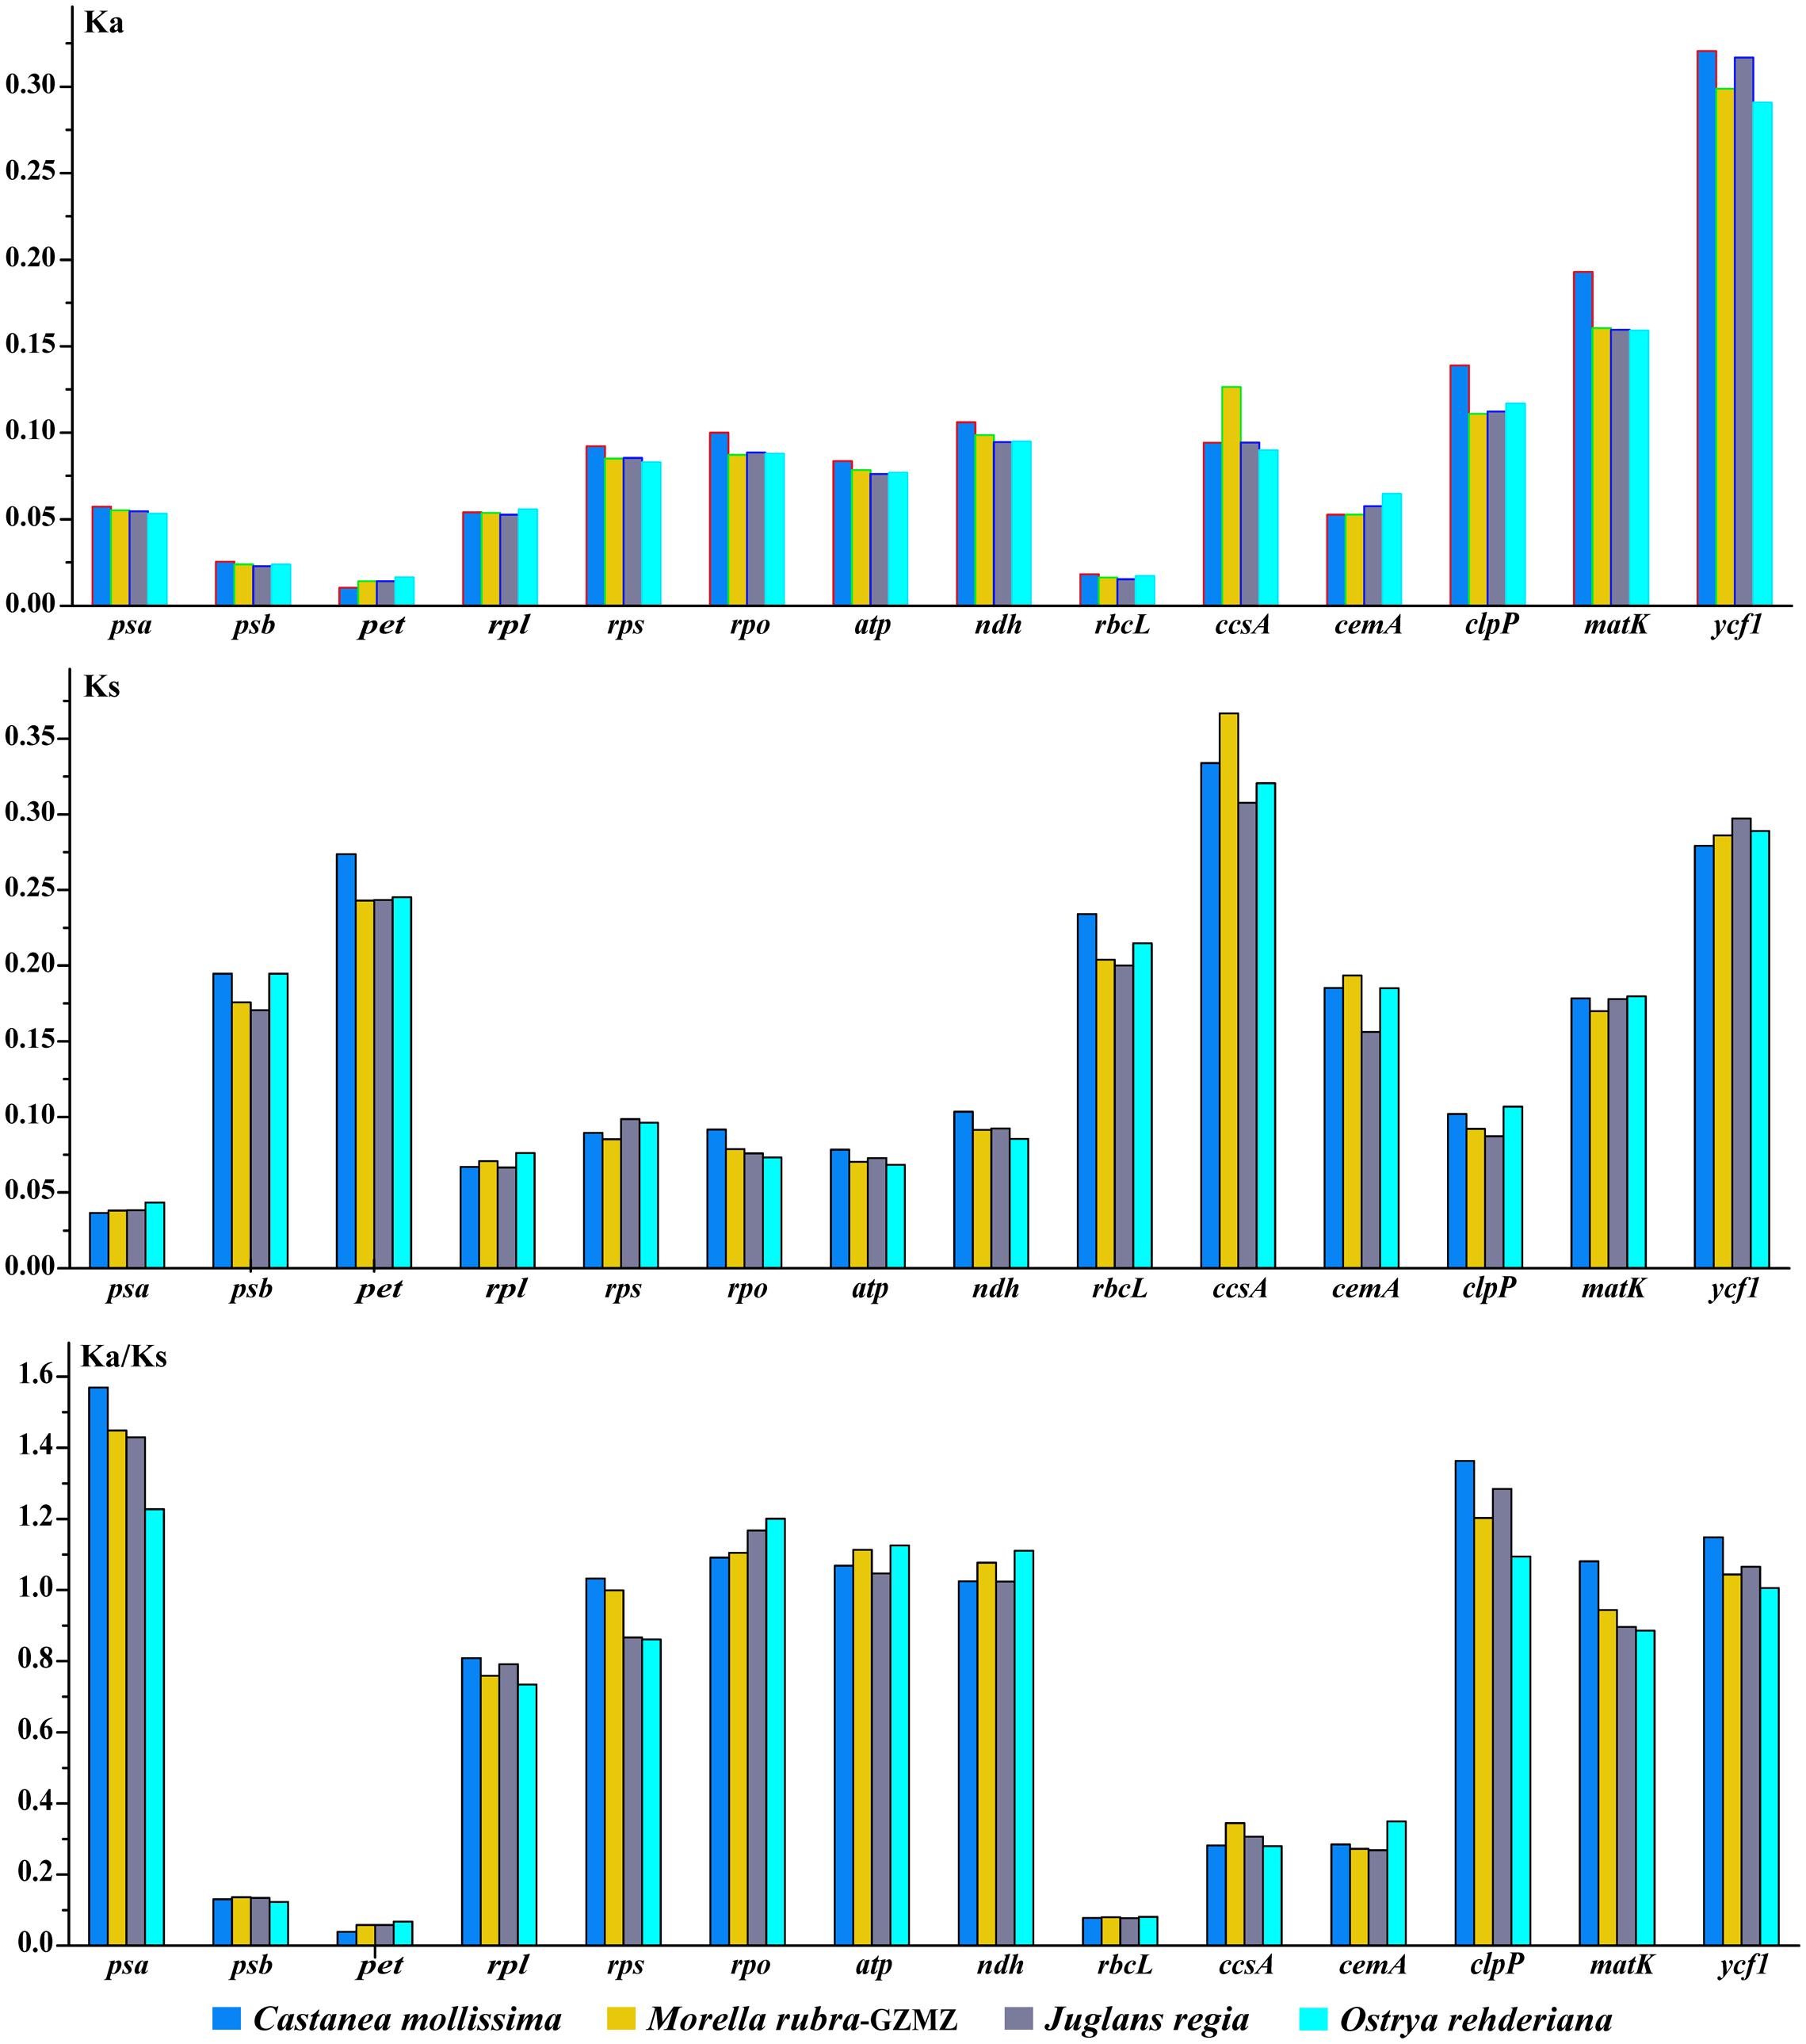
FIGURE 7. Non-synonymous substitution (KA), synonymous substitution (KS), and KA/KS values for individual Fagales genes and groups of genes. The rpl22 is not included in the rpl group due to its pseudogenization in some species.
Phylogeny Inference
Relationships within Fagales are fairly well resolved in previously published studies, but the position of Myricaceae still remains somewhat uncertain (Manos and Steele, 1997; Cook and Crisp, 2005; Li et al., 2016). Most of these earlier studies have used sequences from only one or more chloroplast loci. In the present study, we explored two datasets: the complete chloroplast genome and a restricted matrix of 69 commonly shared protein-coding genes to perform phylogenetic analysis. For the analysis with the complete chloroplast genome data, the tree topologies from both the ML and the Bayesian analysis were found to be consistent with each other (Figure 8). All the analyzed families within Fagales have MLBS = 100%. Fagaceae are sister to the remaining Fagales (MLBS = 100%), followed by Betulaceae, which are subsequently sister to the remainder of the Fagales, with full support (MLBS = 100%). The remaining two families, Juglandaceae and Myricaceae, form one clade with BS = 100%, as well as the three Myricaceae individuals forming one clade with MLBS = 100%. The relationships among them are identical with the system of classification proposed by APG III (APG III, 2009).
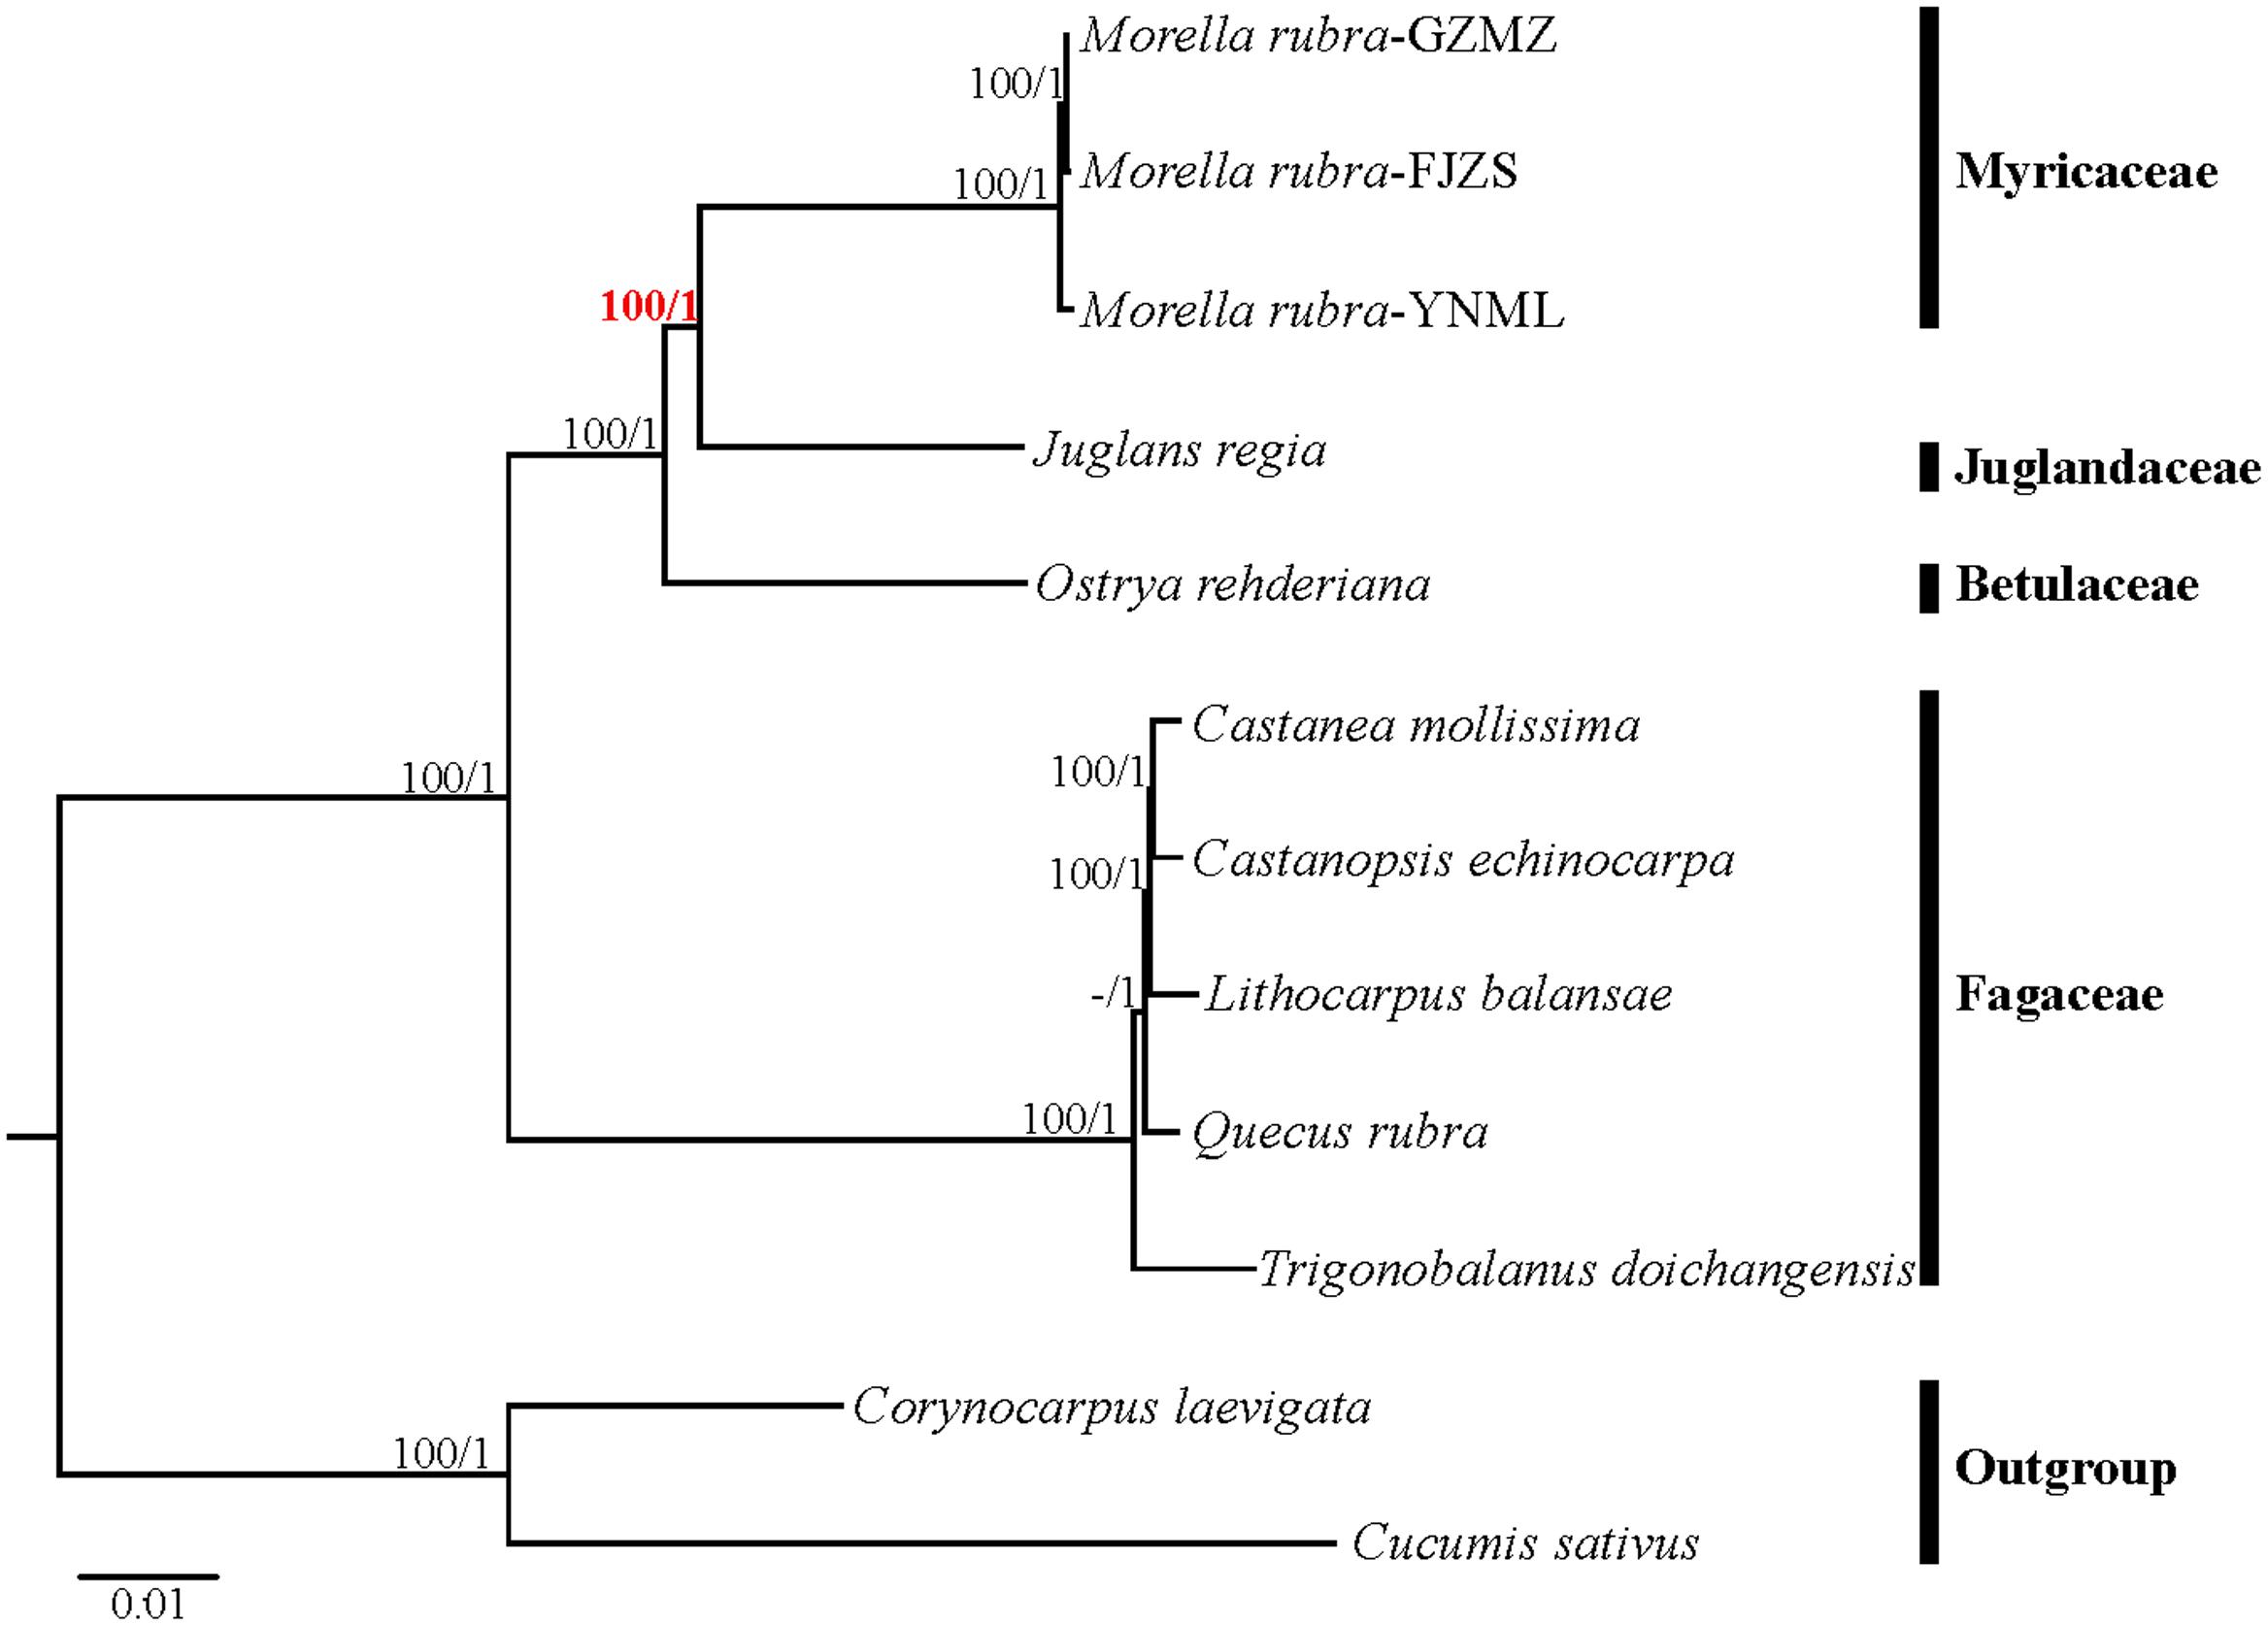
FIGURE 8. Phylogenetic tree reconstruction of Fagales using maximum likelihood (ML) based on whole chloroplast genome sequences. Relative branch lengths are indicated. Numbers above the lines represent ML bootstrap values / BI posterior probability. The hyphen indicates that a ML bootstrap <50%. A phylogenetic tree resulting from analysis of 69 protein-coding genes was fully congruent with this topology.
Most phylogenomic studies have not used entire plastome sequences, but rather have used a subset of common protein coding genes (Jansen et al., 2007; Moore et al., 2010; Xi et al., 2012). In this study, the tree topologies inferred from ML and BI using a restricted cp gene matrix were consistent with the trees inferred from the whole cp genome data (Supplementary Figure S2), but the support values for some nodes in the phylogenetic trees were lower. In this study, we proved that complete chloroplast DNA sequences were more effective than common protein coding genes for the phylogenetic reconstruction of Fagales, as evaluated by higher bootstrap values and posterior probabilities. Therefore, we suggest that complete chloroplast genomes should be used more regularly for inferring the backbone relationships among other ordinal clades of angiosperms, as well as for resolving the phylogenetic position of various questionable lineages.
Conclusion
The complete chloroplast genome sequence of M. rubra, was determined using Illumina next-generation DNA sequencing technology. This is the first chloroplast genome sequenced in the Myricaceae family. The chloroplast genome of M. rubra shows a very similar size and organization comparing with the other sequenced angiosperms. The chloroplast genomes of Fagales species have experienced evolution at the gene level, rather than the genome level, because no significant structural changes are detected among their genomes. In addition, the examined genomes differ in size, and the detected genome size variations are mainly due to the length of intergenic spacers, instead of gene losses, gene pseudogenization, IR expansion or contraction. Inferred phylogenetic relationships based on the compete genome sequences from representatives of Fagales strongly support the placement of Myricaceae as sister to Juglandaceae. Furthermore, seven variable regions (trnH-psbA, psbA-trnK, rps2-rpoC2, ycf4-cemA, petD-rpoA, ndhE-ndhG, and ndhA intron) and variable cpSSR loci identified among multiple individuals of M. rubra will be useful in future studies characterizing the population genetics of this species and investigating the domestication origin of Chinese bayberry.
Author Contributions
LL, PL, CF, and XL conceived the ideas; LL and JW contributed to the sampling; LL performed the experiment; LL and RL analyzed the data. The manuscript was written by LL, PL, and KC.
Funding
This work was supported by the Special Fund for Agro-scientific Research in the Public Interest (Grant No. 201203089), and by the NSFC-NSF Dimensions of Biodiversity program (Grant No. 31461123001), the International Cooperation and Exchange of the National Natural Science Foundation of China (Grant Nos. 31511140095, 31561143015), the National Natural Science Foundation of China (Grant No. 31500184).
Conflict of Interest Statement
The authors declare that the research was conducted in the absence of any commercial or financial relationships that could be construed as a potential conflict of interest.
Acknowledgment
We would like to thank Yong-Hua Zhang and Nan Chen for their great help in collecting plant materials.
Supplementary Material
The Supplementary Material for this article can be found online at: http://journal.frontiersin.org/article/10.3389/fpls.2017.00968/full#supplementary-material
FIGURE S1 | The distribution and presence of simple sequence repeats (SSRs) in the cp genome of M.rubra-FJZS (A) and M. rubra-YNML (B).
FIGURE S2 | Phylogenetic tree reconstruction of 12 taxa of Fagales using maximum likelihood (ML) based on the 69 shared protein-coding genes sequences.
Footnotes
References
APG III (2009). An update of the Angiosperm Phylogeny Group classification for the orders and families of flowering plants: APG III. Bot. J. Linn. Soc. 161, 105–121. doi: 10.1016/j.jep.2015.05.035
APG IV (2016). An update of the Angiosperm Phylogeny Group classification for the orders and families of flowering plants: APG IV. Bot. J. Linn. Soc. 181, 1–20. doi: 10.1016/j.jep.2015.05.035
Arroyo-Garcia, R., Ruiz-Garcia, L., Bolling, L., Ocete, R., Lopez, M., Arnold, C., et al. (2006). Multiple origins of cultivated grapevine (Vitis vinifera L. ssp. sativa) based on chloroplast DNA polymorphisms. Mol. Ecol. 15, 3707–3714. doi: 10.1111/j.1365-294X.2006.03049.x
Cavalier-Smith, T. (2002). Chloroplast evolution: secondary symbiogenesis and multiple losses. Curr. Biol. 12, R62–R64. doi: 10.1016/S0960-9822(01)00675-3
Chang, C. C., Lin, H. C., Lin, I. P., Chow, T. Y., Chen, H. H., Chen, W. H., et al. (2006). The chloroplast genome of Phalaenopsis aphrodite (Orchidaceae): comparative analysis of evolutionary rate with that of grasses and its phylogenetic implications. Mol. Biol. Evol. 23, 279–291. doi: 10.1093/molbev/msj029
Chase, M. W., Soltis, D. E., Olmstead, R. G., Morgan, D., Les, D. H., Mishler, B. D., et al. (1993). Phylogenetics of seed plants: an analysis of nucleotide sequences from the plastid gene rbcL. Ann. Mo. Bot. Gard. 80, 528–580. doi: 10.2307/2399846
Chen, J. H., Hao, Z. D., Xu, H. B., Yang, L. M., Liu, G. X., Sheng, Y., et al. (2015). The complete chloroplast genome sequence of the relict woody plant Metasequoia glyptostroboides Hu et Cheng. Front. Plant Sci. 6:447. doi: 10.3389/fpls.2015.00447
Chen, Z. D., Yang, T., Lin, L., Lu, L. M., Li, H. L., Sun, M., et al. (2016). Tree of life for the genera of Chinese vascular plants. J. Syst. Evol. 54, 277–306. doi: 10.1186/s12862-015-0405-2
Cheng, B. B., Zheng, Y. Q., and Sun, Q. W. (2015). Genetic diversity and population structure of Taxus cuspidata in the Changbai Mountains assessed by chloroplast DNA sequences and microsatellite markers. Biochem. Syst. Ecol. 63, 157–164. doi: 10.1016/j.bse.2015.10.009
Cho, K. S., Yun, B. K., Yoon, Y. H., Hong, S. Y., Mekapogu, M., Kim, K. H., et al. (2015). Complete chloroplast genome sequence of tartary buckwheat (Fagopyrum tataricum) and comparative analysis with common buckwheat (F. esculentum). PLoS ONE 10:e0125332. doi: 10.1371/journal.pone.0125332
Choi, K. S., Chung, M. G., and Park, S. (2016). The complete chloroplast genome sequences of three Veroniceae Species (Plantaginaceae): comparative analysis and highly divergent regions. Front. Plant Sci. 7:355. doi: 10.3389/fpls.2016.00355
Cook, L. G., and Crisp, M. D. (2005). Not so ancient: the extant crown group of Nothofagus represents a post-Gondwanan radiation. Proc. R. Soc. Lond. B Biol. Sci. 272, 2535–2544. doi: 10.1098/rspb.2005.3219
Cronquist, A. (1988). The Evolution and Classification of Flowering Plants, 2nd Edn. New York, NY: The New York Botanical Garden.
Daniell, H., Lee, S. B., Grevich, J., Saski, C., Quesada-Vargas, T., Guda, C., et al. (2006). Complete chloroplast genome sequences of Solanum bulbocastanum, Solanum lycopersicum and comparative analyses with other Solanaceae genomes. Theor. Appl. Genet. 112, 1503–1518. doi: 10.1007/s00122-006-0254-x
De Las Rivas, J., Lozano, J. J., and Ortiz, A. R. (2002). Comparative analysis of chloroplast genomes: functional annotation, genome-based phylogeny, and deduced evolutionary patterns. Genome Res. 12, 567–583. doi: 10.1101/gr.209402
Delplancke, M., Alvarez, N., Benoit, L., Espindola, A., Joly, H., Neuenschwander, S., et al. (2013). Evolutionary history of almond tree domestication in the Mediterranean basin. Mol. Ecol. 22, 1092–1104. doi: 10.1111/mec.12129
Dong, W., Xu, C., Cheng, T., Lin, K., and Zhou, S. (2013). Sequencing angiosperm plastid genomes made easy: a complete set of universal primers and a case study on the phylogeny of saxifragales. Genome Biol. Evol. 5, 989–997. doi: 10.1093/gbe/evt063
Drouin, G., Daoud, H., and Xia, J. (2008). Relative rates of synonymous substitutions in the mitochondrial, chloroplast and nuclear genomes of seed plants. Mol. Phylogenet. Evol. 49, 827–831. doi: 10.1016/j.ympev.2008.09.009
Faircloth, B. C. (2008). Msatcommander: detection of microsatellite repeat arrays and automated, locus-specific primer design. Mol. Ecol. Resour. 8, 92–94. doi: 10.1111/j.1471-8286.2007.01884.x
Frazer, K. A., Pachter, L., Poliakov, A., Rubin, E. M., and Dubchak, I. (2004). VISTA: computational tools for comparative genomics. Nucleic Acids Res. 32, W273–W279. doi: 10.1093/nar/gkh458
Greiner, S., Wang, X., Herrmann, R. G., Rauwolf, U., Mayer, K., Haberer, G., et al. (2008a). The complete nucleotide sequences of the 5 genetically distinct plastid genomes of Oenothera, subsection Oenothera: II. A microevolutionary view using bioinformatics and formal genetic data. Mol. Biol. Evol. 25, 2019–2030. doi: 10.1093/molbev/msn149
Greiner, S., Wang, X., Rauwolf, U., Silber, M. V., Mayer, K., Meurer, J., et al. (2008b). The complete nucleotide sequences of the five genetically distinct plastid genomes of Oenothera, subsection Oenothera: I. Sequence evaluation and plastome evolution. Nucleic Acids Res. 36, 2366–2378. doi: 10.1093/nar/gkn081
Hollingsworth, P. M., Graham, S. W., and Little, D. P. (2011). Choosing and using a plant DNA barcode. PLoS ONE 6:e19254. doi: 10.1371/journal.pone.0019254
Jansen, R. K., Cai, Z., Raubeson, L. A., Daniell, H., Leebens-Mack, J., Müller, K. F., et al. (2007). Analysis of 81 genes from 64 plastid genomes resolves relationships in angiosperms and identifies genome-scale evolutionary patterns. Proc. Natl. Acad. Sci. U.S.A. 104, 19369–19374. doi: 10.1073/pnas.0709121104
Jansen, R. K., Raubeson, L. A., Boore, J. L., Chumley, T. W., Haberle, R. C., Wyman, S. K., et al. (2005). Methods for obtaining and analyzing whole chloroplast genome sequences. Methods Enzymol. 395, 348–384. doi: 10.1016/S0076-6879(05)95020-9
Jansen, R. K., Saski, C., Lee, S. B., Hansen, A. K., and Daniell, H. (2011). Complete plastid genome sequences of three Rosids (Castanea, Prunus, Theobroma): evidence for at least two independent transfers of rpl22 to the nucleus. Mol. Biol. Evol. 28, 835–847. doi: 10.1093/molbev/msq261
Katoh, K., Misawa, K., Kuma, K. I., and Miyata, T. (2002). MAFFT: a novel method for rapid multiple sequence alignment based on fast Fourier transform. Nucleic Acids Res. 30, 3059–3066. doi: 10.1093/nar/gkf436
Khakhlova, O., and Bock, R. (2006). Elimination of deleterious mutations in plastid genomes by gene conversion. Plant J. 46, 85–94. doi: 10.1111/j.1365-313X.2006.02673.x
Kuang, D. Y., Wu, H., Wang, Y. L., Gao, L. M., Zhang, S. Z., and Lu, L. (2011). Complete chloroplast genome sequence of Magnolia kwangsiensis (Magnoliaceae): implication for DNA barcoding and population genetics. Genome 54, 663–673. doi: 10.1139/G11-026
Kurtz, S., and Schleiermacher, C. (1999). REPuter: fast computation of maximal repeats in complete genomes. Bioinformatics 15, 426–427. doi: 10.1093/bioinformatics/15.5.426
Larson-Johnson, K. (2016). Phylogenetic investigation of the complex evolutionary history of dispersal mode and diversification rates across living and fossil Fagales. New Phytol. 209, 418–435. doi: 10.1111/nph.13570
Lee, H. L., Jansen, R. K., Chumley, T. W., and Kim, K. J. (2007). Gene relocations within chloroplast genomes of Jasminum and Menodora (Oleaceae) are due to multiple, overlapping inversions. Mol. Biol. Evol. 24, 1161–1180. doi: 10.1093/molbev/msm036
Li, H. L., Wang, W., Li, R. Q., Zhang, J. B., Sun, M., Naeem, R., et al. (2016). Global versus Chinese perspectives on the phylogeny of the N-fixing clade. J. Syst. Evol. 54, 392–399. doi: 10.1111/jse.12201
Li, N., Huang, W., Shi, Q., Zhang, Y., and Song, L. (2013). A CTAB-assisted hydrothermal synthesis of VO2(B) nanostructures for lithium-ion battery application. Ceram. Int. 39, 6199–6206. doi: 10.1016/j.ceramint.2013.01.039
Li, R., Chen, Z., Hong, Y., and Lu, A. (2002). Phylogenetic relationships of the “higher” hamamelids based on chloroplast trnL-F sequences. Acta Bot. Sin. 44, 1462–1468.
Li, R. Q., Chen, Z. D., Lu, A. M., Soltis, D. E., Soltis, P. S., and Manos, P. S. (2004). Phylogenetic relationships in Fagales based on DNA sequences from three genomes. Int. J. Plant Sci. 165, 311–324. doi: 10.1086/381920
Librado, P., and Rozas, J. (2009). DnaSP v5: a software for comprehensive analysis of DNA polymorphism data. Bioinformatics 25, 1451–1452. doi: 10.1093/bioinformatics/btp187
Lohse, M., Drechsel, O., Kahlau, S., and Bock, R. (2013). OrganellarGenomeDRAW–a suite of tools for generating physical maps of plastid and mitochondrial genomes and visualizing expression data sets. Nucleic Acids Res. 41, W575–W581. doi: 10.1093/nar/gkt289
Londo, J. P., Chiang, Y. C., Hung, K. H., Chiang, T. Y., and Schaal, B. A. (2006). Phylogeography of Asian wild rice, Oryza rufipogon, reveals multiple independent domestications of cultivated rice, Oryza sativa. Proc. Natl. Acad. Sci. U.S.A. 103, 9578–9583. doi: 10.1073/pnas.0603152103
Lu, A., and Bornstein, A. (1999). “Myricaceae,” in Cycadaceae through Fagaceae, Vol. 4, eds Z. Wu and P. Raven (Beijing: Science Press), 275–276.
Lu, R., Li, P., and Qiu, Y. (2016). The complete chloroplast genomes of three Cardiocrinum (Liliaceae) species: comparative genomic and phylogenetic analyses. Front. Plant Sci. 7:2054. doi: 10.3389/fpls.2016.02054
Lu, S., Hou, M., Du, F. K., Li, J., and Yin, K. (2016). Complete chloroplast genome of the Oriental white oak: Quercus aliena Blume. Mitochondrial DNA A 27, 2802–2804. doi: 10.3109/19401736.2015.1053074
Makalowski, W., and Boguski, M. S. (1998). Evolutionary parameters of the transcribed mammalian genome: an analysis of 2,820 orthologous rodent and human sequences. Proc. Natl. Acad. Sci. U.S.A. 95, 9407–9412. doi: 10.1073/pnas.95.16.9407
Manos, P., and Steele, K. (1997). Phylogenetic analyses of ”higher” Hamamelididae based on plastid sequence data. Am. J. Bot. 84, 1407–1407. doi: 10.2307/2446139
Manos, P. S., Nixon, K. C., and Doyle, J. J. (1993). Cladistic analysis of restriction site variation within the chloroplast DNA inverted repeat region of selected Hamamelididae. Syst. Bot. 18, 551–562. doi: 10.2307/2419533
Millen, R. S., Olmstead, R. G., Adams, K. L., Palmer, J. D., Lao, N. T., Heggie, L., et al. (2001). Many parallel losses of infA from chloroplast DNA during angiosperm evolution with multiple independent transfers to the nucleus. Plant Cell 13, 645–658. doi: 10.1105/tpc.13.3.645
Miller, M. A., Pfeiffer, W., and Schwartz, T. (2010). “Creating the CIPRES Science Gateway for inference of large phylogenetic trees,” in Proceedings of the Gateway Computing Environments Workshop (GCE), New Orleans, LA, 1–8. doi: 10.1109/gce.2010.5676129
Moore, M. J., Bell, C. D., Soltis, P. S., and Soltis, D. E. (2007). Using plastid genome-scale data to resolve enigmatic relationships among basal angiosperms. Proc. Natl. Acad. Sci. U.S.A. 104, 19363–19368. doi: 10.1073/pnas.0708072104
Moore, M. J., Soltis, P. S., Bell, C. D., Burleigh, J. G., and Soltis, D. E. (2010). Phylogenetic analysis of 83 plastid genes further resolves the early diversification of eudicots. Proc. Natl. Acad. Sci. U.S.A. 107, 4623–4628. doi: 10.1073/pnas.0907801107
Neuhaus, H., and Emes, M. (2000). Nonphotosynthetic metabolism in plastids. Annu. Rev. Plant Biol. 51, 111–140. doi: 10.1146/annurev.arplant.51.1.111
Nie, X., Lv, S., Zhang, Y., Du, X., Wang, L., Biradar, S. S., et al. (2012). Complete chloroplast genome sequence of a major invasive species, crofton weed (Ageratina adenophora). PLoS ONE 7:e36869. doi: 10.1371/journal.pone.0036869
Palmer, J. D. (1991). Plastid chromosomes: structure and evolution. Mol. Biol. Plastids 7, 5–53. doi: 10.1016/B978-0-12-715007-9.50009-8
Peng, S., Yang, G., Liu, C., Yu, Z., and Zhai, M. (2015). The complete chloroplast genome of the Juglans regia (Juglandales: Julandaceae). Mitochondrial DNA 28, 407–408. doi: 10.3109/19401736.2015.1127367
Perdereau, A. C., Kelleher, C. T., Douglas, G. C., and Hodkinson, T. R. (2014). High levels of gene flow and genetic diversity in Irish populations of Salix caprea L. inferred from chloroplast and nuclear SSR markers. BMC Plant Biol. 14:202. doi: 10.1186/s12870-014-0202-x
Posada, D. (2008). jModelTest: phylogenetic model averaging. Mol. Biol. Evol. 25, 1253–1256. doi: 10.1093/molbev/msn083
Pugh, T., Fouet, O., Risterucci, A., Brottier, P., Abouladze, M., Deletrez, C., et al. (2004). A new cacao linkage map based on codominant markers: development and integration of 201 new microsatellite markers. Theor. Appl. Genet. 108, 1151–1161. doi: 10.1007/s00122-003-1533-4
Rafalski, J. A., and Tingey, S. V. (1993). Genetic diagnostics in plant breeding: RAPDs, microsatellites and machines. Trends Genet. 9, 275–280. doi: 10.1016/0168-9525(93)90013-8
Raubeson, L. A., and Jansen, R. K. (2005). “Chloroplast genomes of plants,” in Plant Diversity and Evolution: Genotypic and Phenotypic Variation in Higher Plants, ed. R. J. Henry (Cambridge, MA: CABI), 45–68. doi: 10.1079/9780851999043.0045
Raubeson, L. A., Peery, R., Chumley, T. W., Dziubek, C., Fourcade, H. M., Boore, J. L., et al. (2007). Comparative chloroplast genomics: analyses including new sequences from the angiosperms Nuphar advena and Ranunculus macranthus. BMC Genomics 8:174. doi: 10.1186/1471-2164-8-174
Ronquist, F., and Huelsenbeck, J. (2003). MrBayes: Bayesian phylogenetic inference under mixed models. Bioinformatics 19, 1572–1574. doi: 10.1093/bioinformatics/btg180
Sauquet, H., Ho, S. Y., Gandolfo, M. A., Jordan, G. J., Wilf, P., Cantrill, D. J., et al. (2012). Testing the impact of calibration on molecular divergence times using a fossil-rich group: the case of Nothofagus (Fagales). Syst. Biol. 61, 289–313. doi: 10.1093/sysbio/syr116
Schattner, P., Brooks, A. N., and Lowe, T. M. (2005). The tRNAscan-SE, snoscan and snoGPS web servers for the detection of tRNAs and snoRNAs. Nucleic Acids Res. 33, W686–W689. doi: 10.1093/nar/gki366
Shi, C., Liu, Y., Huang, H., Xia, E. H., Zhang, H. B., and Gao, L. Z. (2013). Contradiction between plastid gene transcription and function due to complex posttranscriptional splicing: an exemplary study of ycf15 function and evolution in angiosperms. PLoS ONE 8:e59620. doi: 10.1371/journal.pone.0059620
Shinozaki, K., Ohme, M., Tanaka, M., Wakasugi, T., Hayashida, N., Matsubayashi, T., et al. (1986). The complete nucleotide sequence of the tobacco chloroplast genome: its gene organization and expression. EMBO J. 5, 2043–2049. doi: 10.1007/bf02669253
Soltis, D. E., Gitzendanner, M. A., and Soltis, P. S. (2007). A 567-taxon data set for angiosperms: the challenges posed by Bayesian analyses of large data sets. Int. J. Plant Sci. 168, 137–157. doi: 10.1086/509788
Soltis, D. E., Soltis, P. S., Chase, M. W., Mort, M. E., Albach, D. C., Zanis, M., et al. (2000). Angiosperm phylogeny inferred from 18S rDNA, rbcL, and atpB sequences. Bot. J. Linn. Soc. 133, 381–461. doi: 10.1111/j.1095-8339.2000.tb01588.x
Sun, M., Naeem, R., Su, J. X., Cao, Z. Y., Burleigh, J. G., Soltis, P. S., et al. (2016). Phylogeny of the Rosidae: a dense taxon sampling analysis. J. Syst. Evol. 54, 363–391. doi: 10.1111/jse.12211
Takhtajan, A. (1980). Outline of the classification of flowering plant (Magnoliophyta). Bot. Rev. 46, 225–239. doi: 10.1007/BF02861558
Tangphatsornruang, S., Uthaipaisanwong, P., Sangsrakru, D., Chanprasert, J., Yoocha, T., Jomchai, N., et al. (2011). Characterization of the complete chloroplast genome of Hevea brasiliensis reveals genome rearrangement, RNA editing sites and phylogenetic relationships. Gene 475, 104–112. doi: 10.1016/j.gene.2011.01.002
Wang, R. J., Cheng, C. L., Chang, C. C., Wu, C. L., Su, T. M., and Chaw, S. M. (2008). Dynamics and evolution of the inverted repeat-large single copy junctions in the chloroplast genomes of monocots. BMC Evol. Biol. 8:36. doi: 10.1186/1471-2148-8-36
Weber, J. L. (1990). Human DNA polymorphisms and methods of analysis. Curr. Opin. Biotechnol 1, 166–171. doi: 10.1016/0958-1669(90)90026-H
Wicke, S., Schneeweiss, G. M., Müller, K. F., and Quandt, D. (2011). The evolution of the plastid chromosome in land plants: gene content, gene order, gene function. Plant Mol. Biol. 76, 273–297. doi: 10.1007/s11103-011-9762-4
Wolfe, K. H., Li, W. H., and Sharp, P. M. (1987). Rates of nucleotide substitution vary greatly among plant mitochondrial, chloroplast, and nuclear DNAs. Proc. Natl. Acad. Sci. U.S.A. 84, 9054–9058. doi: 10.1073/pnas.84.24.9054
Wyman, S. K., Jansen, R. K., and Boore, J. L. (2004). Automatic annotation of organellar genomes with DOGMA. Bioinformatics 20, 3252–3255. doi: 10.1093/bioinformatics/bth352
Xi, Z., Ruhfel, B. R., Schaefer, H., Amorim, A. M., Sugumaran, M., Wurdack, K. J., et al. (2012). Phylogenomics and a posteriori data partitioning resolve the Cretaceous angiosperm radiation Malpighiales. Proc. Natl. Acad. Sci. U.S.A. 109, 17519–17524. doi: 10.1073/pnas.1205818109
Xiang, X. G., Wang, W., Li, R. Q., Lin, L., Liu, Y., Zhou, Z. K., et al. (2014). Large-scale phylogenetic analyses reveal fagalean diversification promoted by the interplay of diaspores and environments in the Paleogene. Perspect. Plant Ecol. Evol. Syst. 16, 101–110. doi: 10.1016/j.ppees.2014.03.001
Yang, Z., and Nielsen, R. (2000). Estimating synonymous and nonsynonymous substitution rates under realistic evolutionary models. Mol. Biol. Evol. 17, 32–43. doi: 10.1093/oxfordjournals.molbev.a026236
Young, H. A., Lanzatella, C. L., Sarath, G., and Tobias, C. M. (2011). Chloroplast genome variation in upland and lowland switchgrass. PLoS ONE 6:e23980. doi: 10.1371/journal.pone.0023980
Zhang, S., Gao, Z., Xu, C., Chen, K., Wang, G., Zheng, J., et al. (2009). Genetic diversity of Chinese bayberry (Myrica rubra Sieb. et Zucc.) accessions revealed by amplified fragment length polymorphism. Hortscience 44, 487–491.
Keywords: Fagales, Morella rubra, chloroplast genome, genomic structure, phylogenomics
Citation: Liu L-X, Li R, Worth JRP, Li X, Li P, Cameron KM and Fu C-X (2017) The Complete Chloroplast Genome of Chinese Bayberry (Morella rubra, Myricaceae): Implications for Understanding the Evolution of Fagales. Front. Plant Sci. 8:968. doi: 10.3389/fpls.2017.00968
Received: 30 March 2017; Accepted: 23 May 2017;
Published: 30 June 2017.
Edited by:
Jan Dvorak, University of California, Davis, United StatesReviewed by:
Kui Lin, Beijing Normal University, ChinaMing Kang, South China Institute of Botany (CAS), China
Copyright © 2017 Liu, Li, Worth, Li, Li, Cameron and Fu. This is an open-access article distributed under the terms of the Creative Commons Attribution License (CC BY). The use, distribution or reproduction in other forums is permitted, provided the original author(s) or licensor are credited and that the original publication in this journal is cited, in accordance with accepted academic practice. No use, distribution or reproduction is permitted which does not comply with these terms.
*Correspondence: Pan Li, panli_zju@126.com