 Dandan Guo1
 Meili Guo
- 1Department of Pharmacognosy, College of Pharmacy, Second Military Medical University, Shanghai, China
- 2Testing and Analysis Center, College of Pharmacy, Second Military Medical University, Shanghai, China
Carthami flos, the dried petal of safflower (Carthamus tinctorius L.) has been widely used in traditional Chinese medicine to treat cardiovascular and cerebrovascular diseases, in which quinochalcone glucosides such as hydrosafflower yellow A (HSYA), carthamin are uniquely present and have been identified as active compounds. In the present study, through sequencing of a safflower floret cDNA library and subsequent microarray analysis, we found 23 unigenes (5 PALs, 1 C4Hs, 5 4CLs, 6 CHSs, 2 CHIs, 2 DFRs, 2 FLSs) involved in flavonoid pathway, of which 4 were up-regulated differentially during quinochalcone glucosides accumulation with the floret developing stage. The up-regulated genes were verified by PCR methods. Considering chalcone synthase are entry enzyme in flavonoid biosynthesis, CHS1 was focused on target gene to verify its function furtherly. Bioinformation analysis showed that CHS1 shared 86.94% conserved residues with CHS from other plants. Subcellular localization showed that CtCHS1 was localized in cytoplasm in onion epidermal cells. The transgenic safflower plant with overexpression CtCHS1 by Agrobacterium-mediated pollen-tube pathway method was firstly generated. The results present that expression of PAL2, PAL3, CHS1, CHS4, CHS6 increased and expression of CHI1 and CHI2 decreased in the transgenic plant floret. Meanwhile, the accumulation of quinochalcone glucosides increased by ∼20–30% and accumulation of quercetin-3-β-D-glucoside and quercetin decreased by 48 and 63% in the transgenic plant floret. These results suggested that CtCHS1 played an important role in quinochalcone glucosides biosynthesis rather than flavonol biosynthesis. These results also demonstrated that the pollen-tube pathway method was an efficient method for gene transformation in safflower. Our study will provide a deep understanding of potential synthetic genes involved in quinochalcone biosynthetic pathway.
Introduction
Flavonoids with a variegated structure are ubiquitous plant secondary metabolites that their physiological and ecological role is to provide relief against a large amount of biotic and abiotic stresses in the plant kingdom, such as protection against light and temperature (Winkel-Shirley, 2002), flower coloration (Tanaka and Brugliera, 2013), defense against insect infestation (El-Wakeil, 2013) and pathogen (Ortuño et al., 2006; Steinkellner et al., 2007). Meanwhile, they are recognized as abundant resources for agents that promote and maintain health (Sankari et al., 2014). Because of their significance in genetic investigations and biomedicines, flavonoid biosynthesis has attracted considerable scientific attention over the years (Giannasi, 1978; Gutha et al., 2010). However, for the extreme complexity of the secondary metabolic pathways in plants, the study on flavonoids metabolism in plants has been challenging and fascinating.
Safflower (Carthamus tinctorius L.) is widely cultivated as traditional herbs in China. The dried flower petal (Carthami flos) is a valued drug in traditional Chinese medicine and has been used clinically for a long time in China particularly for prevention and treatment of cardiovascular and cerebrovascular diseases (National Pharmacopoeia Committee, 2010). Numerous studies show that the main active compounds in safflower flower are flavonoids, such as quinochalcones (hydrosafflower yellow A, carthamin, tinctorimine, and cartorimine) and flavonols (kaempferol and its glucosides, and quercetin and its glucosides) (Tu et al., 2015). Due to natural and artificial selection for a long time, intraspecific variation from chemical components to pharmacological activity happended in safflower cultivars. For instance, ZHH0119 safflower line, which has orange-yellow petals (Y line), is a major source of quinochalcones mainly used to prevent myocardial ischemia. Whereas, the XHH007 line, which has white petals (W line), mainly contains flavonols which possessed a protective effect against cerebral ischemic damage (Li et al., 2006). To elucidate the biosynthesis mechanism of the flavonoids, several investigations on the transcriptome of safflower have been launched (Li et al., 2012). The genes encoding isochorismate synthase, cinnamate 4-hydroxylase (Sadeghi et al., 2013), oleyl-phosphatidyl-choline desaturase (FAD2) (Cao et al., 2013), phenylalanine ammonia-lyase and chalcone synthase (Dehghan et al., 2014), flavanone 3-hydroxylase gene (F3H) (Tu et al., 2016) and UDP-glycosyltransferases (UGTs) (Guo et al., 2016) in safflower have been cloned and characterized basically. However, due to the special nature of flavonoids, the key genes involved in flavonoids especially quinochalcones biosynthesis in safflower is hardly known. Therefore, it becomes very important to elucidate quinochalcone biosynthesis combining gene engineering method with metabolites analysis. Up to now, Agrobacterium-mediated pollen-tube pathway method generated the transgenic plants have been proved effective and successfully used in several species such as Cucumis melo L. (Hao et al., 2011; Zhang and Luan, 2016), maize (Yang et al., 2009), cotton (Wang et al., 2013). Nevertheless, no previous studies have explored transgenic saflower plant via this approach.
In the present study, in order to identify genes regulating quinochalcone glucosides biosynthesis in safflower, 23 unigenes involved in flavonoid pathways during the floret developing stage were found through sequencing of a safflower floret cDNA library. Among them, CHS1 was focused to be an important target gene based on subsequent microarray analysis combing quantitative RT-PCR. To verify the CHS1’s function, we successfully generated the transgenic safflower plant with overexpression of CtCHS1 by Agrobacterium-mediated pollen-tube pathway method. We found that overexpression of CtCHS1 significantly increased the accumulation of quinochalcone glucosides in safflower, which provided a concrete evidence that CtCHS1 is solely involved in quinochalcone glucosides biosynthesis.
Materials and Methods
Plant Materials
Two prominent safflower lines, ZHH0119 (Y line) and XHH007 (W line), were cultivated in the greenhouse of pharmacy college, Second Military Medical University. The temperature was set at 25°C. Circadian rhythm is 16 h/light and 8 h/darkness. Samples were picked at different floret developing stage (Figure 1).
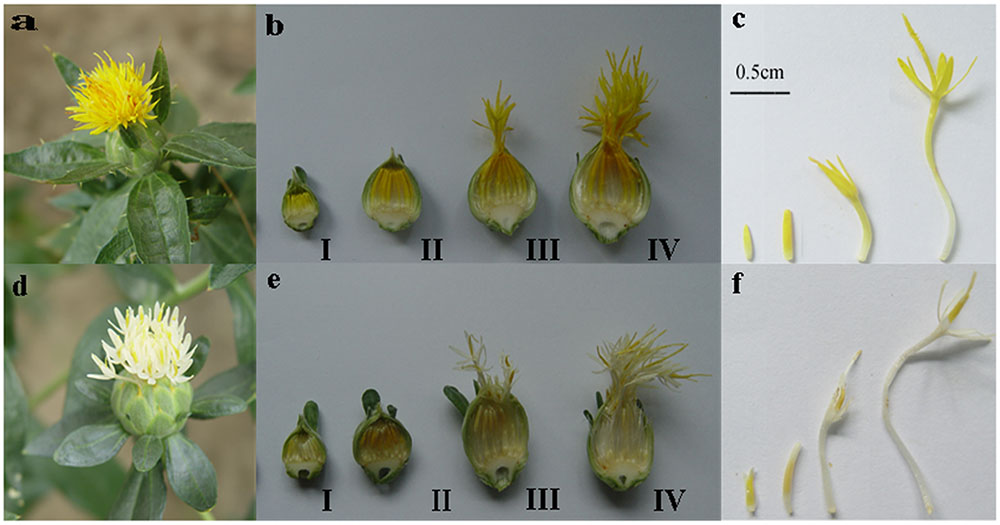
FIGURE 1. Two safflower line and their different floret developmental stage. (a–c) Yellow line. (d–f) White line. (a,d) Inflorescence of safflower. (b,e) Cross section of inflorescence from the two lines of different stages. (c,f) Different developmental stage of petals from two line corresponding to (b,e). I: 7 days before blooming; II: 3 days before blooming; III: bloom day; IV: 3 days after blooming.
Normalized cDNA Library Construction
The early constructed normalized cDNA library in our laboratory was used in this study. RNA of equivalent different developmental stage flower samples from Y line were extracted according to manufacturer’s instructions (Invitrogen). Primary cDNA libraries were constructed with CloneMinerTM cDNA Library Construction Kit (Invitrogen) and the plasmid is pDONR 222. DNA were extracted and digested by Hind III and BamH I. Normalized cDNA libraries were constructed by mixing DNA affinity system with primary cDNA. Normalized cDNA libraries were transformed into Escherichia coli cell DH10B for sequencing.
Functional Annotation
Open reading frame (ORF) and peptide sequence were predicted by TransDecoder and ESTScan. The length distribution of unigene, ORFnn and ORFaa were proceed. Gene ontology (GO) assignments were used to classify the functions of the predicted unigenes and EST by Blast2GO. GO mapping was carried out in order to classify gene product properties into three main domains. To further study complex biological behavior of genes, ortholog assignment of unigenes were performed using Kyoto Encyclopedia of Genes and Genomes (KEGG) automatic annotation server (KAAS) with the method of bidirectional best hit (BBH). The annotation can help us further understand the role of genes in signal pathway.
Gene Chip
RNA of equivalent different developmental stage flower samples from two safflower lines were isolated using trizol and purified. Hybridization of the RNA was performed using the gene expression hybridization kit (Agilent). 8 × 15K (Agilent) in situ synthesis of gene chip was used to detect gene expression. Then the microarrays were scanned with the Microarray Scanner (Agilent). gProcessed Signal were the value of transcript abundancy. The expression analysis of unigenes in two lines were performed by DESeq (V1.14.0) (Gentleman et al., 2004). Differential genes were screened out with appropriate fold change absolutely (FCA) calculated and p-value. Hot map for expression signal intensity and hierarchical clustering (HCL) were performed by MeV (Eisen et al., 1998).
Semi-Quantitative RT-PCR/Quantitative RT-PCR Analysis
Total RNA was extracted by trizol (TransGen Biotech, Beijing, China) according to manufacturer’s protocol. The first-strand cDNA were synthesized with 500 ng RNA according to cDNA Synthesis SuperMix (TransGen Biotech, Beijing, China). The specific primers of genes in flavonoid biosynthesis were designed using Beacon Designer 8 (Supplementary Table S1). The quantitative RT-PCR was performed by use of the SYBR Green Realtime Master Mix kit (Transgene, China), and carried out with ABI 7500 detection system (ABI, United States). PCR conditions is the same as those described previously (Guo et al., 2016). All quantitative real-time PCR amplifications were carried out with three independent biological replicates. The specificity of amplification was assessed by dissociation curve analysis. And the relative expression level of genes was determined using the 2-ΔΔCt method. Semi-quantitative RT-PCR amplification of RNA was performed as previously reported without curve stage. The Ct60S gene (KJ634810) was treated as reference gene.
Clone and Bioinformatic Analysis of CtCHS1
cDNA library was built with SMARTerTM RACE cDNA Amplification Kit (Clontech, United States). Gene-specific primers (GSPs) were designed (CtCHS1-GSP1-5′:CGCTCGTGTCCTCGTGGTTTGCTC; CtCHS1-GSP1-3′:CAACGGAGAAAACGCCTGC). The sequences of the 3′- and 5′-RACE products were produced by Advantage 2 PCR Kit (Clontech, United States) and sequenced. To obtain the full-length sequence of CtCHS1, primer was designed by Oligo 7 (CtCHS1-full-length-5′:ATGGCATCCTTAACCGATATTG; CtCHS1-full-length-3′:TTAAGCGGCAATGGGGGTGG). PCR was performed using KOD-Plus-Neo polymerase mix system (Toyobo, Japan) when the condition is: 30 cycles of 10 s denaturation at 94°C, 30 s annealing at 58°C, and 60 s amplification at 72°C. The PCR products were purified (QIAquick® Gel Extraction Kit, Qiagen, Germany) and cloned into the PMD-19T vector (Takara, Japan). Full length of CtCHS1 was sequenced. The obtained ORF sequence and deduced protein were analyzed using websites1,2. Multiple sequence alignment was performed by DNAMAN and phylogenic tree was built by using ClustalX version 2.0 (Larkin et al., 2007) and MEGA (Tamura et al., 2011).
Subcellular Localization
The entire coding sequence (CDS) of CtCHS1was amplified with primers (CHS1-F:GAGCTTTCGCGGATCCGCCACCATGGCATCCTTAACCGATATTG and CHS1-R:CATGGTGGCAAGCTTAGGGCCGGGATTCTCCTCCACGTCACCGCATGTTAGAAG). The tool vector pCAMBIA1380-GFP (green fluorescent protein) was digested by incorporated BamHI-HF and SpeI-HF sites. The PCR product was cloned into the vector pCAMBIA1380-GFP to generate pCAMBIA1380-CtCHS1-GFP fusion protein construct driven by the cauliflower mosaic virus (CaMV) 35S promoter. The resulting plasmids were confirmed by sequencing and further transformed into the Escherichia coli DH5a. The culture process of onion epidermal layers was performed according to previous methods (Tu et al., 2016). A localization assay was carried out as described by Mare et al. (Mare et al., 2004). The localization of the fusion protein was observed by using of a confocal microscope (Leica TCS SP5). GFP fluorescence, the bright field image was shot simultaneously and merged together.
Genetic Manipulation
The ORF of the CHS1 gene was cloned with primers above. CaMV35S promoter is the most commonly promoter to drive expression of transgenes in plants (Odell et al., 1985). Empty vector PMT39 (Supplementary Figure S1) was digested by Hind III and BamH I and linearized recombinant vector was constructed under the control of the 35S promoter with seamless cloning reaction mix according to the manufacturer’s instructions (Takara), which was then transformed into Agrobacterium LBA4404 by electroporation. Transformant cells were grown in LB medium with 50 mg/L kanamycin and 100 mg/L streptomycin. The primer (F:ATCTCTCTCGAGCTTTCGCGG; R:CGTCGCCGTCCAGCTCGACCAG) was designed to screen positive transformants.
Genetic Transformation of CtCHS1 in Safflower
A single colony was grown in 2 ml LB medium containing 50 mg/L kanamycin and 100 mg/L streptomycin with shaking at 30°C and confirmed by PCR. Then the culture was inoculated in 50 ml fresh LB medium containing kanamycin and streptomycin. It was grown at 30°C with 1 μM acetosyringone when optical density of the culture reached to ∼0.6–0.8 at 600 nm. The resulting cells were harvested by centrifugation at 5000 × g for 10 min and resuspended in 5% sucrose solution while adding 0.02% silwet-L 77. The solution harboring the PMT39-CHS1 vector is used right now after it is ready for genetic transformation of wild-type Y safflower line (T0) grown in greenhouses. After the flowers were pollinated and before the upper part of the stigma was closed, the flowers were then immediately injected with a solution containing plasmid DNA, using a microsyringe with the needle kept in a vertical position. When finished, the floret is placed at dark condition for 12 h by covering them with bags. Seeds of T0 were cultivated and T1 generation with over-expression CtCHS1 were obtained.
UPLC/Q-TOF/MS Detection in Transgenic Safflower
Samples were dried to constant weight at 50°C and ground into powder immediately. Subsequently, an aliquot of 5 mg samples was soaked overnight with 60% methanol under sealed conditions and then extracted for 40 min sonication (Guo et al., 2016). Then, the supernatant was analyzed. The metabolites were identified using an ultra high-performance liquid chromatography (UPLC) system (Agilent 1290 Infinity UPLC; Agilent Technologies, Waldbronn, Germany) fitted with the Agilent 6538 UHD Accurate-Mass Q-TOF LC/MS (Agilent Technologies, Santa Clara, CA, United States) equipped with an ESI (electrospray ionization) interface. Waters XSELECT HSS T3 C18 column (100 × 2.1 mm, 2.5 μm). Mobile phase A is water with 0.1% formic acid and mobile phase B is acetonitrile with 0.1% formic acid. Flow rate is 0.4 ml/min, column temperature was held at 40°C. The gradient elution, mass spectrometer and positive ion mode used for the quantification were performed as described previously. The 11 standard compounds were confirmed, namely: D-phenylalanine [m/z 165.0790], rutin [m/z 610.1534], quercetin 3-β-D-glucoside [m/z 464.0955], kaempferol-3-O-β-D-glucoside [m/z 448.1006], luteolin [m/z 286.0477], apigenin [m/z 270.0528], naringenin [m/z 272.0685], quercetin [m/z 302.0427] and kaempferol [m/z 286.0477] purchased from Sigma–Aldrich (St. Louis, MO, United States), HSYA [m/z 612.1690] and carthamin [m/z 910.2168] extracted in our lab. Metabolites data were proceed with MassHunter quantitative analysis software (Agilent).
Results
Sequence Assembly
Normalized cDNA library was built successfully with colony-forming unit (CFU) of 2.77 × 10⁵, recombination rate of >95%, and average insertion fragment length of >1.2 kb. 5′ end sequencing of clones from library resulted in a total of 32,299 EST sequences. 804 empty sequences by Cross_Match, 100 sequences shorter than 100 bp, 144 embedded sequences and 136 longer than 20bp poly-A were removed. Assessment of these EST sequences revealed that a total of 31,130 are “good quality” sequences. In order to assess EST redundancy, masked EST sequences were pair-wise compared and grouped into clusters, based on sequence similarity (Alagna et al., 2009). Therefore, the obtained clusters are ESTs which are most likely products of the same gene. Each cluster was then assembled into one or more tentative consensus sequences (TCs), which were derived from multiple EST alignments. ESTs did not fit the match criteria to be clustered/assembled with any other EST, were defined as singletons. The combination of TCs are referred to as contigs. Assembling these ESTs by CAP3 resulted in the identification of 7,737 unigenes (4,016 contigs and 3,721 singletons). The length distribution of unigenes, ORFnn and ORFaa were present (Supplementary Table S2).
Functional Annotation
The transcripts were annotated using NCBI BLAST, GO, Cluster of orthologous gene (COG) and KEGG. Based on shared high homology with sequences in the public databases, blastx and blastn analysis revealed 6,755 unigenes with annotation and 982 without annotation in Nr database and 4,240 unigenes with annotation and 3,497 without annotation in Nt database (E-value < 1 × 10⁻⁵). GO3 classification revealed 2,237 unigenes took part in molecular function, cellular component and biological process (Figure 2 and Supplementary Table S3). To further predict the function of unigenes, they were classified into different protein families based on COG protein databases. Overall 5,429 annotated unigenes were assigned to the appropriate COG clusters phylogenetically. The COG annotated proteins were functionally distributed into 23 protein families (Figure 3 and Supplementary Table S4), of which the cluster of “general function prediction” possessed the largest group (374 unigenes), followed by “translation, ribosomal structure and biogenesis” (286 unigenes), “posttranslational modification, protein turnover, chaperones” (275 unigenes), “amino acid transport and metabolism” (170 unigenes) and “carbohydrate transport and metabolism” (159 unigenes). KEGG pathway database intend to systematic analysis of functions of gene products and inner-cell metabolic pathways (Rama Reddy et al., 2015). The mapping of KEGG functional pathway categories indicated that a total of 3011 annotated unigenes assigned 304 pathways (Supplementary Table S5). Among them, a total of 23 unigenes were involved in flavonoid biosynthesis, which respectively contained unigenes for 5 phenylalanine ammonia-lyase unigenes (PAL), 1 cinnamate-4-hydroxylase unigenes (C4H), 5 4-coumarate: CoA ligase unigenes (4CL), 6 chalcone synthase unigenes (CHS), 2 chalcone isomerase unigenes (CHI), 2 dihydroflavonol 4-reductase unigenes (DFR), 2 flavonol synthase (FLS).
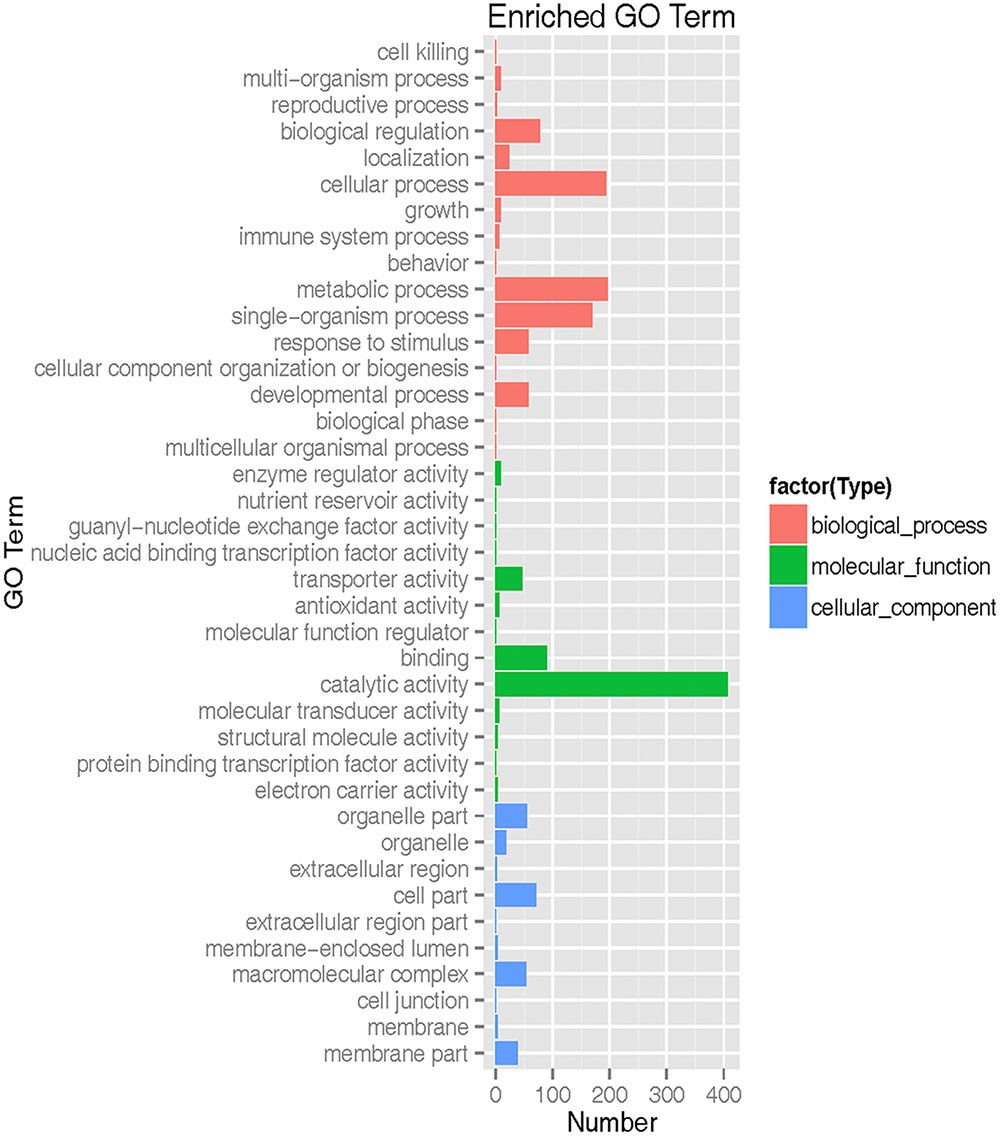
FIGURE 2. Gene ontology (GO) functional classification of safflower. Red frame is biological process. Green frame is molecular function. Blue frame is cellular component.
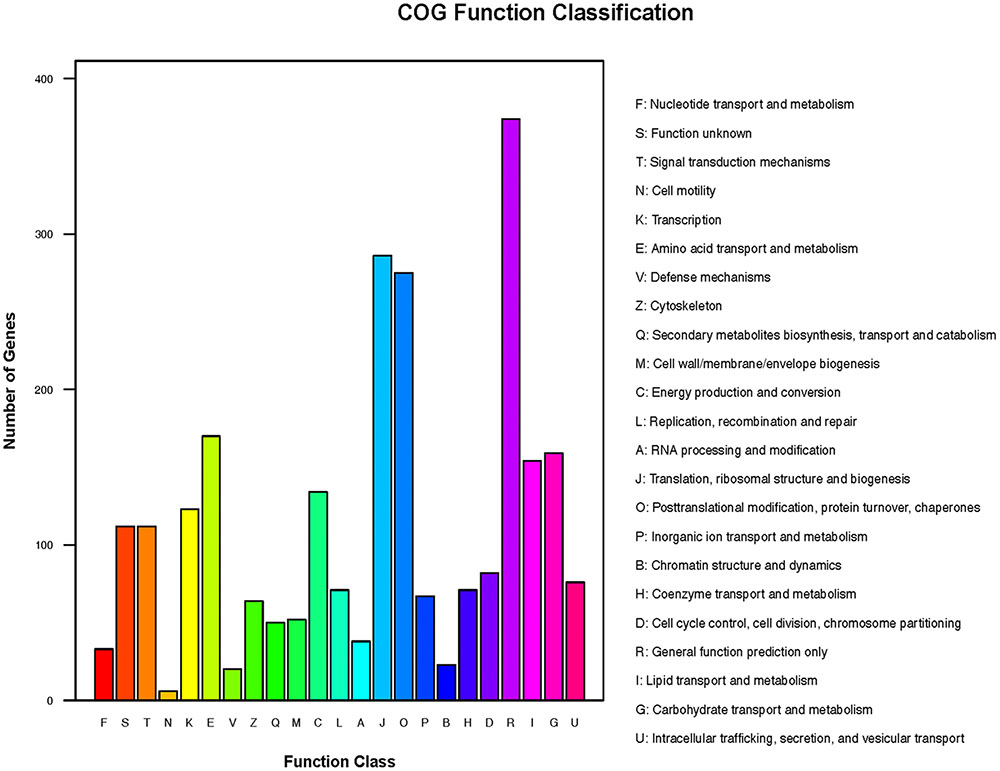
FIGURE 3. Cluster of orthologous gene (COG) functional annotations of safflower. A total of 23 function classes were described.
Gene Expression Microarray Analysis
To select differential gene, gene expression was analyzed to set FCA ≥ 2 and the p-value ≤ 0.05 in different sample. In Y line, comparing to Y-I stage, 346 unigenes were up-regulated and 58 were down-regulated in Y-II stage, 606 unigenes were up-regulated and 260 unigenes were down-regulated in Y-III stage and 1141 unigenes were up-regulated and 483 unigenes were down-regulated in Y-IV stage. A total of 1,307 unigenes were up-regulated with union (Figure 4). GO terms analysis revealed that the largest cluster is molecular function which 279 unigenes took part in, while 190 unigenes were involved in biological process and 74 unigenes in cellular component. KEGG results showed that 361 pathway with annotation by union set, in which, the starch and sucrose metabolism (ko00500) was the largest pathway cluster (31, 7.83%), in addition, phenylalanine metabolism pathway (ko00360) contained 17 annotated unigenes (4.29%) and monoterpenoid biosynthesis (ko00902) included 3 annotated unigenes (0.76%). In W line, comparing to W-I stage, 1960 unigenes were identified as up-regulated genes with a union of W-II/W-I, W-III/W-I and W-IV/W-I up-regulated unigenes. Comparing to the whole of up-regulated unigenes in W line (p ≤ 0.25), 266 up-regulated unigenes with specificity existed in Y line (Figure 5). Among them, 4 flavonoid-related specific genes were identified, included PAL3, CHS1, FLS1 and FLS2.
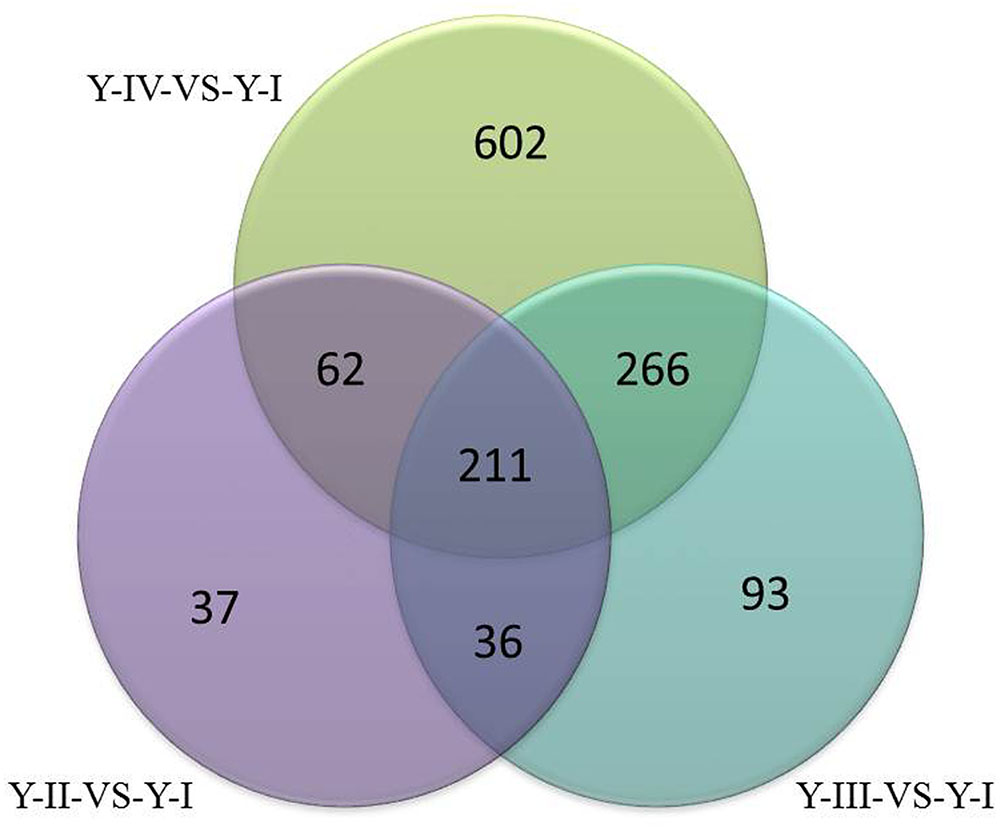
FIGURE 4. Venn diagram of up-regulated genes (p ≤ 0.05) at different developmental stage of flower in Y line.
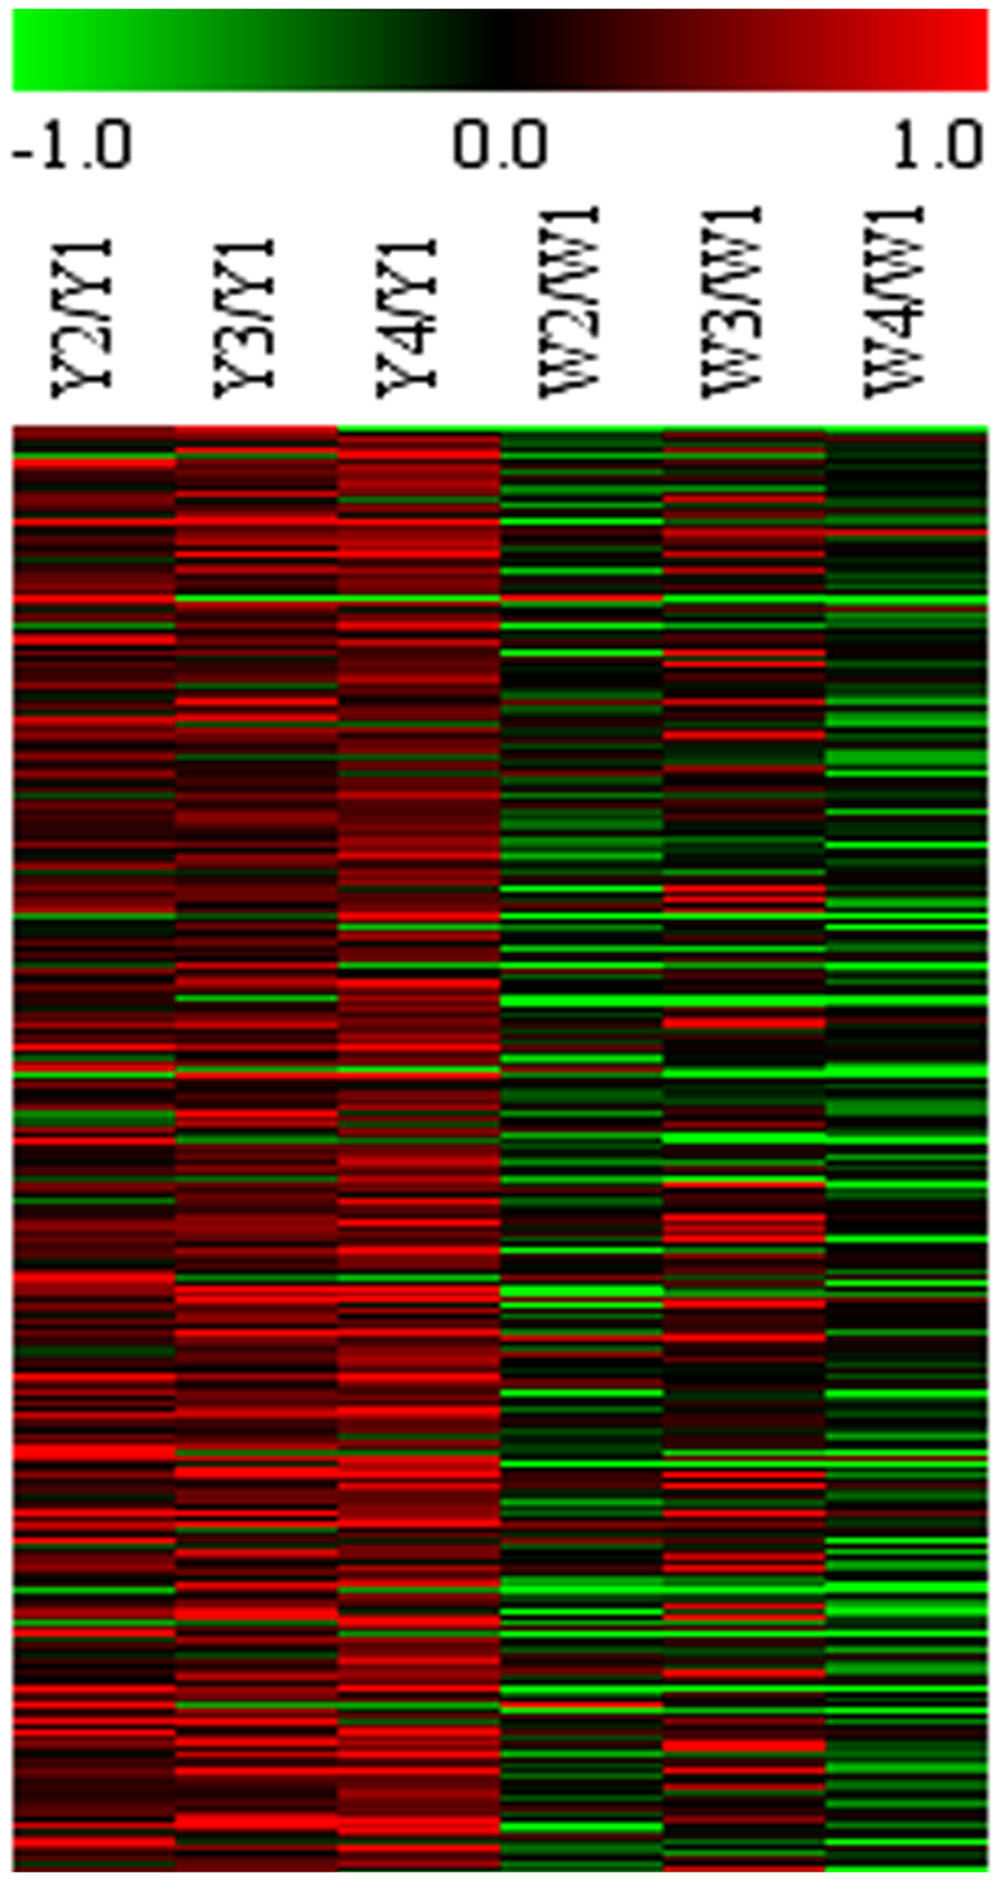
FIGURE 5. Microarray expression abundance of differential genes at different flower stages in Y and W line. HCL cluster of genes was performed. The color key was set from –1 to +1. The data were retrieved from the safflower microarray data set (unpublished).
Quantitative Real-time PCR/Semi-Quantitative RT-PCR Analysis
To further confirm the differential genes between Y line and W line, Semi-quantitative RT-PCR was performed with 1.5% agarose gel. The expression pattern of 23 flavonoid-related genes was examined at flower different developmental stage of two lines in Figure 6A. The result shows that PAL2, PAL4, 4CL1, 4CL2, and 4CL4, 4CL5, CHI1, and DFR2 are high expressed while the expression of PAL1 and FLS2 are weak in both two lines. However, CHS1, DFR1 and FLS1 have higher transcript level in Y line comparing with W line macroscopically. To confirm the difference of PAL3 in two lines, qPCR performed showed that PAL3 only has up-regulation trend at latest stage of flower in Y line, which is not as differential gene (Figure 6C). Combining with gene chip results (Figure 6B), only three important differential genes, CHS1, DFR1, and FLS1, were screened out. Chalcone synthase is an entry enzyme in flavonoid biosynthesis pathway, which not only participate in quinochalcone biosynthesis but also flavonol biosynthesis. In safflower two lines, quinochalcone is the main metabolites in Y line and flavonol is the principal compounds in W line. As a bridge of metabolites tributary, CHS1 was focused on an important target gene to verify its function.
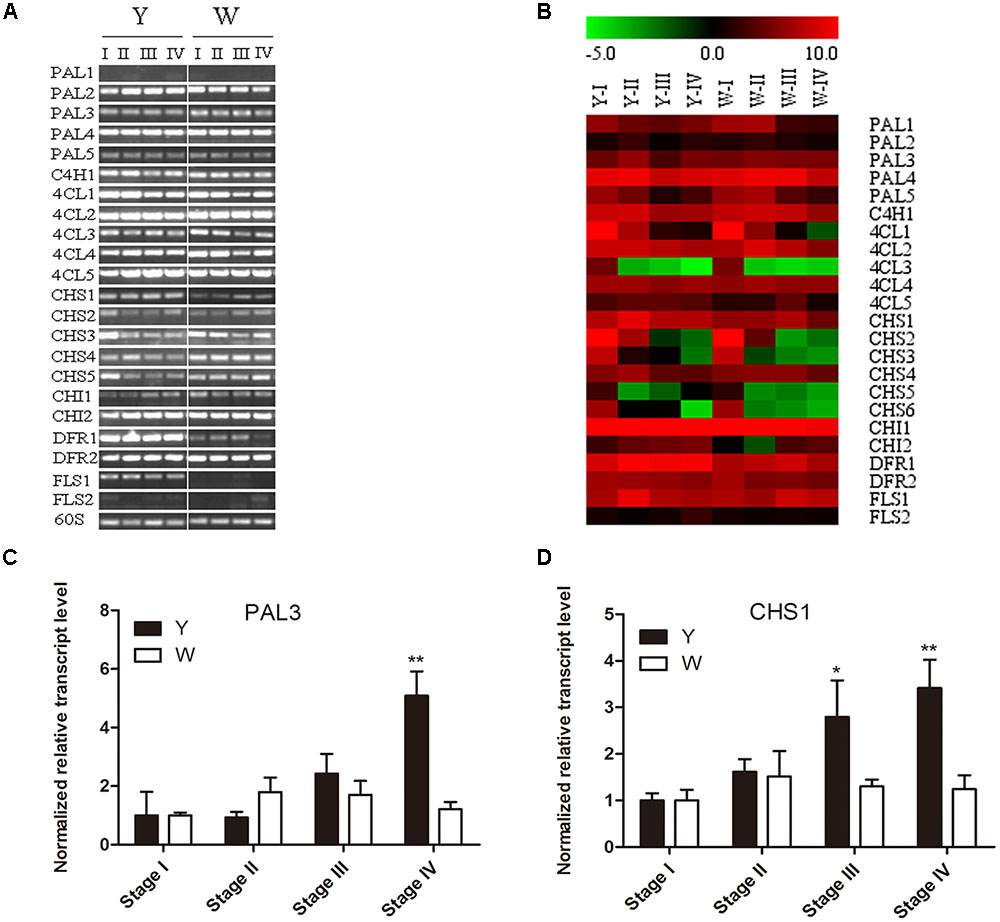
FIGURE 6. Expression pattern of flavonoid-related genes at flower different developmental stage of two lines. (A) Detected by semi-quantitative RT-PCR. (B) Signal values by gene chip, W1 and Y1 as control group. The color key was set from –5 to +10. (C) qPCR of PAL3. (D) qPCR ofCHS1.
Molecular Cloning and Characterization of CtCHS1
The full-length nucleotide sequence of CtCHS1 was predicted to be 1,487 bp (GenBank accession no. KY471385). In addition, to verify further the differential expression of CtCHS1, qPCR of full-length of CtCHS1 was carried out which confirmed CtCHS1 have higher transcript level at the late stage in Y line than W line (Figure 6D). CtCHS1 encodes a predicted protein of 398 amino acids, with a calculated pI of 6.11 and a molecular mass of 43.4 kD. BLASTX analysis of the CtCHS1 sequence against the GenBank database showed that the deduced amino acid sequence of CtCHS1 showed 86.94% identity to other known CHS proteins from different plant species, such as KVI08856.1from Cynara cardunculus var. scolymus and AFK65634.1 from Silybum marianum (Figure 7). Phylogenetic analysis (Figure 8) showed that CtCHS1 has 100% similarity with BAV37881.1 from safflower. In addition, CtCHS2 and CtCHS4 from safflower are less than 72% identity to CtCHS1. CtCHS2 is less closely related to CHS protein from other species at the amino acid level. This suggested that the 3 CHS proteins may possess different biological functions in safflower.
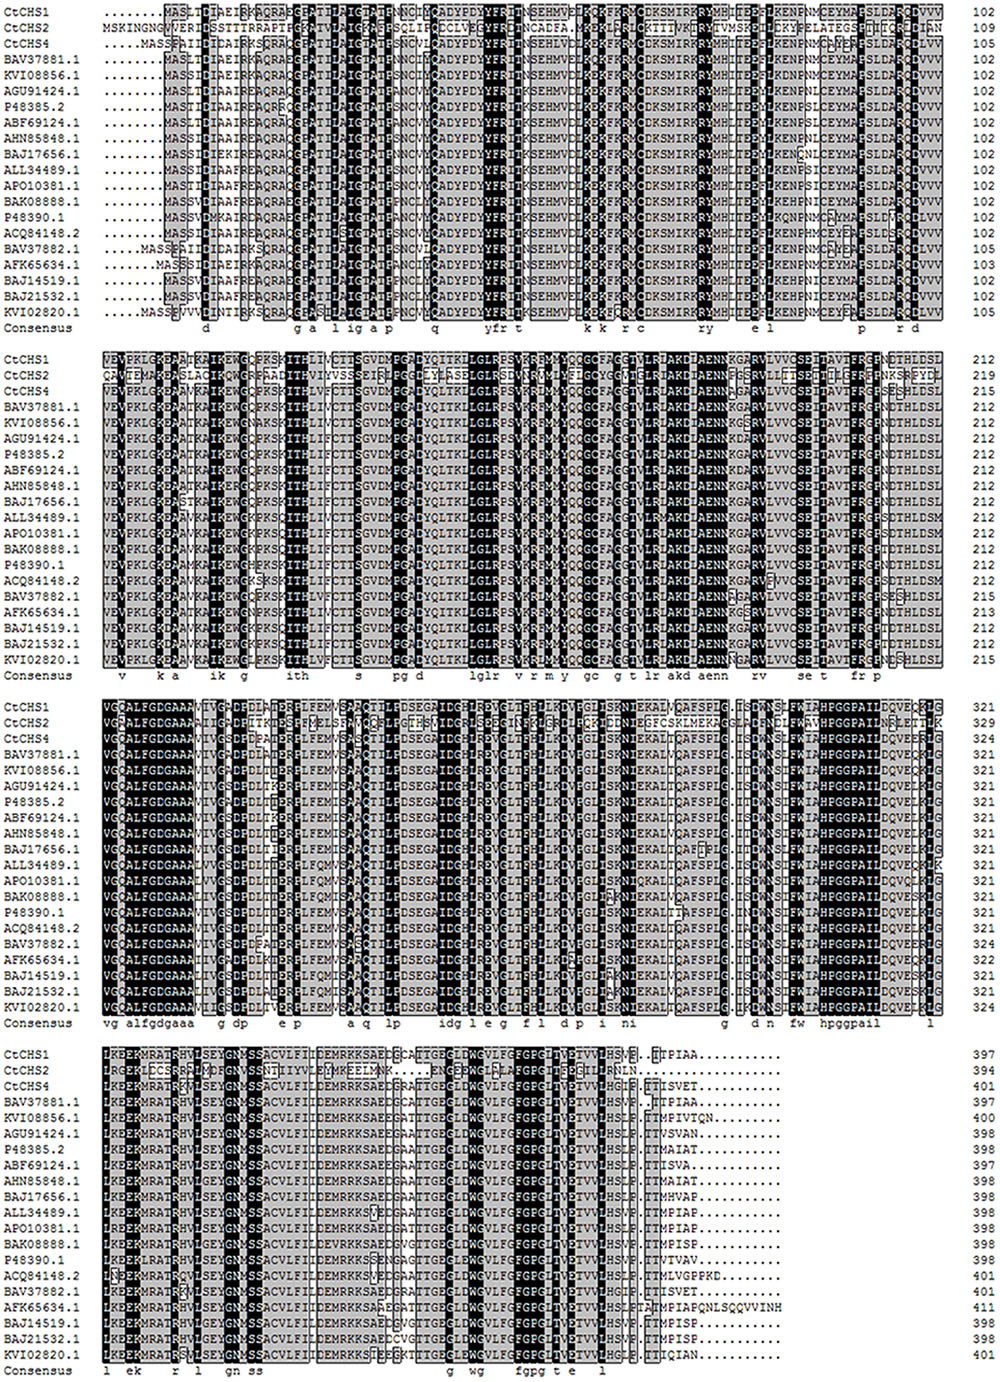
FIGURE 7. Alignment of deduced amino acid sequences of plant CHS proteins. Identical residues are highlighted on a black background, and similar residues are highlighted on a gray background. The GenBank accession numbers are as follows: BAV37881.1 and BAV37882.1 from Carthamus tinctorius, KVI08856.1 and KVI02820.1 from Cynara cardunculusvar. scolymus, AFK65634.1 from Silybum marianum. AGU91424.1from Chrysanthemum boreale, P48385.2 from Callistephus chinensis, ABF69124.1 from Chrysanthemum x morifolium, AHN85848.1 from Eschenbachia blinii, BAJ17656.1 from Gynura bicolor, ALL34489.1 from Helianthus annuus, BAJ14519.1, BAJ21532.1 and BAK08888.1 from Dahlia pinnata, APO10381.1 from Echinacea pallida, P48390.1 from Gerbera hybrida, ACQ84148.2 from Ageratina adenophora.
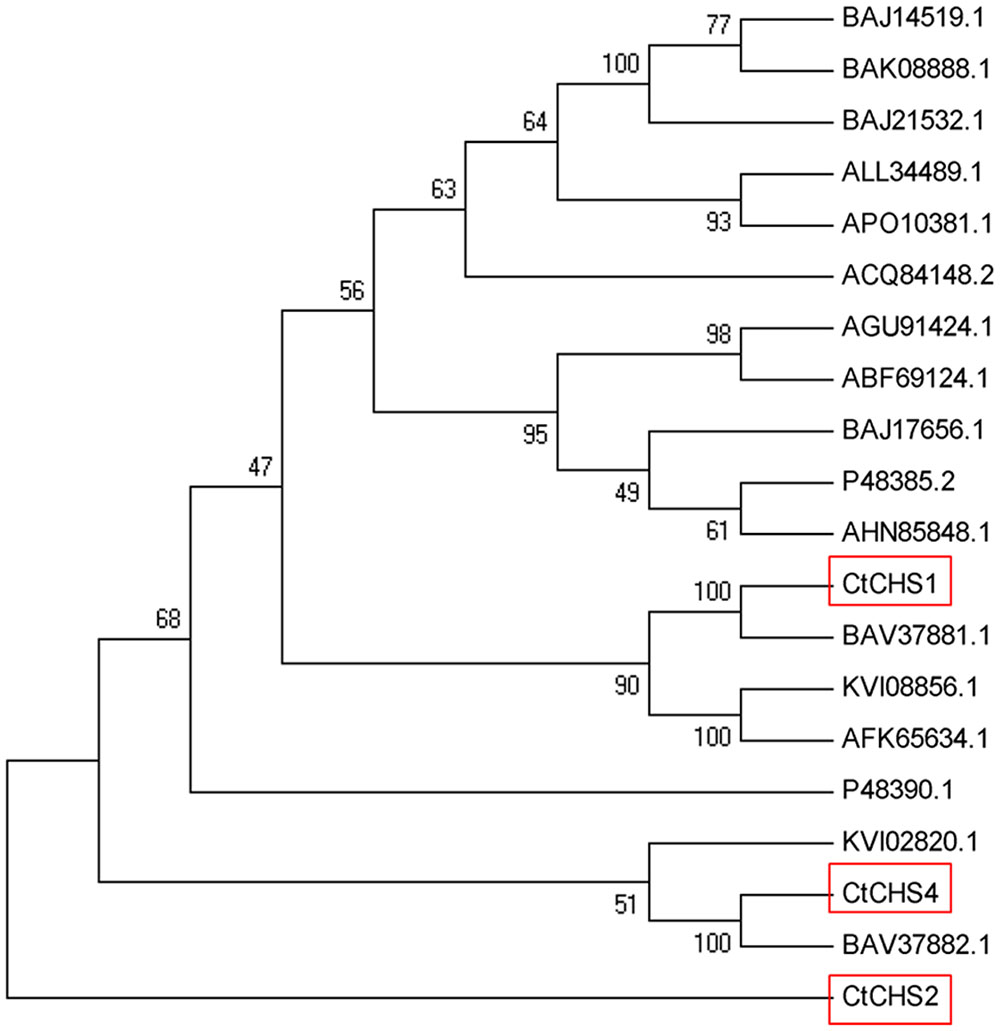
FIGURE 8. Unrooted phylogram comparison of the amino acid sequences of CtCHS1 and other functionally characterized CHS proteins. The sequences used are the same as in figure. The phylogenetic tree was constructed by MEGA, after alignment using ClustalX software. Node support was estimated using neighbor-joining bootstrap analysis (1,000 bootstrap replicates).
Subcellular Localization of CtCHS1
It is important to elucidate the functional roles in plant cells by analyzing the subcellular localization of proteins. The probable subcellular localization of CtCHS1 was computationally analyzed by using the WoLF PSORT program4 (Horton et al., 2007), and the results indicated that CtCHS1 may be positioned at the cytoplasm. To examine the localization of the CtCHS1 protein, a CtCHS1-GFP fusion construct was introduced into onion epidermal cells. The results displayed that CtCHS1-GFP protein was detected mainly in the cytoplasm and cytomembrane in Figure 9, while the control (transformation of GFP construct) was observed in the cytomembrane. The results indicated that CtCHS1 may be localized in cytoplasm.
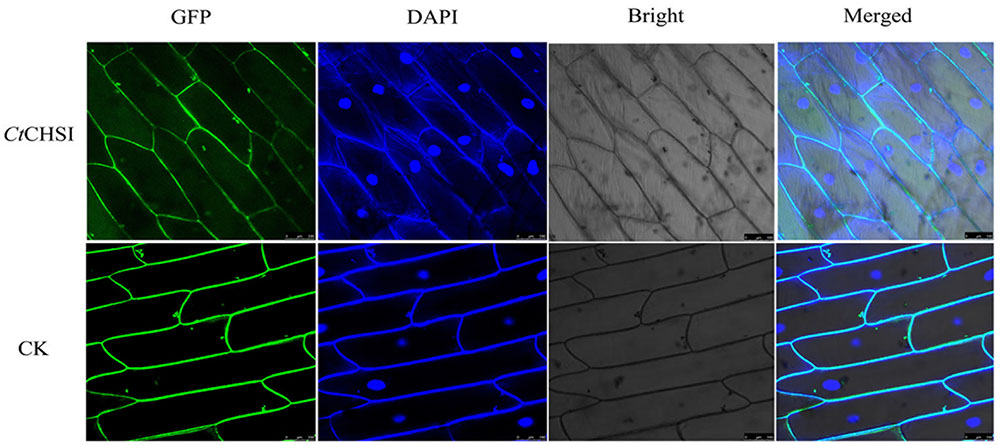
FIGURE 9. Subcellular localization of the CtCHS1-GFP fusion protein in onion epidermal cell. GFP fluorescence, bright field and an overlay of bright and GFP fluorescence illumination (merged) are shown.
Transcriptional Expression of Associated Genes in Transgenic Safflower
The CtCHS1 gene driven by the 35S promoter was introduced into safflower by Agrobacterium tumefaciens mediated transformation. Eight out of 31 independent positive transgenic lines were screened out by PCR. Transcript levels of genes involved in flavonoid biosynthesis pathway were further analyzed by qRT-PCR in wild-type and transgenic plants. Comparing with empty-vector plant group, CtCHS1 transcript level raises significantly with about 0.95 fold in transgenic plants. Meanwhile, as members of chalcone protein family of safflower, transcript level of CHS4 and CHS6 was also up-regulated by 0.60 and1.14 fold. Transcript level of CHS2 and CHS5 also had an upward trend, though it did not reached a significant level. Transcript level of up-stream pathway genes, PAL2 and PAL3 raised significantly with about 2.40 and 1.95 fold, respectively (Figure 10). While 4CL1, 4CL3, 4CL5 declined significantly with about 0.44, 0.35, and 0.36 fold. In addition, PAL1, FLS2 with low transcript signal in wild-type plant would not be discussed here. On the contrary, down-stream pathway genes CHI1, CHI2 were suppressed by 0.22, 0.47 fold. This indicated that over-expression of CtCHS1 in Y line had promoted transcript of its family (CHS4 and CHS6) and up-stream genes (PAL2 and PAL3) and restrained expression of down-stream genes. From these results, we thought that over-expression of CtCHS1 would result in over-expression of most of its family member, PAL2 and PAL3, participated in quinochalcone glucosides biosynthesis as the co-regulators of CtCHS1 and inhibit transcript expression of CHI1 and CHI2, giving some clues for CHI not participating in quinochalcone glucosides biosynthesis in safflower.
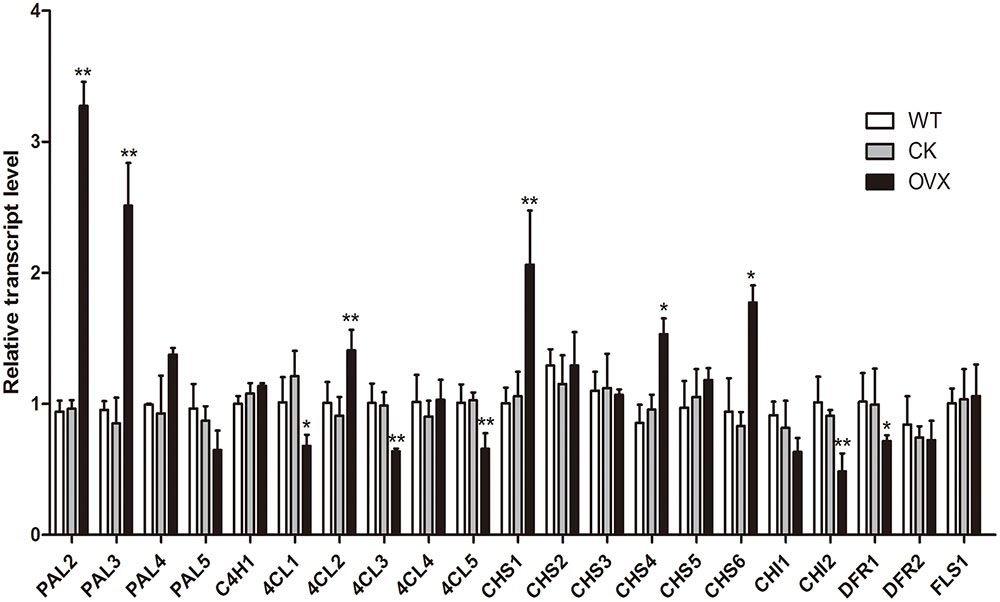
FIGURE 10. Transcript levels in wild-type and CtCHS1 over-expression safflower as determined by qRT-PCR. WT, wild-type safflower line. CK, safflower line with empty-vector control. OVX, CtCHS1 Over-expression safflower line. CK group VS WT group, OVX group VS CK. ∗p ≤ 0.05, ∗∗p ≤ 0.01.
Profiling of Flavonoids Accumulation in Transgenic Safflower
To determine whether overexpression of this gene could modulate HSYA biosynthesis, we introduced CtCHS1 into Y safflower line. The transgenic plant line did not display obvious phenotypical differences compared with wild-type line. To further investigate the impact of CtCHS1 overexpression on flavonoid biosynthesis, levels of flavonoid-skeleton secondary metabolites were measured by ultra-high-performance liquid chromatography coupled to electrospray ionization quadrupole time-of-flight mass spectrometry (UPLC-ESI-QTOF-MS) in Supplementary Figure S2. The quantitative of compounds were analyzed by using standard curve method. The average contents of three biological replicates were presented. Over-expression of CtCHS1 have brought that all the flavonols detected were down-regulated. The greatest effects were detected in flowers, where levels of quercetin and its glucoside (Figure 11) as well as luteolin were reduced by 47–63% in the transgenic lines. Kaempferol and its glucosides were down-regulated by 14.41% (kaempferol) and 17.06% (kaempferol-3-O-β-D-glucoside). In contrast, quinochalcone C-glucosides such as HSYA and carthamin, were increased apparently by 19.83 and 29.48% in CtCHS1 over-expression line. Surely, as the precursor of flavoniods, D-phenylalanine is consumed faster 39.51% resulted from over-expression of CtCHS1. This is consistent with the transcript level change CtCHS1 over-expression aroused (Figure 10). The result reveals that CtCHS1 opens a tributary to quinochalcone biosynthetic pathway and block off CtCHIs that flow to downstream pathways to synthesize various flavonols aglycones and glycosides suggesting that CtCHS1 solely take part in quinochalcone biosynthetic pathway rather than flavonol (Figure 12).
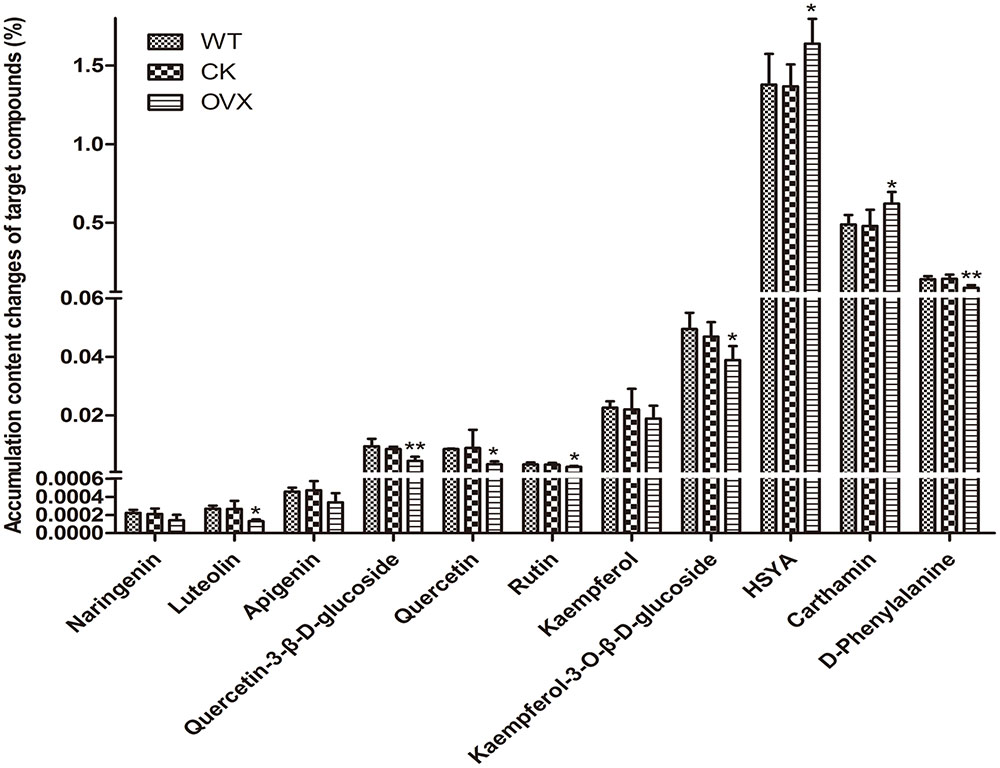
FIGURE 11. Levels of target flavonoid compounds in wild-type and transgenic safflower determined by UPLC-MS analysis. The data represent the content corresponding to each compound by that of the standard curve method. Results are presented as means mean ± SD from biological triplicates. CK group VS WT group, OVX group VS CK. ∗p ≤ 0.05, ∗∗p ≤ 0.01.
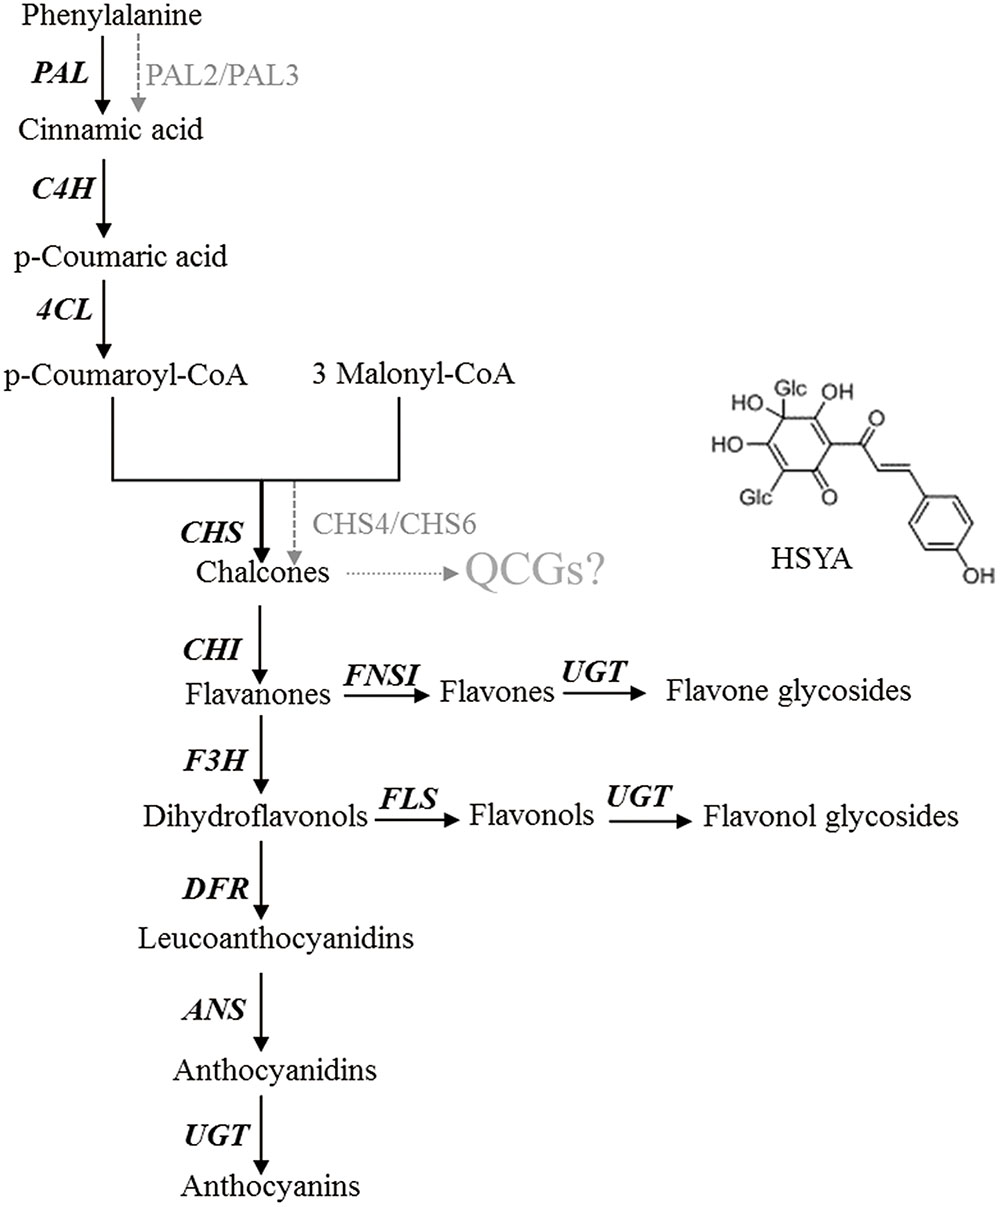
FIGURE 12. Schematic for the putative biosynthetic pathways of quinochalcone C-glucosides in safflower
Discussion
Quinochalcone glucosides such as HSYA, carthamin are uniquely present and have been identified as active compounds in safflower. However, little is known about its biosynthesis. With the boom of transcriptome sequencing, high-throughput data and plant transgenic technology, it has become possible to verify the complex biosynthesis process of specialized metabolites in safflower.
CHS is the branch-point toward various flavonoids, which converts 1 p-coumaroyl-CoA and 3 malonyl-CoA into naringenin chalcone in previous studies. The detailed steps toward unique quinochalcone have not yet been proven. To elucidate the key genes of quinochalcone glucosides biosynthesis in safflower, CHS1 was focused to be a key gene taking part in quinochalcone glucosides biosynthesis in safflower through sequencing of a safflower floret cDNA library, analysis of subsequent microarray and overexpression of CtCHS1.
We cloned full length and ORF of CHS1 at the level of transcript and found that it shared 86.94% conserved residues with CHS from other plants. CtCHS1 was localized in cytoplasm which offering some clues for its functional characterization in the biological processes of plant. Junichi Shinozaki (Shinozaki et al., 2016) reported that 3 CHSs has a typical chalcone synthase activities in vitro in safflower. Nevertheless, the functions of CHSs in flavonid pathway were still largely unknown.
To verify the CHS1’s function in safflower, we firstly generated the transgenic safflower plant by Agrobacterium-mediated pollen-tube pathway method. We found that flavonoid gene family have different reactions responding to over-expression of CtCHS1.PAL2, PAL3, 4CL2, CHS4 and CHS6 are positive co-regulation factor with CHS1, while 4CL1, 4CL3, 4CL5, CHI2 and DFR1 are repressed responding to over-expression of CtCHS1. Meanwhile, over-expression of CtCHS1 has brought that quinochalcone glucosides (HSYA and carthamin) increasing apparently in the transgenic lines and the down-regulated flavonols aglycone and glucosides. This indicated that CtCHS1 starts a unique flux to modulate specially quinochalcone glucosides biosynthetic pathway.
Conclusion
This study demonstrates that overexpression of CtCHS1 increases the quinochalcone glucosides accumulation and decreases flavonols aglycones and glycosides contents in safflower for the first time. CtCHS1 takes part in quinochalcone biosynthetic pathway rather than flavonol. Surely, the numerous functional enzymes flowing to complex quinochalcone glucosides remain to be explored, including UDP-glycosyltransferase, transcription factors, cytochrome P450, etc. Our findings are instructive for understanding the characterization of the CHS genes aimed at elucidating the molecular mechanisms involved in quinochalcone biosynthesis. We will deeply study the relevant genes of regulating quinochalcone synthetic pathway by bioengineering methods to clarify chalcones synthesis in safflower.
Author Contributions
YX and DL clone the gene, BH and XJ contributed to the collection of plant sample and DNA and RNA extraction. MG and DG carried out the annotation of unigenes and gene chip data and wrote the manuscript. DG was responsible for qRT-PCR and bioinformatics analysis and metabolites data. XD analyzed the metabolites. MG designed the experiment and initiated the project. All the authors have read the final manuscript and approved the submission.
Funding
This work was supported by a grant from Natural Science Foundation of China (81173484 and 81473300), Shanghai Natural Science Foundation (13ZR1448200) and “863” High TechnologyProject (2008AA02Z137).
Conflict of Interest Statement
The authors declare that the research was conducted in the absence of any commercial or financial relationships that could be construed as a potential conflict of interest.
Acknowledgments
We thank Invitrogen Biotech Company (Shanghai, China) for carrying out the EST library analysis and ShanghaiBio Corporation (Shanghai, China) for assistance with Agilent gene data.
Supplementary Material
The Supplementary Material for this article can be found online at: http://journal.frontiersin.org/article/10.3389/fpls.2017.01409/full#supplementary-material
FIGURE S1 | Plasmid map.
FIGURE S2 |(A) Representative total ion chromatograms (TICs) in ESI negative ion mode based on UPLC-Q-TOFMS from WT, CK and OVX in safflower. (B) EICs of each 11 metabolites from WT, CK and OVX in safflower.
Footnotes
- ^www.ncbi.nlm.nih.gov
- ^www.expasy.org
- ^http://amigo.geneontology.org
- ^http://www.genscript.com/psort/wolf_psort.html
References
Alagna, F., D’Agostino, N., Torchia, L., Servili, M., Rao, R., Pietrella, M., et al. (2009). Comparative 454 pyrosequencing of transcripts from two olive genotypes during fruit development. BMC Genomics 10:399. doi: 10.1186/1471-2164-10-399
Cao, S., Zhou, X. R., Wood, C. C., Green, A. G., Singh, S. P., Liu, L., et al. (2013). A large and functionally diverse family of Fad2 genes in safflower (Carthamus tinctorius L.). BMC Plant Biol. 13:5. doi: 10.1186/1471-2229-13-5
Dehghan, S., Sadeghi, M., Poppel, A., Fischer, R., Lakes-Harlan, R., Kavousi, H. R., et al. (2014). Differential inductions of phenylalanine ammonia-lyase and chalcone synthase during wounding, salicylic acid treatment, and salinity stress in safflower, Carthamus tinctorius. Biosci. Rep. 34:e00114. doi: 10.1042/BSR20140026
Eisen, M. B., Spellman, P. T., Brown, P. O., and Botstein, D. (1998). Cluster analysis and display of genome-wide expression patterns. Proc. Natl. Acad. Sci. U.S.A. 95, 14863–14868. doi: 10.1073/pnas.95.25.14863
El-Wakeil, N. E. (2013). Botanical pesticides and their mode of action. Gesunde Pflanzen 65, 125–149. doi: 10.1007/s10343-013-03083
Gentleman, R. C., Carey, V. J., Bates, D. M., Bolstad, B., Dettling, M., Dudoit, S., et al. (2004). Bioconductor: open software development for computational biology and bioinformatics. Genome Biol. 5:R80. doi: 10.1186/gb-2004-5-10-r80
Giannasi, D. E. (1978). Systematic aspects of flavonoid biosynthesis and evolution. Bot. Rev. 44, 399–429. doi: 10.1007/bf02860845
Guo, D.-D., Liu, F., Tu, Y.-H., He, B.-X., Gao, Y., and Guo, M.-L. (2016). Expression patterns of three UGT genes in different chemotype safflower lines and under MeJA stimulus revealed their potential role in flavonoid biosynthesis. PLoS ONE 11:e0158159. doi: 10.1371/journal.pone.0158159
Gutha, L. R., Casassa, L. F., Harbertson, J. F., and Naidu, R. A. (2010). Modulation of flavonoid biosynthetic pathway genes and anthocyanins due to virus infection in grapevine (Vitis vinifera L.) leaves. BMC Plant Biol. 10:187. doi: 10.1186/1471-2229-10-187
Hao, J., Niu, Y., Yang, B., Gao, F., Zhang, L., Wang, J., et al. (2011). Transformation of a marker-free and vector-free antisense ACC oxidase gene cassette into melon via the pollen-tube pathway. Biotechnol. Lett. 33, 55–61. doi: 10.1007/s10529-010-03982
Horton, P., Park, K. J., Obayashi, T., Fujita, N., Harada, H., Adams-Collier, C. J., et al. (2007). WoLF PSORT: protein localization predictor. Nucleic Acids Res. 35, W585–W587. doi: 10.1093/nar/gkm259
Larkin, M. A., Blackshields, G., Brown, N. P., Chenna, R., McGettigan, P. A., McWilliam, H., et al. (2007). Clustal W and Clustal X version 2.0. Bioinformatics 23, 2947–2948. doi: 10.1093/bioinformatics/btm404
Li, H., Dong, Y., Yang, J., Liu, X., Wang, Y., Yao, N., et al. (2012). De novo transcriptome of safflower and the identification of putative genes for oleosin and the biosynthesis of flavonoids. PLoS ONE 7:e30987. doi: 10.1371/journal.pone.0030987
Li, R., Guo, M., Zhang, G., Xu, X., and Li, Q. (2006). Neuroprotection of nicotiflorin in permanent focal cerebral ischemia and in neuronal cultures. Biol. Pharm. Bull. 29, 1868–1872. doi: 10.1248/bpb.29.1868
Mare, C., Mazzucotelli, E., Crosatti, C., Francia, E., Stanca, A. M., and Cattivelli, L. (2004). Hv-WRKY38: a new transcription factor involved in cold- and drought-response in barley. Plant Mol. Biol. 55, 399–416. doi: 10.1007/s11103-004-0906-7
National Pharmacopoeia Committee (2010). Pharmacopoeia of People Republic of China, Vol. 2. Beijing: China Medicinal Science and Technology Press.
Odell, J. T., Nagy, F., and Chua, N. H. (1985). Identification of DNA sequences required for activity of the cauliflower mosaic virus 35S promoter. Nature 313, 810–812. doi: 10.1038/313810a0
Ortuño, A., Báidez, A., Gómez, P., Arcas, M. C., Porras, I., García-Lidón, A., et al. (2006). Citrus paradisi and Citrus sinensis flavonoids: their influence in the defence mechanism against Penicillium digitatum. Food Chem. 98, 351–358. doi: 10.1016/j.foodchem.2005.06.017
Rama Reddy, N. R., Mehta, R. H., Soni, P. H., Makasana, J., Gajbhiye, N. A., Ponnuchamy, M., et al. (2015). Next generation sequencing and transcriptome analysis predicts biosynthetic pathway of sennosides from Senna (Cassia angustifolia Vahl.), a non-model plant with potent laxative properties. PLoS ONE 10:e0129422. doi: 10.1371/journal.pone.0129422
Sadeghi, M., Dehghan, S., Fischer, R., Wenzel, U., Vilcinskas, A., Kavousi, H. R., et al. (2013). Isolation and characterization of isochorismate synthase and cinnamate 4-hydroxylase during salinity stress, wounding, and salicylic acid treatment in Carthamus tinctorius. Plant Signal. Behav. 8:e27335. doi: 10.4161/psb.27335
Sankari, S. L., Babu, N. A., Rani, V., Priyadharsini, C., and Masthan, K. M. (2014). Flavonoids - clinical effects and applications in dentistry: a review. J. Pharm. Bioallied Sci. 6(Suppl. 1), S26–S29. doi: 10.4103/0975-7406.137256
Shinozaki, J., Kenmoku, H., Nihei, K., Masuda, K., Noji, M., Konno, K., et al. (2016). Cloning and functional analysis of three chalcone synthases from the flowers of safflowers Carthamus tinctorius. Nat. Prod. Commun. 11, 787–790.
Steinkellner, S., Lendzemo, V., Langer, I., Schweiger, P., Khaosaad, T., Toussaint, J. P., et al. (2007). Flavonoids and strigolactones in root exudates as signals in symbiotic and pathogenic plant-fungus interactions. Molecules 12, 1290–1306. doi: 10.3390/12071290
Tamura, K., Peterson, D., Peterson, N., Stecher, G., Nei, M., and Kumar, S. (2011). MEGA5: molecular evolutionary genetics analysis using maximum likelihood, evolutionary distance, and maximum parsimony methods. Mol. Biol. Evol. 28, 2731–2739. doi: 10.1093/molbev/msr121
Tanaka, Y., and Brugliera, F. (2013). Flower colour and cytochromes P450. Philos. Trans. R. Soc. Lond. B Biol. Sci. 368:20120432. doi: 10.1098/rstb.2012.0432
Tu, Y., Liu, F., Guo, D., Fan, L., Zhu, Z., Xue, Y., et al. (2016). Molecular characterization of flavanone 3-hydroxylase gene and flavonoid accumulation in two chemotyped safflower lines in response to methyl jasmonate stimulation. BMC Plant Biol 16:132. doi: 10.1186/s12870-016-0813-5
Tu, Y., Xue, Y., Guo, D., Sun, L., and Guo, M. (2015). Carthami flos: a review of its ethnopharmacology, pharmacology and clinical applications. Rev. Bras. de Farmacognosia 25, 553–566. doi: 10.1016/j.bjp.2015.06.001
Wang, M., Zhang, B., and Wang, Q. (2013). Cotton transformation via pollen tube pathway. Methods Mol. Biol. 958, 71–77. doi: 10.1007/978-1-62703-212-4_6
Winkel-Shirley, B. (2002). Biosynthesis of flavonoids and effects of stress. Curr. Opin. Plant Biol. 5, 218–223. doi: 10.1016/S1369-5266(02)00256-X
Yang, A., Su, Q., An, L., Liu, J., Wu, W., and Qiu, Z. (2009). Detection of vector- and selectable marker-free transgenic maize with a linear GFP cassette transformation via the pollen-tube pathway. J. Biotechnol. 139, 1–5. doi: 10.1016/j.jbiotec.2008.08.012
Keywords: safflower, EST sequences, gene expression microarray, CHS, HSYA, transgenic safflower, quinochalcone biosynthesis
Citation: Guo D, Xue Y, Li D, He B, Jia X, Dong X and Guo M (2017) Overexpression of CtCHS1 Increases Accumulation of Quinochalcone in Safflower. Front. Plant Sci. 8:1409. doi: 10.3389/fpls.2017.01409
Received: 02 May 2017; Accepted: 31 July 2017;
Published: 15 August 2017.
Edited by:
Shucai Wang, Northeast Normal University, ChinaReviewed by:
Guoyin Kai, Shanghai Normal University, ChinaAlberto A. Iglesias, National University of the Littoral, Argentina
Copyright © 2017 Guo, Xue, Li, He, Jia, Dong and Guo. This is an open-access article distributed under the terms of the Creative Commons Attribution License (CC BY). The use, distribution or reproduction in other forums is permitted, provided the original author(s) or licensor are credited and that the original publication in this journal is cited, in accordance with accepted academic practice. No use, distribution or reproduction is permitted which does not comply with these terms.
*Correspondence: Xin Dong, dongxinsmmu@126.com Meili Guo, mlguo@126.com