 Amidou N’Diaye
 Jemanesh K. Haile1
- 1Department of Plant Sciences, Crop Development Centre, University of Saskatchewan, Saskatoon, SK, Canada
- 2International Maize and Wheat Improvement Center (CIMMYT), Texcoco, Mexico
Advances in sequencing and genotyping methods have enable cost-effective production of high throughput single nucleotide polymorphism (SNP) markers, making them the choice for linkage mapping. As a result, many laboratories have developed high-throughput SNP assays and built high-density genetic maps. However, the number of markers may, by orders of magnitude, exceed the resolution of recombination for a given population size so that only a minority of markers can accurately be ordered. Another issue attached to the so-called ‘large p, small n’ problem is that high-density genetic maps inevitably result in many markers clustering at the same position (co-segregating markers). While there are a number of related papers, none have addressed the impact of co-segregating markers on genetic maps. In the present study, we investigated the effects of co-segregating markers on high-density genetic map length and marker order using empirical data from two populations of wheat, Mohawk × Cocorit (durum wheat) and Norstar × Cappelle Desprez (bread wheat). The maps of both populations consisted of 85% co-segregating markers. Our study clearly showed that excess of co-segregating markers can lead to map expansion, but has little effect on markers order. To estimate the inflation factor (IF), we generated a total of 24,473 linkage maps (8,203 maps for Mohawk × Cocorit and 16,270 maps for Norstar × Cappelle Desprez). Using seven machine learning algorithms, we were able to predict with an accuracy of 0.7 the map expansion due to the proportion of co-segregating markers. For example in Mohawk × Cocorit, with 10 and 80% co-segregating markers the length of the map inflated by 4.5 and 16.6%, respectively. Similarly, the map of Norstar × Cappelle Desprez expanded by 3.8 and 11.7% with 10 and 80% co-segregating markers. With the increasing number of markers on SNP-chips, the proportion of co-segregating markers in high-density maps will continue to increase making map expansion unavoidable. Therefore, we suggest developers improve linkage mapping algorithms for efficient analysis of high-throughput data. This study outlines a practical strategy to estimate the IF due to the proportion of co-segregating markers and outlines a method to scale the length of the map accordingly.
Introduction
Genetic maps also known as linkage maps are constructed for several purposes (see Semagn et al., 2006 for a review). In particular, genetic maps:
– Allow identifying genomic regions that control the expression of qualitative and quantitative trait loci (QTL) (Mohan et al., 1997; Doerge, 2002; Yim et al., 2002).
– Help in marker-assisted selection by facilitating the introgression of desirable QTL.
– Allow phylogenetic analyses between different species for evaluating similarity between genes (Ahn and Tanksley, 1993; Paterson et al., 2000).
– Help in the identification of chromosomal rearrangements (Tanksley et al., 1992; Agresti et al., 2000; Bansal et al., 2007).
– Help in anchoring physical maps (Yim et al., 2002).
– Facilitate de novo genome assembly and validation by enabling the identification of chimeric scaffold constructs (Rastas et al., 2013; Fierst, 2015).
– Where high-density maps are required, constitute the first step toward positional or map-based cloning of genes responsible for economically important traits, (Mohan et al., 1997; Vuylsteke et al., 1999).
Genetic maps indicate the position and relative genetic distances between markers along chromosomes, which is analogous to signs or landmarks along a highway where the genes are “houses” (Paterson, 1996; Collard et al., 2005). Genetic maps are constructed using different types and sizes of mapping populations, laboratory techniques, marker systems, mapping strategies, statistical procedures and computer packages. These factors can affect the efficiency of the mapping process (Liu, 1998; Paterson et al., 2000). Map length and marker orders are impacted by various factors, including the type and size of the population (Ferreira et al., 2006), the type of markers (dominant or codominant), genotyping or scoring errors, distortion segregation (Hackett and Broadfoot, 2003; Oliveira et al., 2004) and the frequency of double recombinants.
Advances in sequencing and genotyping technologies have enabled the massive production of single nucleotide polymorphism (SNP) markers in a cost-effective way, making SNP markers the choice for linkage mapping. As a result, many laboratories have developed high-throughput SNP assays with continuously increasing marker numbers. For wheat, there are the 9K (Cavanagh et al., 2013), the 90K (Wang et al., 2014) and the 820K (Winfield et al., 2016) SNP assays. Similar efforts have been made for other crops, including rice with the RICE6K (Yu et al., 2014) and the RiceSNP50 (Chen H. et al., 2014), and maize with the MaizeSNP50 (Ganal et al., 2011) and the 600K (Unterseer et al., 2014).
Indeed, a high number of markers are needed to build high-density genetic maps that are suitable for positional or map-based cloning of genes. However, the disproportion between the high number of markers and the relatively small population size, the so-called ‘large p, small n’ problem, markedly impact the resolution of recombination so that only a minority of markers can be actually ordered (Ronin et al., 2010). On the other hand, high-density genetic maps usually result in many markers clustering at the same position (co-segregating markers) on the linkage map; e.g., (Liu et al., 2013; Iehisa et al., 2014; Talukder et al., 2014; Zhou et al., 2015; Di Pierro et al., 2016; Liu Z. et al., 2016; Ren et al., 2016; Tyrka et al., 2016). In spite of the availability of several papers on genetic mapping, specific studies related to the impact of high throughput SNP data on genetic maps have not yet been conducted. It is therefore timely to consider how the increasing number of markers can impact genetic map features in the era of high throughput sequencing technologies.
Machine learning (ML) is the study of data-driven, computational methods for making inferences and predictions (Breiman, 2001b) and may be seen as the intersection of Computer Science and Statistics (Cunningham, 1995). ML methods have been applied in diverse fields, including face recognition, speech processing (e.g., Google voice, Apple’s Siri), prediction of consumers preferences (e.g., Netflix movie recommender system), text mining (Witten and Eibe, 2005), bioinformatics [e.g., drug design and genome annotation (Yip et al., 2013) or transcription networks (Li et al., 2006)], cell biology (Sommer and Gerlich, 2013), medical diagnosis (Kukar and Groselj, 2005) and disease tissue classification in medicine (Guyon et al., 2002; Zacharaki et al., 2009). Due to their high generalization capabilities and distribution-free properties, ML algorithms are presented as a valuable alternative to traditional statistical techniques (Maenhout et al., 2010). Moreover, ML algorithms can deal with heterogeneity of the data, redundancy and presence of interactions and non-linearity (Ornella et al., 2012).
In animal and crop breeding, ML algorithms have been widely used in the framework of genomic selection (GS), e.g., (Bernardo and Yu, 2007; Goddard and Hayes, 2007; Gianola and van Kaam, 2008; Gonzales-Recio et al., 2008; Jannink et al., 2010; Heslot et al., 2012; Grinberg et al., 2016). GS (Meuwissen et al., 2001) uses all available DNA marker information across the genome to estimate genetic values (Bernardo, 2008; Jannink et al., 2010) for improved selection of quantitative trait. GS uses a training population (set of individuals having genotypic and phenotypic data) to develop a model to predict genomic estimated breeding values (GEBVs) of non-phenotyped individuals. There is an increasing interest in ML for use in other aspects of crop breeding, including high throughput phenotyping (Mahlein, 2015; Singh et al., 2016; Wahabzada et al., 2016) and determining the most important features that contribute to agronomic traits of interest (Ornella et al., 2012; Shaik and Ramakrishna, 2014; Shekoofa et al., 2014).
The objective of our study is to investigate the effects of co-segregating markers on high-density genetic map length and marker order using empirical data from durum and bread wheat. Ultimately, we aim to predict the inflation factor (IF) of the linkage maps, using ML algorithms.
Materials and Methods
Plant Material
Two doubled haploid mapping populations described elsewhere were used in this study: the durum wheat Mohawk × Cocorit (Maccaferri et al., 2014) and the bread wheat Norstar × Cappelle Desprez (Fowler et al., 2016). The Mohawk × Cocorit and Nortar × Cappelle Desprez populations consisted of 177 and 256 lines, respectively.
Genotyping
As described in earlier publications (Maccaferri et al., 2014; Fowler et al., 2016), DNA of the mapping populations was extracted from young leaves using the DNeasy 96 Plant Kit (QIAGEN Science, Germantown, MD, United States). DNA was quantified using NanoDrop ND-1000 UV-vis spectrophotometer (Thermo Fisher Scientific Inc., Madison, WI, United States). Genotyping was performed at the Crop Development Centre, University of Saskatchewan using the Illumina Infinium wheat 90K iSelect assay (Illumina Inc., San Diego, CA, United States) as reported previously (Wang et al., 2014). The raw intensity data were processed with the GenomeStudio v2011.1 software (Illumina). Genotypic data were curated to correct for scoring errors, filter out monomorphic and highly distorted markers according to the expected 1:1 ratio for DH populations using chi-square (χ2) test as implemented in the MapDisto software (Lorieux, 2012).
Mapping Procedure
Our approach consisted of two phases with the following steps:
Phase I
– For each population, all curated SNP data was used to build linkage maps using the MSTMap software (Wu et al., 2008) with a stringent cut off p-value of 1E-10 and a maximum distance between markers of 15.0 cM for clustering SNPs into linkage groups (LGs). Double recombinants were corrected using the functions ‘Show double recombinants,’ ‘Show error candidates’ and ‘Replace error candidates by flanking genotype’ as implemented in the MapDisto software (Lorieux, 2012). The LGs were assigned to chromosomes based on existing high-density SNP maps (Cavanagh et al., 2013; Maccaferri et al., 2014; Wang et al., 2014).
– For each LG, a skeleton map was built by keeping only one of the most informative (highest polymorphism information content, lowest number of missing data) markers randomly selected per cluster (group of markers located at the same position).
– Then, using an in-house Ruby script, we built as many maps (hereafter referred to sequential maps) as there were co-segregating markers on each LG (see step 1) by adding one marker at a time (one after another), selected randomly from the list of co-segregating markers.
Phase II
– Because LGs had different sizes and the number of co-segregating markers varied among them, we computed the proportions of co-segregating markers relative to the total number of markers on each LG.
– Eight levels of proportion, ranging from 10 to 80% were sampled for all LGs having ≥80% of co-segregating markers.
– Each proportion level had 50 replicates. For example, for LG 1A we randomly selected 10% of co-segregating markers 50 times to build 50 ‘sequential’ maps. Then, we repeated the same process for 20, 30, 40, 50, 60, 70, and 80% of co-segregating markers. However, LGs 2A, 4A and 5A in Mohawk × Cocorit and 1D, 4D and 7D in Norstar × Cappelle Desprez had less than 80% of co-segregating markers and only six proportion levels (10–60%) with 20 replicates were used.
– The length of these sequential maps and markers order were compared to those of the skeleton map.
– Finally, for each sequential map the IF was estimated as:
IF = ((Lseq – Lsket)/ Lsket) ∗ 100,
Lseq and Lsket being the length of the sequential map and the skeleton map, respectively.
Prediction
Seven ML algorithms implemented in the Caret R package (Kuhn et al., 2012) were used to predict the inflation of the map lengths relative to the proportion of co-segregating markers:
– Linear regression model (LR): LR was developed in the field of statistics, but has been borrowed by ML. The LR algorithm is a family of model-based learning approaches that assume a linear relationship between the input variables (x) and the single output variable (y). The LR equation is built and trained, using different techniques, the most common of which is called Ordinary Least Squares (OLS). The OLS is a method for estimating the unknown parameters in a LR while minimizing the sum of the squares of the differences between the observed responses (values of the variable being predicted) in the given dataset and those predicted by a linear function of a set of explanatory variables.
– Generalized linear model (GLM): The GLM provides flexible generalization of ordinary linear regression for response variables with error distribution models other than a Gaussian (normal) distribution. GLM unifies various other statistical models, including binomial, gamma, Poisson and logistic regression. Each serves a different purpose, and depending on distribution and link function, GLM can be used for prediction or classification.
– Polynomial regression with degree 2 (POLY2) and 3 (POLY3): Polynomial regression is a form of linear regression in which the relationship between the input variables (x) and the output variable (y) is modeled as a polynomial. Although polynomial regression fits a non-linear model to the data, it is considered as a special case of multiple linear regression since it is linear in the regression coefficients. We only tried quadratic (POLY2) and cubic (POLY3) models to avoid overfitting.
– K-nearest neighbors (KNN): The KNN algorithm is an instance-based learning where new data are classified based on stored, labeled instances. The rationale behind the KNN algorithm is learning by analogy. The distance between the stored data and the new instance is calculated using similarity measures such as the Euclidean distance, cosine similarity or the Manhattan distance. The similarity value is used to perform predictive modeling for classification or regression. In both cases, the input consists of the k closest training examples in the feature space. For classification, the output is a class membership while for regression, it is the property value for the object. This value is the average of the values of its k nearest neighbors.
– Support vector machine (SVM) (Vapnik, 1995): SVM uses a non-linear mapping function to map samples from the predictor space to a high-dimensional feature space and perform linear regression in the latter space (Witten and Frank, 2005).
– Classification and regression trees (CART) (Breiman et al., 1984): CART is a decision tree algorithm for both classification and regression. It is a recursive algorithm, which partitions the training data set by doing binary splits. In their simplest form, decision tree algorithms are hierarchical if-else statements that can be applied to predict a result based upon data. The if-else statements are chosen to maximize a notion of information gain and reduce the variability in the underlying (two) children nodes. In contrast with general tree-based methods that may allow multiple child nodes, CART always creates a binary tree. A large tree is first generated, then pruned to a size that has the lowest cross-validation estimate of error (Loh, 2014).
– Random forest (RF) (Breiman, 2001a): RF is an ensemble algorithm based on randomized regression trees. In RF, each tree is built from a sample drawn with replacement (i.e., a bootstrap sample) from the training set. Each tree individually predicts the target response and the ‘forest’ (i.e., the ensembles of ‘trees’) predicts the target response as an average of individual tree predictions.
To evaluate the map expansion, only maps generated using different proportion levels (10–80%) of co-segregating markers were used, 4800 and 7580 maps for Mohawk × Cocorit and Norstar × Cappelle Desprez, respectively. Two types of partition designs were used to build the prediction models. In the first partition design, the whole set of sequential maps for each population was split into training and test sets containing 80 and 20% of the maps, respectively. The second partition design was a 10-fold cross-validation scheme with 5 replicates (Kohavi, 1995). The data was divided into 10 sets to which maps were assigned randomly so that all sets consisted of equal number of maps. One subset (testing set) was omitted to test the predictive ability of the model, whereas the other nine subsets were used as training samples (training set) to estimate model parameters. During cross-validation runs, each of the 10 subsets served as a testing set in one round, with missing values.
The models were fitted using the training sample, and the fitted models were used to predict outcomes in the test set. The goodness-of-fit of the models was evaluated using the root mean square error (RSME). The prediction accuracy was estimated as a Pearson correlation between the predicted and the observed map length in the test set.
Results
Description of the Linkage Maps
A total 24,473 linkage maps were built for this study: 8,203 maps for Mohawk × Cocorit and 16,270 maps for Norstar × Cappelle Desprez populations.
The features of Mohawk × Cocorit and Norstar × Cappelle Desprez maps that were built in step 1 of phase I are presented in Table 1 and Table 2, respectively. For Mohawk × Cocorit, the map using the whole curated data set consisted of 3,999 SNPs spanning 2421.1 cM. Markers were distributed on the 14 chromosomes of the durum wheat genome. The number of markers per chromosome varied from 76 (chromosome 4A) to 529 (chromosome 6B). In total, 85% (3,389/3,999) of the markers co-segregated across the genome. The proportion of co-segregating markers of genome A was lower than that of genome B (81 vs. 87%).
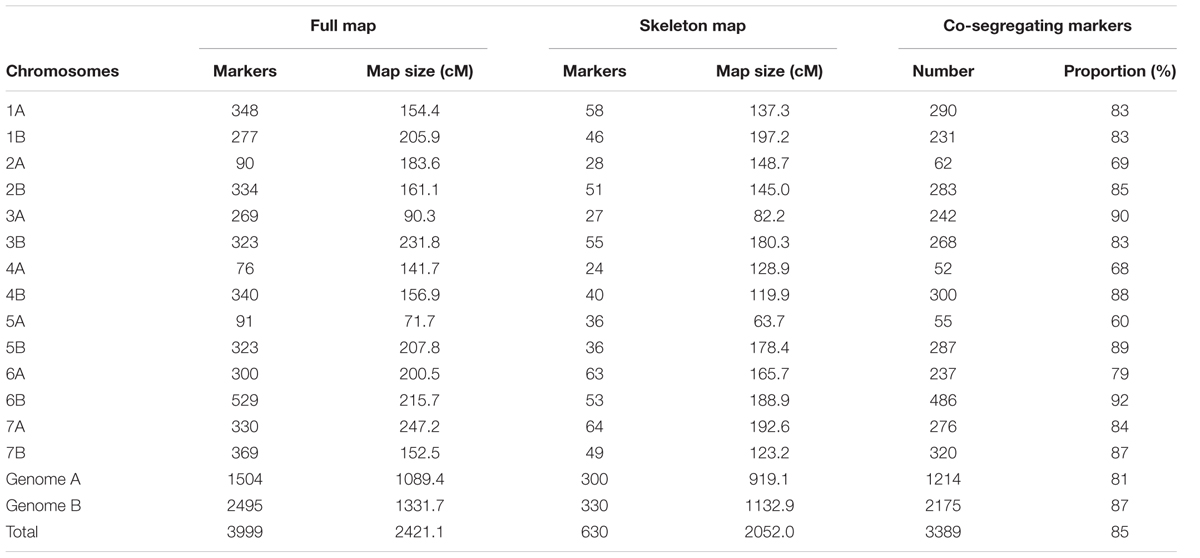
TABLE 1. Features of the Mohawk × Cocorit linkage map.
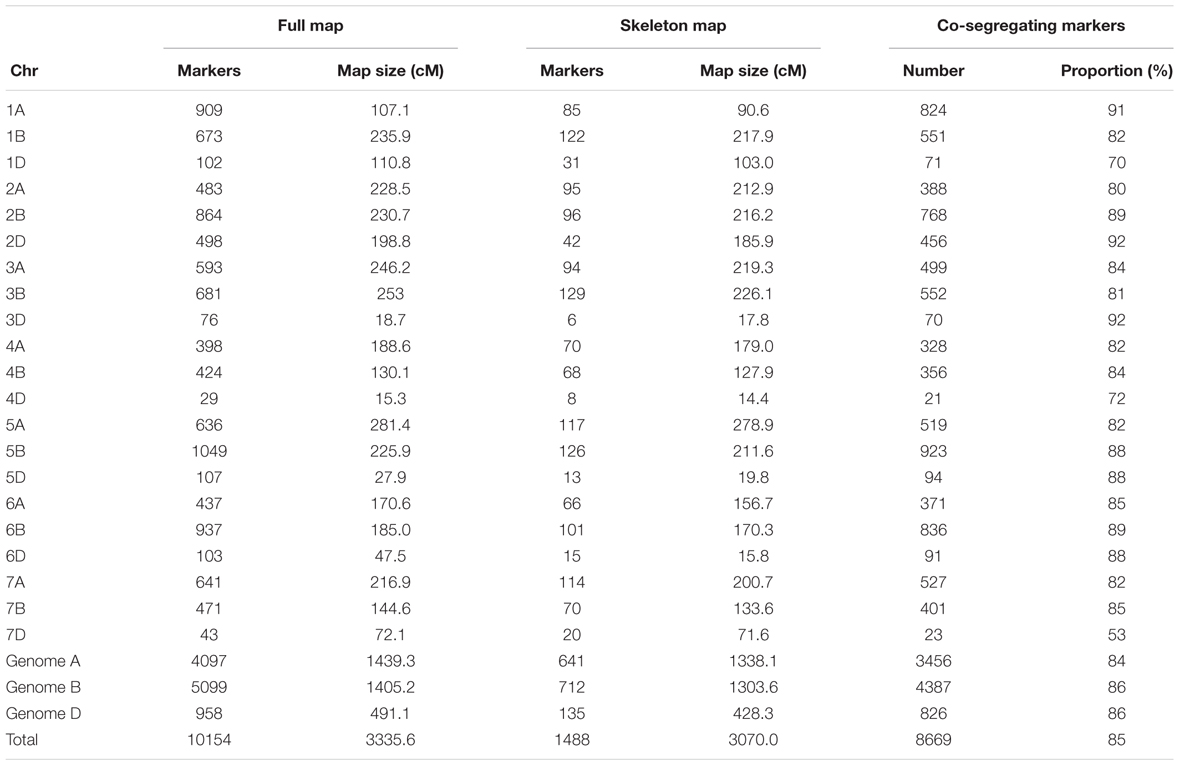
TABLE 2. Features of the Norstar × Cappelle Desprez linkage map.
For Norstar × Cappelle Desprez, 10,154 markers spanning 3335.6 cM were mapped on the 21 chromosomes of the bread wheat genome. The genome-wide proportion of co-segregating markers was 85% (8,669/10,154), ranging from 53 (chromosome 7D) to 92% (chromosomes 2D and 3D). Genome A displayed 84% of co-segregating markers while genomes B and D showed 86% of co-segregating markers.
Markers order analysis revealed a very high collinearity between sequential maps and the skeleton map for all chromosomes in both Mohawk × Cocorit and Norstar × Cappelle Desprez (Table 3). The average Spearman correlation coefficient ranged from 0.94 to 0.99 and 0.97 to 0.99 for Mohawk × Cocorit and Norstar × Cappelle Desprez, respectively.
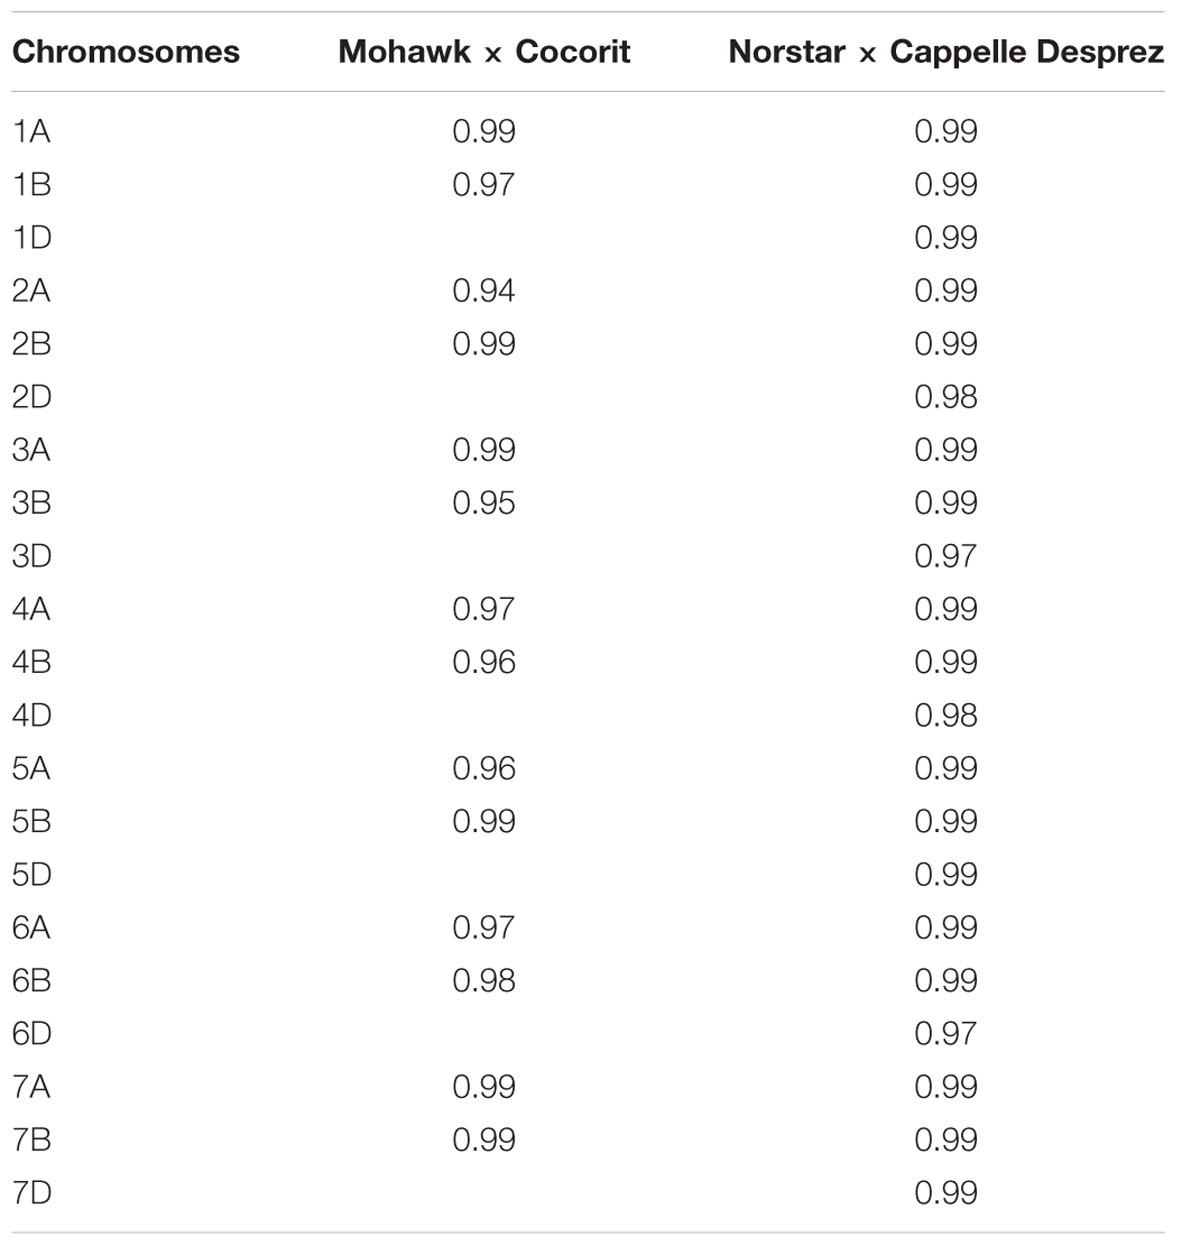
TABLE 3. Spearman correlation coefficient of markers order between sequential maps and skeleton map in Mohawk × Cocorit and Norstar × Cappelle Desprez.
Maps Expansion
The length of the sequential maps expanded in proportion to the co-segregating markers for both Mohawk × Cocorit (Figure 1) and Norstar × Cappelle Desprez (Figure 2). For a given proportion of co-segregating markers genome-wide, there was a relatively wide range variation of the IF, e.g., with 80% co-segregating markers IF ranged from 8 to 25% and 7 to 21% in Mohawk × Cocorit and Norstar × Cappelle Desprez, respectively.
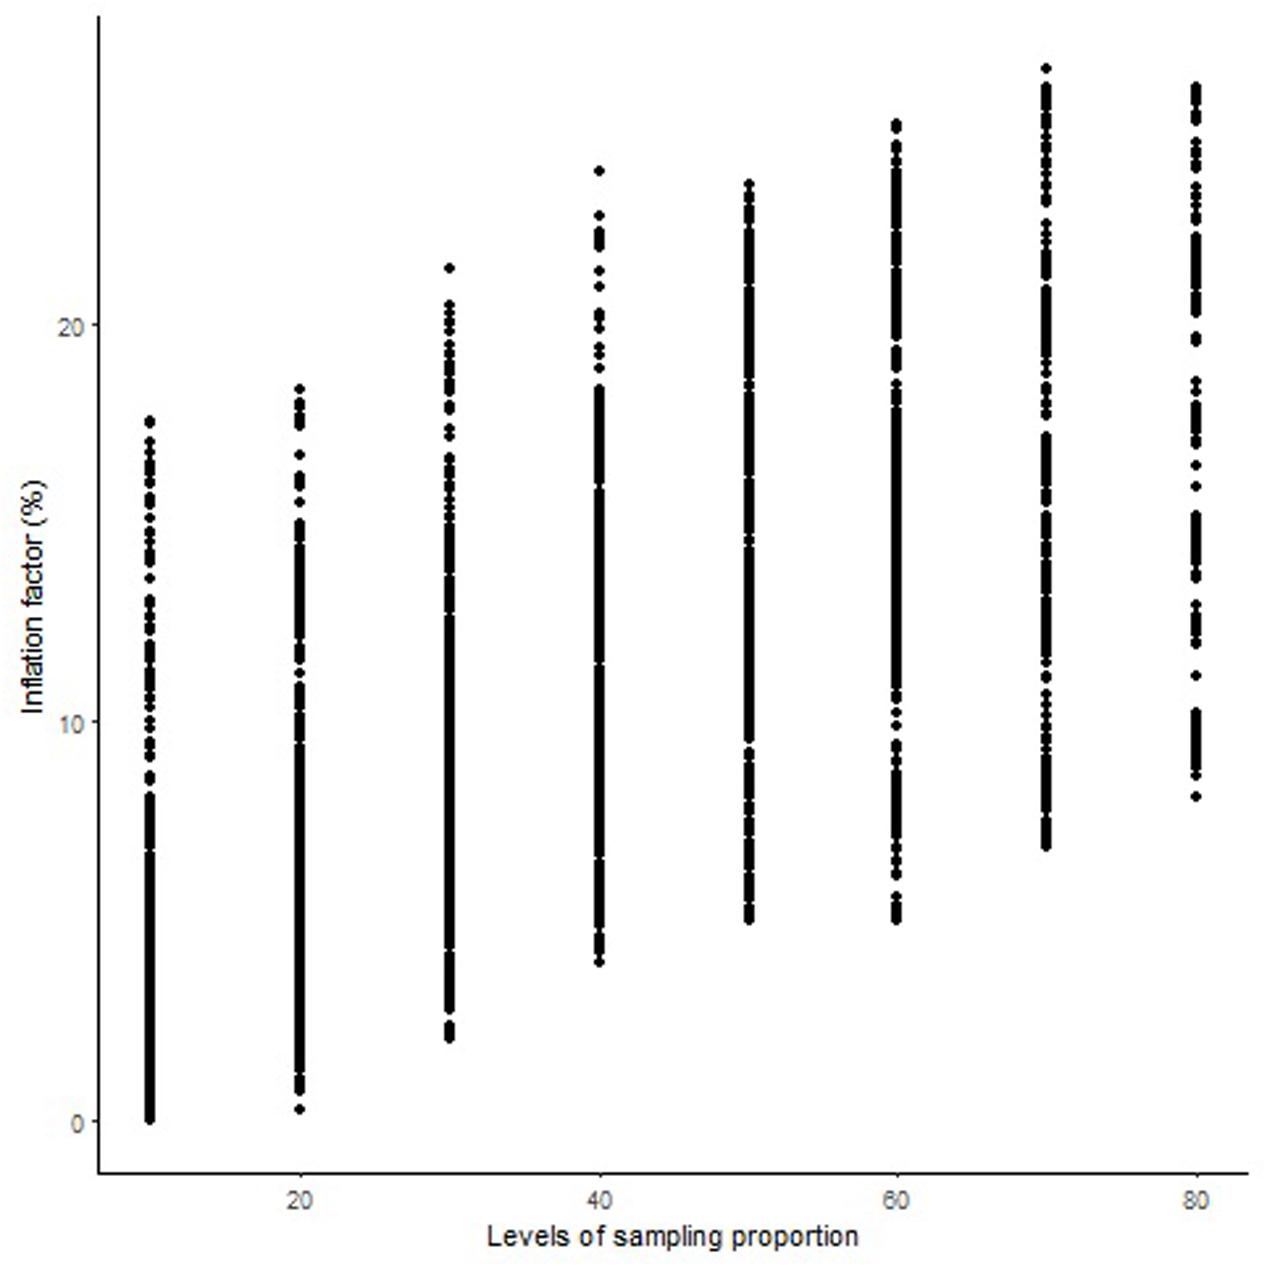
FIGURE 1. Genome-wide pattern of map length inflation factor in the Mohawk × Cocorit population.
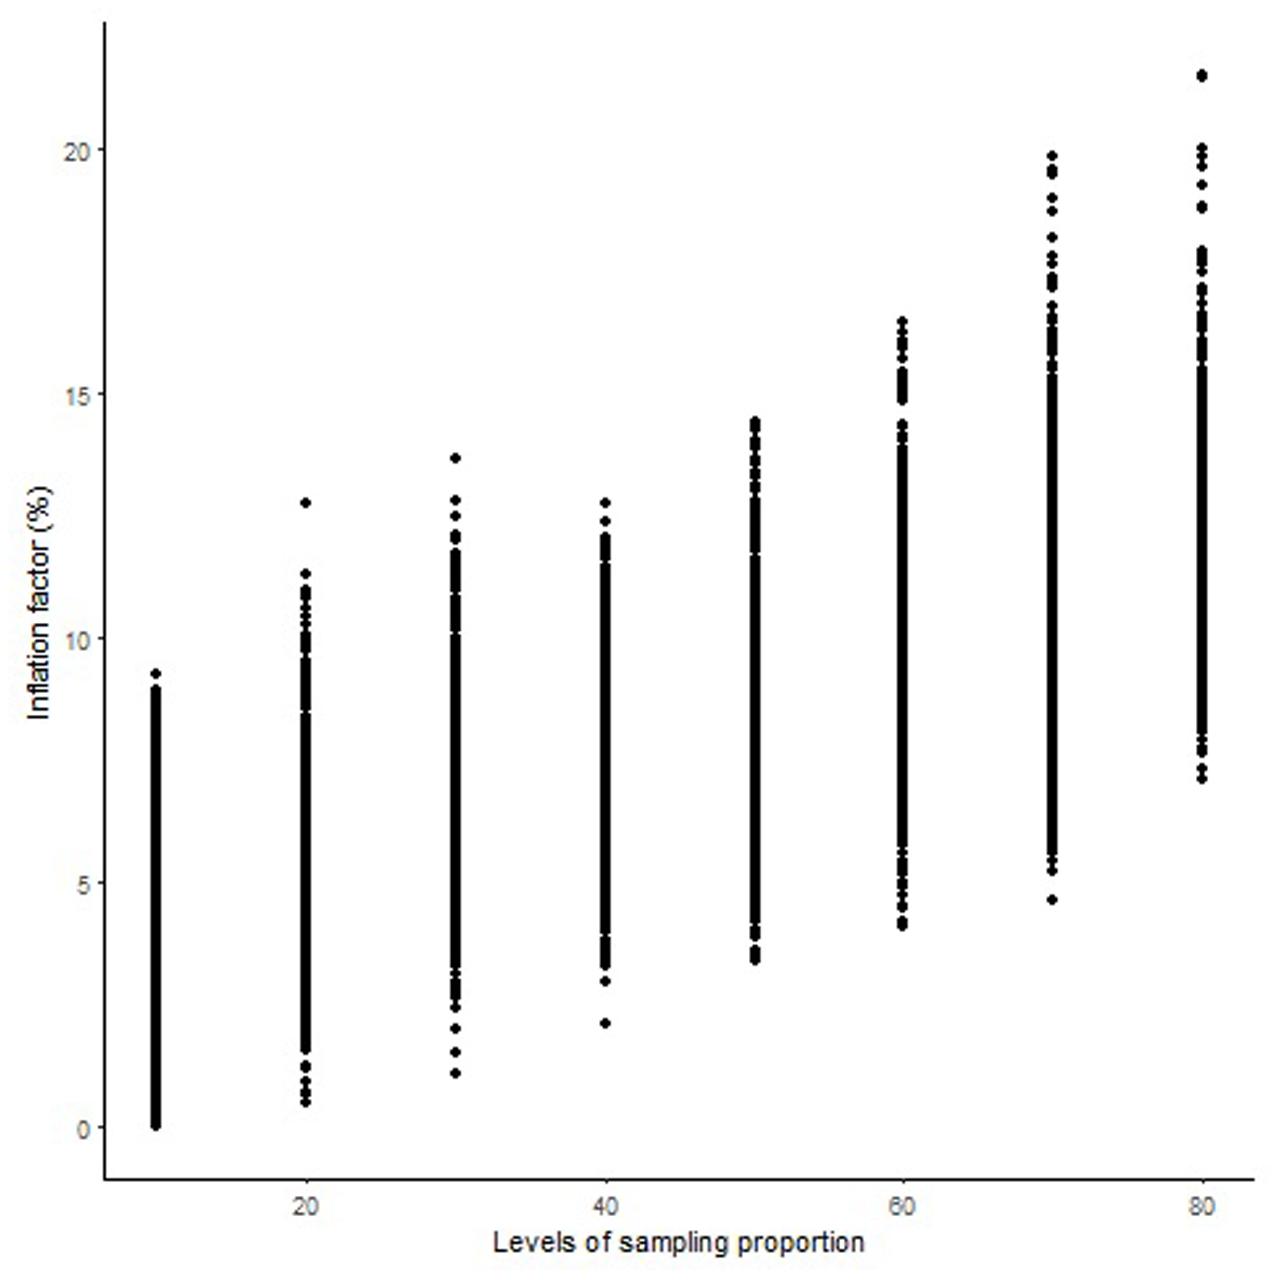
FIGURE 2. Genome-wide pattern of map length inflation factor in the Norstar × Cappelle Desprez population.
The overall variation in IF was similar among genomes in Mohawk × Cocorit (Figure 3) and Norstar × Cappelle Desprez (Figure 4). However, a few outliers were observed in genomes A and D in Norstar × Cappelle Desprez. Despite of the relatively wide variation of IF within chromosome, the higher proportion of co-segregating markers the larger the IF for both Mohawk × Cocorit (Figure 5) and Norstar × Cappelle Desprez (Figure 6). For example in Mohawk × Cocorit, the average IF on chromosome 3B for 10, 50, and 80% of co-segregating markers was 2.1, 12.7, and 21.6%, respectively. Similarly, in Norstar × Cappelle Desprez the average IF on 3B for 10, 50, and 80% of co-segregating markers was 3.6, 9.8, and 11.8%, respectively.
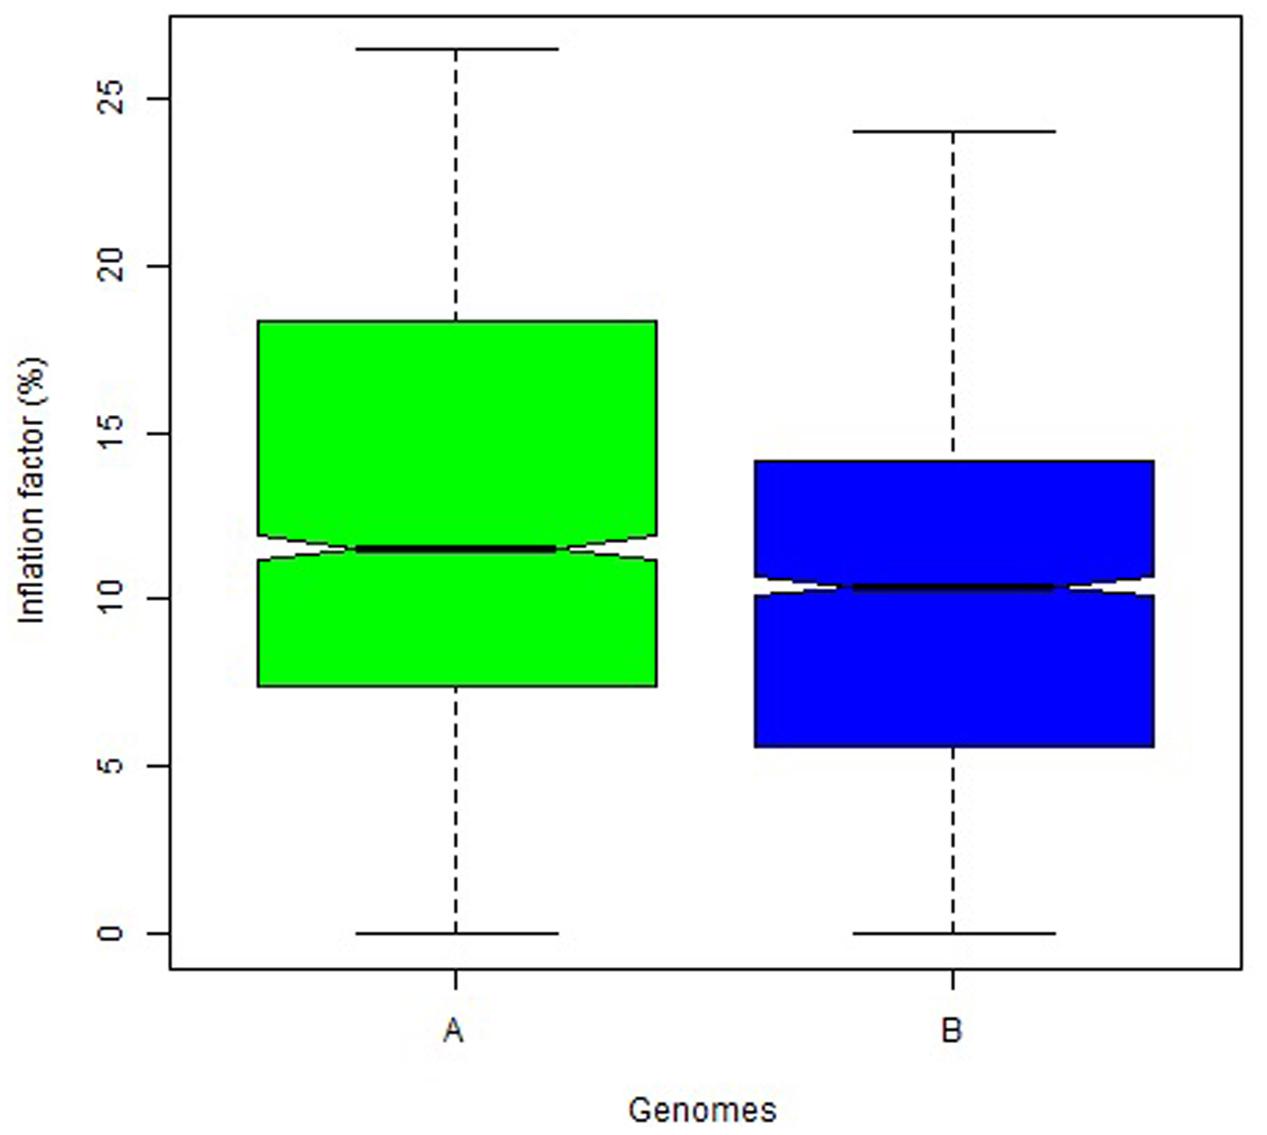
FIGURE 3. Boxplot of map length inflation factor per genome in the Mohawk × Cocorit population.
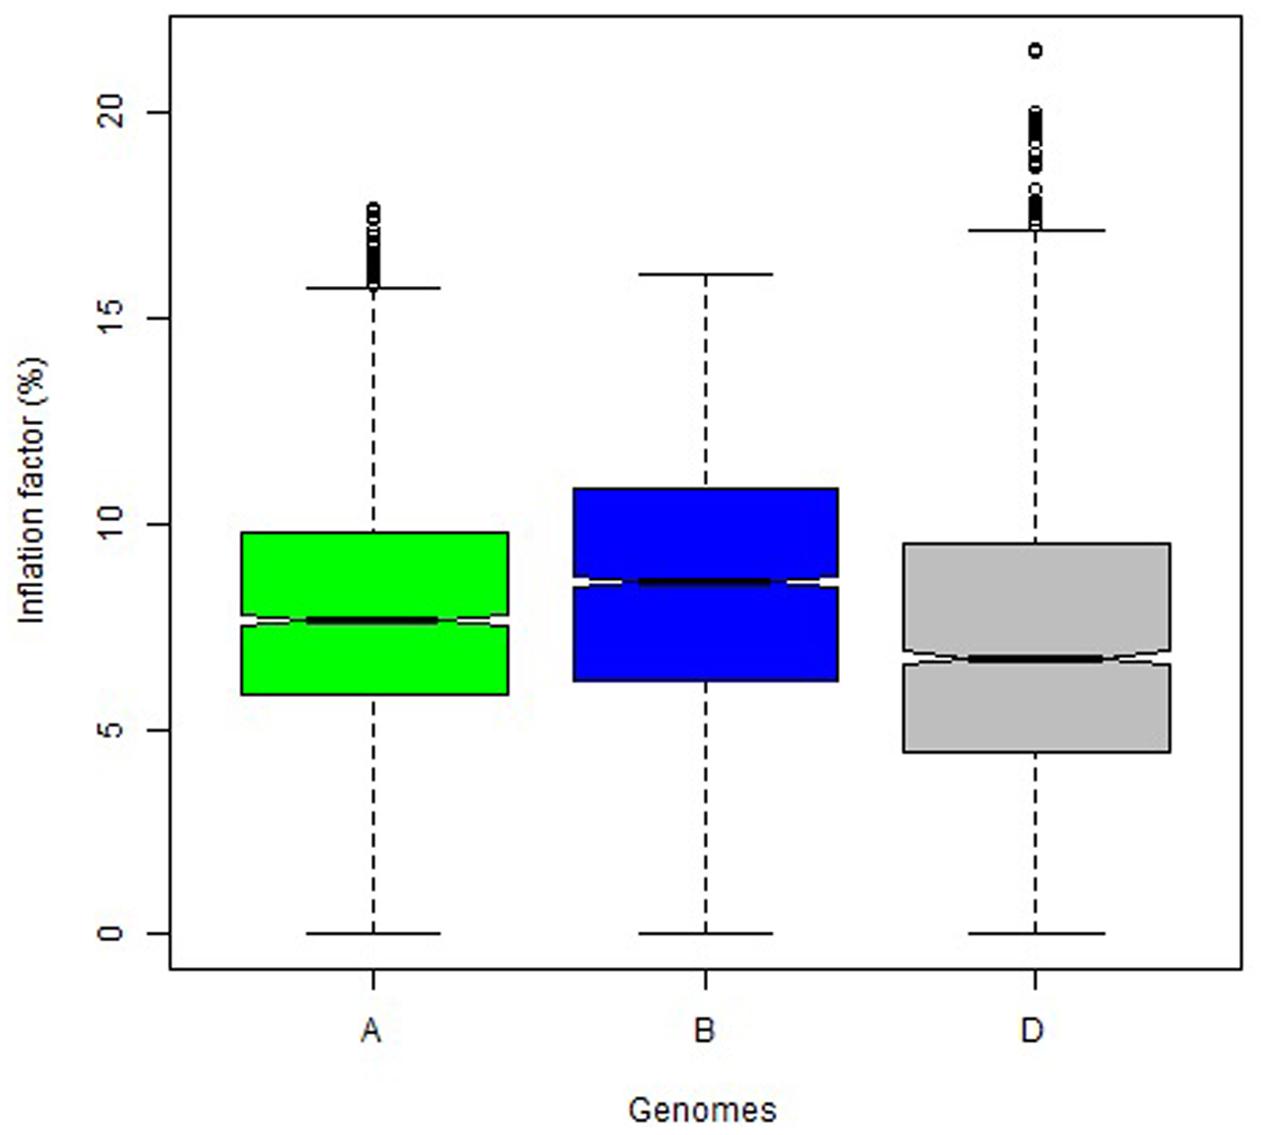
FIGURE 4. Boxplot of map length inflation factor per genome in the Norstar × Cappelle Desprez population.
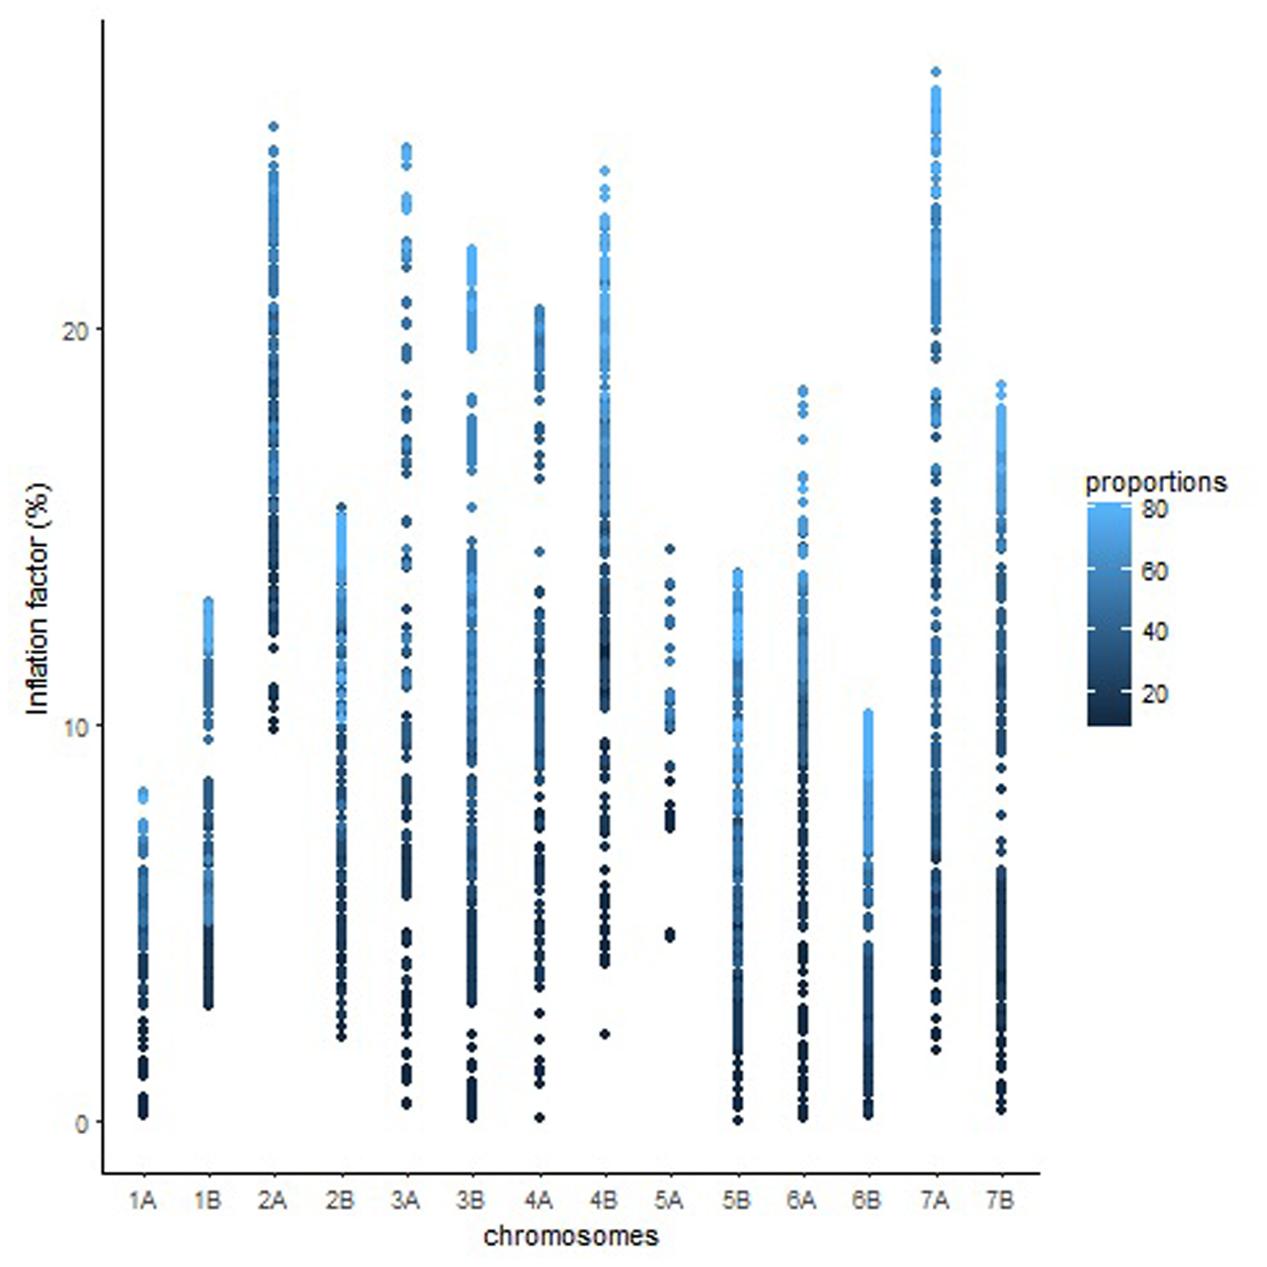
FIGURE 5. Pattern of inflation factor for chromosomes and the proportions of co-segregating markers in the Mohawk × Cocorit population.
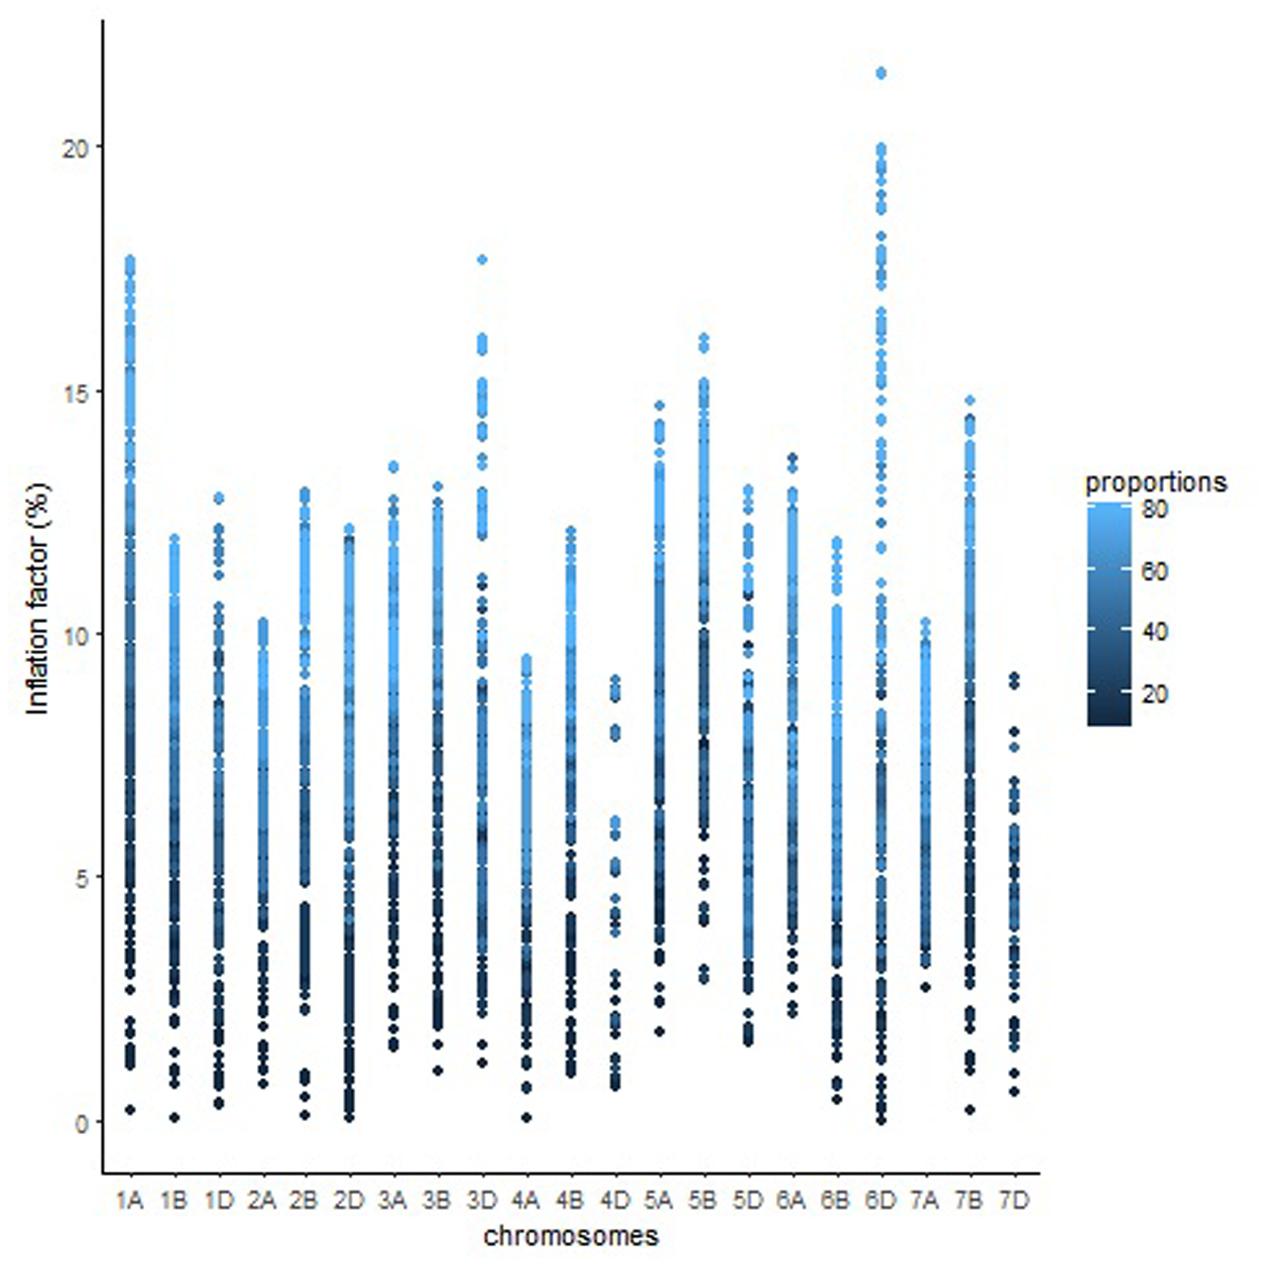
FIGURE 6. Pattern of inflation factor for chromosomes and the proportions of co-segregating markers in the Norstar × Cappelle Desprez population.
Prediction of Map Expansion
The prediction accuracies of the models are shown in Table 4. All of the models resulted in similar performance (RMSE, accuracy) in both Mohawk × Cocorit and Norstar × Cappelle Desprez populations. The IF of the linkage maps was predicted with an accuracy of 0.7 in both populations. However, the RMSE was lower in Norstar × Cappelle Desprez compared to Mohawk × Cocorit, 2.2 vs. 4.6. The map length inflated relative to the proportion of co-segregating markers: the more co-segregating markers the larger the map expansion (Table 5). For example in Mohawk × Cocorit, with 10 and 80% co-segregating markers the length of the map inflated by 4.5 and 16.6%, respectively. Similarly, the map of Norstar × Cappelle Desprez expanded by 3.8 and 11.7% with 10 and 80% co-segregating markers.
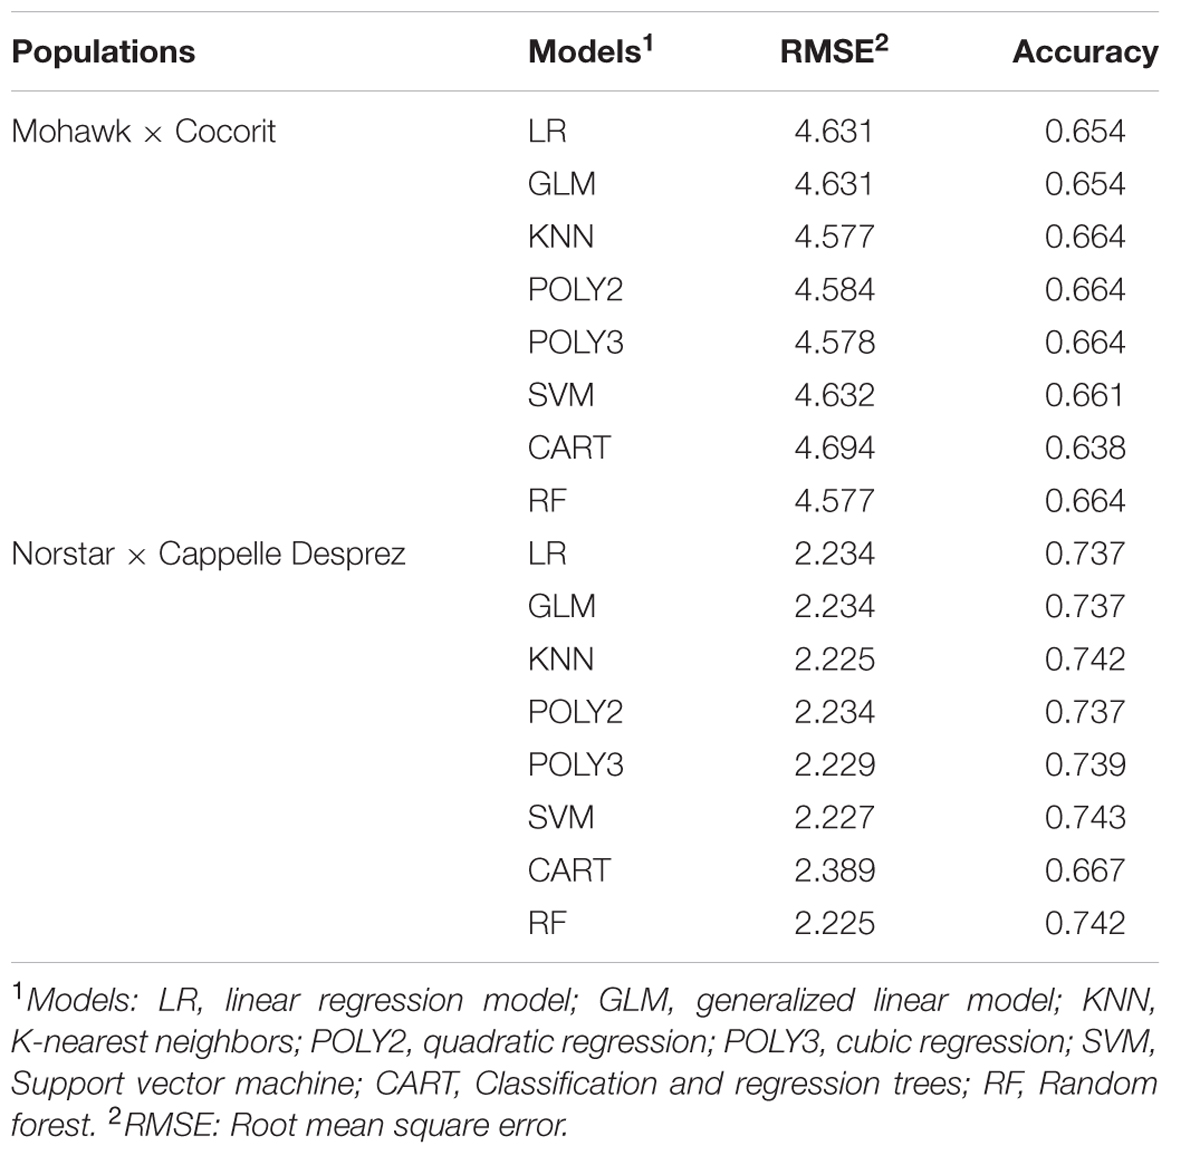
TABLE 4. Prediction accuracy of different models in the Mohawk × Cocorit and Norstar × Cappelle Desprez populations.
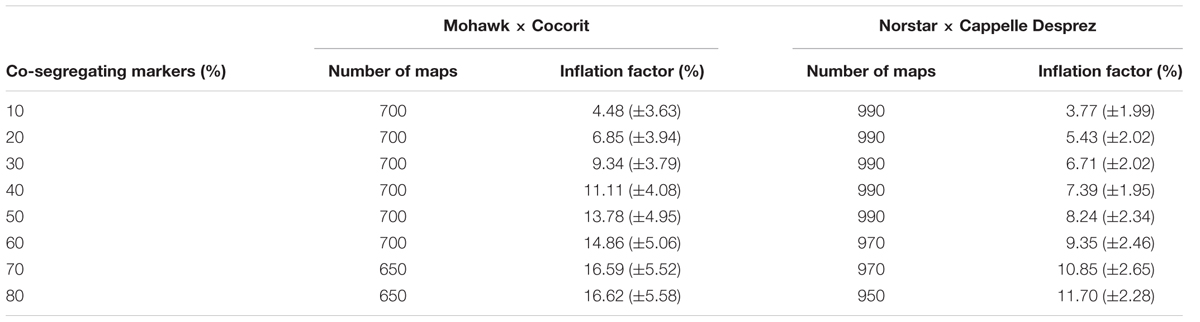
TABLE 5. Map inflation factor (mean ± standard deviation) relative to the proportion of co-segregating markers in the Mohawk × Cocorit and Norstar × Cappelle Desprez populations.
Discussion
Linkage Mapping
All of the linkage maps were constructed using MSTMap software (Wu et al., 2008) due to its good performance compared to other available tools, especially in the speed and accuracy of map construction (Cheema and Dicks, 2009). In this study, we built a total of 24,473 linkage maps by taking advantage of the fast algorithm of MSTMap combined with an in-house Ruby script that generated the appropriate data sets, parameter files and ran MSTMap in batch mode. A wide range of algorithms and software for constructing genetic maps are available (see Cheema and Dicks, 2009; Ott et al., 2015 for a review). In particular, many algorithms have been designed for high-density maps (van Os et al., 2005a,b; Rastas et al., 2013; Liu et al., 2014). Algorithms usually try to solve specific mapping problems such as correcting genotyping errors (van Os et al., 2005b; Liu et al., 2014), producing accurate marker order in a relatively limited time (van Os et al., 2005a), handling populations with highly heterozygous loci (Margarido et al., 2007; Tong et al., 2010) or detecting and removing pseudo-linkages (Ronin et al., 2010).
No single software harbors all the desirable features (e.g., ultra-fast, accurate in makers order, no map inflation, scalable) that one could expect for assembling a high quality high-density map in a relatively short time. Therefore, different combinations of software have been used to build high-density genetic maps (e.g., Liu et al., 2014, 2015; Fowler et al., 2016; Kumar et al., 2016; Perez-Lara et al., 2016). Fowler et al. (2016) and Perez-Lara et al. (2016) used MSTMap + MapDisto (Lorieux, 2012) while Liu et al. (2014) used AntMap (Iwata and Ninomiya, 2006) + MapDisto. In contrast, Kumar et al. (2016) combined the features of MapMaker (Lander and Botstein, 1989) and CarthaGene (de Givry et al., 2005) while Liu et al. (2015) built their map using JoinMap (Stam, 1993) + MSTMap. Several practical strategies have also been used to tackle the difficulties in constructing a high-density linkage map, including bin strategy (Sun et al., 2007; Amores et al., 2011; Ganal et al., 2011; Chen Z. et al., 2014; Han et al., 2016; Zhou et al., 2016). Bin strategy reduces computational costs as well as the impact of genotyping errors, but at the cost of incomplete utilization of genotyping data and recombination information reducing the application value of high-density linkage map (Liu et al., 2014). Another approach, termed ‘selective mapping,’ suggests first building a framework map with limited number of markers and samples of individuals bearing complementary recombination breakpoints, then adding the remaining markers (Vision et al., 2000). Similarly, Ronin et al. (2010) recommended use of ‘delegate’ markers to build a reliable skeleton map and eventually remove markers that create local instability. It’s well known that different mapping strategies may result in different maps (Ronin et al., 2010). However, to avoid any potential technical bias in our study, all of the maps were constructed using the same software and algorithms.
Markers Order
A strong collinearity in markers order (r ranging for 0.94 to 0.99) was observed between the sequential maps and the skeleton map for all chromosomes in both Mohawk × Cocorit and Norstar × Capelle Desprez populations suggesting that co-segregating markers had little effect on markers order. The ordering of markers within LGs is considered a special case of the classical traveling salesman problem (Doerge, 1996; Liu, 1998; Mester et al., 2003; Tan and Fu, 2006). The problem consists in choosing the best order among (1/2)∗m! possible orders (m being the number of markers). When m gets larger, the number of orders is unwieldy. For example, when m = 100, the total number of possible orders = 4.6 × 10157, which is not feasible with the currently available computational power. Algorithms to obtain approximate optimal solutions are the only practical approach for large-scale linkage mapping (Liu, 1998). Thus, some small local discrepancies in marker order might occur when comparing maps. However, most of the linkage mapping algorithms find reasonably good markers order (see Wu et al., 2008 for a review).
Map Expansion
“Map expansion is the phenomenon that genetic maps including a large number of genes are longer than the corresponding actual genetic distance between the genes involved” (Sybenga, 1996). Discrepancies between genetic maps and cytological maps have raised some concerns about map expansion (Hall et al., 1997a,b) in many species, including mice (Taylor, 1978), maize (Burr et al., 1988; Burr and Burr, 1991; Anderson et al., 2003), tomato (Paran et al., 1995) and potato (Tanksley et al., 1992).
Many sources of map expansion have been reported, including genotyping errors and missing values (Lincoln and Lander, 1992; Sobel et al., 2002; Hackett and Broadfoot, 2003; Pompanon et al., 2005; Cartwright et al., 2007; Avni et al., 2014; Ronin et al., 2014), number and type of markers (Lee et al., 2015; Bai et al., 2016), tight double recombinant events, and segregation distortion (Sybenga, 1996) and mapping software (Sybenga, 1996; Hackett and Broadfoot, 2003; Falque, 2005; Rastas et al., 2016). Other factors, including an excess of heterozygosity (Knox and Ellis, 2002; Truong et al., 2014) and the population type and size (Ferreira et al., 2006; Lee et al., 2015) have also been reported to inflate the length of linkage maps.
Nonetheless, only the correction of genotyping errors and a reduction in missing values have led to substantial improvement of algorithms for the construction of high-density linkage maps (Lincoln and Lander, 1992; Stam, 1993; Douglas et al., 2000; van Os et al., 2005b; Cartwright et al., 2007; Ronin et al., 2010, 2014; Lorieux, 2012). Genotyping errors can unlink markers that would be identical (absolutely linked) in the ideal situation with no errors. When the number of markers and the error rate increase, it becomes more challenging to build a reliable map (Ronin et al., 2010). As marker density increases, undetected scoring errors rate of only 1% can lead to incorrect markers order and map expansion (Buetow, 1991). More precisely, it was reported that every 1% error rate in a marker data inflates the map length by 2 cM (Cartwright et al., 2007). While missing values leads to a poor estimate of the true recombinations that have occurred along the chromosome. A common practice to deal with missing data is imputation (Zhao et al., 2008; Marchini and Howie, 2010; Daetwyler et al., 2011; Schwender, 2012). However, missing values have a limited negative impact on the accuracy of the final map, compared to genotyping errors (Hackett and Broadfoot, 2003; Wu et al., 2008), provided that the number of missing values remains relatively low. For this reason, some authors prefer keeping ambiguous genotypes as missing data rather than inferring the putative alleles (Wu et al., 2008). Although some authors analyzed data having up to 80% missing values (e.g., Edae et al., 2016), we kept this rate relatively low to reduce their impact on the map expansion (Hackett and Broadfoot, 2003; Wu et al., 2008). Only SNP with less than 10% missing data were used for our analyses. Therefore, missing data had limited contribution to the map expansion we observed.
The effect of co-segregating markers on linkage maps has received less attention. However, our study clearly showed that an excess of co-segregating markers leads to map expansion. The more co-segregating markers, the larger the map expansion. Using ML approaches, we were able to predict with an accuracy of 0.7 the map expansion relative to the proportion of co-segregating markers. Although we used both linear and non-linear methods, all of the ML algorithms gave similar results supporting evidence of a linear relationship between map expansion and the number of co-segregating markers. The proportion of co-segregating markers ranged from 60 to 92% in Mohawk × Cocorit (Table 1) and 53 to 92% in Norstar × Cappelle Desprez (Table 2), with an average of 85% in both populations. This relatively high proportion of co-segregating markers is not exceptional since the ‘large p, small n’ problem, derived from high-throughput data has not yet been resolved by any mapping algorithm. Intuitively, all of the high-density genetic maps in the literature contain a high proportion of co-segregating markers, regardless of the species. Because this metric is not reported for published genetic maps, we computed it for some species where map data are available online. For example, the genome-wide proportions of co-segregating markers were 75% (14023/18601) in a wheat MAGIC map (Gardner et al., 2016), 65% (8408/12998) in barley (Zhou et al., 2015), 57% (2948/5138) in sunflower (Talukder et al., 2014) and 70% (6426/9164) in Brassica napus (Liu et al., 2013). For pearl millet, it was reported that only 314 out of 2,156 SNPs showed unique map position, giving 85% co-segregating markers (Moumouni et al., 2015).
To deal with map expansion, a common practice is to remove the double recombinants. However, the method of removing erroneous double recombinants could lead to irrelevant distances among markers (Ronin et al., 2010). As an example, Ronin et al. (2010) applied that method to chromosome 1B of a recombinant inbred line population of wheat and produced a map of 104 cM, compared to the published map that spanned 432 cM. The relatively small length of the map was attributed to an artifact introduced during the merging of different marker data sources, some of which contained high frequencies of missing data and inappropriate “error correction.” Another approach is to adjust the length of the map based on the breeding scheme, in particular for RIL and IRIL (Winkler et al., 2003). However, some studies have shown that the IF derived from this method tends to be underestimated with low marker density (Teuscher et al., 2005; Liu et al., 2015).
We estimated the IF of each LG with respect to the length of its skeleton map. Because only a few markers can reliably be ordered in a context of high-density linkage mapping where the number of markers exceed by far the size of the population (Ronin et al., 2010), many authors suggested first building a skeleton map with ‘delegate’ markers, before adding the remaining markers, e.g., (van Os et al., 2006; Peleg et al., 2008; Wu et al., 2008; Ronin et al., 2010; Seetan et al., 2013; Reddy et al., 2014; Strnadová et al., 2014; Mester et al., 2015). In many studies, only the skeleton map was used to perform analyses such as QTL detection (Chutimanitsakun et al., 2011; Vengadessan et al., 2013; Chen Z. et al., 2014; Liu J. et al., 2016) or as a reference to calculate the genetic distances between markers (Ren et al., 2012; Moumouni et al., 2015). Thus, skeleton maps appear to be the backbone of high-density genetic maps.
Machine learning algorithms are becoming more accepted in crop breeding and are presented as a worthwhile surrogate to traditional statistical methods (Maenhout et al., 2010). The predictive ability of ML algorithms has proven superior to classical statistics methods in many studies (Drummond et al., 2003; Gonzalez-Sanchez et al., 2014). In particular, ML algorithms have been successfully applied to crop yield prediction (see for Mishra et al., 2016 a review), including wheat (Jeong et al., 2016; Pantazi et al., 2016), maize (Liu et al., 2001; Marinkovic et al., 2009; Jeong et al., 2016), potato (Al-Hamed and Wahby, 2016; Jeong et al., 2016) and cotton (Zhang et al., 2008). Due to their high predictive performance and high generalization capabilities, ML algorithms are becoming a valuable tool for data mining.
Because of the continued increase in the size of high throughput SNP-chips, the disparity between the high number of markers and the relatively small population size is more likely to result in poor resolution maps (Ronin et al., 2010). Intuitively, the proportion of co-segregating markers in high-density maps will continue to increase, making map expansion unavoidable. Therefore, there is a need for improved linkage mapping algorithms to efficiently analyze the high-throughput data generated by new sequencing technologies. In particular, developers should build algorithms capable of computing accurately recombination frequencies and genetic distances in a context of high-density linkage mapping.
Conclusion
Our study clearly showed that excess of co-segregating markers can lead to map expansion with little effect on markers order. Using various ML algorithms, we were able to predict with an accuracy of 0.7 map expansion relative to the proportion of co-segregating markers. Because co-segregating markers are inevitable in high-density linkage maps, it becomes necessary to improve linkage mapping algorithms for efficient analysis of high-throughput data. In the meantime, a practical strategy could be to estimate the IF related to the proportion of co-segregating markers and then scale the length of the map accordingly.
Author Contributions
AN’D set up the experimental design, analyzed the data, and wrote the initial manuscript. JH edited the manuscript. DF and KA created the mapping populations and edited the manuscript. CP provided all resources including funding, designed the experiment and edited the manuscript.
Funding
This research was conducted as part of the Canadian Triticum Applied Genomics (CTAG2) project. We are grateful for the financial support of Genome Canada, Genome Prairie, Western Grains Research Foundation, Saskatchewan Wheat Development Commission, and the Saskatchewan Ministry of Agriculture.
Conflict of Interest Statement
The authors declare that the research was conducted in the absence of any commercial or financial relationships that could be construed as a potential conflict of interest.
Acknowledgment
We are thankful to the technical support of the Wheat and Genetics Molecular Lab and CIMMYT.
References
Agresti, J. J., Seki, S., Cnaani, A., Poompuang, S., Hallerman, E. M., Umiel, N., et al. (2000). Breeding new strains of tilapia: development of an artificial center of origin and linkage map based on AFLP and microsatellite loci. Aquaculture 185, 43–56. doi: 10.1016/S0044-8486(99)00335-X
Ahn, S., and Tanksley, S. D. (1993). Comparative linkage maps of the rice and maize genomes. Proc. Natl. Acad. Sci. U.S.A. 90, 7980–7984. doi: 10.1073/pnas.90.17.7980
Al-Hamed, S. A., and Wahby, M. F. (2016). Prediction of potato yield based on energy inputs using artificial neural networks and C-sharp under Saudi Arabia conditions. Biosci. Biotech. Res. Asia 13, 631–644. doi: 10.13005/bbra/2079
Amores, A., Catchen, J., Ferrara, A., Fontenot, Q., and Postlethwait, J. H. (2011). Genome evolution and meiotic maps by massively parallel DNA sequencing: spotted gar, an outgroup for the teleost genome duplication. Genetics 188, 799–808. doi: 10.1534/genetics.111.127324
Anderson, L. K., Doyle, G. G., Brigham, B., Carter, J., Hooker, K. D., Lai, A., et al. (2003). High-resolution crossover maps for each bivalent of Zea mays using recombination nodules. Genetics 165, 849–865.
Avni, R., Nave, M., Eilam, T., Sela, H., Alekperov, C., Peleg, Z., et al. (2014). Ultra-dense genetic map of durum wheat × wild emmer wheat developed using the 90K iSelect SNP genotyping assay. Mol. Breed. 34, 1549–1562. doi: 10.1007/s11032-014-0176-2
Bai, Z.-Y., Han, X.-K., Liu, X.-J., Li, Q.-Q., and Li, J.-L. (2016). Construction of a high-density genetic map and QTL mapping for pearl quality-related traits in Hyriopsis cumingii. Sci. Rep. 6:32608. doi: 10.1038/srep32608
Bansal, V., Bashir, A., and Bafna, V. (2007). Evidence for large inversion polymorphisms in the human genome from HapMap data. Genome Res. 17, 219–230. doi: 10.1101/gr.5774507
Bernardo, R. (2008). Molecular markers and selection for complex traits in plants: learning from the last 20 years. Crop Sci. 48, 1649–1664. doi: 10.2135/cropsci2008.03.0131
Bernardo, R., and Yu, J. (2007). Prospects for genome-wide selection for quantitative traits in maize. Crop Sci. 47, 1082–1090. doi: 10.2135/cropsci2006.11.0690
Breiman, L. (2001b). Statistical modeling: the two cultures. Stat. Sci. 16, 199–231. doi: 10.1214/ss/1009213726
Breiman, L., Friedman, J., Olshen, R., and Stone, C. (1984). Classification and Regression Trees. Belmont, CA: Wadsworth.
Buetow, K. H. (1991). Influence of aberrant observations on high-resolution linkage analysis outcomes. Am. J. Hum. Genet. 49, 985–994.
Burr, B., and Burr, F. A. (1991). Recombinant inbreds for molecular mapping in maize: theoretical and practical considerations. Trends Genet. 7, 55–60. doi: 10.1016/0168-9525(91)90232-F
Burr, B., Burr, F. A., Thompson, K. H., Albertson, M. C., and Stuber, C. W. (1988). Gene mapping with recombinant inbreds in maize. Genetics 118, 519–526.
Cartwright, D. A., Troggio, M., Velasco, R., and Gutin, A. (2007). Genetic mapping in the presence of genotyping errors. Genetics 176, 2521–2527. doi: 10.1534/genetics.106.063982
Cavanagh, C. R., Chao, S., Wang, S., Huang, B. E., Stephen, S., Kiani, S., et al. (2013). Genome-wide comparative diversity uncovers multiple targets of selection for improvement in hexaploid wheat landraces and cultivars. Proc. Natl. Acad. Sci. U.S.A. 110, 8057–8062. doi: 10.1073/pnas.1217133110
Cheema, J., and Dicks, J. (2009). Computational approaches and software tools for genetic linkage map estimation in plants. Brief. Bioinform. 10, 595–608. doi: 10.1093/bib/bbp045
Chen, H., Xie, W., He, H., Yu, H., Chen, W., Li, J., et al. (2014). A high-density SNP genotyping array for rice biology and molecular breeding. Mol. Plant 7, 541–553. doi: 10.1093/mp/sst135
Chen, Z., Wang, B., Dong, X., Liu, H., Ren, L., Chen, J., et al. (2014). An ultra-high density bin-map for rapid QTL mapping for tassel and ear architecture in a large F2 maize population. BMC Genomics 15:433. doi: 10.1186/1471-2164-15-433
Chutimanitsakun, Y., Nipper, R. W., Cuesta-Marcos, A., Cistué, L., Corey, A., Filichkina, T., et al. (2011). Construction and application for QTL analysis of a Restriction Site Associated DNA (RAD) linkage map in barley. BMC Genomics 12:4. doi: 10.1186/1471-2164-12-4
Collard, B., Jahufer, M., Brouwer, J., and Pang, E. (2005). An introduction to markers, quantitative trait loci (QTL) mapping and marker-assisted selection for crop improvement: the basic concepts. Euphytica 142, 169–196. doi: 10.1007/s10681-005-1681-5
Cunningham, S. (1995). Machine learning and statistics: a matter of perspective. N. Z. J. Comput. 6, 69–73.
Daetwyler, H. D., Wiggans, G. R., Hayes, B. J., Woolliams, J. A., and Goddard, M. E. (2011). Imputation of missing genotypes from sparse to high density using long-range phasing. Genetics 189, 317–327. doi: 10.1534/genetics.111.128082
de Givry, S., Bouchez, M., Chabrier, P., Milan, D., and Schiex, T. (2005). CarthaGene: multipopulation integrated genetic and radiation hybrid mapping. Bioinformatics 21, 1703–1704. doi: 10.1093/bioinformatics/bti222
Di Pierro, E. A., Gianfranceschi, L., Di Guardo, M., Koehorst-van Putten, H. J. J., Kruisselbrink, J. W., Longhi, S., et al. (2016). A high-density, multi-parental SNP genetic map on apple validates a new mapping approach for outcrossing species. Hortic. Res. 3:16057. doi: 10.1038/hortres.2016.57
Doerge, R. (2002). Mapping and analysis of quantitative trait loci in experimental populations. Nat. Rev. 3, 43–52. doi: 10.1038/nrg703
Doerge, R. W. (1996). Constructing genetic maps by rapid chain delineation. J. Quant. Trait Loci 2, 121–132. doi: 10.1590/S1415-47572010005000033
Douglas, J. A., Boehnke, M., and Lange, K. (2000). A multipoint method for detecting genotyping errors and mutations in sibling-pair linkage data. Am. J. Hum. Genet. 66, 1287–1297. doi: 10.1086/302861
Drummond, S. T., Sudduth, K. A., Joshi, A., Birrell, S. J., and Kitchen, N. R. (2003). Statistical and neural methods for site-specific yield prediction. Trans. ASAE 46, 5–14. doi: 10.13031/2013.12541
Edae, E. A., Olivera, P. D., Jin, Y., Poland, J. A., and Rouse, M. N. (2016). Genotype-by-sequencing facilitates genetic mapping of a stem rust resistance locus in Aegilops umbellulata, a wild relative of cultivated wheat. BMC Genomics 17:1039. doi: 10.1186/s12864-016-3370-2
Falque, M. (2005). IRILmap: linkage map distance correction for intermated recombinant inbred lines/advanced recombinant inbred strains. Bioinform. Appl. Notes 21, 3441–3442. doi: 10.1093/bioinformatics/bti543
Ferreira, A., da Silva, M. F., Silva, L. C., and Cruz, C. D. (2006). Estimating the effects of population size and type on the accuracy of genetic maps. Genet. Mol. Biol. 29, 187–192. doi: 10.2527/jas.2007-0010
Fierst, J. L. (2015). Using linkage maps to correct and scaffold de novo genome assemblies: methods, challenges, and computational tools. Front. Genet. 6:220. doi: 10.3389/fgene.2015.00220
Fowler, D. B., N’Diaye, A., Laudencia-Chingcuanco, D., and Pozniak, C. J. (2016). Quantitative trait loci associated with phenological development, low-temperature tolerance, grain quality, and agronomic characters in wheat (Triticum aestivum L.). PLoS ONE 11:e0152185. doi: 10.1371/journal.pone.0152185
Ganal, M. W., Durstewitz, G., Polley, A., Bérard, A., Buckler, E. S., Charcosset, A., et al. (2011). A large maize (Zea mays L.) SNP genotyping array: development and germplasm genotyping, and genetic mapping to compare with the B73 reference genome. PLoS ONE 6:e28334. doi: 10.1371/journal.pone.0028334
Gardner, K. A., Wittern, L. M., and Mackay, I. J. (2016). A highly recombined, high-density, eight-founder wheat MAGIC map reveals extensive segregation distortion and genomic locations of introgression segments. Plant Biotechnol. J. 14, 1406–1417. doi: 10.1111/pbi.12504
Gianola, D., and van Kaam, J. B. (2008). Reproducing Kernel Hilbert spaces regression methods for genomic assisted prediction of quantitative traits. Genet. Mol. Biol. 178, 2289–2303. doi: 10.1534/genetics.107.084285
Goddard, M. E., and Hayes, B. J. (2007). Genomic selection. J. Anim. Breed. Genet. 124, 323–330. doi: 10.1111/j.1439-0388.2007.00702.x
Gonzales-Recio, O., Gianola, D., Long, N., Wiegel, K., Rosa, G., and Avendaño, S. (2008). Non parametric methods for incorporating genomic information into genetic evaluation: an application to mortality in broilers. Genet. Mol. Biol. 178, 2305–2313. doi: 10.1534/genetics.107.084293
Gonzalez-Sanchez, A., Frausto-Solis, J., and Ojeda-Bustamante, W. (2014). Predictive ability of machine learning methods for massive crop yield prediction. Span. J. Agric. Res. 12, 313–328. doi: 10.5424/sjar/2014122-4439
Grinberg, N. F., Lovatt, A., Hegarty, M., Lovatt, A., Skøt, K. P., Kelly, R., et al. (2016). Implementation of genomic prediction in Lolium perenne (L.) breeding populations. Front. Plant Sci. 7:133. doi: 10.3389/fpls.2016.00133
Guyon, I., Weston, J., Barnhill, S., and Vapnik, V. (2002). Gene selection for cancer classification using support vector machines. Mach. Learn. 46, 389–422. doi: 10.1023/a:1012487302797
Hackett, C. A., and Broadfoot, L. B. (2003). Effects of genotyping errors, missing values and segregation distortion in molecular marker data on the construction of linkage maps. Heredity 90, 33–38. doi: 10.1038/sj.hdy.6800173
Hall, K. J., Parker, J. S., Ellis, T. H., Turner, L., Knox, M. R., Hofer, J. M., et al. (1997a). The relationship between genetic and cytogenetic maps of pea. II. Physical maps of linkage mapping populations. Genome 40, 755–769.
Hall, K. J., Parker, J. S., and Ellis, T. H. N. (1997b). The relationship between genetic and cytogenetic maps of pea. I. Standard and translocation karyotypes. Genome 40, 744–754.
Han, K., Jeong, H.-J., Yang, H.-B., Kang, S.-M., Kwon, J.-K., Kim, S., et al. (2016). An ultra-high-density bin map facilitates high-throughput QTL mapping of horticultural traits in pepper (Capsicum annuum). DNA Res. 23, 81–91. doi: 10.1093/dnares/dsv038
Heslot, N., Yang, H., Sorrells, M., and Jannink, J. (2012). Genomic selection in plant breeding: a comparison of models. Crop Sci. 52, 146–160. doi: 10.2135/cropsci2011.09.0297
Iehisa, J. C. M., Ohno, R., Kimura, T., Enoki, H., Nishimura, S., Okamoto, Y., et al. (2014). A high-density genetic map with array-based markers facilitates structural and quantitative trait locus analyses of the common wheat genome. DNA Res. 21, 555–567. doi: 10.1093/dnares/dsu020
Iwata, H., and Ninomiya, S. (2006). AntMap: constructing genetic linkage maps using an ant colony optimization algorithm. Breed. Sci. 56, 371–377. doi: 10.1270/jsbbs.56.371
Jannink, J.-L., Lorenz, A. J., and Iwata, H. (2010). Genomic selection in plant breeding: from theory to practice. Brief. Funct. Genomics 9, 166–177. doi: 10.1093/bfgp/elq001
Jeong, J. H., Resop, J. P., Mueller, N. D., Fleisher, D. H., Yun, K., Butler, E. E., et al. (2016). Random forests for global and regional crop yield predictions. PLoS ONE 11:e0156571. doi: 10.1371/journal.pone.0156571
Knox, M. R., and Ellis, T. H. N. (2002). Excess heterozygosity contributes to genetic map expansion in pea recombinant inbred populations. Genetics 162, 861–873.
Kohavi, R. (1995). “A study of cross-validation and bootstrap for accuracy estimation and model selection,” in Proceedings of the 14th International Joint Conference on Artificial Intelligence, Vol. 2, (Montreal, QC: Morgan Kaufmann Publishers Inc.).
Kuhn, M., Wing, J., Weston, S., Williams, A., Keefer, C., and Engelhardt, A. (2012). Caret: Classification and Regression Training. R Package Version 5.15-044.
Kukar, M., and Groselj, C. (2005). Transductive machine learning for reliable medical diagnostics. J. Med. Syst. 29, 13–32. doi: 10.1007/s10916-005-1101-3
Kumar, A., Mantovani, E. E., Seetan, R., Soltani, A., Echeverry-Solarte, M., Jain, S., et al. (2016). Dissection of genetic factors underlying wheat kernel shape and size in an Elite × Nonadapted cross using a high density SNP linkage map. Plant Genome 9. doi: 10.3835/plantgenome2015.09.0081
Lander, E. S., and Botstein, D. (1989). Mapping mendelian factors underlying quantitative traits using RFLP linkage maps. Genetics 121, 185–199.
Lee, M., Xia, J. H., Zou, Z., Ye, J., Rahmadsyah, Alfiko, Y., et al. (2015). A consensus linkage map of oil palm and a major QTL for stem height. Sci. Rep. 5:8232. doi: 10.1038/srep08232
Li, Y., Lee, K. K., Walsh, S., Smith, C., Hadingham, S., Sorefan, K., et al. (2006). Establishing glucose- and ABA-regulated transcription networks in Arabidopsis by microarray analysis and promoter classification using a Relevance Vector Machine. Genome Res. 16, 414–427. doi: 10.1101/gr.4237406
Lincoln, S. E., and Lander, E. S. (1992). Systematic detection of errors in genetic linkage data. Genomics 14, 604–610. doi: 10.1016/S0888-7543(05)80158-2
Liu, D., Ma, C., Hong, W., Huang, L., Liu, M., Liu, H., et al. (2014). Construction and analysis of high-density linkage map using high-throughput sequencing data. PLoS ONE 9:e98855. doi: 10.1371/journal.pone.0098855
Liu, H., Niu, Y., Gonzalez-Portilla, P. J., Zhou, H., Wang, L., Zuo, T., et al. (2015). An ultra-high-density map as a community resource for discerning the genetic basis of quantitative traits in maize. BMC Genomics 16:1078. doi: 10.1186/s12864-015-2242-5
Liu, H. B. (1998). Statistical Genomics, Linkage, Mapping and QTL Analysis. Boca Raton, FL: CRC Press, 611.
Liu, J., Goering, C. E., and Tian, L. (2001). Neural network for setting target corn yields. Trans. ASAE 44, 705–713.
Liu, J., Liu, B., Cheng, F., Liang, J., Wang, X., and Wu, J. (2016). A high density linkage map facilitates QTL mapping of flowering time in Brassica rapa. Hortic. Plant J. 2, 217–223. doi: 10.1016/j.hpj.2016.11.003
Liu, L., Qu, C., Wittkop, B., Yi, B., Xiao, Y., He, Y., et al. (2013). A high-density SNP map for accurate mapping of seed fibre QTL in Brassica napus L. PLoS ONE 8:e83052. doi: 10.1371/journal.pone.0083052
Liu, Z., Zhu, H., Liu, Y., Kuang, J., Zhou, K., Liang, F., et al. (2016). Construction of a high-density, high-quality genetic map of cultivated lotus (Nelumbo nucifera) using next-generation sequencing. BMC Genomics 17:466. doi: 10.1186/s12864-016-2781-4
Loh, W.-Y. (2014). Fifty years of classification and regression trees. Int. Stat. Rev. 82, 329–348. doi: 10.1111/insr.12016
Lorieux, M. (2012). MapDisto: fast and efficient computation of genetic linkage maps. Mol. Breed. 30, 1231–1235. doi: 10.1007/s11032-012-9706-y
Maccaferri, M., Ricci, A., Salvi, S., Milner, S. G., Noli, E., Martelli, P. L., et al. (2014). A high-density, SNP-based consensus map of tetraploid wheat as a bridge to integrate durum and bread wheat genomics and breeding. Plant Biotechnol. J. 13, 648–663. doi: 10.1111/pbi.12288
Maenhout, S., De Baets, B., and Haesaert, G. (2010). Prediction of maize single-cross hybrid performance: support vector machine regression versus best linear prediction. Theor. Appl. Genet. 120, 415–427. doi: 10.1007/s00122-009-1200-5
Mahlein, A.-K. (2015). Plant disease detection by imaging sensors – parallels and specific demands for precision agriculture and plant phenotyping. Plant Dis. 100, 241–251. doi: 10.1094/PDIS-03-15-0340-FE
Marchini, J., and Howie, B. (2010). Genotype imputation for genome-wide association studies. Nat. Rev. Genet. 11, 499–511. doi: 10.1038/nrg2796
Margarido, G. R. A., Souza, A. P., and Garcia, A. A. F. (2007). OneMap: software for genetic mapping in outcrossing species. Hereditas 144, 78–79. doi: 10.1111/j.2007.0018-0661.02000.x
Marinkovic, B., Crnobarac, J., Brdar, S., Antic, B., Jacimovic, G., and Crnojevic, V. (2009). “Data mining approach for predictive modeling of agricultural yield data,” in Proceedings of the First International Workshop on Sensing Technologies in Agriculture, Forestry and Environment (BioSense09), Novi Sad, 1–5.
Mester, D., Ronin, Y., Minkov, D., Nevo, E., and Korol, A. (2003). Constructing large-scale genetic maps using an evolutionary strategy algorithm. Genetics 165, 2269–2282.
Mester, D., Ronin, Y., Schnable, P., Aluru, S., and Korol, A. (2015). Fast and accurate construction of ultra-dense consensus genetic maps using evolution strategy optimization. PLoS ONE 10:e0122485. doi: 10.1371/journal.pone.0122485
Meuwissen, T. H. E., Hayes, B. J., and Goddard, M. E. (2001). Prediction of total genetic value using genome-wide dense marker maps. Genetics 157, 1819–1829.
Mishra, S., Mishra, D., and Santra, G. H. (2016). Applications of machine learning techniques in agricultural crop production: a review paper. Indian J. Sci. Technol. 9. doi: 10.17485/ijst/2016/v9i38/95032
Mohan, M., Nair, S., Bhagwat, A., Krishna, T. G., and Yano, M. (1997). Genome mapping, molecular markers and marker-assisted selection in crop plants. Mol. Breed. 3, 87–103. doi: 10.1023/A:1009651919792
Moumouni, K. H., Kountche, B. A., Jean, M., Hash, C. T., Vigouroux, Y., Haussmann, B. I. G., et al. (2015). Construction of a genetic map for pearl millet, Pennisetum glaucum (L.) R. Br., using a genotyping-by-sequencing (GBS) approach. Mol. Breed. 35, 5. doi: 10.1007/s11032-015-0212-x
Oliveira, R. P., Aguilar-Vildoso, C. I., Cristofani, M., and Machado, M. A. (2004). Skewed RAPD markers in linkage maps of Citrus. Genet. Mol. Biol. 27, 437–441. doi: 10.1590/S1415-47572004000300021
Ornella, L., Cervigni, G., and Tapia, E. (2012). “Applications of machine learning in breeding for stress tolerance in maize,” in Crop Stress and Its Management: Perspectives and Strategies, eds B. Venkateswarlu, A. K. Shanker, C. Shanker, and M. Maheswari (Dordrecht: Springer), 163–192. doi: 10.1007/978-94-007-2220-0_5
Ott, J., Wang, J., and Leal, S. M. (2015). Genetic linkage analysis in the age of whole-genome sequencing. Nat. Rev. Genet. 16, 275–284. doi: 10.1038/nrg3908
Pantazi, X. E., Moshou, D., Alexandridis, T., Whetton, R. L., and Mouazen, A. M. (2016). Wheat yield prediction using machine learning and advanced sensing techniques. Comput. Electron. Agric. 121, 57–65. doi: 10.1016/j.compag.2015.11.018
Paran, I., Goldman, I., Tanksley, S. D., and Zamir, D. (1995). Recombinant inbred lines for genetic mapping in tomato. Theor. Appl. Genet. 90, 542–548. doi: 10.1007/BF00222001
Paterson, A. H. (1996). “Making genetic maps,” in Genome Mapping in Plants, ed. A. H. Paterson (San Diego, CA: Academic Press), 23–39.
Paterson, A. H., Bowers, J. E., Burow, M. D., Draye, X., Elsik, C. G., Jiang, C.-X., et al. (2000). Comparative genomics of plant chromosomes. Plant Cell 12, 1523–1539. doi: 10.1105/tpc.12.9.1523
Peleg, Z., Saranga, Y., Suprunova, T., Ronin, Y., Roder, M. S., Kilian, A., et al. (2008). High-density genetic map of durum wheat x wild emmer wheat based on SSR and DArT markers. Theor. Appl. Genet. 117, 103–115. doi: 10.1007/s00122-008-0756-9
Perez-Lara, E., Semagn, K., Chen, H., Iqbal, M., N’Diaye, A., Kamran, A., et al. (2016). QTLs associated with agronomic traits in the cutler × AC barrie spring wheat mapping population using single nucleotide polymorphic markers. PLoS ONE 11:e0160623. doi: 10.1371/journal.pone.0160623
Pompanon, F., Bonin, A., Bellemain, E., and Taberlet, P. (2005). Genotyping errors: causes, consequences and solutions. Nat. Rev. Genet. 6, 847–859. doi: 10.1038/nrg1707
Rastas, P., Calboli, F. C. F., Guo, B., Shikano, T., and Merilä, J. (2016). Construction of ultradense linkage maps with lep-MAP2: stickleback F 2 recombinant crosses as an example. Genome Biol. Evol. 8, 78–93. doi: 10.1093/gbe/evv250
Rastas, P., Paulin, L., Hanski, I., Lehtonen, R., and Auvinen, P. (2013). Lep-MAP: fast and accurate linkage map construction for large SNP datasets. Bioinformatics 29, 3128–3134. doi: 10.1093/bioinformatics/btt563
Reddy, U. K., Nimmakayala, P., Levi, A., Abburi, V. L., Saminathan, T., Tomason, Y. R., et al. (2014). High-resolution genetic map for understanding the effect of genome-wide recombination rate on nucleotide diversity in watermelon. G3 4, 2219–2230. doi: 10.1534/g3.114.012815
Ren, X., Wang, J., Liu, L., Sun, G., Li, C., Luo, H., et al. (2016). SNP-based high density genetic map and mapping of btwd1 dwarfing gene in barley. Sci. Rep. 6:31741. doi: 10.1038/srep31741
Ren, Y., Zhao, H., Kou, Q., Jiang, J., Guo, S., Zhang, H., et al. (2012). A high resolution genetic map anchoring scaffolds of the sequenced watermelon genome. PLoS ONE 7:e29453. doi: 10.1371/journal.pone.0029453
Ronin, Y., Mester, D., Minkov, D., Akhunov, E., and Korol, A. (2014). “Building ultra-dens genetic maps in the presence of genotyping errors and missing data,” in Proceedings of the 12th IWG, eds Y. Matsuoka and S. Takumi (Yokohama: Springer).
Ronin, Y., Mester, D., Minkov, D., and Korol, A. (2010). Building reliable genetic maps: different mapping strategies may result in different maps. Nat. Sci. 6, 576–589. doi: 10.4236/ns.2010.26073
Schwender, H. (2012). Imputing missing genotypes with weighted k nearest neighbors. J. Toxicol. Environ. Health A 75, 438–446. doi: 10.1080/15287394.2012.674910
Seetan, R. I., Kumar, A., Denton, A. M., Iqbal, M. J., Al-Azzam, O., and Kianian, S. F. (2013). “A fast and scalable clustering-based approach for constructing reliable radiation hybrid maps,” in Proceedings of the 12th International Workshop on Data Mining in Bioinformatics, (Chicago, IL: ACM).
Semagn, K., Bjørnstad,Å., and Ndjiondjop, M. N. (2006). Principles, requirements and prospects of genetic mapping in plants. Afr. J. Biotechnol. 5, 2569–2587.
Shaik, R., and Ramakrishna, W. (2014). Machine learning approaches distinguish multiple stress conditions using stress-responsive genes and identify candidate genes for broad resistance in rice. Plant Physiol. 164, 481–495. doi: 10.1104/pp.113.225862
Shekoofa, A., Emam, Y., Shekoufa, N., Ebrahimi, M., and Ebrahimie, E. (2014). Determining the most important physiological and agronomic traits contributing to maize grain yield through machine learning algorithms: a new avenue in intelligent agriculture. PLoS ONE 9:e97288. doi: 10.1371/journal.pone.0097288
Singh, A., Ganapathysubramanian, B., Singh, A. K., and Sarkar, S. (2016). Machine learning for high-throughput stress phenotyping in plants. Trends Plant Sci. 21, 110–124. doi: 10.1016/j.tplants.2015.10.015
Sobel, E., Papp, J. C., and Lange, K. (2002). Detection and integration of genotyping errors in statistical genetics. Am. J. Hum. Genet. 70, 496–508. doi: 10.1086/338920
Sommer, C., and Gerlich, D. W. (2013). Machine learning in cell biology – teaching computers to recognize phenotypes. J. Cell Sci. 126, 5529–5539. doi: 10.1242/jcs.123604
Stam, P. (1993). Construction of integrated genetic-linkage maps by means of a new computer package: JoinMap. Plant J. 3, 739–744. doi: 10.1111/j.1365-313X.1993.00739.x
Strnadová, V., Buluç, A., Chapman, J., Gilbert, J. R., Gonzalez, J., Jegelka, S., et al. (2014). “Efficient and accurate clustering for large-scale genetic mapping,” in Proceedings of the 2014 IEEE International Conference on Bioinformatics and Biomedicine (BIBM), Belfast, 3–10.
Sun, Z., Wang, Z., Tu, J., Zhang, J., Yu, F., McVetty, P. B. E., et al. (2007). An ultradense genetic recombination map for Brassica napus, consisting of 13551 SRAP markers. Theor. Appl. Genet. 114, 1305–1317. doi: 10.1007/s00122-006-0483-z
Sybenga, J. (1996). Recombination and chiasmata: few but intriguing discrepancies. Genome 39, 473–484. doi: 10.1139/g96-061
Talukder, Z. I., Gong, L., Hulke, B. S., Pegadaraju, V., Song, Q., Schultz, Q., et al. (2014). A high-density SNP map of sunflower derived from RAD-sequencing facilitating fine-mapping of the rust resistance gene R12. PLoS ONE 9:e98628. doi: 10.1371/journal.pone.0098628
Tan, Y.-D., and Fu, Y.-X. (2006). A novel method for estimating linkage maps. Genetics 173, 2383–2390. doi: 10.1534/genetics.106.057638
Tanksley, S. D., Ganal, M. W., Prince, J. P., de-Vicente, M. C., Bonierbale, M. W., Broun, P., et al. (1992). High density molecular linkage maps of the tomato and potato genomes. Genetics 132, 1141–1160.
Taylor, B. A. (1978). “Recombinant inbred strains: use in gene mapping,” in Origins of Inbred Mice, ed. H. C. Morse (New York, NY: Academic Press), 423–438. doi: 10.1016/B978-0-12-507850-4.50032-9
Teuscher, F., Guiard, V., Rudolph, P. E., and Brockmann, G. A. (2005). The map expansion obtained with recombinant inbred strains and intermated recombinant inbred populations for finite generation designs. Genetics 170, 875–879. doi: 10.1534/genetics.104.038026
Tong, C., Zhang, B., and Shi, J. (2010). A hidden Markov model approach to multilocus linkage analysis in a full-sib family. Tree Genet. Genomes 6, 651–662. doi: 10.1007/s11295-010-0281-2
Truong, S. K., McCormick, R. F., Morishige, D. T., and Mullet, J. E. (2014). Resolution of genetic map expansion caused by excess heterozygosity in plant recombinant inbred populations. G3 4, 1963–1969. doi: 10.1534/g3.114.012468
Tyrka, M., Tyrka, D., and Wêdzony, M. (2016). Genetic map of triticale integrating microsatellite, DArT and SNP markers. PLoS ONE 10:e0145714. doi: 10.1371/journal.pone.0145714
Unterseer, S., Bauer, E., Haberer, G., Seidel, M., Knaak, C., Ouzunova, M., et al. (2014). A powerful tool for genome analysis in maize: development and evaluation of the high density 600 k SNP genotyping array. BMC Genomics 15:823. doi: 10.1186/1471-2164-15-823
van Os, H., Andrzejewski, S., Bakker, E., Barrena, I., Bryan, G. J., Caromel, B., et al. (2006). Construction of a 10,000-marker ultradense genetic recombination map of potato: providing a framework for accelerated gene isolation and a genomewide physical map. Genetics 173, 1075–1087. doi: 10.1534/genetics.106.055871
van Os, H., Stam, P., Visser, R. G. F., and Van Eck, H. J. (2005a). RECORD: a novel method for ordering loci on a genetic linkage map. Theor. Appl. Genet. 112, 30–40. doi: 10.1007/s00122-005-0097-x
van Os, H., Stam, P., Visser, R. G. F., and van Eck, H. J. (2005b). SMOOTH: a statistical method for successful removal of genotyping errors from high-density genetic linkage data. Theor. Appl. Genet. 112, 187–194. doi: 10.1007/s00122-005-0124-y
Vapnik, V. (1995). The Nature of Statistical Learning Theory. New York, NY: Springer. doi: 10.1007/978-1-4757-2440-0
Vengadessan, V., Rai, K. N., Kannan Bapu, J. R., Hash, C. T., Bhattacharjee, R., Senthilvel, S., et al. (2013). Construction of genetic linkage map and QTL analysis of sink-size traits in pearl millet (Pennisetum glaucum). ISRN Genetics 2013:471632. doi: 10.5402/2013/471632
Vision, T. J., Brown, D. G., Shmoys, D. B., Durrett, R. T., and Tanksley, S. D. (2000). Selective mapping: a strategy for optimizing the construction of high-density linkage maps. Genetics 155, 407–420.
Vuylsteke, M., Mank, R., Antonise, R., Bastiaans, E., Senior, M. L., Stuber, C. W., et al. (1999). Two high-density AFLP® linkage maps of Zea mays L.: analysis of distribution of AFLP markers. Theor. Appl. Genet. 99, 921–935. doi: 10.1007/s001220051399
Wahabzada, M., Mahlein, A.-K., Bauckhage, C., Steiner, U., Oerke, E.-C., and Kersting, K. (2016). Plant phenotyping using probabilistic topic models: uncovering the hyperspectral language of plants. Sci. Rep. 6:22482. doi: 10.1038/srep22482
Wang, S., Wong, D., Forrest, K., Allen, A., Chao, S., Huang, B. E., et al. (2014). Characterization of polyploid wheat genomic diversity using a high-density 90 000 single nucleotide polymorphism array. Plant Biotechnol. J. 12, 787–796. doi: 10.1111/pbi.12183
Winfield, M. O., Allen, A. M., Burridge, A. J., Barker, G. L. A., Benbow, H. R., Wilkinson, P. A., et al. (2016). High-density SNP genotyping array for hexaploid wheat and its secondary and tertiary gene pool. Plant Biotechnol. J. 14, 1195–1206. doi: 10.1111/pbi.12485
Winkler, C. R., Jensen, N. M., Cooper, M., Podlich, D. W., and Smith, O. S. (2003). On the determination of recombination rates in intermated recombinant inbred populations. Genetics 164, 741–745.
Witten, I. H., and Eibe, F. E. (2005). Data Mining: Practical machine learning tools and Techniques, 2nd Edn. San Francisco, CA: Morgan Kaufmann.
Witten, I. H., and Frank, E. (2005). Data Mining: Practical Machine Learning Tools and Techniques. San Francisco, CA: Morgan Kaufmann.
Wu, Y., Bhat, P. R., Close, T. J., and Lonardi, S. (2008). Efficient and accurate construction of genetic linkage maps from the minimum spanning tree of a graph. PLoS Genet. 4:e1000212. doi: 10.1371/journal.pgen.1000212
Yim, Y.-S., Davis, G. L., Duru, N. A., Musket, T. A., Linton, E. W., Messing, J. W., et al. (2002). Characterization of three maize bacterial artificial chromosome libraries toward anchoring of the physical map to the genetic map using high-density bacterial artificial chromosome filter hybridization. Plant Physiol. 130, 1686–1696. doi: 10.1104/pp.013474
Yip, K. Y., Cheng, C., and Gerstein, M. (2013). Machine learning and genome annotation: a match meant to be? Genome Biol. 14:205. doi: 10.1186/gb-2013-14-5-205
Yu, H., Xie, W., Li, J., Zhou, F., and Zhang, Q. (2014). A whole-genome SNP array (RICE6K) for genomic breeding in rice. Plant Biotechnol. J. 12, 28–37. doi: 10.1111/pbi.12113
Zacharaki, E. I., Wang, S., Chawla, S., Yoo, D. S., Wolf, R., Melhem, E. R., et al. (2009). Classification of brain tumor type and grade using MRI texture and shape in a machine learning scheme. Magn. Reson. Med. 62, 1609–1618. doi: 10.1002/mrm.22147
Zhang, J., Wang, Y., Li, J., and Yang, P. (2008). “A neural network model for predicting cotton yields,” in Computer and Computing Technologies in Agriculture: First IFIP TC 12 International Conference on Computer and Computing Technologies in Agriculture (CCTA 2007), Vol. II, ed. D. Li (Wuyishan: Springer), 1321–1322.
Zhao, Z., Timofeev, N., Hartley, S. W., Chui, D. H. K., Fucharoen, S., Perls, T. T., et al. (2008). Imputation of missing genotypes: an empirical evaluation of IMPUTE. BMC Genet. 9:85. doi: 10.1186/1471-2156-9-85
Zhou, G., Zhang, Q., Zhang, X.-Q., Tan, C., and Li, C. (2015). Construction of high-density genetic map in barley through restriction-site associated DNA sequencing. PLoS ONE 10:e0133161. doi: 10.1371/journal.pone.0133161
Keywords: genetic map, high-density, single nucleotide polymorphism, wheat, prediction, map expansion, inflation factor, machine learning
Citation: N’Diaye A, Haile JK, Fowler DB, Ammar K and Pozniak CJ (2017) Effect of Co-segregating Markers on High-Density Genetic Maps and Prediction of Map Expansion Using Machine Learning Algorithms. Front. Plant Sci. 8:1434. doi: 10.3389/fpls.2017.01434
Received: 20 April 2017; Accepted: 03 August 2017;
Published: 23 August 2017.
Edited by:
Agata Gadaleta, Università degli Studi di Bari Aldo Moro, ItalyReviewed by:
Eduard Akhunov, Kansas State University, United StatesMarco Maccaferri, Consiglio per la Ricerca in Agricoltura e l’Analisi dell’Economia Agraria (CREA), Italy
Copyright © 2017 N’Diaye, Haile, Fowler, Ammar and Pozniak. This is an open-access article distributed under the terms of the Creative Commons Attribution License (CC BY). The use, distribution or reproduction in other forums is permitted, provided the original author(s) or licensor are credited and that the original publication in this journal is cited, in accordance with accepted academic practice. No use, distribution or reproduction is permitted which does not comply with these terms.
*Correspondence: Curtis J. Pozniak, curtis.pozniak@usask.ca