 Yi Yang
 Yusen Shen
 Shunda Li
 Xianhong Ge
 Zaiyun Li
- National Key Laboratory of Crop Genetic Improvement, National Center of Oil Crop Improvement, College of Plant Science and Technology, Huazhong Agricultural University, Wuhan, China
Seeds per silique (SS), seed weight (SW), and silique length (SL) are important determinant traits of seed yield potential in rapeseed (Brassica napus L.), and are controlled by naturally occurring quantitative trait loci (QTLs). Mapping QTLs to narrow chromosomal regions provides an effective means of characterizing the genetic basis of these complex traits. Orychophragmus violaceus is a crucifer with long siliques, many SS, and heavy seeds. A novel B. napus introgression line with many SS was previously selected from multiple crosses (B. rapa ssp. chinesis × O. violaceus) × B. napus. In present study, a doubled haploid (DH) population with 167 lines was established from a cross between the introgression line and a line with far fewer SS, in order to detect QTLs for silique-related traits. By screening with a Brassica 60K single nucleotide polymorphism (SNP) array, a high-density linkage map consisting of 1,153 bins and spanning a cumulative length of 2,209.1 cM was constructed, using 12,602 high-quality polymorphic SNPs in the DH population. The average recombination bin densities of the A and C subgenomes were 1.7 and 2.4 cM, respectively. 45 QTLs were identified for the three traits in all, which explained 4.0–34.4% of the total phenotypic variation; 20 of them were integrated into three unique QTLs by meta-analysis. These unique QTLs revealed a significant positive correlation between SS and SL and a significant negative correlation between SW and SS, and were mapped onto the linkage groups A05, C08, and C09. A trait-by-trait meta-analysis revealed eight, four, and seven consensus QTLs for SS, SW, and SL, respectively, and five major QTLs (cqSS.A09b, cqSS.C09, cqSW.A05, cqSW.C09, and cqSL.C09) were identified. Five, three, and four QTLs for SS, SW, and SL, respectively, might be novel QTLs because of the existence of alien genetic loci for these traits in the alien introgression. Thirty-eight candidate genes underlying nine QTLs for silique-related traits were identified.
Introduction
Oilseed rape (Brassica napus L., genomes AACC, 2n = 38) is the second-leading source of both vegetable oil and meal worldwide (USDA, 2017). The rapid growth of the global human population requires significant improvements in crop yield. The seed yield of B. napus is a complex trait that is determined by seeds per silique (SS), siliques per plant (SP), and seed weight (SW) (Chen et al., 2007), which are typical quantitative traits. As significant negative correlations among silique-related traits have been reported, it is critical to balance these traits in breeding programs (Hall et al., 2006; Shi et al., 2015) by identifying the quantitative trait loci (QTLs) or genes responsible for each trait. Because the complex nature of the yield associated traits in B. napus hampers conventional breeding programs, QTL mapping using molecular markers would reveal the genetic status of both yield components and silique-related traits. QTLs related to yield components in B. napus have been detected in different mapping populations (Clarke and Simpson, 1978; Butruille et al., 1999; Hall et al., 2006; Qiu et al., 2006; Udall et al., 2006; Chen et al., 2007; Radoev et al., 2008; Shi et al., 2009, 2011, 2015; Basunanda et al., 2010; Fan et al., 2010; Wang and Guan, 2010; Zhang et al., 2010, 2012; Ding et al., 2012; Yang et al., 2012; Li N. et al., 2014; Qi et al., 2014; Luo et al., 2017). QTLs for SS, SW, and SL have been mapped onto most B. napus chromosomes, except for A03, A04, A06, A10, C05, and C08, and accounted for 2.7–32.1, 0.7–34.8, and 1.9–65.6% of the total phenotypic variation in each mapping population, respectively.
Most linkage QTL mapping studies and association analysis studies involving silique-related traits in rapeseed have mainly consisted of primary mapping results with rare follow-up studies, making investigations into the genetic and molecular mechanisms underlying SS, SW, and SL difficult. This situation is likely attributable to two facts. First, the complicated allopolyploid genomes causes problems in QTL mapping, such as inaccuracies resulted from rearrangement of homologous sequences in different chromosomes. Second, the mainly used the second generation of molecular markers like SSR and AFLP in previous studies are at a low density across the genome and consequently result in low mapping precision. To date, only two silique-related trait genes have been cloned in rapeseed. One is the major QTL for SS, qSS.C9 (Zhang et al., 2012), which played a role in regulating the formation of functional female gametophytes (Li et al., 2015). Another is an auxin-response factor gene (ARF18) involved in both SL and SW QTLs (Liu et al., 2015). ARF18 inhibited the activity of downstream auxin genes, which regulated silique wall development and determined SW via maternal regulation (Liu et al., 2015).
QTL analysis has been accelerated by recent innovations in bioinformatic techniques and sequencing methods, due to their efficient high-throughput genotyping using single nucleotide polymorphism (SNP) markers that create high-density genome-coverage marker systems for the investigation of complex traits (Thomson, 2014). The 60K Illumina Infinium™ SNP array for B. napus, can deliver high-throughput, gene-based, and low-cost genotype screening for mapping populations (Delourme et al., 2013; Clarke et al., 2016). This system is efficiently powerful to localize the QTLs to a narrow genomic interval and even supply defined markers within QTL that controls the trait of interest (Kumar et al., 2017). Twelve genes that underlie eight QTLs for SW have been revealed by comparative mapping between Arabidopsis and Brassica species, and a gene-specific marker for BnAP2 was developed (Cai et al., 2012). Using a set of 2,795 SNP/bin markers, a genetic linkage map covering 1,832.9 cM was constructed, and a previous major QTL for seed color and acid detergent lignin was localized to a small genomic interval on chromosome A09 (Liu et al., 2013).
The relatively narrow genetic diversity of modern breeding materials restricts the further improvement of yield potential (Basunanda et al., 2010), and the development of novel germplasm from diploid progenitors or other wild species is an important way of widening genetic variations for rapeseed (Qian et al., 2005; Basunanda et al., 2007; Zou et al., 2010; Girke et al., 2012; Snowdon et al., 2015). Orychophragmus violaceus (2n = 24, OO) of the Brassicaceae family is cultivated as an ornamental plant in China and is characterized with long silique, high seed number per silique, and large seeds (Luo et al., 1994). A single sexual intergeneric hybrid between B. rapa ssp. chinesis (2n = 20, AA) as the female and O. violaceus as the pollen parent was a partially fertile mixoploid (2n = 23–42), and contained the B. rapa complement plus some additional O. violaceus chromosomes, due to partial chromosome elimination (Li and Heneen, 1999). After pedigrees of individual F2 plants from this partial hybrid were advanced to the 10th generation by selfing, many novel, highly productive lines were established, which exhibited not only a wide variety of phenotypes but also variable seed quality. These lines had 2n = 36–40, with 2n = 38 being the most frequent, but no intact O. violaceus chromosomes (Xu et al., 2007). These lines contained a variable number of chromosomes from the A subgenome and 18 chromosomes form the C subgenome (unpublished data), possibly because the progenies of the hybrid at certain generations were pollinated by B. napus plants that were growing nearby. Lines with 2n = 38 and a B. napus-like chromosome complement produced siliques with far more seeds than the B. rapa parent or common B. napus cultivars but comparable with those of O. violaceus.
In this study, a B. napus doubled haploid (DH) population was developed from a cross between a novel introgression line and a line with far fewer SS, and was genotyped using a Brassica 60K Illumina Infinium™ SNP array for the purpose of constructing a high-density genetic map. The map, coupled with phenotypic data obtained from five environments, was then used to conduct QTL analysis for SS, SL, and SW. Five major QTLs for the three silique-related traits were detected, which should be fine-mapped for the improvement of silique-related traits in breeding programs.
Materials and Methods
Plant Materials
A DH population with 167 lines was developed by microspore culture from the cross between female parent No. 1167 and male parent HZ396 (Figure S1). No. 1167 was one DH line that was generated from a novel B. napus introgression via multiple crosses (B. rapa ssp. chinesis × O. violaceus) × B. napus (Li and Heneen, 1999; Xu et al., 2007) and had 2n = 38 with stable cytological behavior. As O. violaceus had a high number of seeds per pod (~40), the introgression had ~35 seeds per pod, but line No. 1167 had relatively few seeds per pod likely due to the genetic segregation. HZ396 provided by Prof. Guangsheng Yang, Huazhong Agricultural University had very few SS, because the female gametophytes aborted (Zhang et al., 2010). This DH population was used for genetic linkage map construction and subsequent QTL analysis.
Experimental Design and Trait Measurement
The 167 DH lines and the two parents were grown in a randomized complete block with multiple replicates and environments in 2015 and 2016 (Wuhan, Hubei Province, three replicates; Ezhou, Hubei Province, two replicates; Kunming, Yunnan Province, two replicates; and Chengdu, Sichuan Province, one replicate). The Wuhan, Ezhou, and Chengdu sites were semi-winter-type rapeseed growing environments, while Kunming was a spring-type site. Each line was grown in a plot in two rows with 10–13 plants in each row with spacing of 30 × 20 cm. Field management was conducted under standard agricultural procedures. All plots in different trials were harvested at the same time after all lines matured.
Silique-related traits (SS, SL, and SW) were used for QTL mapping, and open-pollinated seeds and siliques from the middle of the main inflorescence were used to measure SW, SS, and SL for each mature plant. The average length (not including the beak) and seed number of 10 well-developed siliques were used to measure the SS and SL of each plant, and the average weight of one thousand fully developed open-pollinated dry seeds was measured for SW.
Genotyping and Linkage Map Construction
DNA of the DH population and the two parents was extracted from young leaf samples before flowering. The leaf tissues were frozen in liquid nitrogen before the DNA was isolated using a Plant Genomic DNA Kit (CWBIO Inc., Beijing, China), following the manufacturer's instructions. After fluorometrically quantifying the DNA concentration using Qubit® 2.0, the samples were diluted to 50–100 ng/μL in sterile distilled water. The quantified DNA samples were then used for SNP analysis. The DH population and their parents were genotyped using the Brassica 60K Illumina Infinium™ SNP array (Clarke et al., 2016), according to the manufacturer's instructions (https://www.illumina.com/techniques/microarrays.html). Allele calling was conducted by Illumina Genome Studio data analysis software V2010.1. All of the called SNPs were searched against the B. napus cv. “Darmor-bzh” reference genome (Chalhoub et al., 2014) using the basic local alignment search tool (BLAST, E-value ≤ 1E-20). Markers with allelic frequencies lower than 0.05 and those with 10% missing values or more were removed.
Genetic linkage analysis was performed using MSTMap (Wu et al., 2008), which efficiently handled ultra-dense datasets. All of the genotypic data from the DH population were analyzed, and the MSTMap parameters were as follows: the distance_function was kosambi, the cut-off p-value was 1E-18, and no_map_dist was 15.0. Markers with the same genotypes in corresponding individuals were merged into one bin, which contained these redundant markers.
Statistical Analysis and QTL Mapping
The phenotypic characteristics of the parents were compared using Student's t-tests, and phenotypic correlations between pairs of traits were calculated using the Pearson correlation coefficient with the procedure CORR in SAS software (SAS Institute Inc, 2000). Heritability was calculated as where is genetic variance, is the variance representing genotype by environment interactions, is the error variance, n is the number of environments, and r is the number of replicates. Year-location combinations were treated as different environments. Components of variance (, and ) were estimated using the mixed linear model (MIXED) procedure in SAS, with environment included as a random effect. Subsequently, an R script based on a linear model was used to obtain the best linear unbiased prediction (BLUP) of the multi-environment phenotypes for each accession (Merk et al., 2012). The BLUPs and individual environment data were then included as phenotypes in a linkage analysis.
QTL analysis was performed by the composite interval mapping method (Wang et al., 2011) in Windows QTL Cartographer V2.5 (http://statgen.ncsu.edu/qtlcart/WQTLCart.htm). The experiment-wise logarithm (base 10) of odds (LOD) threshold value was determined after 1,000 permutations at the 0.05 significance level (Churchill and Doerge, 1994). A LOD score corresponding to p = 0.05 (3.2–6.5) was used to identify significant QTLs. QTLs with low effect values and corresponding threshold values higher than 2.5 for each trait were used to identify suggestive QTLs that had relatively small effects. After deleting non-reproducible suggestive QTLs, significant QTLs and reproducible suggestive QTLs remained and named as identified QTL. Identified QTLs detected in the different environments were integrated into consensus QTLs, and subjected to a meta-analysis using BioMercator v4.2 (Arcade et al., 2004). Consensus QTLs were identified trait-by-trait, and in the first round of the meta-analysis, two types of consensus QTLs were identified: major QTLs (those with R2 ≥ 20%, or R2 ≥ 10% in more than one environments) and minor QTLs (other QTLs with minor effect). In the second round, QTLs for diverse traits with overlapping confidence intervals (CIs) were integrated into unique QTLs.
Candidate Genes Identification
We download all sequences of annotated genes derived from the B. napus reference enome “Darmor-bzh” (Chalhoub et al., 2014), then these sequences were used to conduct BLAST against the genes of Arabidopsis, with the threshold of 1E-30 for E-value. The best hit of BLAST results for each B. napus gene was considered as the homologs to Arabidopsis. Next, the genes for three silique-related traits and other potential associated traits (including flowing time and maturity time) for Arabidopsis were downloaded in bulk from the website (http://www.arabidopsis.org/tools/bulk/sequences/index.jsp). All homologs associated with these traits in B. napus were selected, and subsequently the homologous genes within the CIs of corresponding QTLs were selected as putative candidate genes for the QTLs.
Results
Phenotypic Variation among DH Lines
The two parents (No. 1167 and HZ396) differed significantly in SS, SW, and SL in all four environments investigated (Table 1). The average SS of No. 1167 was ~3-fold higher than that of HZ396, while the average SW of HZ396 was nearly 1.5 times that of No. 1167. The average SL of No. 1167 was nearly 1.6-times that of HZ396.
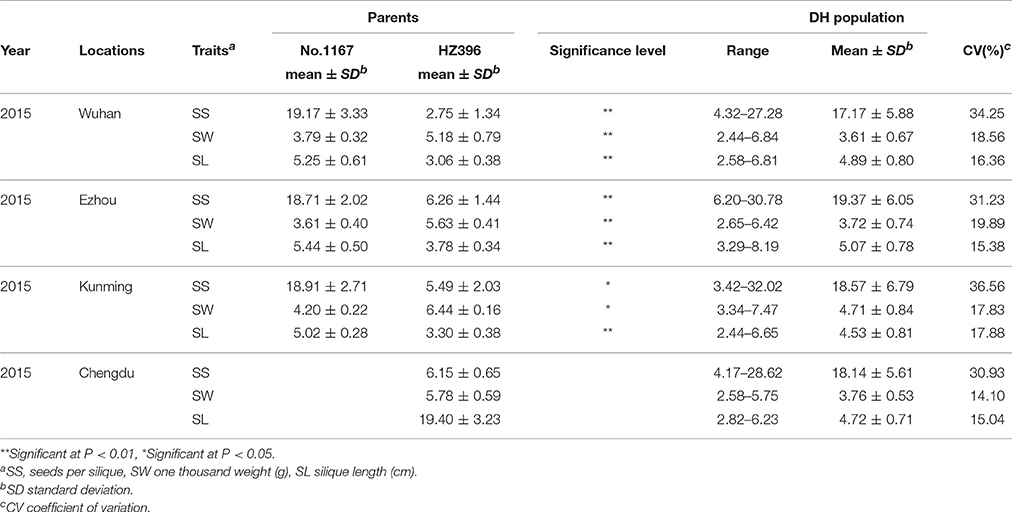
Table 1. Descriptive statistics for the three silique-related traits in the two parents and the DH population.
Frequency distributions of all the traits measured in 167 DH lines were continuous and near the normal distribution in all off the environments (Figure 1), indicating a polygenic inheritance pattern. Regarding phenotypic variation in the entire mapping population, the traits had high coefficients of variation that ranged from 14 to 37%, indicating wide variation (Table 1). This observation was also verified by the results of an analysis of variance (ANOVA), which indicated highly significant differences among the DH lines (p < 0.001) in the three traits investigated (Table 2). Our results suggest that parental genotypes generated a huge amount of recombinants, which resulted in a wide range of genetic variation in the population and facilitated QTL mapping. In addition, the populations exhibited transgressive segregation of the three traits (Table 1), indicating that favorable alleles were mainly in the two parents. A two-way ANOVA of SS, SW, and SL across the environments revealed that the genotype of each DH (G), the growing environment (E), and a genotype-environment interaction (G × E) had significant effects on SS, SL, and SW (Table 2). However, the G × E effects were non-significant, because they were minor compared to the genotype and environment effects. Broad-sense heritability (h2) was also calculated for SS, SW, and SL (Table 2). SS and SW had high h2 -values of 90.3 and 90.6%, respectively, suggesting that they were stable and insensitive to environmental effects, which is generally consistent with the results of previous studies (Shi et al., 2009; Fan et al., 2010). The lower h2 -value of 79.3% for SL indicated that it was more sensitive and plastic to environmental conditions.
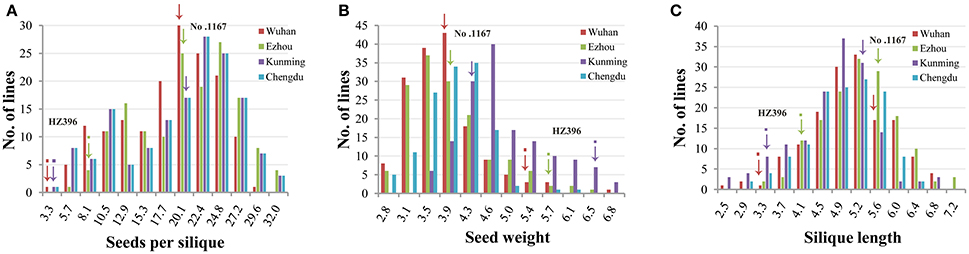
Figure 1. Phenotypic variation of the three traits in the DH populations. Panels (A–C) show the distribution of seeds per silique, seed weight, and silique length. The horizontal axis represents the trait value of seed number per pod, seed weight, and silique length. The vertical axis represents the number of individuals within the population. The different experiments are represented by different colors as indicated in the legend. Wuhan, Ezhou, Kunming, and Chengdu were the codes of the four experiments which have been in detail described in the first section of Methods.
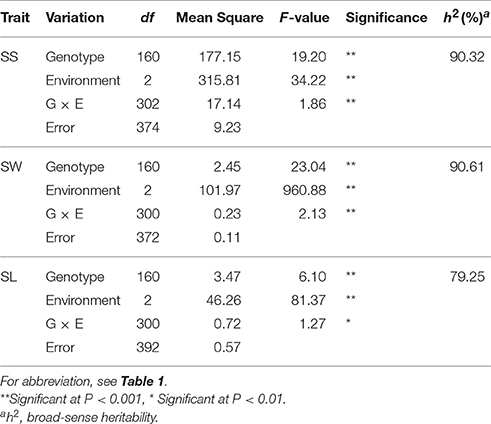
Table 2. Summary of all effects from two-way ANOVA of the traits in DH population.
As expected, significant, positive correlations were found among SS, SL, and SW in each environment. The Pearson correlation analysis revealed that SS was significantly and positively correlated with SL, which is generally consistent with the results of previous studies (Zhang et al., 2012), but negatively correlated with SW. SW was significantly and negatively correlated with SL in almost all the environments (Table S1). All the traits studied were correlated with each other in most of the environments, indicating the co-dependence of the phenotypic responses.
Construction of a High-Resolution Linkage Map
The 167 DH lines and their parents were genotyped using 52,157 SNP loci, and 12,602 markers were found to be polymorphic using a series of quality filters. A high-density genetic map of 19 linkage groups (LGs), which were successfully assigned to the 19 chromosomes of the A (A01–A10) and C (C01–C09) subgenomes, was constructed using MSTMap (Table 3, Table S2, and Figure 2). We found that 6,617 and 5,985 markers were mapped onto the A and C subgenomes, respectively, confirming that the A subgenome had higher genetic diversity than the C subgenome. After clustering the redundant SNPs with same genotype, finally there were 1,153 bins (the region with no recombination in the population and considered as one marker with same genotype) left for the 19 LGs, and the bin number in the A subgenome was significantly higher than that in the C subgenome (720 vs. 433, p = 0.03). The lengths of the 19 LGs ranged from 70.2 cM (C06) to 220.6 cM (A09), with the sum and mean of 2,209.1 cM and 116.3 cM, respectively. The genetic distance between adjacent bins differed among LGs, and ranged from 1.1 to 3.7 cM, with an average interval of 1.7 and 2.4 cM for the A and C subgenomes, respectively (Table 3). In the process of data analyses, we found that three markers: Bn-A05-p18490530 (A05: 16,760,025..16,760,124), Bn-A07-p17639842 (A07: 19,527,996..19,528,095) and Bn-scaff_21003_1-p463835 (C08: 4,072,167..4,072,262) exhibited distorted segregation, with the segregation ratio of 96.3%, 92.1 and 88.6%, respectively. They all skewed toward the No. 1167 (female parent) and were not included in the linkage map.
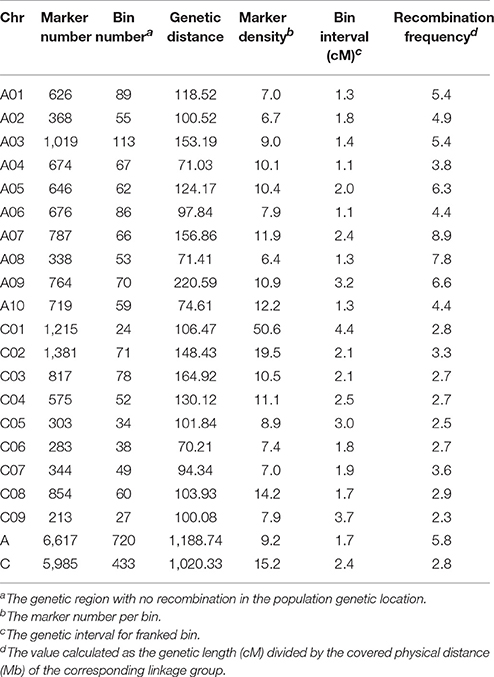
Table 3. Summary statistics of the linkage map.
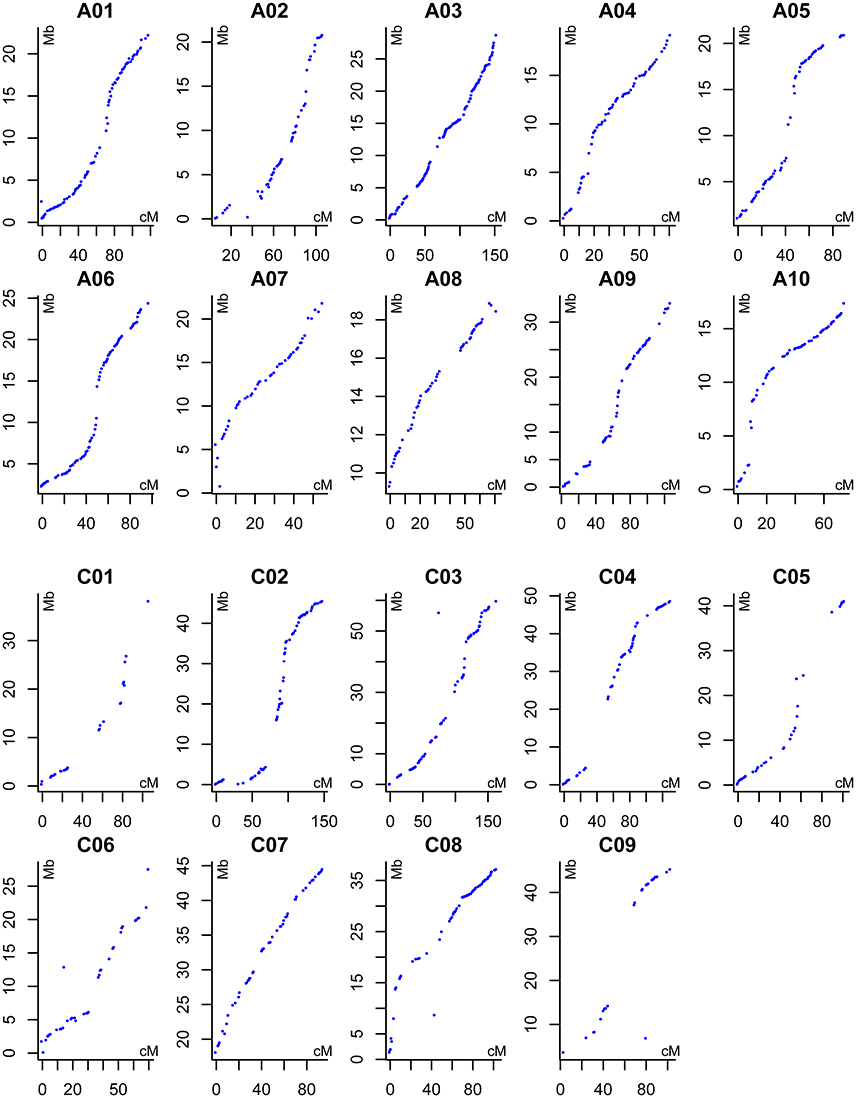
Figure 2. Alignments between the DH linkage map and the B. napus reference genome sequence. The X axis indicates the genetic position of each marker (cM), the Y axis indicates the physical position of reference sequence of each corresponding B. napus chromosomes (Mb).
QTL Analysis of the Three Silique-Related Traits
The genome-wide QTL analysis was performed separately for SS, SW, and SL using the 1,153 markers coupled with corresponding phenotypic data that were obtained from the DH population in five environments (four growing environments and the BLUP values across environments), and 52 QTLs were detected for three traits. After deleting seven non-reproducible, suggestive QTLs, 45 QTLs for SS, SL, and SW were detected in the five environments (Tables S3 and Figure 3). These QTLs were mapped onto 10 chromosomes (A03, A04, A05, A07, A09, C02, C03, C06, C08, and C09). The meta-analysis integrated QTLs that were located on the same LGs into consensus QTLs trait-by-trait. As a result, the 45 QTLs identified were integrated into 19 consensus QTLs (Table 4 and Figure 3), eight, four, and seven of them were detected for SS, SW, and SL, respectively. Some consensus QTLs, such as cqSS.A09b, cqSS.C09, cqSWA05, cqSW.C09, and cqSL.C09, had major effects, whereas others exhibited minor effects.
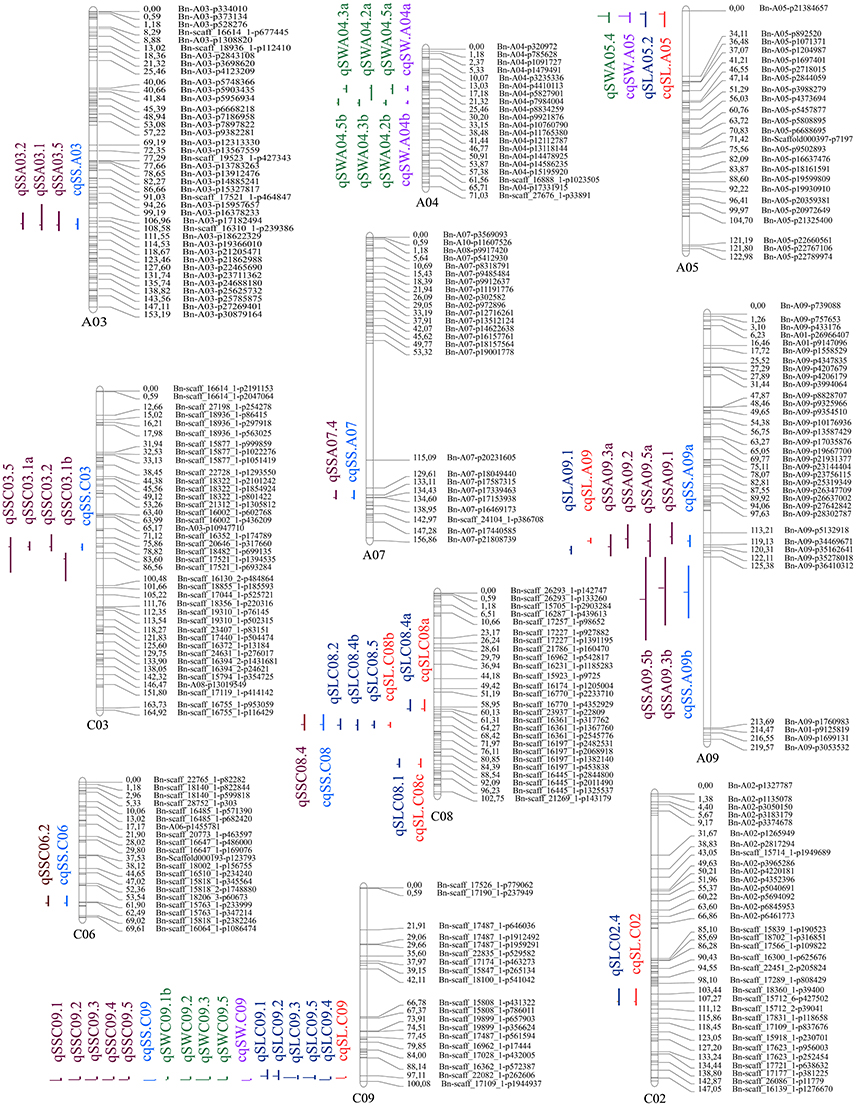
Figure 3. Genetic linkage map and QTL detection of the three silique-related traits in the DH population derived from No. 1167 × HZ396.
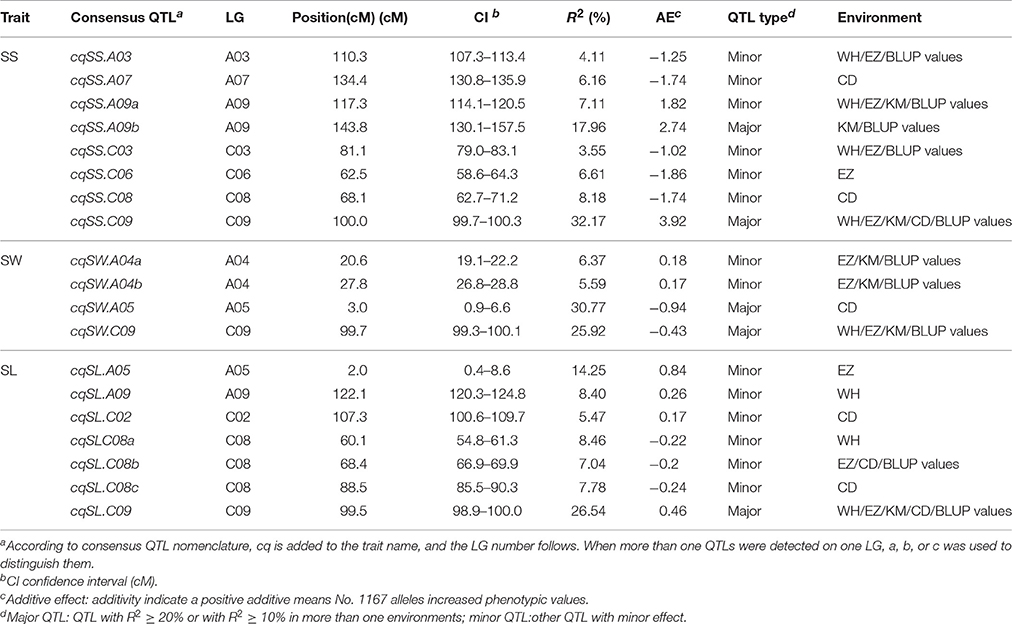
Table 4. Consensus QTLs for the silique-related traits investigated in the DH mapping population.
For SS, 22 QTLs were detected in each environment, as well as the BLUP values across environments (Table S3). To avoid false-positive QTLs caused by a less-stringent LOD threshold, we deleted one non-reproducible, suggestive QTL. Consequently, 21 QTLs were identified for SS, which were on seven chromosomes (A03, A07, A09, C03, C06, C08, and C09). Individual QTLs explained 4.00–34.42% of the phenotypic variation in SS. These QTLs explained 54.15, 55.31, 58.13, 46.00, and 62.63% of the total phenotypic variation in Wuhan, Ezhou, Kunming, Chengdu, and the BLUP values, respectively. To examine whether the QTLs detected in the different environments were reproducible, we compared the CIs of QTLs mapped on the same chromosomes. Subsequently, the 21 QTLs were integrated into eight single consensus QTLs (Table 4). Of the eight consensus QTLs, two (cqSS.A09b and cqSS.C09) were identified in the mapping population and exhibited main effects and positive additive effects, indicating that the parent (No. 1167) contributed favorable alleles. Three minor QTLs (cqSS.A03, cqSS.A09a, and cqSS.C03) detected in multiple environments explained < 10.0% of the total phenotypic variation in each environment.
Thirteen QTLs for SW were detected in the different environments. After deleting two non-reproducible, suggestive QTLs, 11 QTLs were identified (Table S3), which were located on LG A04, A05, and C09, and explained 4.10–38.91% of the total phenotypic variation. If the CIs of these QTLs overlapped in different environments, they were integrated into a single consensus QTL for each trait. Four consensus QTLs were obtained (Table 4).
The consensus QTLs for SW explained 5.59–30.77% of the total phenotypic variation. The additive effects of the consensus QTLs for SW ranged from −0.94 to 0.18. Two major consensus QTLs (cqSW.A05 and cqSW.C09) in the A05 and C09 LGs were detected. Because cqSW.C09 was repeatedly detected in four environments and had the greatest phenotypic variation (R2 = 38.90%), it was treated as a major QTL. The effect of cqSW.C09 was negative, meaning that the positive allele for SW was inherited from HZ396.
QTL analysis was also conducted for SL. Thirteen QTLs were identified in Wuhan, Ezhou, Kunming, Chengdu, and the BLUP values, which cumulatively explained 35.37, 33.48, 36.05, 53.94, and 39.33%, respectively, of the total phenotypic variation (Table S3), and then were integrated into seven consensus QTLs (Table 4). One consensus QTL (cqSL.C09) had positive additive effects, indicating that the parent (No. 1167) contributed the favorable allele.
As a previous study reported that correlated traits tended to share a higher proportion of QTLs than uncorrelated ones (Gardner and Latta, 2007), the correlations among SS, SW, and SL prompted us to examine whether the CIs of QTLs for SS, SW, and SL overlapped. The CIs of cqSS.C09, cqSW.C09, and cqSL.C09 overlapped each other in the five environments (Table 4). The meta-analysis integrated these overlapping QTLs into one unique QTL, uq.C09, indicating that this QTL may have the had pleiotropic effect on SL, SW, and SL (Table 5). Two pairs of consensus QTLs (cqSW.A05 and cqSL.A05, and cqSS.C08 and cqSL.C08b) were integrated into two unique QTLs, which were renamed uq.A05 and uq.C08, respectively. The unique QTL uqC09 had different favorable allele contributions, cqSS.C09 and cqSL.C09 had positive additive effects, while the additive effects of cqSW.C09 were negative at the same locus, which could explain the positive correlation between SS and SL and the negative correlation between SS and SW. The unique QTLs uqA05 and uqC08 that were mapped for SW and SL as well as SS and SL, respectively, exhibited the opposite trend of parental contributions.
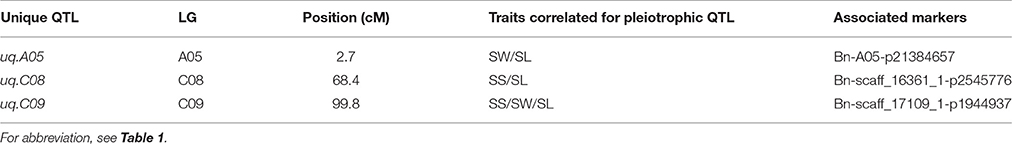
Table 5. The list of pleiotropic unique (uq) QTLs obtained after meta-analysis in all environment using the DH population.
Alignment of Present and Previous QTLs
In order to facilitate the comparison and further utilization of QTLs for the Brassica researchers, we collected the results of the vast majority of QTL mapping studies conducted on B. napus. In total, 221, 489, and 78 QTLs for SS, SW, and SL, respectively, have been reported in B. napus. QTL positions from previous studies and the present study were compared based on the reference genome of B. napus, “Darmor-bzh” (Chalhoub et al., 2014). Finally, 177 QTLs for silique-related traits successfully mapped to the genome (Table S4 and Figure S2).
QTL cqSS.A03 (present study) was identical to qSN020 (Shi et al., 2009), and one previous QTL qSN053 for SS (Shi et al., 2009) were identical to cqSS.C08 (present study). Our cqSS.C09 for SS was similar to qSS.N19, a major QTL on C09 identified using a DH population involving HZ396 used here (Zhang et al., 2011). QTL cqSW.A04b (present study) was identical to the QTL qSW034 for SW (Shi et al., 2009). One QTL for SL on C08 identified by Udall et al. (2006) might be identical to one of the QTLs for SL here, and two QTLs for SL from Li N. et al. (2014) was possibly identical to our QTLs on A09 and C02. Seven previous QTLs were reproduced, and 12 QTLs were novel identified in the present study, five, three, and four of which were for SS, SW, and SL, respectively.
As previous studies suggest that various phenological traits such as flowering time and maturity time had certain effect on grain yield and its components (Kirkegaard et al., 2016), we investigated the QTLs associated with the traits mentioned above. Through conducting the alignment of identified QTLs with previously published studies on flowering time and maturity time, 9 and 11 QTLs overlapped with 9 and 10 consensus QTLs from this study, respectively. For instance, qFT.A3-14 (FT), qMT.A3-4 (MT), qMT.A3-5 (MT), RF2qMT11 (MT), and DHqMT12 (MT) overlapped with cqSS.A03; qMT.A4-6 (MT) overlapped with cqSW.A04a (MT); qFT.A5-1 (FT), RF2qFT43 (FT), qFT093 (FT), qMT.A5-3 (MT), and RF2qMT13 (MT) overlapped with uqA05; qMT.C8-5 (MT) overlapped with uqC08; qFT.C9-3 (FT), dtf19.1 (FT), and, qMT.C9-2 (MT) overlapped with uq C09. And others were listed in the Table S4.
Prediction of Silique-Related Genes in Rapeseed
In order to predict candidate genes related to SS, SW, and SL, we identified B. napus genes that were homologous to Arabidopsis thaliana silique-related genes that were within the CIs of the QTLs. Based on the B. napus reference genome (Chalhoub et al., 2014), 27 homologous genes that controlled silique-related traits in Arabidopsis were within the CIs of nine consensus QTLs (Table S5 and Figure S2). Of these, BnaA09g40790, BnaCnng45760, and BnaC09g45890 were identified for SS, which were homologous to the Arabidopsis genes MOT1, TTG2, and SMG7, respectively, and were within the CIs of cqSS.A09a and cqSS.C09. For SW, 28 genes were identified within the CIs of three consensus QTLs (cqSW.A04a, cqSW.A05, and cqSW.C09), homologous to 23 Arabidopsis genes. For SL, eight genes were identified within the CIs of four consensus QTLs (cqSL.A05, cqSL.A09, cqSLC08a, and cqSL.C09), and were homologous to four Arabidopsis genes.
The homologs in Arabidopsis of candidate genes we identified in this study could be divided into several functional groups, including transcription factors, enzymes, protein structure units, phytohormone response factors, and transporters. Among these predicted genes, the most abundant were related to the transcription factors AGL, ANT, FIE, IKU1, MINI3, and TTG2. AGL encoded a MADS-domain protein that functioned as a transcription factor; ANT was required for the control of cell proliferation and encoded a putative transcriptional regulator similar to AP2 (Manchado-Rojo et al., 2014); FIS2 and FIS3 encoded a Transducin/WD40 repeat-like superfamily transcription factor; and IKU1, MINI3, and TTG2 were members of the WRKY transcription factor family. The enzymes were AHK 1 (a histidine kinase 1), CKI1 (a signal transduction histidine kinase), KLU (a cytochrome P450 monooxygenase) and AHPs (AHP1, AHP2, AHP3, AHP4, and AHP5), which encoded A. thaliana histidine phosphotransfer proteins that functioned as redundant positive regulators of cytokinin signaling. Protein structure units, such as MSI1, encoded a WD-40 repeat-containing protein that functioned as part of the CAF1-FIE complex. ARF2 encoded an auxin response factor, and MOT1 encoded a high-affinity molybdate transporter. We also found that the gene AT1G26530 encoded a PIN domain-like family protein of unknown function.
Due to the availability of the Arabidopsis flowering time regulation network, 245 homologous genes of 103 flowering time-related genes in Arabidopsis were collected using the in silico mapping approach. Among them, 18, 21, 9 genes were mapped to the regions of QTLs for SS, SW and SL, respectively (Table S6). The vital genes underlying the QTLs for controlling flowering time were found, such as BnaA07g25310 (TSF) in the confidence interval of cqSS. A07. Nearby the peak of cqSS.A09a and cqSLC08a, there existed BnaA09g47030 (DDF1) and BnaC08g25840 (SMZ), respectively. BnaA07g24950 (ATMBD9) fell into the confidence interval of cqSS.A07, and BnaA05g20150 (FIE) and BnaA05g26370 (PIE1) were in the confidence interval of uqA05.
Discussion
Linkage Map Construction and Silique-Related-Trait QTL Detection
DH lines are used for silique-related QTL analysis because multiple locations can be used due to their stable genotypes, and interactions between silique-related QTLs and the environment can also be investigated. In this study, using a novel B. napus introgression that was derived from multiple crosses (B. rapa ssp. chinesis × O. violaceus) × B. napus and had many SS, we developed a DH population that exhibited great variation in all the traits investigated, and was ideal for genetic map construction and QTL detection (Figure 1). The molecular map developed in this study covered a total of 2,209.1 cM with an average interval of 1.9 cM between marker loci (Table 3), indicating high-density markers for possible applications in gene discovery studies. The good collinearity between the DH linkage map and the B. napus reference genome sequence confirmed the high quality of the present linkage map (Figure 2), which would guide the fine-mapping and map-based cloning of target genes underlying the QTLs by comparative mapping of the present linkage map and the physical map. Of the 45 QTLs identified for the three silique-related traits, 13 were novel and some had major effects, revealing the possible existence of alien genetic loci.
Novel QTLs for SS, SW, and SL
Of silique-related trait QTLs from previous linkage-based QTL mapping studies, a total of 177 QTLs mapped to the genome (Table S4). Among them, 54 were identified for SS (Shi et al., 2009; Luo et al., 2017), 122 for SW (Butruille et al., 1999; Udall et al., 2006; Shi et al., 2009; Luo et al., 2017), and one for SL(Udall et al., 2006), which were on 16 (A01–A05, A07–A10, C01, C03-C06, C08, and C09), 19 (A01–A10 and C01–C10) and one (C08) LGs, respectively (Table S4).
Fifty-two QTLs for the three traits were identified in our DH population. After deleting seven non-reproducible, suggestive QTLs in the first round of the meta-analysis, 45 QTLs were integrated into 19 consensus QTLs. Most of these QTLs had a moderate effect (R2 < 20%), and five (cqSS.A09b, cqSS.C09, cqSW.A05, cqSW.C09, and cqSL.C09) could be considered major QTLs. Of these, ten were repeatedly detected, and the other nine were environment-specific (Table 4). These QTLs were distributed on 10 LGs (A03, A04, A05, A07, A09, C02, C03, C06, C08, and C09). To accurately identify the positional relationships of the QTLs from our and previous studies, a comparative QTL analysis was performed based on the physical map of B. napus (Chalhoub et al., 2014). Eight SS, four SW, and seven SL consensus QTLs were identified in present study, and three (cqSS.A03, cqSS.C08 and cqSS.C09), one (cqSW.A04-2) and three (cqSL.A09, cqSL.C02 and cqSL.C08), respectively, were found by previous studies. The QTLs in present study, cqSS.A03 and cqSS.C08, probably corresponded to previous qSN020 and qSN053, respectively, and were located around the common markers CNU276 and CB10504 (Shi et al., 2009). A major QTL (qSS.N19) for SS (Zhang et al., 2011) was similar to our cqSS.C09. Furthermore, Li et al. (2015) identified the BnaC9.SMG7b gene underlying the qSS.N19 QTL by map-based cloning. The consensus QTLs cqSW.A04b and cqSL.C08a were overlapped with qSW034 and ln18.5 QTLs, respectively (Udall et al., 2006; Shi et al., 2009), and two QTLs for SL identified by Li N. et al. (2014) might be identical to our QTLs on A09 and C02. More importantly, QTLs for SL on A05 and C09 were detected for the first time. Our other 12 consensus QTLs (cqSS.A07, cqSS.A09a, cqSS.A09b, cqSS.C03, cqSS.C06, cqSW.A04a, cqSW.A05, cqSW.C09, cqSL.A05, cqSL.C08b, cqSL.C08c, and cqSL.C09) should be novel. Of these novel consensus QTLs, cqSS.A09b, cqSW.A05, cqSW.C09, and cqSL.C09 were major QTLs detected in this study, and would be important targets for map-based cloning. Unfortunately, the DH line No. 1167 which was used as a parent to develop the mapping population had few SS than the original introgression. Otherwise, more major QTLs for these traits may be identifiable. Nevertheless, our results show that all three traits are controlled by many loci that mainly have small effects.
Co-localization of QTLs for Silique-Related Traits
From the second round of the meta-analysis revealing significant co-localization of QTLs, three unique QTLs were identified and located on the LGs A05, C08, and C09, and all had pleiotropic effects. Such QTLs should be separated from QTLs that affected more than one trait because of genetic linkage. These unique, pleiotropic QTLs confirmed the result that a significant, positive correlation existed between SS and SL and a significant, negative correlation between SW and SS (Zhang et al., 2011). As pleiotropic genes had large genetic effects on trait mapping (Wang and Guan, 2010), the QTLs on A05 and C09 showed larger genetic effects and higher LOD scores than other QTLs. The significant co-localizations indicated that the silique-related traits were dependent upon each other, and pleiotropic QTLs were the main genetic factors for the silique-related traits in our DH population. The loci of pleiotropic QTLs contained many tightly linked, trait-specific genes, or genes that affected multiple traits (Hall et al., 2006). The meta-analysis allowed us to localize the genomic region for QTLs, which would facilitate studies into molecular cloning and QTL functioning by comparing the B. napus and A. thaliana genomes. Interestingly, genes for SW and cell expansion effects in A. thaliana, such as MINI3, TTG2, and MSI1 (Table S5; Cai et al., 2012, 2016; Wang et al., 2016), their homologous gene in Brassica napus were assigned to the CI of uq.A05, which controlled SW and SL. For SW, TTG2 increased seed size by increasing cell expansion, DA1 increased SW and organ size, and IKU1 and MINI3 promoted endosperm growth in Arabidopsis. As rapeseed siliques played a critical role in seed yield, the candidate genes for silique-related QTLs need to be confirmed.
As we know, grain yield and silique-related traits were complex agronomic traits and were influenced by the environmental factors, such as the soil fertility, photoperiod and temperature. The previous studies indicated that the flowering time and mature time contributed to the seed yield of oilseed rape (Kirkegaard et al., 2016). Yield showed negative correlation with flowering time and lines that flowered earlier had higher yield than late-flowering lines (Raman et al., 2016). Therefore, it was relevant for investigating the flowering associated genes within the confidence intervals of the QTLs for three silique-related traits. Multiple homologs of flowering associated genes of Arabidopsis, such as TSF, SOC1, ATDDF1, ATMBD9, and FIE, were identified in some QTLs intervals, inferring that these genes might affect the development of the silique and the seeds with the form of pleiotropy or influence the seeds filling through controlling the time of flowering. Two genes: FT and SOC1 influenced flowering time on various pathways, which were often referred to as the floral integrator genes (Nelson et al., 2016). TSF encoded a floral inducer as a homolog of FT which played overlapping roles in the promotion of flowering. SOC1 controlled flowering and was required for CO to promote flowering. It acted downstream of FT. DDF1 encoded an AP2 domain transcription factor that could repress flowering. In rapeseed, BnAP2, an APETALA2 (AP2)-like gene, affected seed size, structure and development (Yan et al., 2012). BnaA07g24950 (ATMBD9) was involved in the modification of the FLC chromatin acetylation state to affect FLC expression. The FIE encoded a transcriptional regulation protein and formed part of a large protein complex that could include VRN2 and VIN3, while the complex had a role in establishing FLC repression during vernalization. The mutations in PIE1 resulted in suppression of FLC-mediated delay of flowering and caused early flowering in non-inductive photoperiods independently of FLC. However, now we could not find the strong evidence for the effect of these flowering genes on the identified QTLs here because the confidence intervals of QTLs still had several centimorgans, especially the relatively lower density markers in C subgenome. It was suggested that the flowering- and silique-related genes were probably just tightly linked in the certain physical interval, like the linked genes Chalk5 and GS5 in rice (Li et al., 2011; Li Y. et al., 2014). So the fine mapping of these QTLs may give us more information about their relationships.
In conclusion, 45 individual QTLs were detected for three silique traits (SS, SW and SL) in the O. violaceus derived B. napus population. Among 19 consensus QTLs, 12 (5, 3, 4 for SS, SW, and SL, respectively) were novel, likely due to the introgression of alien genetic loci. Thirty-eight candidate genes underlying nine QTLs for three traits were identified. Our study provides new insights into the genetic control of these important traits for seed yield, and highlights the role of special germplasm in genetic analyses.
Author Contributions
ZL and XG conceived and designed the study. YY, YS, and SL performed the phenotyping measurement. YY and YS performed the data analysis. YY wrote the manuscript and all authors reviewed and edited the manuscript.
Conflict of Interest Statement
The authors declare that the research was conducted in the absence of any commercial or financial relationships that could be construed as a potential conflict of interest.
Acknowledgments
We are grateful for Drs. Minglian Fu, Wei Chen, Feng Zu from Industrial Crops Institute, Yunnan Academy of Agricultural Sciences, and Drs. Liangcai Jiang, Cheng Cui from Crop Research Institute, Sichuan Academy of Agricultural Sciences, for arranging the field experiments. The study was supported by National Sci-Tech Support Plan (2013BAD01B03).
Supplementary Material
The Supplementary Material for this article can be found online at: http://journal.frontiersin.org/article/10.3389/fpls.2017.01512/full#supplementary-material
References
Arcade, A., Labourdette, A., Falque, M., Mangin, B., Chardon, F., Charcosset, A., et al. (2004). BioMercator: integrating genetic maps and QTL towards discovery of candidate genes. Bioinformatics 20, 2324–2326. doi: 10.1093/bioinformatics/bth230
Basunanda, P., Radoev, M., Ecke, W., Friedt, W., Becker, H. C., and Snowdon, R. J. (2010). Comparative mapping of quantitative trait loci involved in heterosis for seedling and yield traits in oilseed rape (Brassica napus L.). Theor. Appl. Genet. 120, 271–281. doi: 10.1007/s00122-009-1133-z
Basunanda, P., Spiller, T. H., Hasan, M., Gehringer, A., Schondelmaier, J., Lühs, W., et al. (2007). Marker-assisted increase of genetic diversity in a double-low seed quality winter oilseed rape genetic background. Plant Breed. 126, 581–587. doi: 10.1111/j.1439-0523.2007.01404.x
Butruille, D. V., Guries, R. P., and Osborn, T. C. (1999). Linkage analysis of molecular markers and quantitative trait loci in populations of inbred backcross lines of Brassica napus L. Genetics 93, 949–964.
Cai, G., Yang, Q., Chen, H., Yang, Q., Zhang, C., Fan, C., et al. (2016). Genetic dissection of plant architecture and yield-related traits in Brassica napus. Sci. Rep. 6:21625. doi: 10.1038/srep21625
Cai, G., Yang, Q., Yang, Q., Zhao, Z., Chen, H., Wu, J., et al. (2012). Identification of candidate genes of QTLs for seed weight in Brassica napus through comparative mapping among Arabidopsis and Brassica species. BMC Genet. 13:105. doi: 10.1186/1471-2156-13-105
Chalhoub, B., Denoeud, F., Liu, S., Parkin, I. A. P., Tang, H., Wang, X., et al. (2014). Early allopolyploid evolution in the post-Neolithic Brassica napus oilseed genome. Science 345, 950–953. doi: 10.1126/science.1253435
Chen, W., Zhang, Y., Liu, X. P., Chen, B. Y., Tu, J. X., and Fu, T. D. (2007). Detection of QTL for six yield-related traits in oilseed rape (Brassica napus) using DH and immortalized F2 populations. Theor. Appl. Genet. 115, 849–858. doi: 10.1007/s00122-007-0613-2
Churchill, G. A., and Doerge, R. W. (1994). Empirical threshold values for quantitative trait mapping. Genetics 138, 963–971.
Clarke, J. M., and Simpson, G. M. (1978). Influence of irrigation and seeding rates on yield and yield components of Brassica napus CV. Tower. Can. J. Plant Sci. 58, 731–737. doi: 10.4141/cjps78-108
Clarke, W. E., Higgins, E. E., Plieske, J., Wieseke, R., Sidebottom, C., Khedikar, Y., et al. (2016). A high-density SNP genotyping array for Brassica napus and its ancestral diploid species based on optimised selection of single-locus markers in the allotetraploid genome. Theor. Appl. Genet. 129, 1887–1899. doi: 10.1007/s00122-016-2746-7
Delourme, R., Falentin, C., Fomeju, B., Boillot, M., Lassalle, G., André, I., et al. (2013). High-density SNP-based genetic map development and linkage disequilibrium assessment in Brassica napus L. BMC Genomics 14:120. doi: 10.1186/1471-2164-14-120
Ding, G., Zhao, Z., Liao, Y., Hu, Y., Shi, L., Long, Y., et al. (2012). Quantitative trait loci for seed yield and yield-related traits, and their responses to reduced phosphorus supply in Brassica napus. Ann. Bot. 109, 747–759. doi: 10.1093/aob/mcr323
Fan, C., Cai, G., Qin, J., Li, Q., Yang, M., Wu, J., et al. (2010). Mapping of quantitative trait loci and development of allele-specific markers for seed weight in Brassica napus. Theor. Appl. Genet. 121, 1289–1301. doi: 10.1007/s00122-010-1388-4
Gardner, K. M., and Latta, R. G. (2007). Shared quantitative trait loci underlying the genetic correlation between continuous traits. Mol. Ecol. 16, 4195–4209. doi: 10.1111/j.1365-294X.2007.03499.x
Girke, A., Schierholt, A., and Becker, H. C. (2012). Extending the rapeseed gene pool with resynthesized Brassica napus II: Heterosis. Theor. Appl. Genet. 124, 1017–1026. doi: 10.1007/s00122-011-1765-7
Hall, M. C., Basten, C. J., and Willis, J. H. (2006). Pleiotropic quantitative trait loci contribute to population divergence in traits associated with life-history variation in mimulus guttatus. Genetics 172, 1829–1844. doi: 10.1534/genetics.105.051227
Kirkegaard, J. A., Lilley, J. M., and Morrison, M. J. (2016). Drivers of trends in Australian canola productivity and future prospects. Crop Pasture Sci. 67, i–ix. doi: 10.1071/CPv67n4_FO
Kumar, J., Gupta, D. S., Gupta, S., Dubey, S., Gupta, P., and Kumar, S. (2017). Quantitative trait loci from identification to exploitation for crop improvement. Plant Cell Rep. 36, 1187–1213. doi: 10.1007/s00299-017-2127-y
Li, N., Shi, J., Wang, X., Liu, G., and Wang, H. (2014). A combined linkage and regional association mapping validation and fine mapping of two major pleiotropic QTLs for seed weight and silique length in rapeseed (Brassica napus L.). BMC Plant Biol. 14:114. doi: 10.1186/1471-2229-14-114
Li, S., Chen, L., Zhang, L., Li, X., Liu, Y., Wu, Z., et al. (2015). BnaC9.SMG7b functions as a positive regulator of number of seeds per silique in rapeseed (Brassica napus L.) by regulating the formation of functional female gametophytes. Plant Physiol. 169, 2744–2760. doi: 10.1104/pp.15.01040
Li, Y., Fan, C., Xing, Y., Jiang, Y., Luo, L., Sun, L., et al. (2011). Natural variation in GS5 plays an important role in regulating grain size and yield in rice. Nat. Genet. 43, 1266–1269. doi: 10.1038/ng.977
Li, Y., Fan, C., Xing, Y., Yun, P., Luo, L., Yan, B., et al. (2014). Chalk5 encodes a vacuolar H+-translocating pyrophosphatase influencing grain chalkiness in rice. Nat. Genet. 46, 398–404. doi: 10.1038/ng.2923
Li, Z., and Heneen, W. K. (1999). Production and cytogenetics of intergeneric hybrids between the three cultivated Brassica diploids and Orychophragmusviolaceus. Theor. Appl. Genet. 99, 694–704. doi: 10.1007/s001220051286
Liu, J., Hua, W., Hu, Z., Yang, H., Zhang, L., Li, R., et al. (2015). Natural variation in ARF18 gene simultaneously affects seed weight and silique length in polyploid rapeseed. Proc. Natl. Acad. Sci. 112, E5123–E5132. doi: 10.1073/pnas.1502160112
Liu, L., Qu, C., Wittkop, B., Yi, B., Xiao, Y., He, Y., et al. (2013). A high-density snp map for accurate mapping of seed fibre QTL in Brassica napus L. PLoS ONE 8:e83052. doi: 10.1371/journal.pone.0083052
Luo, P., Lan, Z. Q., and Li, Z. Y. (1994). Orychophragmus violaceus, a potential edible-oil crop. Plant Breed. 113, 83–85. doi: 10.1111/j.1439-0523.1994.tb00707.x
Luo, Z., Wang, M., Long, Y., Huang, Y., Shi, L., Zhang, C., et al. (2017). Incorporating pleiotropic quantitative trait loci in dissection of complex traits: seed yield in rapeseed as an example. Theor. Appl. Genet. 130, 1569–1585. doi: 10.1007/s00122-017-2911-7
Manchado-Rojo, M., Weiss, J., and Egea-Cortines, M. (2014). Validation of aintegumenta as a gene to modify floral size in ornamental plants. Plant Biotechnol. J. 12, 1053–1065. doi: 10.1111/pbi.12212
Merk, H. L., Yarnes, S. C., Deynze, A. V., Tong, N., Menda, N., Mueller, L. A., et al. (2012). Trait diversity and potential for selection indices based on variation among regionally adapted processing tomato germplasm. J. Amercian Soc. Hortic. Sci. 137, 427–437.
Nelson, M. N., Lilley, J. M., Helliwell, C., Taylor, C. M., Siddique, K. H. M., Chen, S., et al. (2016). Can genomics assist the phenological adaptation of canola to new and changing environments? Crop Pasture Sci. 67:284. doi: 10.1071/CP15320
Qi, L., Mao, L., Sun, C., Pu, Y., Fu, T., Ma, C., et al. (2014). Interpreting the genetic basis of silique traits in Brassica napus using a joint QTL network. Plant Breed. 133, 52–60. doi: 10.1111/pbr.12131
Qian, W., Chen, X., Fu, D., Zou, J., and Meng, J. (2005). Intersubgenomic heterosis in seed yield potential observed in a new type of Brassica napus introgressed with partial Brassica rapa genome. Theor. Appl. Genet. 110, 1187–1194. doi: 10.1007/s00122-005-1932-9
Qiu, D., Morgan, C., Shi, J., Long, Y., Liu, J., Li, R., et al. (2006). A comparative linkage map of oilseed rape and its use for QTL analysis of seed oil and erucic acid content. Theor. Appl. Genet. 114, 67–80. doi: 10.1007/s00122-006-0411-2
Radoev, M., Becker, H. C., and Ecke, W. (2008). Genetic analysis of heterosis for yield and yield components in rapeseed (Brassica napus L.) by quantitative trait locus mapping. Genetics 179, 1547–1558. doi: 10.1534/genetics.108.089680
Raman, R., Diffey, S., Carling, J., Cowley, R. B., Kilian, A., Luckett, D. J., et al. (2016). Quantitative genetic analysis of grain yield in an Australian Brassica napus doubled-haploid population. Crop Pasture Sci. 67:298. doi: 10.1071/CP15283
Shi, J., Li, R., Qiu, D., Jiang, C., Long, Y., Morgan, C., et al. (2009). Unraveling the complex trait of crop yield with quantitative trait loci mapping in Brassica napus. Genetics 182, 851–861. doi: 10.1534/genetics.109.101642
Shi, J., Li, R., Zou, J., Long, Y., and Meng, J. (2011). A dynamic and complex network regulates the heterosis of yield-related traits in rapeseed (Brassica napus L.). PLoS ONE 6:e21645. doi: 10.1371/journal.pone.0021645
Shi, J., Zhan, J., Yang, Y., Ye, J., Huang, S., Li, R., et al. (2015). Linkage and regional association analysis reveal two new tightly-linked major-QTLs for pod number and seed number per pod in rapeseed (Brassica napus L.). Sci. Rep. 5:14481. doi: 10.1038/srep14481
Snowdon, R. J., Abbadi, A., Kox, T., Schmutzer, T., and Leckband, G. (2015). Heterotic haplotype capture: precision breeding for hybrid performance. Trends Plant Sci. 20, 410–413. doi: 10.1016/j.tplants.2015.04.013
Thomson, M. J. (2014). High-throughput SNP genotyping to accelerate crop improvement. Plant Breed. Biotechnol. 2, 195–212. doi: 10.9787/PBB.2014.2.3.195
Udall, J. A., Quijada, P. A., Lambert, B., and Osborn, T. C. (2006). Quantitative trait analysis of seed yield and other complex traits in hybrid spring rapeseed (Brassica napus L.): 2. Identification of alleles from unadapted germplasm. Theor. Appl. Genet. 113, 597–609. doi: 10.1007/s00122-006-0324-0
USDA (United States Department of Agriculture) (2017). Oilseeds: World Markets and Trade. Foreign Agricultural Service, Office of Global Analysis. Available online at: https://www.fas.usda.gov/data/oilseeds-world-markets-and-trade
Wang, F., and Guan, C. Y. (2010). Molecular mapping and identification of quantitative trait loci for yield components in rapeseed (Brasscia napus L.). Yi Chuan 32, 271–277. doi: 10.3724/SP.J.1005.2010.00271
Wang, S., Basten, C. J., and Zeng, Z. B. (2011). Windows QTL Cartographer 2.5. J. Infect. Dis. 204(Suppl.), 198–199.
Wang, X., Chen, L., Wang, A., Wang, H., Tian, J., Zhao, X., et al. (2016). Quantitative trait loci analysis and genome-wide comparison for silique related traits in Brassica napus. BMC Plant Biol. 16:71. doi: 10.1186/s12870-016-0759-7
Wu, Y., Bhat, P. R., Close, T. J., and Lonardi, S. (2008). Efficient and accurate construction of genetic linkage maps from the minimum spanning tree of a graph. PLoS Genet. 4:e1000212. doi: 10.1371/journal.pgen.1000212
Xu, C. Y., Wanyan, R. H., and Li, Z. Y. (2007). Origin of new Brassica types from a single intergeneric hybrid between B. rapa and Orychophragmus violaceus by rapid chromosome evolution and introgression. J. Genet. 86, 249–257. doi: 10.1007/s12041-007-0032-9
Yan, X., Zhang, L., Chen, B., Xiong, Z., Chen, C., Wang, L., et al. (2012). Functional identification and characterization of the Brassica napus transcription factor gene BnAP2, the ortholog of Arabidopsis thaliana APETALA2. PLoS ONE 7:e33890. doi: 10.1371/journal.pone.0033890
Yang, P., Shu, C., Chen, L., Xu, J., Wu, J., and Liu, K. (2012). Identification of a major QTL for silique length and seed weight in oilseed rape (Brassica napus L.). Theor. Appl. Genet. 125, 285–296. doi: 10.1007/s00122-012-1833-7
Zhang, L., Li, S., Chen, L., and Yang, G. (2012). Identification and mapping of a major dominant quantitative trait locus controlling seeds per silique as a single Mendelian factor in Brassica napus L. Theor. Appl. Genet. 125, 695–705. doi: 10.1007/s00122-012-1861-3
Zhang, L., Liu, P., Hong, D., Huang, A., Li, S., He, Q., et al. (2010). Inheritance of seeds per silique in Brassica napus L. using joint segregation analysis. Food Crop. Res. 116, 58–67. doi: 10.1016/j.fcr.2009.11.010
Zhang, L., Yang, G., Liu, P., Hong, D., Li, S., and He, Q. (2011). Genetic and correlation analysis of silique-traits in Brassica napus L. by quantitative trait locus mapping. Theor. Appl. Genet. 122, 21–31. doi: 10.1007/s00122-010-1419-1
Keywords: Brassica napus, quantitative trait locus (QTL), single nucleotide polymorphism (SNP), silique-related trait, candidate gene
Citation: Yang Y, Shen Y, Li S, Ge X and Li Z (2017) High Density Linkage Map Construction and QTL Detection for Three Silique-Related Traits in Orychophragmus violaceus Derived Brassica napus Population. Front. Plant Sci. 8:1512. doi: 10.3389/fpls.2017.01512
Received: 30 May 2017; Accepted: 16 August 2017;
Published: 06 September 2017.
Edited by:
Jacqueline Batley, University of Western Australia, AustraliaReviewed by:
Harsh Raman, NSW Department of Primary Industries, AustraliaYan Long, Chinese Academy of Agricultural Sciences, China
Copyright © 2017 Yang, Shen, Li, Ge and Li. This is an open-access article distributed under the terms of the Creative Commons Attribution License (CC BY). The use, distribution or reproduction in other forums is permitted, provided the original author(s) or licensor are credited and that the original publication in this journal is cited, in accordance with accepted academic practice. No use, distribution or reproduction is permitted which does not comply with these terms.
*Correspondence: Zaiyun Li, lizaiyun@mail.hzau.edu.cn