 Xiaolong Wang
 Tianyang Ye1
 Syed Tahir Ata-Ul-Karim
 Liang Tang
- 1National Engineering and Technology Center for Information Agriculture, Key Laboratory for Crop System Analysis and Decision Making, Ministry of Agriculture, Jiangsu Key Laboratory for Information Agriculture, Jiangsu Collaborative Innovation Center for Modern Crop Production, Nanjing Agricultural University, Nanjing, China
- 2Henan Institute of Science and Technology, Xinxiang, China
- 3Key Laboratory of Soil Chemistry and Environmental Protection, Institute of Soil Science, Chinese Academy of Sciences, Nanjing, China
Precise quantification of plant nitrogen (N) nutrition status is essential for crop N management. The concept of critical N concentration (Nc) has been widely used for assessment of plant N status. This study aimed to develop a new winter wheat Nc dilution curve based on leaf area duration (LAD). Four field experiments were performed on different cultivars with different N fertilization modes in the Yangtze River basin and Yellow River basin in China. Results showed that the increase in LAD with increasing cumulative thermal time took the shape of an “S” type curve; whereas shoot N concentration decreased with increasing LAD, according to a power function. Both LAD and shoot N concentration increased with increasing N application. The new LAD based Nc dilution curve was determined and described as Nc = 1.6774 LAD−0.37 when LAD > 0.13. However, when LAD ≤ 0.13, Nc was constant and can be calculated by the equation when LAD = 0.13. The validation of Nc dilution curve with dataset acquired from independent experiments confirmed that N nutrition index (NNI) predictions based on the newly established Nc dilution curve could precisely diagnose N deficiency at different plant growth stages. The integrated N nutrition index (NNIinte), which was obtained by the weighted mean of NNI, was used to estimate shoot N concentration, shoot dry matter, LAD, and yield using regression functions. The linear relationships between NNIinte and these growth variables were well correlated. These results provided enough evidence that the new LAD–based Nc dilution curve could effectively and precisely diagnoses N deficiency in winter wheat crops.
Introduction
Nitrogen (N) is a major nutritional element required for crop growth and productivity (Eickhout et al., 2006). In-season N diagnosis and management in crop production is an important agronomic practice for ensuring food security and environmental sustainability (Ata-Ul-Karim et al., 2016a,b). N is an integral component of chlorophyll and protein related with plant vigor, yield and quality and appropriate N fertilizer application is not only imperative for improving crop production but also for increasing the processing quality of grain in cereals (Wang et al., 2002; Zhu et al., 2003). Previous studies have shown a strong relationship between N status and wheat yield and quality. Excessive N fertilizer application has negative impacts, such as decreased N use efficiency and deterioration of the ecological environment (Jeuffroy and Meynard, 1997; Zhao et al., 2016a). Therefore, accurate estimation of crop N status and precision N management has become pressing study topics for crop growers and scientists.
Reliable estimation of crop N requirement and diagnosing nutritional status at critical crop growth stages is imperative for optimizing the quantitative and qualitative aspects of crop production (Ata-Ul-Karim et al., 2016b). Non-destructive diagnostic tools such as chlorophyll meter, digital camera, active and passive sensors (Mistele and Schmidhalter, 2008; Lee and Lee, 2013; Yuan et al., 2016) have been widely used to assess the crop N status. Besides non-destructive diagnostic tools, the concept of critical N (Nc), which is crop specific, simple and biologically sound diagnostic tool, has also widely been used as a classical destructive diagnostic tool for diagnosing crop N status. The Nc dilution curves based on shoot biomass have been established in various agronomic crops, including corn (Plénet and Lemaire, 1999; Ziadi et al., 2008; Yue et al., 2014), rice (Sheehy et al., 1998; Ata-Ul-Karim et al., 2013; Huang et al., 2015; He et al., 2017), wheat (Justes et al., 1994; Ziadi et al., 2010; Yue et al., 2012; Zhao et al., 2012). Attempts have also been made to establish the Nc dilution curves on organ specific dry matter (leaf dry matter and panicle dry matter) in wheat (Yao et al., 2014a; Zhao et al., 2016b), on leaf dry matter and stem dry matter in rice ecotypes (Ata-Ul-Karim et al., 2014a; Yao et al., 2014b), and on leaf dry matter in maize (Zhao et al., 2017). The existing dilution curves based on whole plant and organ specific dry matter were developed for crops grown in a specific region, and the model parameters vary with climate. Additionally, dry matter is generally measured by destructive sampling. Leaf area index (LAI) and canopy coverage is a fundamental variable in agronomic and environmental research have been widely used as reference plant index for monitoring crop growth, predicting grain yield, and optimization of crop management practices (Ata-Ul-Karim et al., 2014b; Wang et al., 2016). With the advances in sensor technologies, it is convenient to measure LAI non-destructively. LAI measurements are more easily performed than quantification of shoot dry matter, providing an alternative method for evaluation of plant N status diagnosis. Previous studies have developed Nc dilution curves based on LAI, providing an alternative method for plant Nc assessment and N status diagnosis (Confalonieri et al., 2011; Ata-Ul-Karim et al., 2014b; Zhao B. et al., 2014). Crop dry matter accumulation occurs through photosynthetic production, which is depends heavily on the canopy leaves characteristics. Leaf area, its duration, and photosynthetic rate are the key factors driving matter accumulation and yield (Gastal and Bélanger, 1993; Hammer and Wright, 1994; Zhao et al., 2005). Previous studies have shown that N allocation to leaves for growth and photosynthesis to be prioritized within wheat plants (Jeuffroy et al., 2002). N nutritional status, leaf area, and leaf area duration affect both short-term growth status and future productivity. LAI is an instantaneous estimate of the photosynthetic area. However, LAI does not represent photosynthesis as a continuous process occurring within the photosynthetic area and does not precisely explain the formation of dry matter. Leaf area duration (LAD) is the integral of LAI and growth period, and comprehensively incorporates the size and duration of leaf area (Peltonen-Sainio et al., 2008). Therefore, compared with LAI, LAD better represents the process of dry matter accumulation and incorporates plant N dilution mechanisms.
The N diagnostic tools such as N nutrition index (NNI), accumulated N deficit (AND) and N requirement (NR) could be derived from the Nc dilution curve for quantifying the N status, developmental processes and radiation-use efficiency of the plant in response to N supply (Mills et al., 2009; Ata-Ul-Karim et al., 2017a,b) as well as for making decisions on N application (Lemaire et al., 2008). NNI is one of the most widely used Nc curve based N diagnostic tool for in-season plant N status diagnosis (Zhao et al., 2017). The relationships between NNI and relative yield have been previously implicated in assessing yield potential in wheat, corn (Ziadi et al., 2008, 2010), and rice (Ata-Ul-Karim et al., 2016a). Moreover, these relationships have also been used to estimate crop NR for a corrective N fertilization during crop growth period and for assessment of grain amylose and protein content in rice (Ata-Ul-Karim et al., 2017a,c). This concept can successfully differentiate the sub-optimal and supra-optimal N growth conditions in crop production, and the diagnostic tools derived from these curves could be integrated with crop simulation models to assist crop N management (Lemaire et al., 2008; Ata-Ul-Karim et al., 2017b).
The objectives of this study were to develop a Nc dilution curve based on LAD for winter wheat which combines the merits of shoot dry matter- and LAI-based Nc curves and to test the curve through evaluation of the effects of N deficiency on growth variables and yield. The projected results would provide an alternative diagnostic tool for assessing N deficiency limitations to winter wheat growth.
Materials and Methods
Experiments Design
Four experiments at two sites using different cultivars, N levels, split applications, and top-dressing stages were conducted, as summarized in Table 1. Experiment 4 is the historical data obtained from the study of Zhao B. et al. (2014). Urea used as the N fertilizer was applied before sowing (as base fertilizer) and from the jointing to booting stages (as top-dressing fertilizer), respectively. The experimental fields were plowed and subsequently harrowed before sowing. Pre-emergence herbicides were used to control weeds at early growth stages. Plots were also regularly hand-weeded until canopy was closed to prevent weed damage. Insecticides were used to prevent insect damage when necessary. No irrigation was in Experiments 1, 2 and 4. Irrigations (900 m3 ha−1 per time) at regrowth and jointing were performed in Experiment 3. All other agronomic management practices were used according to local management practices recommendations to ensure maximum potential productivity, i.e., no factor other than N was limiting.
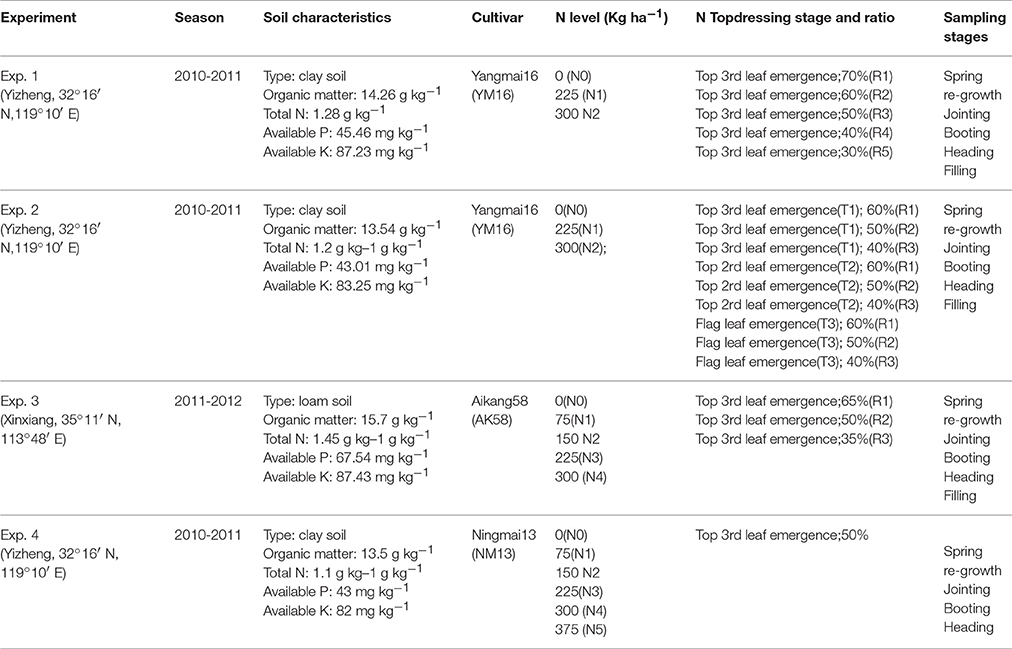
Table 1. Basic information of the four experiments.
Experiment 1 followed a split plot design, with N level as the main plot factor and N splits as the subplot factor. The study was conducted in Yizheng, China (32°16′ N, 119°10′ E) during the 2010–2011 wheat growing season. Cultivar Yangmai 16 (YM16, grain protein 14.2%) was planted on October 18th by row seeding, with a row spacing of 25 cm. Planting density was 2.40 × 10⁶ plants ha−1. P (135 kg ha−1 P2O5) and K (190 kg ha−1 K2O) fertilizers were incorporated into the soil as monocalcium phosphate (Ca(H2PO4)2) and potassium chloride (KCl) before planting.
Experiment 2 applied a split-split plot design with N level as main plot factor, N split applications as the subplot factor and N application stage as the sub-sub plot factor. The experiment was conducted in Yizheng, China (32°16′ N, 119°10′ E) during the 2010–2011 wheat season. Cultivar Yangmai 16 (YM16, grain protein 14.2%) was planted on November 7th by row seeding, with a row spacing of 25 cm. The area of each plot was 24 m2. Planting density was 2.40 × 10⁶ plants ha−1. Phosphatic (120 kg ha−1 P2O5) and potassium (150 kg ha−1 K2O) fertilizers were incorporated into the soil as monocalcium phosphate (Ca(H2PO4)2) and potassium chloride (KCl) before planting.
Experiment 3 was a split plot design with N level as the main plot factor, and N split applications as the subplot factor. The experiment was conducted in Xinxiang, China (35°11′ N, 113°48′ E) during the 2011–2012 wheat growing season. Cultivar Aikang 58 (AK58, grain protein 14.48%) was planted on November 7th by row seeding, with a row spacing of 25 cm. The area of each plot was 24 m2. Planting density was 3.0 × 10⁶ plants ha−1. Phosphatic (150 kg ha−1 P2O5) and potassium (150 kg ha−1 K2O) fertilizers were incorporated into the soil as monocalcium phosphate (Ca(H2PO4)2) and potassium chloride (KCl) before planting.
Experiment 4 was conducted involving N levels in Yizheng, China (32°16′ N, 119°10′ E) during the wheat growing season of 2010–2011. Cultivar Ningmai 13 (NM13, Grain protein 10.9%) was planted on 11th Nov. by row seeding, and row spacing was 25 cm. Random plot design was adopted with three replications. Six N levels including 0 (N0), 75(N1), 150(N2), 225(N3), 300(N4), and 375(N5) kg N ha−1, were tested, with 50% of the N applied at pre planting and 50% at jointing. The area of each plot was 30 m2. Planting density was 2.40 × 10⁶ plants ha−1. Phosphatic (96 kg ha−1 P2O5) and potassium (120 kg ha−1 K2O) fertilizers were incorporated into the soil before planting as monocalcium phosphate (Ca(H2PO4)2) and potassium chloride (KCl).
Plant Sampling, N Determination, and Daily Temperature
Twenty representative plants were sampled from each plot at regrowth, jointing, booting, heading, anthesis, grain filling, and maturity for determination of LAI, shoot dry matter, and N concentration. For shoot dry matter measurements, samples were dried in a forced-draft oven at 80°C until constant weight was achieved. Shoot N was determined following the micro-Kjeldahl method (Bremner and Mulvancy, 1982). LAI was measured using an LI-3000 (Li-COR, Lincoln, US). Daily temperature measurements were acquired from a weather station near the experimental plots.
Data Processing
Statistical Analysis
The data for determination of critical N points were analyzed according to the methodology proposed by Justes et al. (1994). For each sampling date, experiment and wheat cultivar, the amounts of LAD and plant N concentration were subjected to analysis of variance (ANOVA) using GLM procedures in IBM SPSS Version19.0 (IBM Corporation, Armonk, New York). Significant effects of treatment on mean LAD were tested for using the least significant difference (LSD0.05) test, and the results were used to classify treatments as N-limiting or non-N-limiting. An allometric function was used to determine the relationship between the observed decreases in N concentration with increasing LAD using Microsoft Excel 2010 (Microsoft Corporation, Redmond, WA, USA).
Relative Growing Degree Days
In order to account for variation in thermal time among different years and locations, relative growing degree days (RGDD, d°C) was expressed as the ratio of growing degree days (GDD, above 0°, d°C) at a sampling time point to the total GDD across the entire growth period (TGDD, d°C).
To perform real-time measurements, the average TGDD from previous years or a real-time TGDD estimated from real-time weather and historic weather data could be substituted for in-season TGDD (Bannayan and Hoogenboom, 2008).
Leaf Area Duration
Leaf area duration (LAD) was calculated using the LAI at each sampling date and the corresponding RGDD according to the equation:
The LAD between two sampling time points was approximated according to the equation:
where t1 and t2 are the sampling times across which RGDD was quantified. LAI1 and LAI2 are the LAI at the sampling time t1 and t2, respectively.
Establishment and Validation of Critical Nitrogen Dilution Curve
Data from experiment 1 and 3 were used to develop the Nc dilution curve following the computation method of Justes et al. (1994). If at the same measurement date, statistical analysis distinguished at least one set of N limiting growth and non-N-limiting growth data points, these data were used to define the Nc dilution curve. For each measurement date, the variation in total N concentration and LAD was assimilated into a bilinear relation composed of (a) an oblique line showing the increase in joint LAD and N concentration and (b) a vertical line corresponding to the increase in N concentration and no variation in LAD. The Nc dilution curve was validated for N-limiting and non-N-limiting situations within the range for which it was established using the data collected from the independent experiments (Experiment 2 and 4).
Determination of NNI and Integrated NNI
The NNI at each sampling date was calculated according to the equation (Justes et al., 1994):
where Nac and Nc, respectively, are the actual N concentration and critical N concentration of the shoot expressed in % dry matter. If NNI = 1, N nutritional status was considered to be optimum, while NNI > 1 and NNI < 1 indicated excess and deficient N nutrition, respectively.
An integrated NNI can be obtained by the weighted mean of NNI (Lemaire et al., 2008) as illustrated as follows.
where NNIinte is the integrated NNI, T represents the duration sampling occurred over (days or GDD), NNIi is the instantaneous NNI value for sampling time point i, and ti is the time interval between sampling time point i and sampling time point i-1.
Results
Leaf Area Duration and Shoot N Concentration in Wheat under Different N Treatments
Table 2 showed the increase in LAD and the decreases in shoot N concentration (Nac) with the development stages in winter wheat cultivars. Although the four experiments were conducted under different cultivars, treatments, sites, years, the change trends in LAD and Nac are similar. LAD and Nac increased with increasing N application, the response of LAD and Nac to N treatment varied with N split applications and topdressing time in different experiments. Topdressing time also showed significant effects on LAD and Nac. The LAD ranged from 0.43 to 1.82, 0.46 to 1.824, 0.075 to 2.361, and 0.046 to 1.317 while Nac ranged from 0.67 to 3.7%, 0.83 to 3.87%, 0.95 to 3.35%, and 1.02 to 4.13% in Experiment 1–4, respectively. The LAD of cultivar Aikang58 in Xinxiang (Experiment 3) was higher than that of experiments in Yizheng (Experiments 1, 2 and 4). However, the variation of Nac in different experiments was minor.
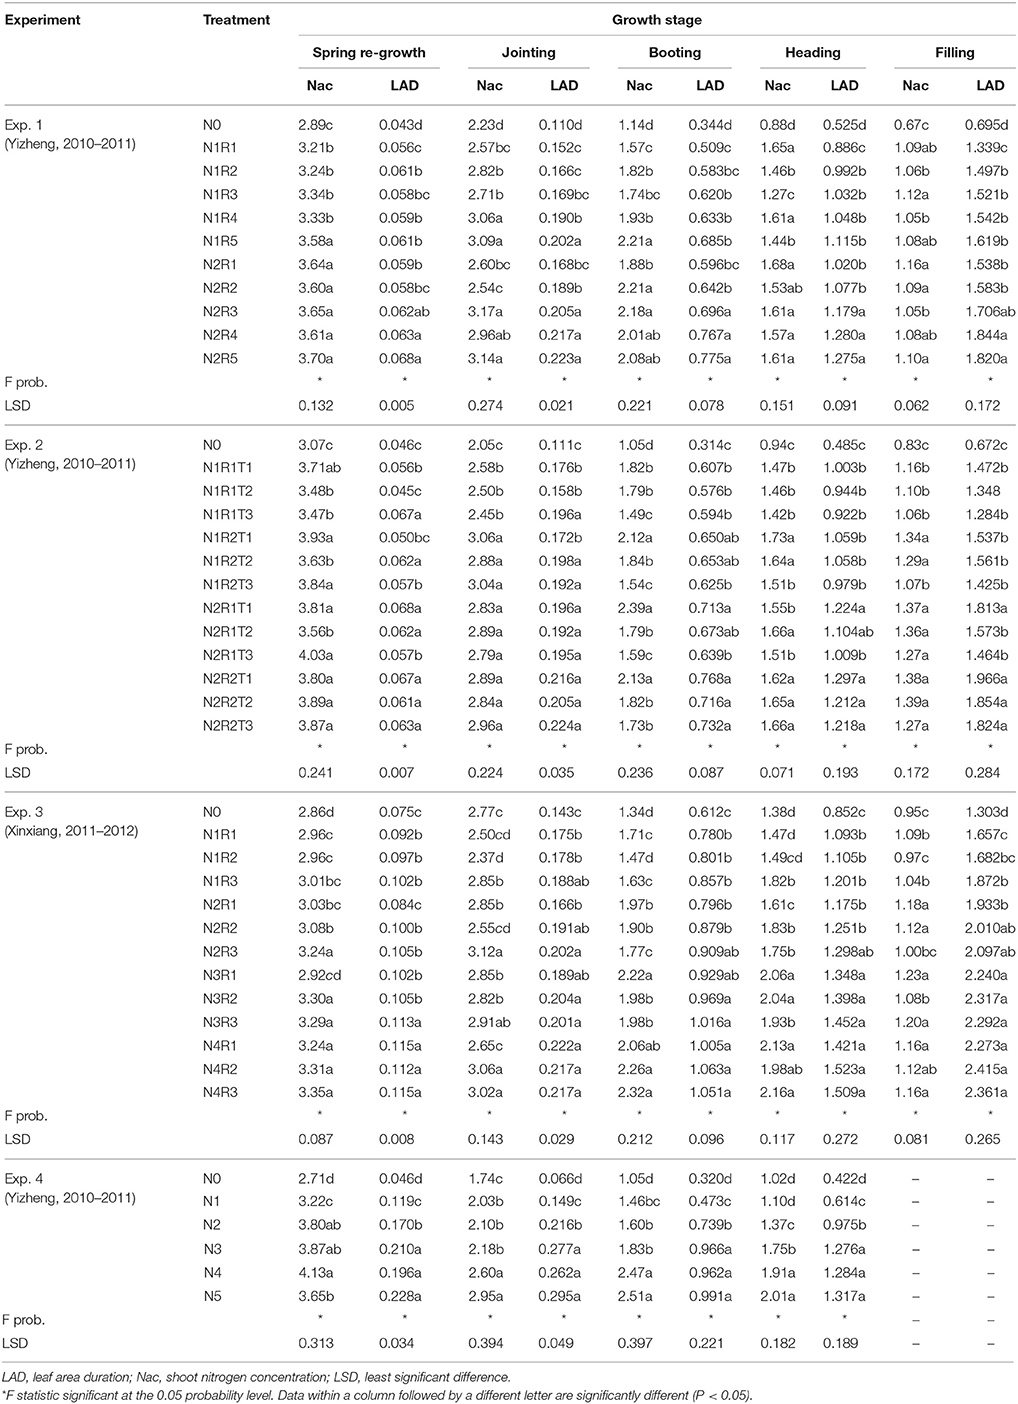
Table 2. Nitrogen concentration at different growth stages and varied N rates.
Determination of the LAD-Based Critical Nitrogen Dilution Curve
Data from experiments 1 and 3 were used to develop the Nc dilution curve following the method of Justes et al. (1994). Growth rate and cultivar did not significantly affect Nc at both study sites, and the curves for two cultivars showed no significant differences. The unified dilution curve was determined as showed in Figure 1. The constant value of Nc (3.57) is calculated by the equation when LAD = 0.13 when LAD ≤ 0.13. When LAD > 0.13, Nc was calculated as follows.
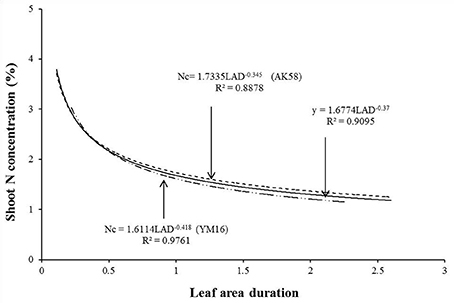
Figure 1. Determination of the LAD-based shoot critical concentration dilution curve for two wheat cultivars using the data of Experiment 1 and 3.
Validation and Application of the Established Critical Nitrogen Dilution Curve
The LAD-based Nc dilution curve determined in this study was validated with data acquired from independent experiments (Experiment 2 and 4) using a standard method (Justes et al., 1994; Ziadi et al., 2008, 2010; Zhao B. et al., 2014). The data points under various N treatments from Experiment 2 and 4 were characterized by sub-optimal N or supra-optimal N growth conditions based on significant (P ≤ 0.001) differences in shoot biomass for each sampling date, site, and year. Treatments were considered N-limiting when shoot biomass increased significantly with increasing N supply, the N treatment is considered as sub-optimal N supply, while under supra-optimal N supply had no significant increase in biomass with increasing N supply (LSD < 0.05). Data points attained from sub-optimal treatments were located almost below the Nc curve while those of supra-optimal N supply was located close to or above the Nc curve (Figure 2). The newly established LAD-based Nc dilution curve well distinguished the sub-optimal and supra-optimal N supply conditions. Therefore, it was concluded that the curve could be used for in-season assessment of wheat N nutrition status. Data points were selected only from non-N-limiting treatments for the determination of upper limit curve (Nmax) while the data points from N-limiting treatments for which have no N application were used to determine lower limit curve (Nmin) (Figure 2).
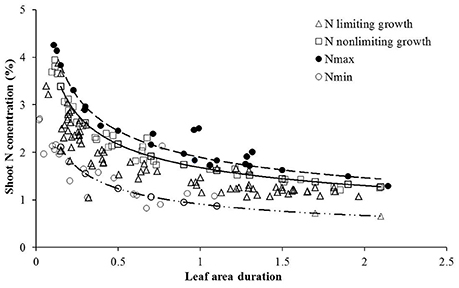
Figure 2. Validation of the Nc dilution curves for winter wheat. Data points (Δ) represent N limiting condition, (□) represent non-N-limiting condition. The solid line indicates the Nc curves (Nc = 1.6774 LAID–0.37, while the dashed lines represent the minimum and maximum N curves respectively, (Nmin = 0.9089 LAD−0.444, Nmax = 1.8934 LAD−0.372). The (•) points represent N concentration from highest N rate and the (°) points are from zero N rate obtained from Experiments 2 and 4.
Determination of Plant N Deficiency
Two N application levels in Experiment 2 were relatively high (225 and 300 kg ha−1). However, some N split applications still showed N deficiencies at a few growth stages (Figure 3A). Treatments N1R1T1, N1R1T2, N1R1T3, N1R2T3, and N2R1T3 were N deficient at few developmental stages when the base fertilizer level was relatively lower (R1 treatments), or the topdressing was applied later (T3 treatments). In Experiment 4, shoot N concentration under N4, and N5 treatments was significantly higher than shoot Nc. On the other hand, shoot N concentration under N3 was close to the Nc. However, N0, N1, and N2 showed significant N deficiencies due to low levels of N application (Figure 3B). The Nc fell approximately between N3 and N4 levels.
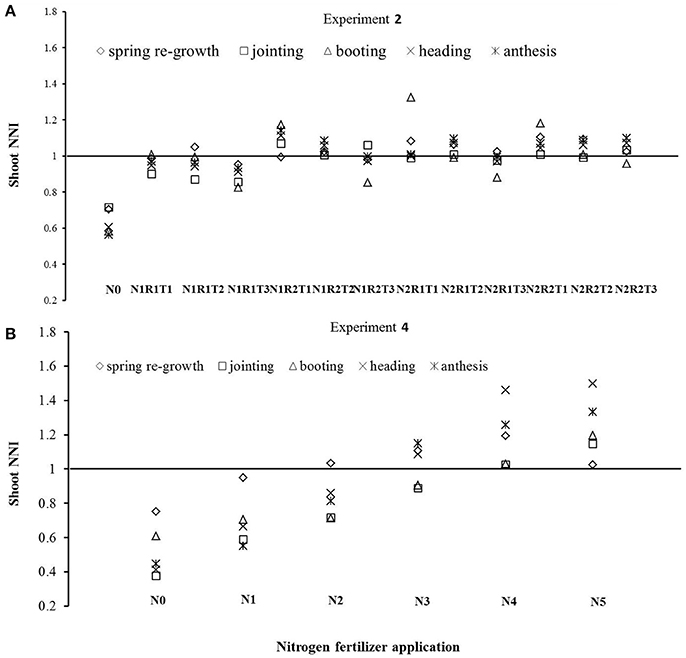
Figure 3. Diagnosis of N status using the LAD-based Nc dilution curves developed in Experiment 2 (A) and 4 (B).
Relationships between NNIinte and Crop Growth Variables
The effects of N deficiencies on growth variables, i.e., dry matter(DM), shoot nitrogen concentration (Nac), LAD and yield was expressed in relative values (DM/DMmax, Nac/Nacmax, LAD/LADmax, and yield/yieldmax) in order to account for variation in pedoclimatic conditions across the different experiments. The Experiment 1 and 3 were used to develop the linear relationship. DM/DMmax represents the ratio between DM accumulated by a crop receiving a limiting N supply and the maximum shoot biomass value measured at the same moment in time, assuming that the maximum biomass (DMmax) was accumulated under optimum N supply. DMmax was calculated as the mean of DM for the group of treatments giving the highest DM value, and not significantly different from each other, at a 5% significance level. The same methodology was applied to calculate DM/DMmax, Nac/Nacmax, LAD/LADmax, and yield/yieldmax. All of the relative growth variables strongly correlated with NNIinte (Figure 4). The data of experiment 2 was used to validate the relationships between the NNIinte and the relative values (DM/DMmax, Nac/Nacmax, LAD/LADmax, and yield/yieldmax). The results showed that RRMSE, agreement index, and R2 ranged from 6.61% to 11.99%, 0.9515 to 0.9829, and 0.7862 to 0.8968 (Table 3), which indicated that the established relationships are robust. The variation in NNIinte explained more than 70% of variability associated with any of these four variables. When NNIinte equaled 0.80, Nac, LAD, DM, and yield decreased by 42.17, 39.79, 30.44, and 29.95%, respectively.
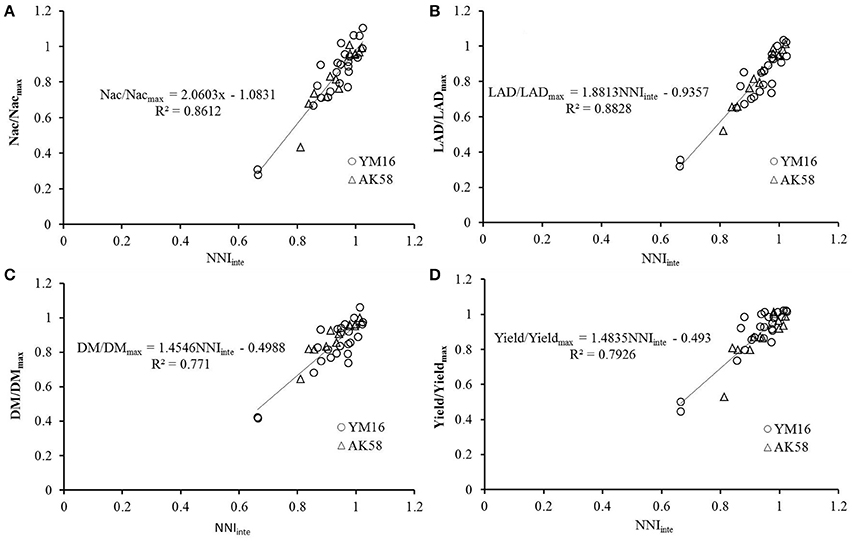
Figure 4. Relationships between relative growth variables and integrated nitrogen nutrition index (NNIinte). (A) Nac/Nacmax; (B) LAD/LADmax; (C) DM/DMmax; (D) yield/yieldmax.
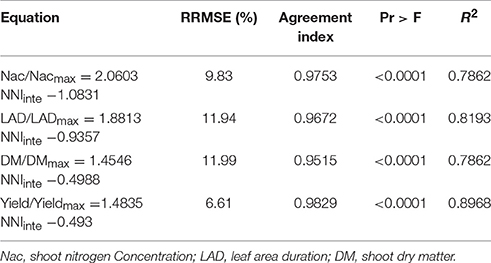
Table 3. Validation of the relationships between the relative growth variables and NNIinte.
Discussion
Crop photosynthetic production capacity is limited by photosynthetic area (which can be quantified through LAI measurements), the duration of the photosynthetic area, and photosynthetic rate. Plant biomass production can be estimated by measuring LAD, which integrated the size and duration of the photosynthetic area (Gastal and Bélanger, 1993; Hammer and Wright, 1994; Zhao et al., 2005). In this study, LAD increased with the increase of N levels while shoot nitrogen concentration decreased with the N levels (Table 2). Similar results for shoot biomass responses to development time and N levels have been reported in previous studies on wheat (Justes et al., 1994; Zhao et al., 2012), rice (He et al., 2017), and maize (Plénet and Lemaire, 1999).
Most wheat Nc dilution curves have been developed based on dry matter accumulation (Justes et al., 1994; Yue et al., 2012; Zhao et al., 2012), while Zhao B. et al. (2014) developed a Nc dilution curve based on LAI in winter wheat (Figure 5). This study developed a new LAD-based Nc dilution curve by using the data collected through experiments within the Yangtze river and Yellow river basins of China. Comparing with dry matter-based Nc dilution curves (Justes et al., 1994; Yue et al., 2012; Zhao et al., 2012), LAD explains the process of dry matter accumulation, which can be effected by the size and duration of photosynthetic area. Therefore, the rationales for these two Nc dilution curves types are the same. To account for variations in thermal conditions among the different regions and seasons, thermal time was taken into account for calculating LAD in our study. Additionally, LAI is more easily obtained than shoot dry matter due to most of the instruments designed for measuring LAI. Compared to the LAI-based Nc curve, LAD-based curve can well describe the N dilution during the entire crop growth period, while LAI-based curve only quantifies the Nc dynamics till heading stage (when LAI reaches to its maximum value) (Ata-Ul-Karim et al., 2014b; Zhao B. et al., 2014). Due to the decline of LAI during post anthesis growth period, it does not take the shape of an “S” type curve, hence cannot be used as an appropriate plant index for the elucidation of plant N dilution. Therefore, it is not appropriate to integrate the Nc curves into the crop growth models, especially those which use the Nc concentration of entire crop growth period for simulation of plant N dynamics, such as CERES-wheat (Ritchie and Otter, 1985) and APSIM-wheat (Zhao Z. et al., 2014). Thus, LAD-based Nc curve combines the merits of LAI-based and dry matter-based Nc curve. The initial N concentration in the Nc dilution curve developed in present study was close to that determined by Zhao et al. (2012); yet, our results of N concentration (for a low to middle grain protein cultivar) showed significant differences in the N concentration of high grain protein cultivars used by Yue et al. (2014) and Justes et al. (1994). High grain protein cultivars tend to have better rooting capabilities, allowing uptake and assimilation of more N. Thus, more cultivars should be tested to validate this methodology.
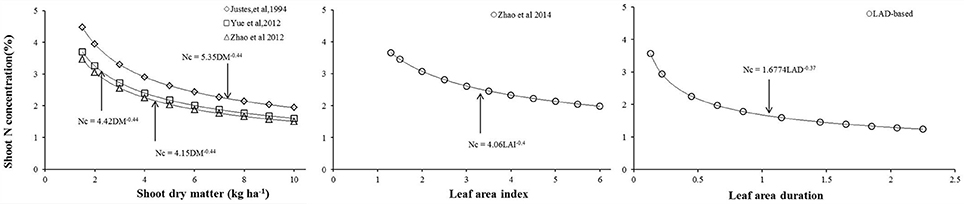
Figure 5. Comparisons of critical dilution curves based on different methods.
The NNI at various wheat growth stages was calculated using the LAD-based Nc dilution curve. As N treatment levels were applied with different splits and top-dressing stages, there were multiple NNI for each N treatment level (Figure 3). NNI values, which can be used for real-time diagnosis of plant N nutrition status, change with time. Due to different N application modes and soil N mineralization, soil N supply capacity changes constantly, the value of instantaneous NNI was highly variable (Figure 3) and could not be applied to detect N deficiency throughout the entire growth period (Lemaire et al., 2008). NNIinte incorporates the knowledge of time course of the NNI during this period (Lemaire and Gastal, 1997; Colnenne et al., 2002). The linear correlations between NNIinte and DM, LAD, Nac, and yield, were very well (Figure 4). The slopes for the relationships between NNIinte and DM and yield were lower than those for the relationships between NNIinte and Nac and LAI, which suggests that the effects of NNIinte on Nac and LAD were greater and more sensitive to N deficiency than the effects on DM and yield. These relationships between NNIinte and DM, LAD, Nac, and yield were similar to those reported in a previous study (Colnenne et al., 2002; Lemaire et al., 2008).
Conclusions
This study has developed a new Nc dilution curve based on LAD in winter wheat, which combines the merits of shoot dry matter- and LAI-based Nc curve. The results showed that the allometric relationships between N uptake and LAD were robust across the different conditions and was described as Nc = 1.6774LAD−0.37 (LAD > 0.13), and Nc = 3.57, when LAD ≤ 0.13. NNI derived from the curve established here, effectively identified the limiting and non-limiting N nutrition at different growth stages. The NNIinte, which was based on Nc, was applied to regression functions to estimate Nc, shoot dry matter, actual shoot N content, LAD, and yield measured in independent experiments at different growth periods. These relationships showed strong linear correlations between NNIinte and the growth variables. Our results indicated that the developed Nc curve provide a new procedure and alternate method to assess crop N status for N diagnose and management.
Author Contributions
XW and LT wrote the manuscript; XW analyzed the experiments data; SA, YZ and WC provided advice and edited the manuscript; LT, WC, and YZ planned experiments and XW, TY, and LL performed experiments. All authors read and approved the final manuscript.
Conflict of Interest Statement
The authors declare that the research was conducted in the absence of any commercial or financial relationships that could be construed as a potential conflict of interest.
Acknowledgments
This work was supported by grants from the National High-Tech Research and Development Program of China (2013AA102404), National Natural Science Foundation of China (31671582), Jiangsu Agriculture Science and Technology Innovation Fund (CX[14]2116), the Priority Academic Program Development of Jiangsu Higher Education Institutions (PAPD) of China, and The 111 Project (B16026).
References
Ata-Ul-Karim, S. T., Cao, Q., Zhu, Y., Tang, L., Rehmani, M. I. A., and Cao, W. (2016a). Non-destructive assessment of plant nitrogen parameters using leaf chlorophyll measurements in rice. Front. Plant Sci. 7:1829. doi: 10.3389/fpls.2016.01829
Ata-Ul-Karim, S. T., Liu, X., Lu, Z., Yuan, Z., Zhu, Y., and Cao, W. (2016b). In-season estimation of rice grain yield using critical nitrogen dilution curve. Field Crops Res. 195, 1–8. doi: 10.1016/j.fcr.2016.04.027
Ata-Ul-Karim, S. T., Yao, X., Liu, X., Cao, W., and Zhu, Y. (2013). Development of critical nitrogen dilution curve of Japonica rice in Yangtze river reaches. Field Crops Res. 149, 149–158. doi: 10.1016/j.fcr.2013.03.012
Ata-Ul-Karim, S. T., Zhu, Y., Cao, Q., Rehmani, M. I. A., Cao, W., and Tang, L. (2017a). In-season assessment of grain protein and amylose content in rice using critical nitrogen dilution curve. Eur. J. Agron. 90, 139–151. doi: 10.1016/j.eja.2017.08.001
Ata-Ul-Karim, S. T., Zhu, Y., Liu, X., Cao, Q., Tian, Y., and Cao, W. (2017b). Comparison of different critical nitrogen dilution curves for nitrogen assessment in rice. Sci. Rep. 7:42679. doi: 10.1038/srep42679
Ata-Ul-Karim, S. T., Zhu, Y., Lu, X. J., Cao, Q., Tian, Y. C., and Cao, W. (2017c). Estimation of nitrogen fertilizer requirement for rice crop using critical nitrogen dilution curve. Field Crops Res. 2017, 32–40. doi: 10.1016/j.fcr.2016.10.009
Ata-Ul-Karim, S. T., Yao, X., Liu, X., Cao, W., and Zhu, Y. (2014a). Determination of critical nitrogen dilution curve based on stem dry matter in rice. PLoS ONE 9:e104540. doi: 10.1371/journal.pone.0104540
Ata-Ul-Karim, S. T., Zhu, Y., Yao, X., and Cao, W. (2014b). Determination of critical nitrogen dilution curve based on leaf area index in rice. Field Crops Res. 167, 76–85. doi: 10.1016/j.fcr.2014.07.010
Bannayan, M., and Hoogenboom, G. (2008). Weather Analogue: a tool for lead time prediction of daily weather data realizations based on a modified k-Nearest Neighbor approach. Environ. Model. 23, 703–713. doi: 10.1016/j.envsoft.2007.09.011
Bremner, J. M., and Mulvancy, C. S. (1982). “Nitrogen-total,” in Methods of Soil Analysis, Part II, ed A. L. Page (Madison, WI: American Society of Agronomy), 595–624.
Colnenne, C., Meynard, J. M., Roche, R., and Reau, R. (2002). Effects of nitrogen deficiencies on autumnal growth of oilseed rape, Eur. J. Agron. 17, 11–28. doi: 10.1016/S1161-0301(01)00140-X
Confalonieri, R., Debellini, C., Pirondini, M., Possenti, P., Bergamini, L., Barlassina, G., et al. (2011). A new approach for determining rice critical nitrogen concentration. J. Agric. Sci. 149, 633–638. doi: 10.1017/S0021859611000177
Eickhout, B., Bouwman, A. F., and Zeijts, H. V. (2006). The role of nitrogen in world food production and environmental sustainability. Agric. Ecosys. Environ. 116, 4–14. doi: 10.1016/j.agee.2006.03.009
Gastal, F., and Bélanger, G. (1993). The effects of nitrogen fertilization and the growing season on photosynthesis of field-grown tall fescue (Festuca arundinacea schreb.) canopies. Ann. Bot. 72, 401–408. doi: 10.1006/anbo.1993.1125
Hammer, G. L., and Wright, G. C. (1994). A theoretical analysis of nitrogen and radiation effects on radiation use efficiency in peanut. Aust. J. Agric. Res. 45, 575–589. doi: 10.1071/AR9940575
He, Z., Qiu, X., Ata-Ul-Karim, S. T., Li, Y., Liu, X., Cao, Q., et al. (2017). Development of a critical nitrogen dilution curve of double cropping rice in south China. Front. Plant Sci. 8:638. doi: 10.3389/fpls.2017.00638
Huang, S., Miao, Y., Zhao, G., Yuan, F., Ma, X., Tan, C., et al. (2015). Satellite remote sensing-based in-season diagnosis of rice nitrogen status in northeast China. Remote Sens. 7, 10646–10667. doi: 10.3390/rs70810646
Jeuffroy, M. H., and Meynard, J. M. (1997). “Azote: production agricole et environement,” in Assimilation de l'azote chez les Plantes, ed J. F. Morot-Gaudry (Paris: INRA), 369–380.
Jeuffroy, M. H., Ney, B., and Oury, A. (2002). Integrated physiological and agronomic modeling of N capture and use within the plant. J. Exp. Bot. 53, 809–823. doi: 10.1093/jexbot/53.370.809
Justes, E., Mary, B., Meynard, J. M., Machet, J. M., and Thelier-Huche, L. (1994). Determination of a critical nitrogen dilution curve for winter wheat crops. Ann. Bot. 74, 397–407. doi: 10.1006/anbo.1994.1133
Lee, K. J., and Lee, B. W. (2013). Estimation of rice growth and nitrogen nutrition status using color digital camera image analysis. Eur. J. Agron. 48, 57–65. doi: 10.1016/j.eja.2013.02.011
Lemaire, G., and Gastal, F. (1997). “N uptake and distribution in plant canopies,” in Diagnosis of the Nitrogen Status in Crops, ed G. Lemaire (Heidelberg: Springer-Verlag), 3–43.
Lemaire, G., Jeuffroy, M. H., and Gastal, F. (2008). Diagnosis tool for plant and crop N status in vegetative stage: theory and practices for crop N management. Eur. J. Agron. 28, 614–624. doi: 10.1016/j.eja.2008.01.005
Mills, A., Moot, D. J., and Jamieson, P. D. (2009). Quantifying the effect of nitrogen on productivity of cocksfoot (Dactylis glomerata L.) pastures. Eur. J. Agron. 30, 63–69. doi: 10.1016/j.eja.2008.07.008
Mistele, B., and Schmidhalter, U. (2008). Estimating the nitrogen nutrition index using spectral canopy reflectance measurements. Eur. J. Agron. 29, 184–190. doi: 10.1016/j.eja.2008.05.007
Peltonen-Sainio, P., Forsman, K., and Poutala, T. (2008). Crop management effects on pre-and post-anthesis changes in leaf area index and leaf area duration and their contribution to grain yield and yield components in spring cereals. J. Agron. Crop Science. 179, 47–61. doi: 10.1111/j.1439-037X.1997.tb01146.x
Plénet, D., and Lemaire, G. (1999). Relationships between dynamics of nitrogen uptake and dry matter accumulation in maize crops. determination critical N concentration. Plant Soil 216, 65–82. doi: 10.1023/A:1004783431055
Ritchie, J., and Otter, S. (1985). Description and performance of CERES-Wheat: a user-oriented wheat yield model. ARS U.S. Dep. Agric. 38, 159–175.
Sheehy, J. E., Dionora, M. J. A., Mitchell, P. L., Peng, S., Cassman, K. G., Lemaire, G., et al. (1998). Critical nitrogen concentrations: implications for high-yielding rice (Oryza Sativa, L.) cultivars in the tropics. Field Crops Res. 59, 31–41. doi: 10.1016/S0378-4290(98)00105-1
Wang, Y. F., Yu, Z. W., Li, S. X., and Yu, S. L. (2002). Effects of nitrogen application amount on content of protein components and processing quality of wheat grain. Sci. Agric. Sin. 35, 1071–1078.
Wang, Y., Shi, P. H., Zhang, G., Ran, J., Shi, W. M., Wang, D. J., et al. (2016). A critical nitrogen dilution curve for japonica rice based on canopy images, Field Crops Research, 198, 93–100. doi: 10.1016/j.fcr.2016.08.032
Yao, X., Ata-Ul-Karim, S. T., Zhu, Y., Tian, Y., Liu, X., and Cao, W. (2014b). Development of critical nitrogen dilution curve in rice based on leaf dry matter. Eur. J. Agron. 55, 20–28. doi: 10.1016/j.eja.2013.12.004
Yao, X., Zhao, B., Tian, Y. C., Liu, X. J., Ni, J., Cao, W. X., et al. (2014a). Using leaf dry matter to quantify the critical nitrogen dilution curve for winter wheat cultivated in eastern China. Field Crops Res. 159, 33–42. doi: 10.1016/j.fcr.2013.12.007
Yuan, Z., Ata-Ul-Karim, S. T., Cao, Q., Lu, Z., Cao, W., Zhu, Y., et al. (2016). Indicators for diagnosing nitrogen status of rice based on chlorophyll meter readings. Field Crops Res. 185, 12–20. doi: 10.1016/j.fcr.2015.10.003
Yue, S., Meng, Q., Zhao, R., Li, F., Chen, X., Zhang, F., et al. (2012). Critical nitrogen dilution curve for optimizing nitrogen management of winter wheat production in the North China plain. Agron. J. 104, 523–529. doi: 10.2134/agronj2011.0258
Yue, S., Sun, F., Meng, Q., Zhao, R., Fei, L., Chen, X., et al. (2014). Validation of a critical nitrogen curve for summer maize in the north China plain. Pedosphere 24, 76–83. doi: 10.1016/S1002-0160(13)60082-X
Zhao, B., Ata-Ul-Karim, S. T., Liu, Z., Xiao, J., Liu, Z., Qin, A., et al. (2017). Development of a critical nitrogen dilution curve based on leaf dry matter for summer maize. Field Crops Res. 208, 60–68. doi: 10.1016/j.fcr.2017.03.010
Zhao, B., Ata-Ul-Karim, S. T., Yao, X., Tian, Y., Cao, W., Zhu, Y., et al. (2016a). A new curve of critical nitrogen concentration based on spike dry matter for winter wheat in eastern China. PLoS ONE 11:e0164545. doi: 10.1371/journal.pone.0164545
Zhao, B., Liu, Z., Ata-Ul-Karim, S. T., Xiao, J., Liu, Z., Qi, A., et al. (2016b). Rapid and nondestructive estimation of the nitrogen nutrition index in winter barley using chlorophyll measurements. Field Crops Res. 185, 59–68. doi: 10.1016/j.fcr.2015.10.021
Zhao, B., Yao, X., Tian, Y., Liu, X., Ata-Ul-Karim, S. T., Ni, J., et al. (2014). New critical nitrogen curve based on leaf area index for winter wheat. Agron. J. 106, 379–389. doi: 10.2134/agronj2013.0213
Zhao, B., Yao, X., Tian, Y., Liu, X., Cao, W., and Zhu, Y. (2012). Accumulative nitrogen deficit models of wheat aboveground part based on critical nitrogen concentration. Chin. J. Appl. Ecol. 23, 3141–3148.
Zhao, D., Reddy, K. R., Kakani, V. G., and Reddy, V. R. (2005). Nitrogen deficiency effects on plant growth, leaf photosynthesis, and hyperspectral reflectance properties of sorghum. Eur. J. Agron. 22, 391–403. doi: 10.1016/j.eja.2004.06.005
Zhao, Z., Wang, E., Wang, Z., Zang, H., Liu, Y., and Angus, J. F. (2014). A reappraisal of the critical nitrogen concentration of wheat and its implications on crop modeling. Field Crop. Res. 164, 65–73. doi: 10.1016/j.fcr.2014.05.004
Zhu, X. K., Guo, W. S., Zhou, J. L., Hong, H. U., Ying, Z., Li, C. Y., et al. (2003). Effects of nitrogen on grain yield, nutritional and processing quality of wheat for different end uses. Agric. Sci. China 2, 609–616.
Ziadi, N., Bélanger, G., Claessens, A., Lefebvre, L., Cambouris, A. N., Tremblay, N., et al. (2010). Determination of a critical nitrogen dilution curve for spring wheat. Agron. J. 102, 241–250. doi: 10.2134/agronj2009.0266
Keywords: wheat, leaf area duration, critical nitrogen dilution curve, nitrogen nutrition index, yield
Citation: Wang X, Ye T, Ata-Ul-Karim ST, Zhu Y, Liu L, Cao W and Tang L (2017) Development of a Critical Nitrogen Dilution Curve Based on Leaf Area Duration in Wheat. Front. Plant Sci. 8:1517. doi: 10.3389/fpls.2017.01517
Received: 12 May 2017; Accepted: 17 August 2017;
Published: 04 September 2017.
Edited by:
Jianjun Chen, University of Florida, United StatesReviewed by:
Khawar Jabran, Düzce University, TurkeyLuis Morales-Salinas, University of Chile, Chile
Copyright © 2017 Wang, Ye, Ata-Ul-Karim, Zhu, Liu, Cao and Tang. This is an open-access article distributed under the terms of the Creative Commons Attribution License (CC BY). The use, distribution or reproduction in other forums is permitted, provided the original author(s) or licensor are credited and that the original publication in this journal is cited, in accordance with accepted academic practice. No use, distribution or reproduction is permitted which does not comply with these terms.
*Correspondence: Liang Tang, tangl@njau.edu.cn