 Riccardo Ludovisi1†
 Flavia Tauro1†
 Riccardo Salvati1
 Sacha Khoury2
 Giuseppe Scarascia Mugnozza1
 Antoine Harfouche1*
- 1Department for Innovation in Biological, Agro-food and Forest Systems, University of Tuscia, Viterbo, Italy
- 2Department of Plant Sciences, University of Cambridge, Cambridge, United Kingdom
Poplars are fast-growing, high-yielding forest tree species, whose cultivation as second-generation biofuel crops is of increasing interest and can efficiently meet emission reduction goals. Yet, breeding elite poplar trees for drought resistance remains a major challenge. Worldwide breeding programs are largely focused on intra/interspecific hybridization, whereby Populus nigra L. is a fundamental parental pool. While high-throughput genotyping has resulted in unprecedented capabilities to rapidly decode complex genetic architecture of plant stress resistance, linking genomics to phenomics is hindered by technically challenging phenotyping. Relying on unmanned aerial vehicle (UAV)-based remote sensing and imaging techniques, high-throughput field phenotyping (HTFP) aims at enabling highly precise and efficient, non-destructive screening of genotype performance in large populations. To efficiently support forest-tree breeding programs, ground-truthing observations should be complemented with standardized HTFP. In this study, we develop a high-resolution (leaf level) HTFP approach to investigate the response to drought of a full-sib F2 partially inbred population (termed here ‘POP6’), whose F1 was obtained from an intraspecific P. nigra controlled cross between genotypes with highly divergent phenotypes. We assessed the effects of two water treatments (well-watered and moderate drought) on a population of 4603 trees (503 genotypes) hosted in two adjacent experimental plots (1.67 ha) by conducting low-elevation (25 m) flights with an aerial drone and capturing 7836 thermal infrared (TIR) images. TIR images were undistorted, georeferenced, and orthorectified to obtain radiometric mosaics. Canopy temperature (Tc) was extracted using two independent semi-automated segmentation techniques, eCognition- and Matlab-based, to avoid the mixed-pixel problem. Overall, results showed that the UAV platform-based thermal imaging enables to effectively assess genotype variability under drought stress conditions. Tc derived from aerial thermal imagery presented a good correlation with ground-truth stomatal conductance (gs) in both segmentation techniques. Interestingly, the HTFP approach was instrumental to detect drought-tolerant response in 25% of the population. This study shows the potential of UAV-based thermal imaging for field phenomics of poplar and other tree species. This is anticipated to have tremendous implications for accelerating forest tree genetic improvement against abiotic stress.
Introduction
Fast growing Populus clones are among the most common lignocellulosic feedstocks for second-generation bioenergy production in Europe (Amichev et al., 2010; Sannigrahi et al., 2010; Sabatti et al., 2014; Djomo et al., 2015). A recent report of the International Poplar Commission indicates that the total area of short rotation coppice (SRC) Populus across Europe is about 23,502 ha (FAO, 2016). However, the current surface area planted with SRC Populus in Europe was estimated at about 45,000 ha by Alasia Franco Vivai (Franco Alasia, Personal Communication), taking into account the establishment of few thousands ha in recent years in Poland. Compared to alternative bioenergy crops, SRC plantations offer versatile year-round coppice cycles and high yield to input ratio (Sims and Venturi, 2004). To alleviate the conflict between food and biofuel production (Rockwood et al., 2004; Edrisi and Abhilash, 2016), SRC plantations are typically grown on marginal lands, which are inadequate for high productivity crop growth (Herr and Carlson, 2013), thus generating an income without the need for a land remediation period (Paulson et al., 2003).
Short rotation coppice Populus clones are selected from world-wide breeding programs based on interspecific hybridization, whereby black poplar (Populus nigra L.) is a fundamental parental pool (Stanton et al., 2013); being widely and naturally spread in Europe, typically associated with riparian ecosystems, and characterized by large phenotypic and genetic variability (van der Schoot et al., 2000; Richardson et al., 2014; DeWoody et al., 2015). Moreover, P. nigra has been thoroughly studied due to its numerous adaptive characteristics, including easy clonal propagation, good coppicing ability, resistance to pathogens and parasites (Benetka et al., 2012), prolonged growing season (Rohde et al., 2011), and high plasticity in response to environmental conditions (Chamaillard et al., 2011). Breeding strategies based on recurrent selection and testing are frequently implemented for gradual population improvement (Neale and Kremer, 2011). Acceleration of the Populus domestication is also expected through recurrent intraspecific crossing and higher order species mixes, yet to be supplemented by genomic selection, association genetics, and genetic engineering (Harfouche et al., 2012). While first-generation hybridization (F1) is adopted to obtain heterosis for growth rate (Stettler et al., 1988), advanced generation breeding, such as F2 hybridization, among closely related Populus species, has proved to be an efficient strategy toward genetic improvement (Stanton et al., 2010).
Field-grown trees are routinely exposed to environmental stress and are likely to experience unprecedented rises in temperature and increases in the frequency and severity of summer drought episodes in the future (Lindner et al., 2014; IPCC, 2014). The physiological responses to drought are complex and traits vary in their importance depending on intensity, duration, and timing of the drought (Bréda and Badeau, 2008; Tardieu and Tuberosa, 2010; Harfouche et al., 2014). These traits present as reduced leaf size, decreased leaf growth rate, lowered stomatal aperture and density, reduced stomatal conductance (gs), and altered patterns of root development (Tardieu and Tuberosa, 2010). Furthermore, inside the leaf, prolonged drought periods reduce CO2 assimilation rates and the extra energy dissipation, with a consequent increase in reactive oxygen species production, leading to leaf senescence and yield loss (Pintó-Marijuan and Munné-Bosch, 2014). Physiological and molecular studies on drought tolerance in Populus have shed light on the considerable divergence in response to water deficit between different genotypes (Marron et al., 2002; Monclus et al., 2006; Street et al., 2006; Huang et al., 2009; Regier et al., 2009; Cocozza et al., 2010; Viger et al., 2016).
Plant tolerance to abiotic stresses is an ambiguous concept, even after distinguishing different strategies such as avoidance, tolerance, and escape (Levitt, 1972). Depending on their genetically dictated molecular and physiological attributes, plants budget their water in very different ways, along a continuum that ranges from the water-conserving or risk-aversion behavior displayed by isohydric plants to the risk-taking behavior displayed by anisohydric plants (Tardieu and Simonneau, 1998; Moshelion et al., 2014; Sade and Moshelion, 2014; Attia et al., 2015).
In reduced water availability conditions, the relationship between gs and leaf temperature has been utilized as a valid indicator of trees’ response (Chaves et al., 2003; Bréda et al., 2006; Jiménez-Bello et al., 2011; Costa et al., 2013; Rebetzke et al., 2013; Struthers et al., 2015). Therefore, relating the leaf temperature of individuals to the average value of a population exposed to similar environmental conditions may be indicative of the trees’ state of stress.
A major obstacle to a more effective dissection of plant response to drought is the difficulty in properly phenotyping in a high-throughput fashion. To relieve a phenotyping bottleneck, phenotypic traits should be turned into quantifiable, objective, and consistent measures. Furthermore, automated and high-throughput phenotyping (HTP) on large-scale plant populations is expected to increase the probability of detecting crucial traits and, thus, identifying effective genotype-phenotype relationships (Goggin et al., 2015). HTP envisions a suite of strategies to speed up the phenotyping process and maximize the number of studied plants per experiment (Goggin et al., 2015). These methods enable automated, non-destructive, and non-invasive screening of high dimensionality populations, and thus, allowing the same plants and their responses to changing environmental factors to be monitored throughout their life cycle (Fahlgren et al., 2015a). To facilitate data interpretation, HTP platforms often involve observations in controlled conditions, such as growth chambers and greenhouses. However, plant performance in highly controlled conditions is poorly correlated with breeders’ target commercial and real-world environments (White et al., 2012; Araus and Cairns, 2014; Deery et al., 2014; Ghanem et al., 2015; Izawa, 2015; Poland, 2015). With regards to the specific case of drought, phenotyping under controlled conditions is highly challenging. In fact, the declining soil moisture content and increasing mechanical impedance typical of droughts are difficult to replicate in pots that are much smaller than the volume of soil available in the field (Cairns et al., 2011; Passioura, 2012). This fact may result in fast plant response through stomatal closure, which may, in turn, mask slower adaptive processes.
High-throughput phenotyping approaches seek to gather remote information; however, close-range (proximal) sensing is frequently required to provide the adequate resolution to decipher phenotypic traits (White et al., 2012). Proximal HTP combines robotic technology and imaging to enable high-dimensional phenotype screening and capture. Unmanned aerial vehicles (UAVs) equipped with cameras and sensors are proximal remote sensing that bridge the gap between time consuming ground-based measurements and satellite/airborne observations (Gago et al., 2015). Compared to traditional ground-based techniques, UAVs enable rapid and non-destructive measurements. They also offer much quicker turnaround times than satellites at competitive costs (Berni et al., 2009). In terms of spatial resolution, different from satellites, UAVs allow the acquisition of images whose pixels are significantly smaller than objects of interest, thus minimizing the bias effect due to background intensity (mixed-pixel problem) (Jones and Sirault, 2014). In contrast to aircrafts, such as manned helicopters, UAVs can safely hover at low altitudes in the proximity of plants, thus allowing high resolutions at low costs (White et al., 2012). In light of such advantages, UAVs are expected to open new avenues in field-based phenotyping of multiple stress traits and large populations rapidly, precisely, and accurately.
With regards to the evaluation of drought response, conventional ground-based methods typically require gs measurements, which involve time consuming contact with leaves (Maes and Steppe, 2012; Costa et al., 2013). Alternatively, based on the relationship between gs and leaf temperature, UAVs have been furnished with thermometers and thermal infrared (TIR) cameras to capture images of large-scale populations (Berni et al., 2009). TIR cameras show great potential in phenotyping as thermal images contain spatially distributed information about the energy emitted from body surfaces, such as plant leaves. Thermal images can be used to detect the state of stress due to drought and indirectly estimate gs through the leaf energy balance equation (Jones, 1992, 1999). Since canopy temperature (Tc) has long been recognized as a measure of plant water status (Jones et al., 2009), UAVs mounting sensors have been used for mapping drought response of agricultural crops at 20–40 cm spatial resolution (Sepulcre-Canto et al., 2006, 2007; Zarco-Tejada et al., 2012).
Although imaging has revolutionized plant phenotyping through the early and quantitative detection of plant traits in objective terms (Dhondt et al., 2013; Goggin et al., 2015), massive image data handling and processing remains the rate-limiting step in HTP (Fahlgren et al., 2015b). Image post-processing may include several steps, such as calibration and undistortion (Berni et al., 2009; Zarco-Tejada et al., 2013; Araus and Cairns, 2014), which should be automated in data management pipelines to boost HTP. Within data post-processing, the identification of objects of interest in images against other objects and the background (segmentation) (Jähne, 2005) is often the most critical step (Dhondt et al., 2013). In phenotyping studies, segmentation algorithms have been developed for plant three-dimensional measurements (Chéné et al., 2012) and to estimate crown architecture parameters (Díaz-Varela et al., 2015). For imaging to substantially contribute to HTP, standardized semi-automated image processing tools should be introduced and complemented with ground-truthing through well-established point measurement sensors (Fahlgren et al., 2015b).
Here, we developed a novel methodology for field HTP (HTFP) of drought stress in a P. nigra F2 partially inbred population using TIR images recorded from a UAV platform. The objectives of this study were to establish a field-scale HTP procedure to rapidly and precisely examine drought stress in trees; to provide objective image-based tools and statistical protocols to quantify phenotypic traits of moderately stressed and non-stressed trees; and to use HTFP to identify promising drought-tolerant genotypes for potential use within Populus breeding programs.
Materials and Methods
The workflow of the developed methodology is illustrated in Figure 1. The HTFP method involves the following four steps: (1) UAV-based thermography to capture tree Tc; (2) semi-automatic georeferencing, orthorectification, and mosaicking of TIR images; (3) tree canopy identification against bare soil through two independent image segmentation approaches; and (4) ground-truthing validation of UAV-based thermal data with gs data.
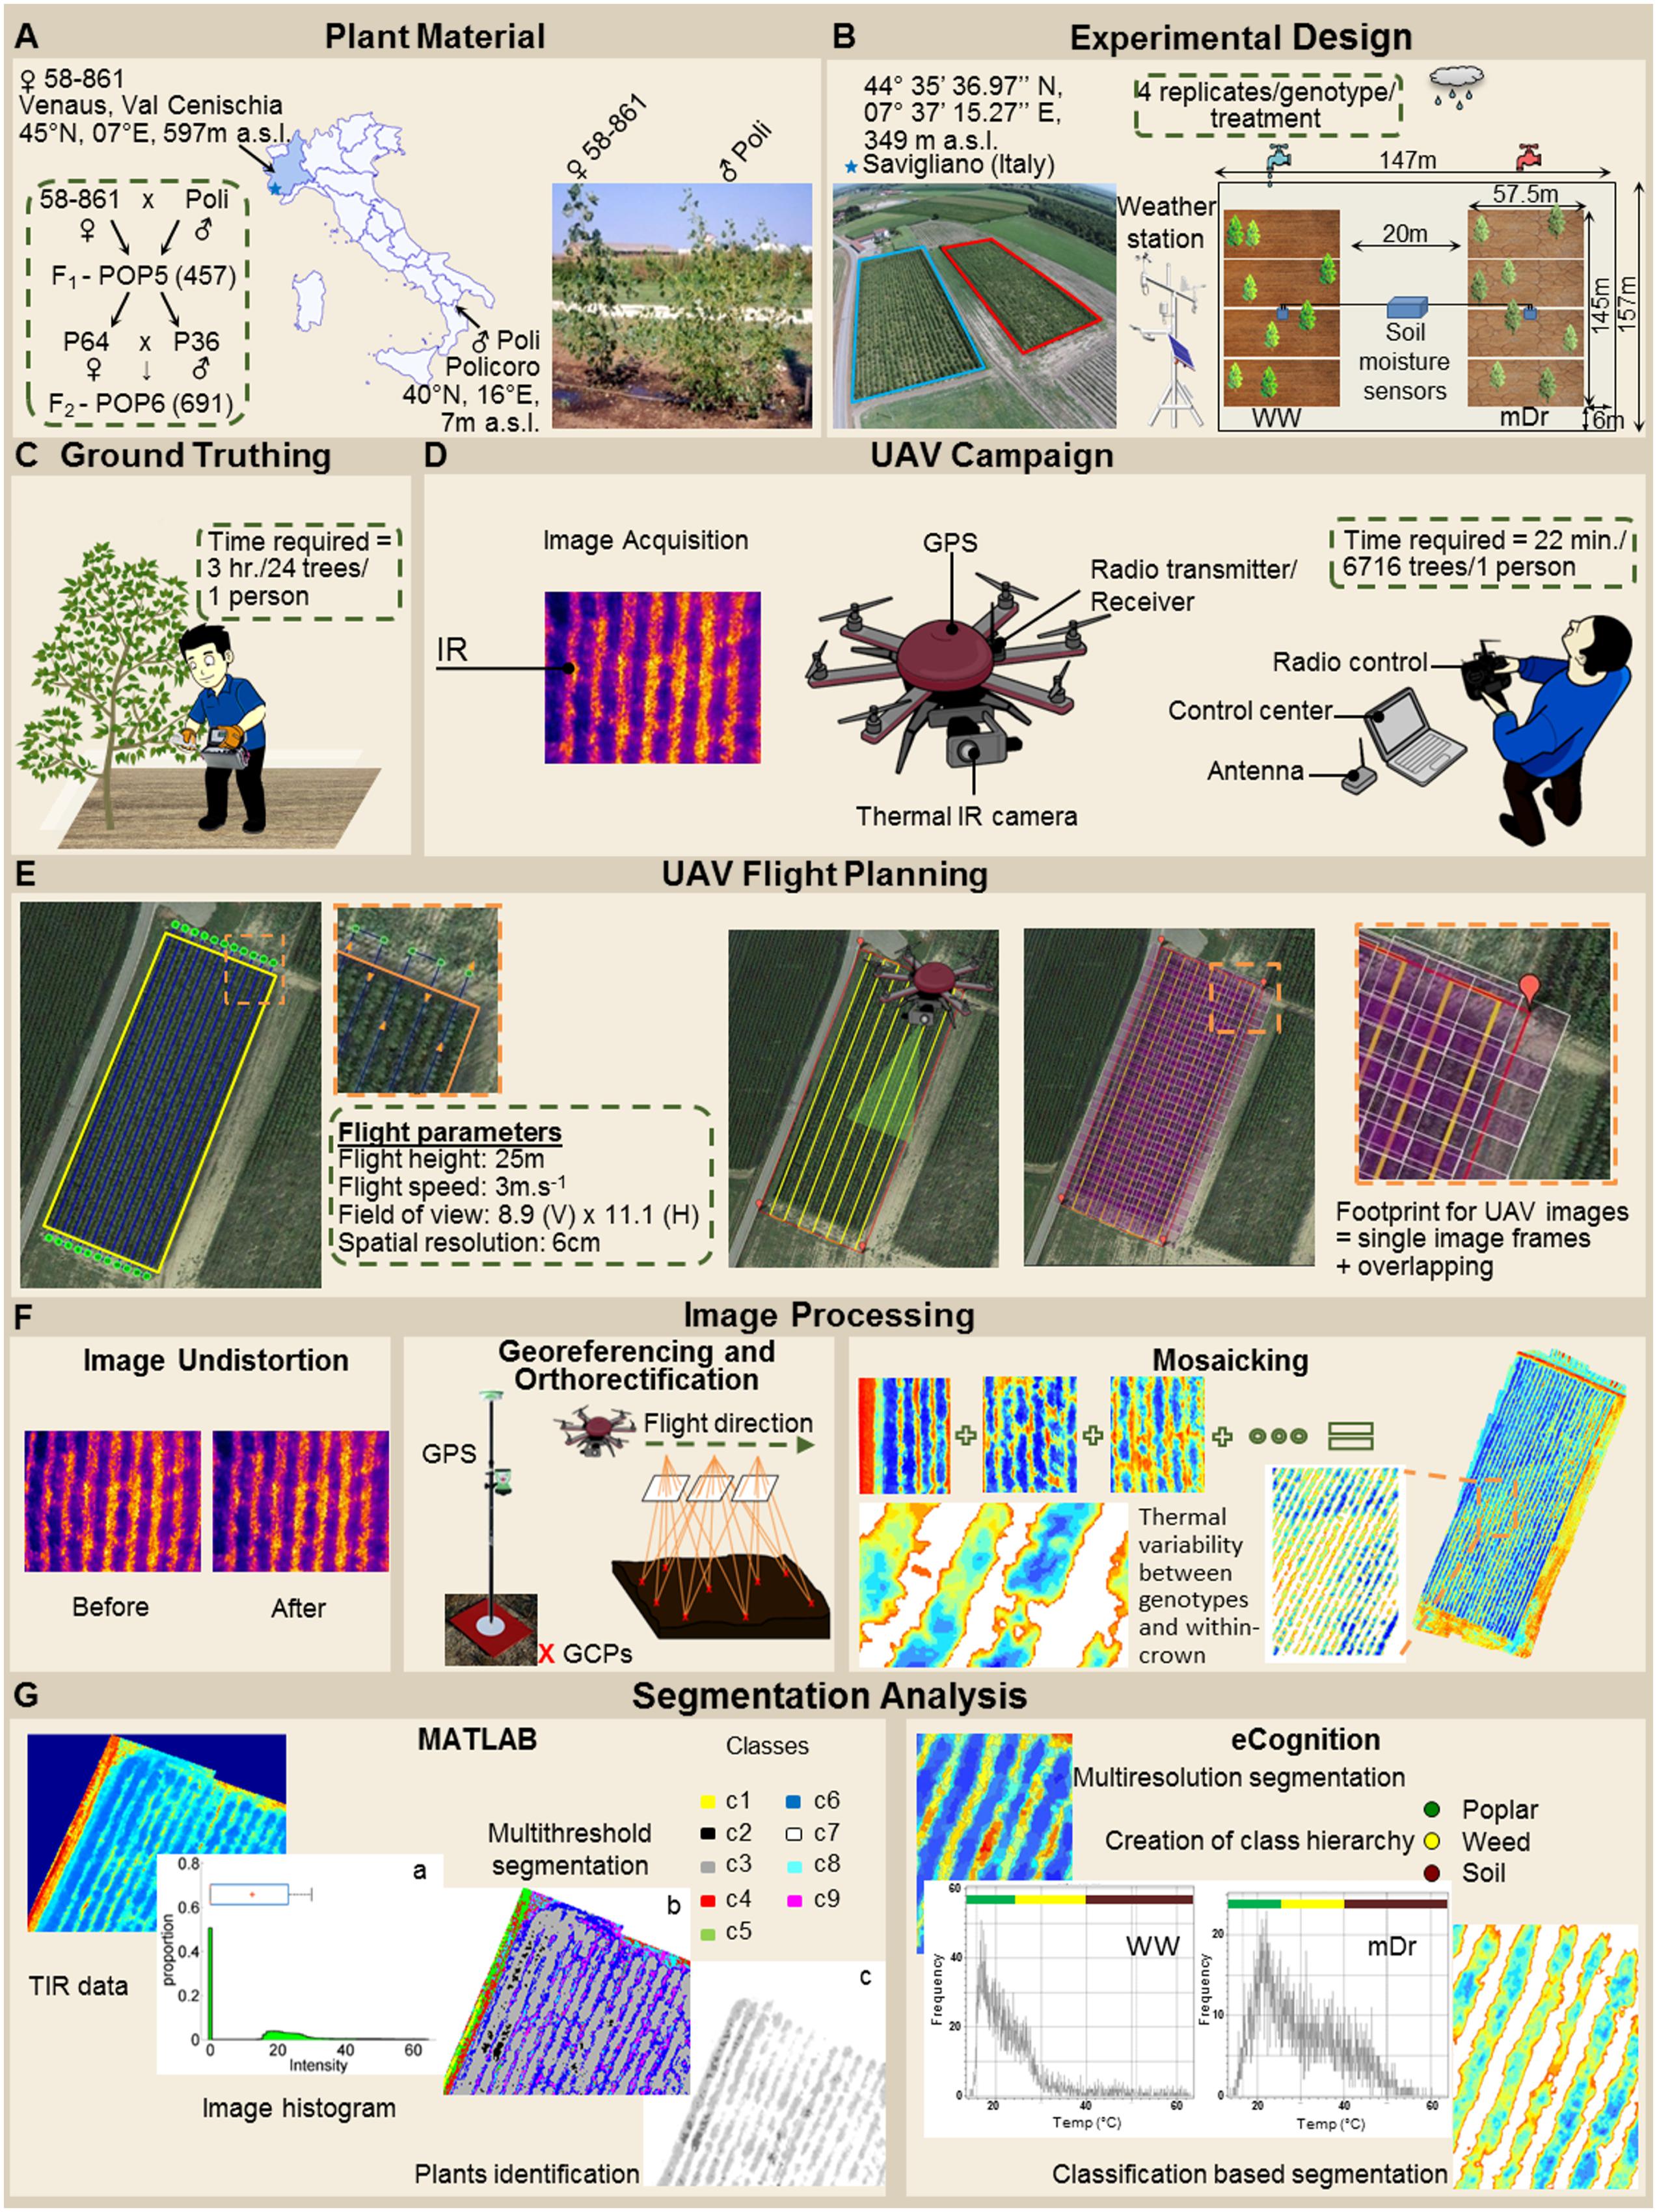
FIGURE 1. Workflow of the high-throughput field phenotyping (HTFP) methodology. (A) Plant material includes intraspecific Populus nigra full-sib F2 partially inbred population (POP6) obtained from the controlled cross between two P. nigra parents, P64 and P36. These parents were selected from an F1 breeding population (POP5) of 457 genotypes, obtained from an intraspecific P. nigra controlled cross between genotypes 58-861 and Poli. (B) Two adjacent plots were developed in (Savigliano (Italy) to host POP6 genotypes exposed to well-watered (WW) and moderate drought (mDr) stress conditions. In a plot, WW conditions were maintained, whereby water lost during the day through tree evapotranspiration (ETc, mm) was daily restored via drip irrigation. In the other plot, mDr conditions were maintained by withholding irrigation. In each plot, soil water content was daily monitored through a time domain reflectometry SM150 Soil Moisture Sensor installed at 50 cm underneath the soil surface. (C) Leaf stomatal conductance gs was collected using a dynamic diffusion porometer. Measurements were taken on three biological replicates per treatment on each parental genotype (24 trees). (D) An unmanned FlyNovex® multi-copter was integrated with a FLIR A35 TIR (thermal infrared) camera. The UAV campaign allowed for capturing TIR images of both experimental plots. (E) The flight mission was planned using the open source autopilot Mission Planner. The UAV was flown in the autonomous mode at a nominal speed of 3 m/s. (F) Fish-eye undistortion, image orthorectification, georeferencing, and mosaicking were performed using 16 ground control points (GCPs) captured with a global positioning system (GPS). (G) Canopy identification was achieved through two alternative automatic image segmentation approaches (an in-house algorithm in Matlab and eCognition).
Field Experiments
Plant Material and Experimental Design
POP6 is a full-sib F2 partially inbred population consisting of 691 genotypes obtained from an intraspecific controlled cross between two P. nigra parents, P64 and P36. Parents have been randomly selected from an F1 breeding population (POP5) of 457 genotypes, obtained from an intraspecific P. nigra controlled cross between genotypes 58-861 and Poli (Figure 1A). Such genotypes originated from natural populations in divergent environmental conditions: 58-861 is from cold/wet climates typical of Val Cenischia (Northern Italy; 45°09′N, 07°01′E, 597 m above sea level), whereas Poli originates from warm/dry climates typical of Policoro (Southern Italy; 40°09′N, 16°41′E, 7 m above sea level). These genotypes are characterized by contrasting responses to water stress (Regier et al., 2009; Cocozza et al., 2010).
In January 2012, F2 genotypes were used to establish a stool bed and produce 1-year old material. Such material was harvested in January 2013 to produce hardwood cuttings. A large number of hardwood cuttings (20 cm long) was obtained per each genotype, and cuttings whose diameter was within 3–4 cm and with a large number of intact buds were labeled and stored at +4°C.
The experimental field-scale plots were located in Savigliano (Northern Italy; 44°35′36.97″N, 07°37′15.27″E, 349 m above sea level), and were established in April 2013. Two adjacent plots (1.67 ha of total extension) were developed to expose POP6 genotypes to two different water treatments (see Section “Water Treatment”) (Figure 1B). Each plot featured a completely randomized block design with four blocks. A single hardwood cutting per genotype was randomly assigned to each block to minimize variability attributable to eventually uncontrollable environmental factors (such as soil composition and fertility). Differently, for P64, P36, 58-861, and Poli, four cuttings were replicated per each block to ensure larger data availability. Cuttings were planted at a distance of 2.5 m × 1 m, between and within rows, respectively. In addition, the border effect, i.e., trees planted at external locations of plots display better growth conditions, was minimized by planting a double border row of P. nigra cv. Jean Pourtet around the sides of each plot. Therefore, a total of 6716 trees were planted in the experimental plots.
In March 2013, multiple sprouts were thinned to a single stem per stamp, choosing the most vigorous. During the first growing season in 2013, drought treatment was not applied to ensure a homogeneous root system development and, thus, minimize effects on shoot growth due to different cutting dimensions. In the same growing season, both plots were regularly irrigated with a drip irrigation system during dry periods, and weeds were controlled using mechanized and chemical practices. In February 2014, experimental plots were coppiced, and for the second growing season in 2014, plots were managed similarly to 2013. In February 2015, trees were again coppiced and, in March 2015, re-sprouts were thinned to a single stem. Finally, due to a mortality of 12.7% of the original trees planted in 2013, 4603 plants (503 genotypes) were available at the beginning of the drought experiment in July 2015.
Weather and Soil Condition Analysis
Weather data at the experimental setup were obtained from a meteorological station managed by Agency for Protection of Environment – Piemonte (ARPA-Piemonte1) and located at 10 km from the experimental plots. Observations gathered from 1994 to 2013 indicate an annual mean temperature of 11.8°C and a total annual rainfall of 740 mm at the site. According to Köppen-Geiger classification (Kottek et al., 2006), climate was classified as Cfb, that is, warm temperate, fully humid and with warm summers. During the experiment in 2015, a 2 km distant meteorological station (Delta-T Devices Ltd., United Kingdom) was also used to record hourly air temperature (Tair), air humidity, and precipitation.
Soil samples were collected from the middle of plots to quantify soil texture and to estimate field capacity and permanent wilting point. These samples were taken from topsoil down to a maximum depth of 0.5 m. The soil type was a sandy loam (50.5% sand, 35.5% loam, and 14.0% clay), using the United States Department of Agriculture soil taxonomy. Soil field capacity and permanent wilting point were estimated to 34 and 9.5%, respectively. Soil texture was estimated using gravimetric analysis, whereas soil field capacity and permanent wilting point were evaluated using the pressure-based method (Richards and Weaver, 1944).
Water Treatment
Response to drought stress was investigated by exposing POP6 to different water regimes for a period of 26 days, from 2nd July 2015 (day of the year; DOY 183) to 28th July 2015 (DOY 209). In one plot, well-watered (WW) conditions were maintained, whereby water lost during the day through tree evapotranspiration (ETc, mm) was daily restored via drip irrigation, see Figure 1B. Water provisioned through drip irrigation was estimated based on site-specific reference evapotranspiration (ET0, mm) and on Populus crop coefficient (kc). ET0 was found according to FAO-56 Penman-Monteith equation (Allen et al., 1998), and kc was set to 0.84 in July and to 1.21 in August (Guidi et al., 2008). In the other plot, moderate drought (mDr) conditions were established by exposing plants only to natural rainfall. Drought was imposed by withholding irrigation from DOY 183, and monitoring the progressive reduction of soil moisture until a pre-wilting (i.e., sub-lethal) level of soil water content was achieved.
In each plot, soil water content was daily monitored through a time domain reflectometry SM150 Soil Moisture Sensor (Delta-T Devices Ltd., United Kingdom) installed at 50 cm underneath the soil surface. Four measures per day were recorded using a DL6 Data Logger (Delta-T Devices Ltd., United Kingdom), and the daily average soil water content was estimated. Such system allowed controllability over the experiment, by ensuring that WW and mDr conditions were maintained in the plots. During the drought experiment, daily average Tair (°C), daily rainfall (mm), daily water deficit (mm), and soil water content expressed as percentage of water field capacity (%FC) in WW and mDr plots were reported (Supplementary Figures S1A–C). Soil permanent wilting point is reported as a percentage of the water field capacity (%FC = 27.9%). Daily water deficit was calculated as the difference between precipitation and ETc, according to Cantero-Martínez et al. (2007).
Data Acquisition and Processing
UAV Campaign
An unmanned FlyNovex® multi-copter (FlyTop, Italy) was integrated with a FLIR A35 TIR camera (FLIR Systems, United States), see Figure 1D. FlyNovex® is a versatile and powerful (24V-6S motors) hexacopter (120 cm diagonal size) with a highly resistant carbon fiber frame and offering a 7 kg take-off weight. Its maximum transmission distance is 2 km and its maximum flight time is 20 min. The FLIR A35 was equipped with a 9 mm f1.25 lens. Its thermal sensitivity is less than 0.05°C at 30°C and the camera enables measurements in the range -25°C to +135°C. The image sensor is a Focal Plane Array (FPA) based on uncooled microbolometers with a spectral response in the range 7.5–13 μm. The camera field of view is equal to 48° (horizontally) × 39° (vertically), its resolution to 320 pixels × 256 pixels, and its spatial resolution to 2.78 mrad. The camera captures images at an acquisition frequency of 60 Hz.
Pictures are stored as 14 bit digital raw images. The camera is radiometrically calibrated, and its high accuracy and pixel-to-pixel sensitivity circumvent the need for ground infrared calibration targets and temperature correction during post-processing (Deery et al., 2016; Gómez-Candón et al., 2016). The camera is controlled by an embedded computer (Pico PC with a Cortex 9 processor) that stores raw images on an internal micro SDD memory card for the entire duration of the flight.
A total of 16 highly visible targets were positioned along the borders of the experimental plots (8 targets per plot were located at the corners and in the middle of each side) and used as ground control points (GCPs). The targets were used for georeferencing thermal images. A Real-Time Kinematic global positioning system (GPS; Leica Geosystems, Switzerland) GS08plus model with an accuracy of 3 mm was used for capturing GCP locations.
Flight Plan and Thermal Imaging
The flight mission was planned using the open source autopilot Mission Planner (APM Mission Planner, United States). The UAV was flown in the autonomous mode (GPS-waypoint navigation) at a nominal speed of 3 m/s. Experimental plots were scanned during two 11-min flights conducted on 28th July 2015 under stable cloudless and low-wind conditions. To ensure similar solar illumination angles and consistent proportions of sunlit and shaded leaves (Deery et al., 2014), flights were performed at 13:41 local time above WW and at 14:30 local time above mDr.
To capture the experimental plots in a single flight pass while maximizing image resolution, flight plan consisted of transects parallel to the plant rows, see Figure 1E. A ground station processed the UAV safety manual control and sent telemetry data (position, attitude, and status data) through a radio link at 2.4 GHz to a laptop computer. This communication link also allowed operation of the onboard TIR camera.
Thermal images were recorded at an elevation of 25 m from ground level, thus yielding an 8.9 (vertical) m × 11.1 (horizontal) m and a pixel size of 6 cm × 6 cm. Such a resolution is within POP6 average leaf area (46.47 cm2 or 1.3 pixels, unpublished data). Flying at such an elevation minimizes image distortions due to atmospheric effects. The selected flight plan enabled capture of thousands of high quality single images presenting 30% overlap and 50% sidelap. Since images captured during take-off, landing, and flight maneuvers were discarded from further processing, acquisition of images took a few minutes per experimental plot.
Stomatal Conductance Ground-truthing
To validate the UAV-based approach, we studied the relationship between ground-based midday stomatal conductance (gs, mmol m-2 s-1) and Tc collected from the UAV for selected genotypes, see Figure 1C. At the same time of UAV flights, we collected abaxial gs data using a dynamic diffusion porometer (AP4, Delta-T devices Ltd., United Kingdom). Measurements were taken on three biological replicates per two water treatments on each of the four parental genotypes (3 × 2 × 4 = 24 trees). On each tree, two gs technical replicates were taken on the first sunlit fully expanded leaf from the canopy top. For each plot, before measurements, the porometer was calibrated according to the experimental site Tair and humidity. Instrument calibration, gs measurements, and moving within and between plots required approximately 3 h.
Thermal Image Processing
We collected a total of 7836 thermal images (“.fff” files) during the UAV campaign. Given the high overlap and sidelap, one frame every 20 (392 images) was converted to radiometric “.jpg” through IRT Analyzer (Grayess, United States), and fish-eye undistorted through Adobe Photoshop CC (Adobe Systems, United States) (lens adjustment tool) by setting the camera focal length to 9 mm, see Figure 1F. Image mosaicking was performed with the Image Composite Editor software (Microsoft Corporation, United States), and radiometric mosaics were then converted to grid data with Surfer (Golden Software, United States). Mosaics were orthorectified and georeferenced with ArcGIS 9.2 (ESRI, United States). Orthomosaics were georeferenced by manually matching the surveyed 16 GCPs (Figure 1F).
Mosaics were processed to remove bare soil pixels (Jones and Sirault, 2014), and used to estimate average Tc (°C) for each tree. In particular, radiometric mosaics were combined with the position of the tree centers and spacing in the experimental plots (Figure 2). Firstly, radiometric mosaics were segmented to automatically identify regions depicting trees. Canopy identification was achieved through two independent semi-automatic image segmentation approaches (Figure 1G). We utilized the eCognition commercial software (eCognition Developer 9, Tremble Inc., United States) that is commonly adopted in image-based analysis for environmental applications. Further, we in-house developed a second segmentation algorithm in a Matlab environment (Matlab R2014a, The Mathworks Inc., United States).
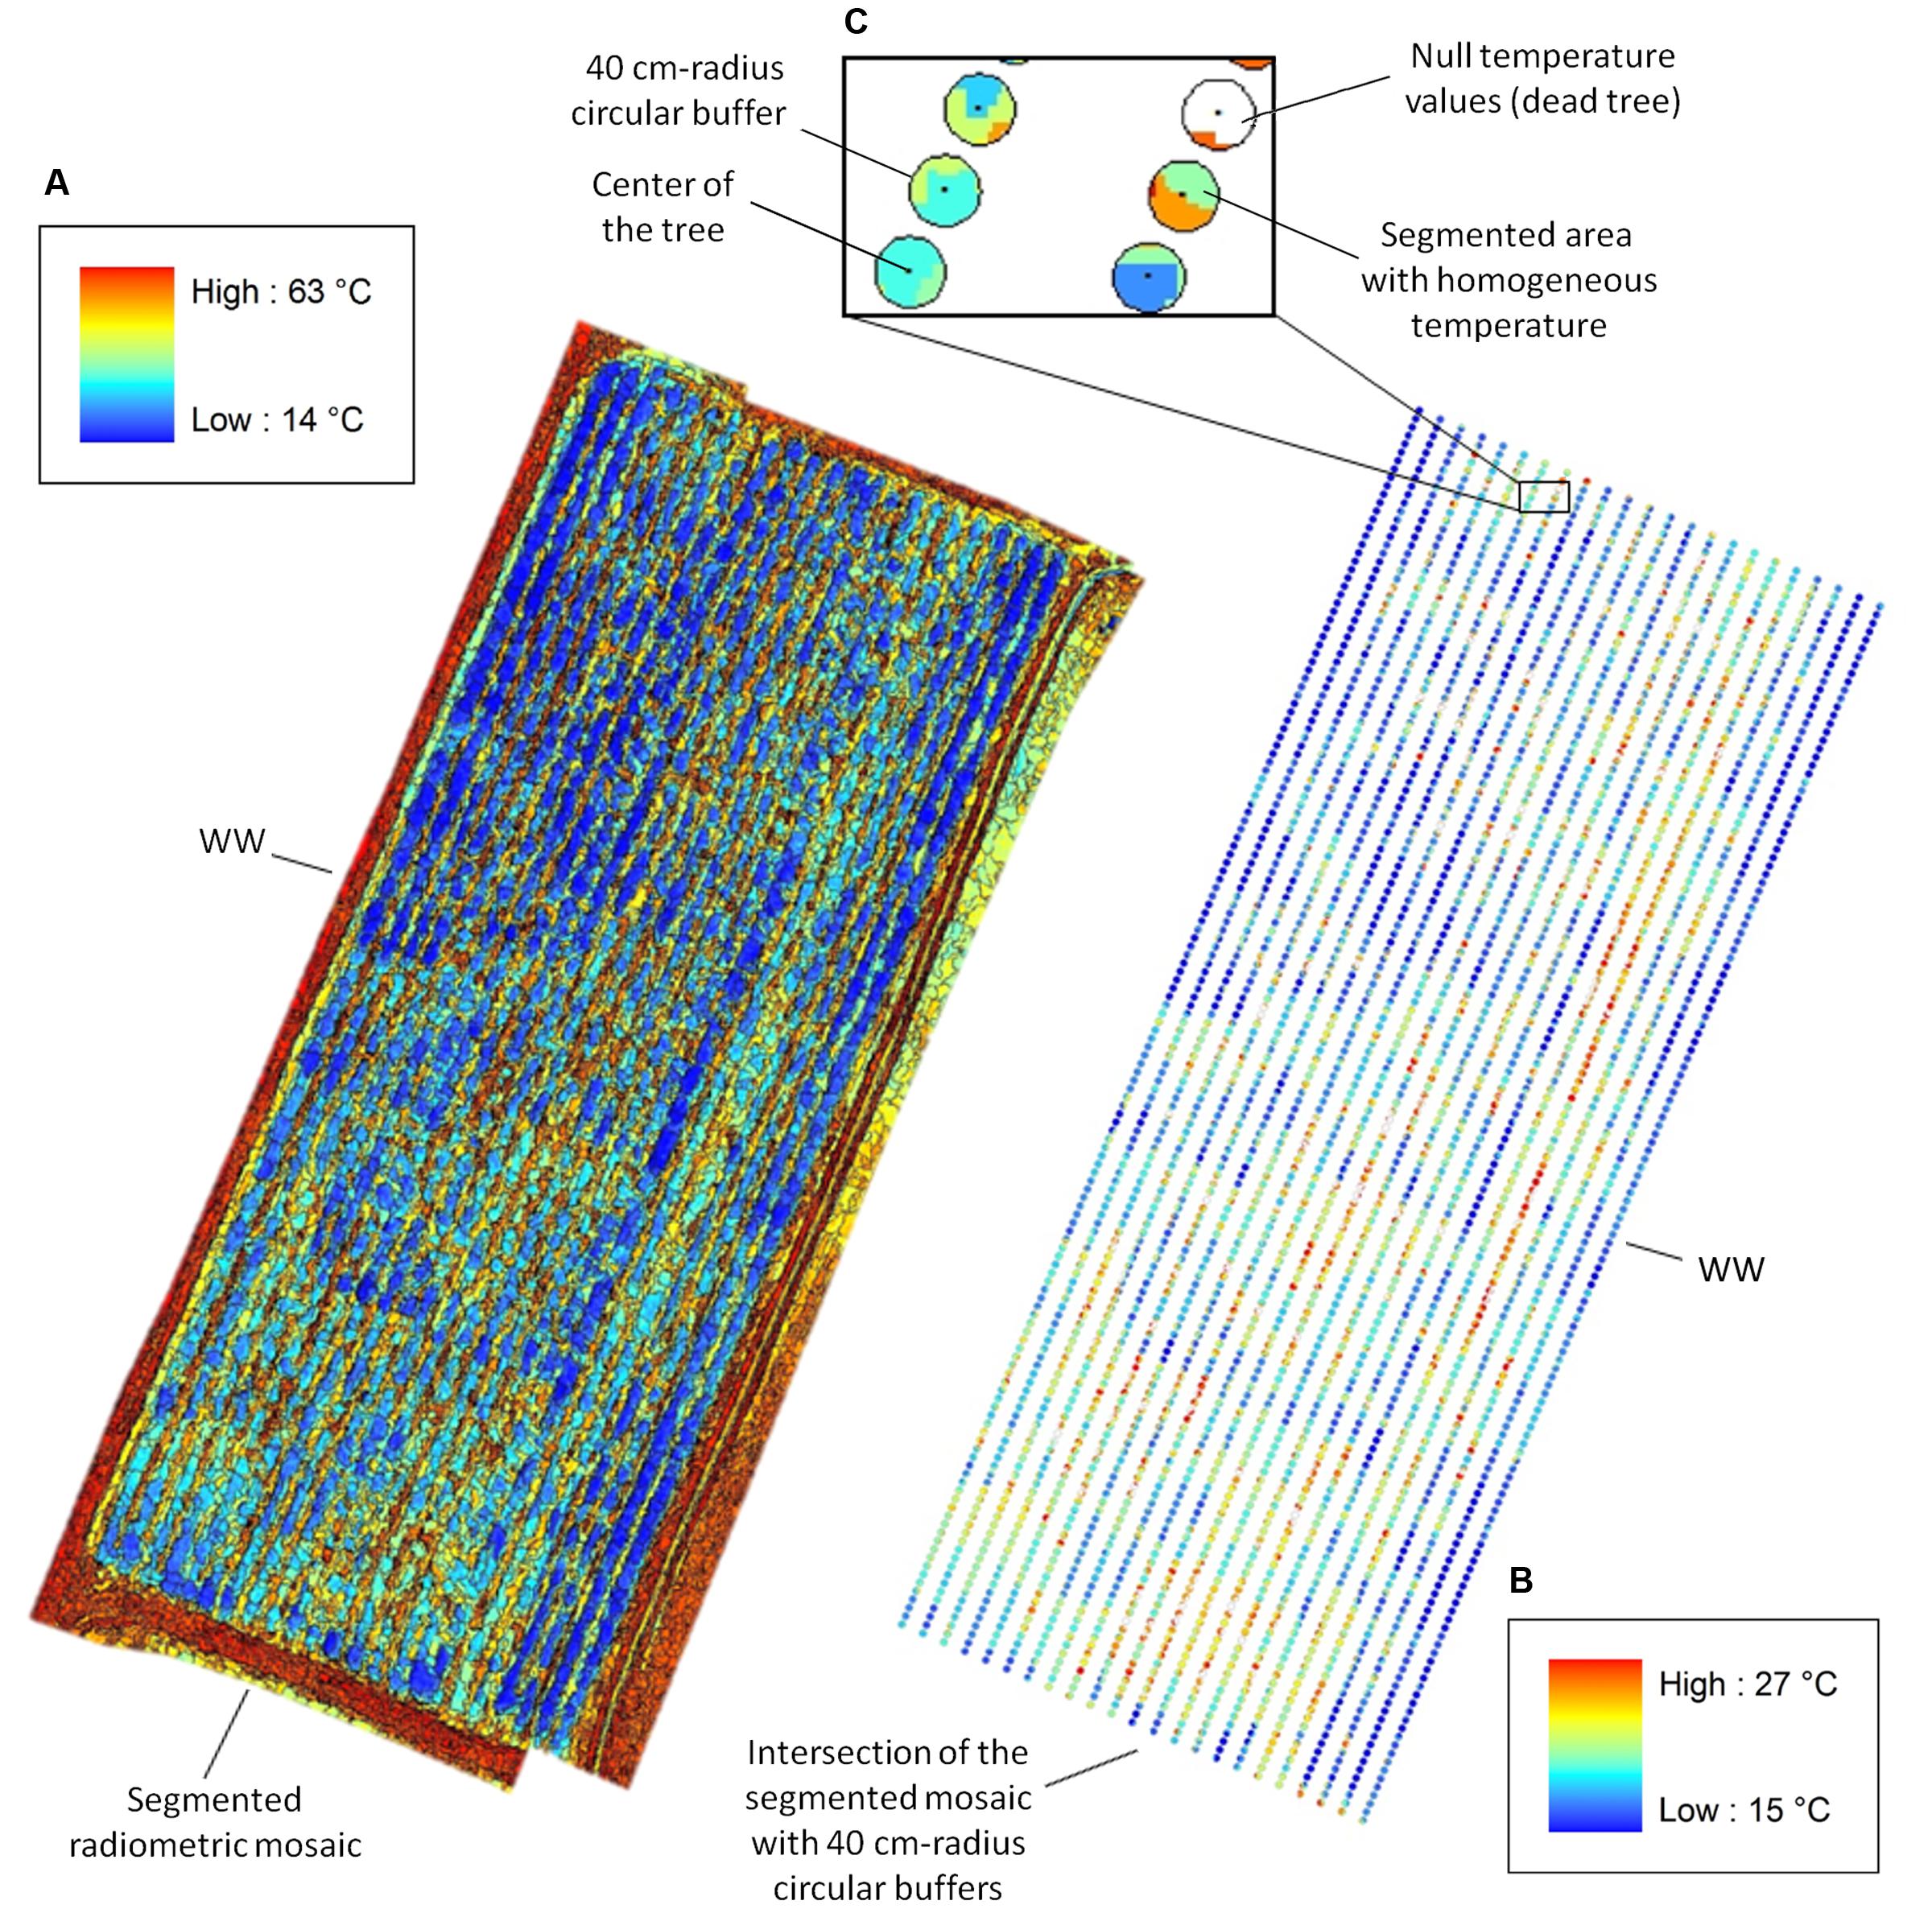
FIGURE 2. Canopy temperature (Tc) extracted from segmented radiometric mosaics. (A) eCognition-based segmentation of the WW radiometric mosaic with temperature range between 14 and 63°C (temperature color bar on the top left). (B) Intersection of the segmented mosaic with 40 cm-radius circular buffers centered on the trees with Tc ranging between 15 and 27°C (temperature color bar on the bottom right). (C) View of the intersection for six WW trees. Pixels pertaining to “Soil” and “Weed” are assigned null temperature values (white areas) in the intersected buffer, whereas pixels relative to “Poplars” range from 15 to 27°C and display different colors for segmented areas at homogeneous temperatures. Tc for each plant is estimated by averaging values of pixels lying inside each intersected buffer.
In the eCognition segmentation, parameters such as canopy shape (set to 0.1), compactness (set to 0.5), and scale (set to 10) were used to identify trees. To address bare soil pixel removal, two pixel classes were introduced. One class included pixels at temperatures ranging from 15 to 27°C and from 14 to 28°C for WW and mDr, respectively (named “Poplar” in Figure 1G). Conversely, the second class consisted of pixels at temperatures lower and higher than the above ranges (named “Weed” and “Soil” in Figure 1G). We visually ascertained in the radiometric mosaics that the first class of temperatures was related to plants, and the second to soil and weed. Segmented areas “Weed” and “Soil” were discarded in the subsequent temperature extraction analysis.
In the alternative segmentation approach, Otsu’s threshold selection method was implemented on the entire radiometric mosaics (Otsu, 1979). Mosaic histograms were thresholded to obtain nine level-segmented images. The effectiveness of the segmentation was assessed through Otsu’s objective criterion (N = 0.99 in case of eight thresholds). Based on visual inspection of the mosaics, pixels at temperatures ranging from 15 to 27°C (WW) and from 14 to 28°C (mDr) were retained for estimating average Tc.
After segmentation, pixels relative to soil and weed were assigned null temperature values in the radiometric mosaics. Then, 40 cm-radius circular buffers centered on the trees were intersected with the segmented mosaics (Figure 2). Since neighboring plants were spaced by 1 m within a row, such conservative buffer was selected to guarantee the precise identification of each plant canopy. Finally, Tc for each tree was calculated by averaging pixel values lying inside each intersected buffer.
Statistical Analysis
Phenotypic variance of a total of 503 genotypes was investigated using R software (R v.3.1.3, R Foundation for Statistical Computing, Austria). Due to natural replicates mortality since plot establishment, only genotypes with at least three replicates in both WW and mDr were retained in the analysis. Two-way ANOVA (ANalysis Of VAriance) inferential statistic procedure was used to describe the effects of genotype, treatment, and their interaction on total phenotypic variance observed in POP6. To respect ANOVA assumptions, the Box-Cox procedure (Box and Cox, 1964) was performed on the additive model to yield optimal data transformation, and Bartlett’s test was used to test the homogeneity of variance. When statistically significant differences among blocks were found, block effect adjustment was conducted to minimize the influence of competition among neighboring trees on genotype-specific response to drought conditions. Adjustment was performed according to Dillen et al. (2009), and it was repeated separately for each experimental plot.
The generalized linear mixed model was built to test differences among genotypes within each treatment and between the two treatments, and differences due to the genotype by treatment interaction (G × T). G × T aims at testing the consistency in the relative performance of genotypes grown in different conditions (White et al., 2007). Statistical significance was considered for p-values ≤ 0.05. To capture the proportion of total phenotypic variance due to genetic variation, broad-sense heritability (H2) was estimated for Tc in each treatment according to Sehgal et al. (2015):
Here, and σε2 are the genetic and residual variance components, respectively, and r is the average number of replicates for a genotype within treatment (i.e., 3.5).
Moreover, to provide a better estimation, H2 was calculated over combined treatments, taking into account the G × T effects on total variance:
Here, is the G × T variance component, n is the number of treatments, and r is the average number of replicates for a genotype in the experiment (i.e., 7.3).
Variance components were obtained using the restricted maximum likelihood (REML) procedure, with treatment as fixed effect, and genotype and G × T as random effects.
Finally, to evaluate the robustness of the independent segmentation procedures, differences between Tc datasets obtained with eCognition and Matlab, and the precision of both procedures was tested using the Student’s t-test and the Spearman’s rank correlation test. Statistical significance of the correlation coefficient (ρ) was considered for p-values ≤ 0.05.
Stress Susceptibility Index
Populus nigra genotype response to drought was dissected by computing the Stress Susceptibility Index (SSI) on UAV-based Tc. Such an index has proved to be an efficient tool to classify plants according to their tolerance or sensitivity to water stress (Sánchez et al., 2015). SSI was calculated based on genotypic mean Tc according to Fischer and Maurer (1978):
Here, TcmDr and TcWW correspond to genotypic means under mDr and WW conditions, respectively, and  cmDr and cWW correspond to POP6 means in mDr and WW conditions, respectively.
Negative SSI values correspond to a decrease in the genotypic mean TcmDr with respect to TcWW together with an increase in cmDr with respect to cWW. SSI values equal to 0 indicate consistent genotype means in mDr and WW conditions, regardless to POP6 mean responses. SSI values comprised between 0 and 1 indicate that Tc increase in mDr with respect to WW in the genotype is lower than Tc increase observed in the population. SSI values equal to 1 correspond to consistent deviations between mDr and WW conditions for both genotype and population means. SSI values greater than 1 indicate that Tc increase in mDr with respect to WW in the genotype is greater than Tc increase observed in the population. Therefore, genotypes whose index lies between 0 and 1 suggest an improved response to drought as compared to the overall population behavior.
Results
UAV-Based HTFP for Detecting Response to Drought
The UAV-based methodology allowed collection of high-throughput thermal data on experimental plots covering an area of 1.67 ha in only 22 min. While ground-truthing required 3 h to obtain gs data on 24 trees, by performing only two low-elevation UAV flights, we were able to capture the response to drought of 6716 trees with a spatial resolution of 6 cm × 6 cm, that is, at POP6 sub-leaf definition. The methodology was simple to implement in the field: TIR camera required no infrared target-based calibration; standard GCPs were located in the experimental plots; and the UAV was autonomously navigated based on pre-planned mission (Figure 1). Data processing was almost fully automated: images were undistorted, mosaicked, and orthorectified with commercial user-friendly software. The supervision of an expert was mandatory to georeference the orthomosaics and to segment images. Image segmentation allowed for addressing the mixed-pixel problem and automatically identifying tree canopies through two independent algorithms. Both methodologies required an expert user to set parameters and classes based on visual inspection of the orthomosaics, and their implementation was computationally inexpensive. The extraction of tree Tc from radiometric orthomosaics for both treatments was executed within 1 h, and computational time devoted to statistical analyses was on the order of a few minutes.
To validate UAV-based data, we utilized Tc of selected genotypes to recover the well-known inverse correlation between gs and the difference between Tc and Tair (Farooq et al., 2009; Costa et al., 2013; Virlet et al., 2014). Figure 3 illustrates the relationship between gs and the difference between Tc and the air temperature at the time of the UAV flight (Ta) for parental genotypes. They were chosen due to specific morphological and ecological traits, which were expected to lead to divergent drought responses. In Figure 3A, we show eCognition-based data, and, in Figure 3B, we report Matlab-based data. In both graphs, data relative to mDr conditions are found at high values on the X-axis and with gs ranging from 154–434 mmol m-2 s-1 on the Y-axis, whereas lower WW data correspond to higher gs values (ranging from 422 to 700 mmol m-2 s-1). Both data sets were fitted with a linear regression, statistically significant at an R2 of 0.49 (p-value < 0.05), suggesting that UAV-based thermal data accurately captured plant response to drought conditions. Tc and gs mean values, with relative standard errors, are shown in Table 1.
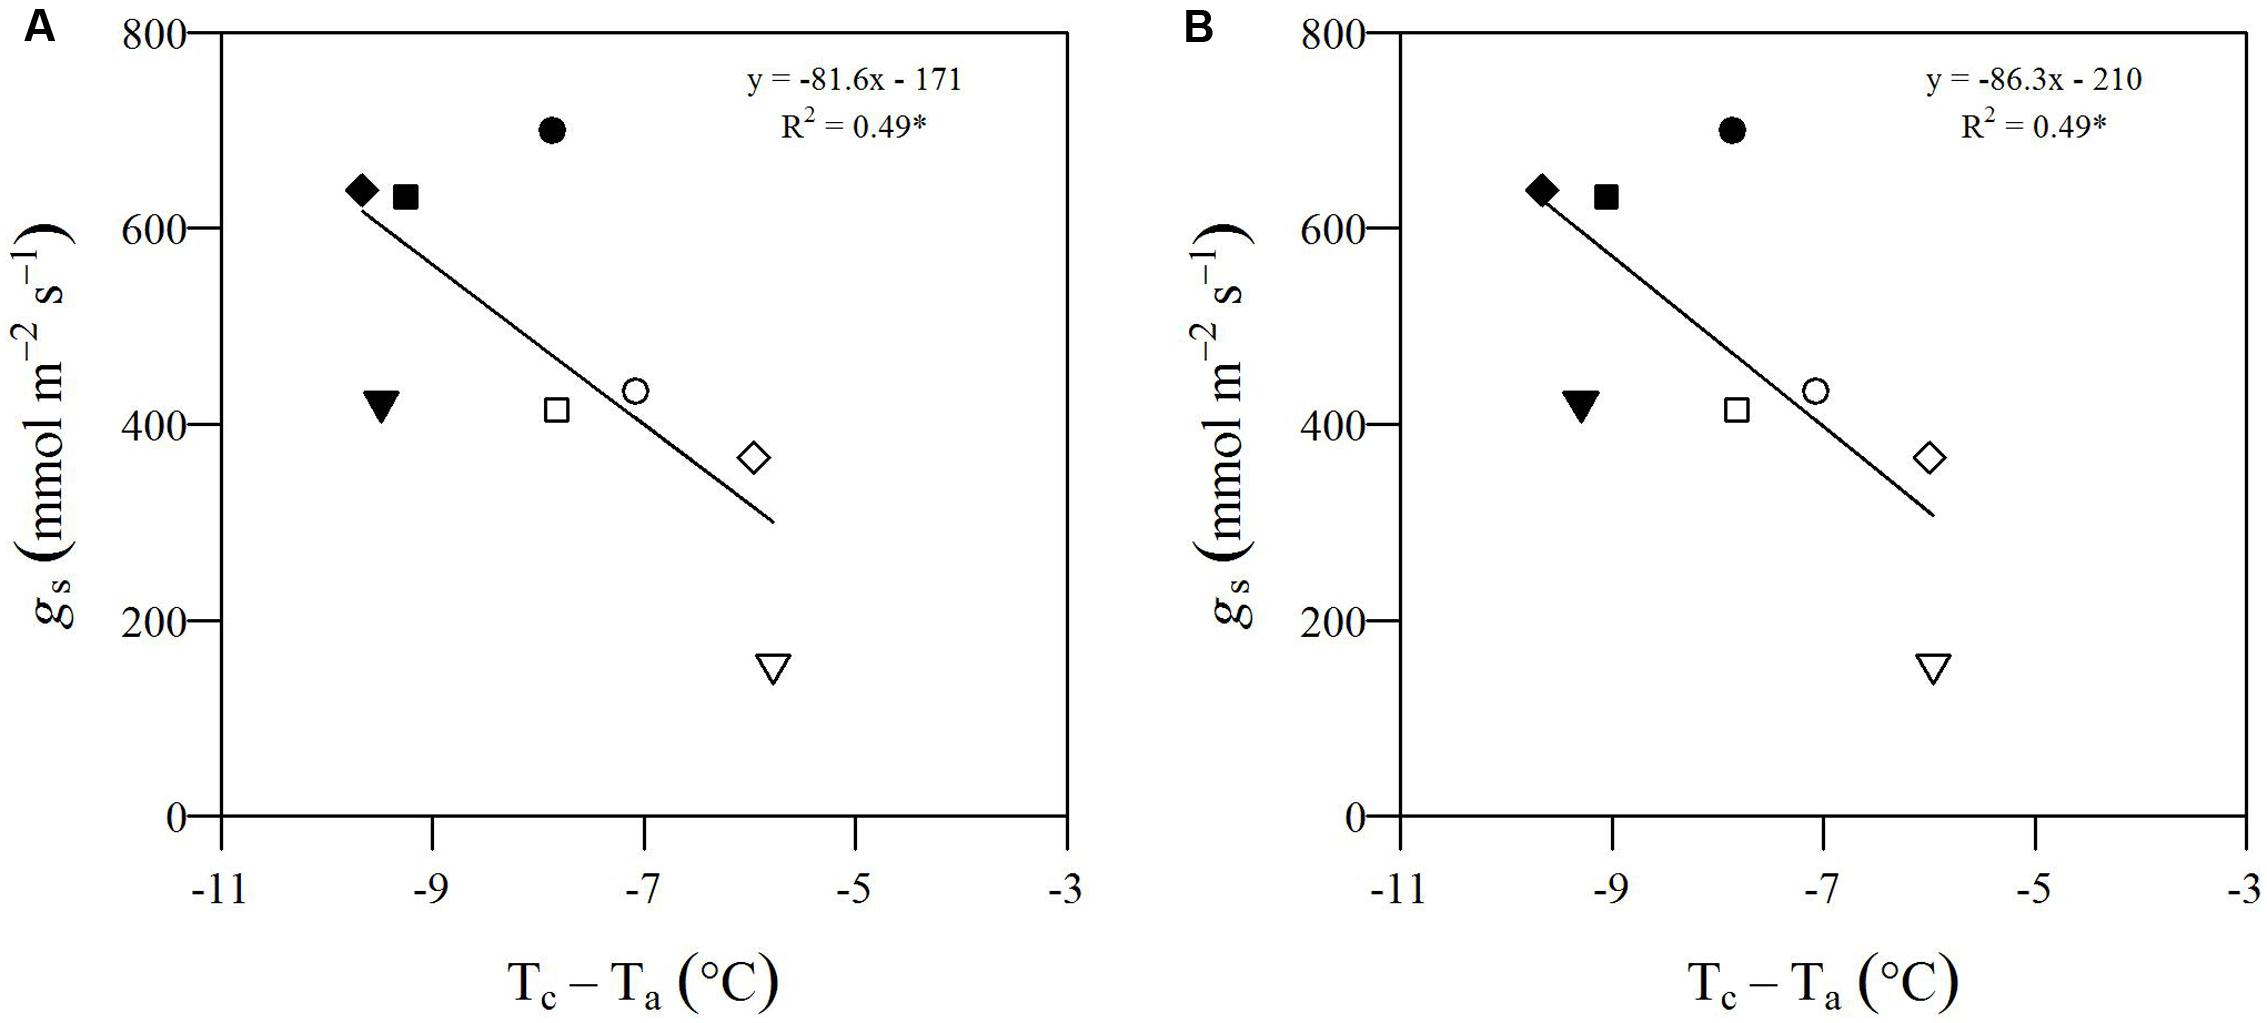
FIGURE 3. Relationship between gs (mmol m-2 s-1) and the difference between Tc and Ta (°C) for parental genotypes. (A) eCognition-based data and (B) Matlab-based data. For Poli (circle), 58-861 (triangle), P36 (square), and P64 (diamond), Tc and gs are obtained by averaging measurements taken on biological replicates. Both sets of data are fitted with a linear function (R2 = 0.49). Data relative to mDr conditions are displayed as white symbols, whereas WW data are shown as black symbols. During the UAV flights, Ta was equal to 28.75°C. Statistically significant (p-value ≤ 0.05) regressions are indicated with the symbol ∗.
TABLE 1. Phenotypic data for Tc and gs for poplar parental genotypes.
Remarkably, both segmentation approaches led to consistent relationships. To further assess the robustness of the independent segmentation methodologies, we computed the Student’s t-test on POP6 genotypic mean Tc, separately for mDr and WW conditions. Notably, differences in data obtained with eCognition and Matlab were not statistically significant for both treatments (WW: p-value = 0.82 and mDr: p-value = 0.36). Moreover, on data sets obtained with eCognition and Matlab, we also evaluated the Spearman’s rank correlation test, and ρ-values of 0.98 (p-value < 0.001) were found for both WW and mDr conditions. Based on such strongly significant correlation, both segmentation methods showed consistent Tc estimations and, therefore, could be interchangeably utilized to extract Tc from thermal images. In the succeeding figures, we report results for eCognition data; genotypic mean Tc along with standard error and SSI values for both eCognition and Matlab are provided in the Supplementary Tables S1, S2.
POP6 Response to Drought
We report results for 503 genotypes (out of the original 691, due to tree mortality) for eCognition and Matlab-based segmentations. We only retained genotypes with at least three survived replicates in both mDr and WW conditions.
To show within-population and within-genotype variability in Tc, Figure 4 displays genotypic mean Tc in WW (A) and mDr (B) conditions as obtained after segmentation with eCognition. In addition, in Figure 4C, we compared the genotypic response to drought by reporting the relative increase in TcmDr with respect to TcWW (TcmDr/TcWW). Genotypes were ordered based on increasing Tc (Figures 4A,B) and TcmDr/TcWW (Figure 4C). Dashed red lines show POP6 mean Tc (Figures 4A,B) and TcmDr/TcWW (Figure 4C).
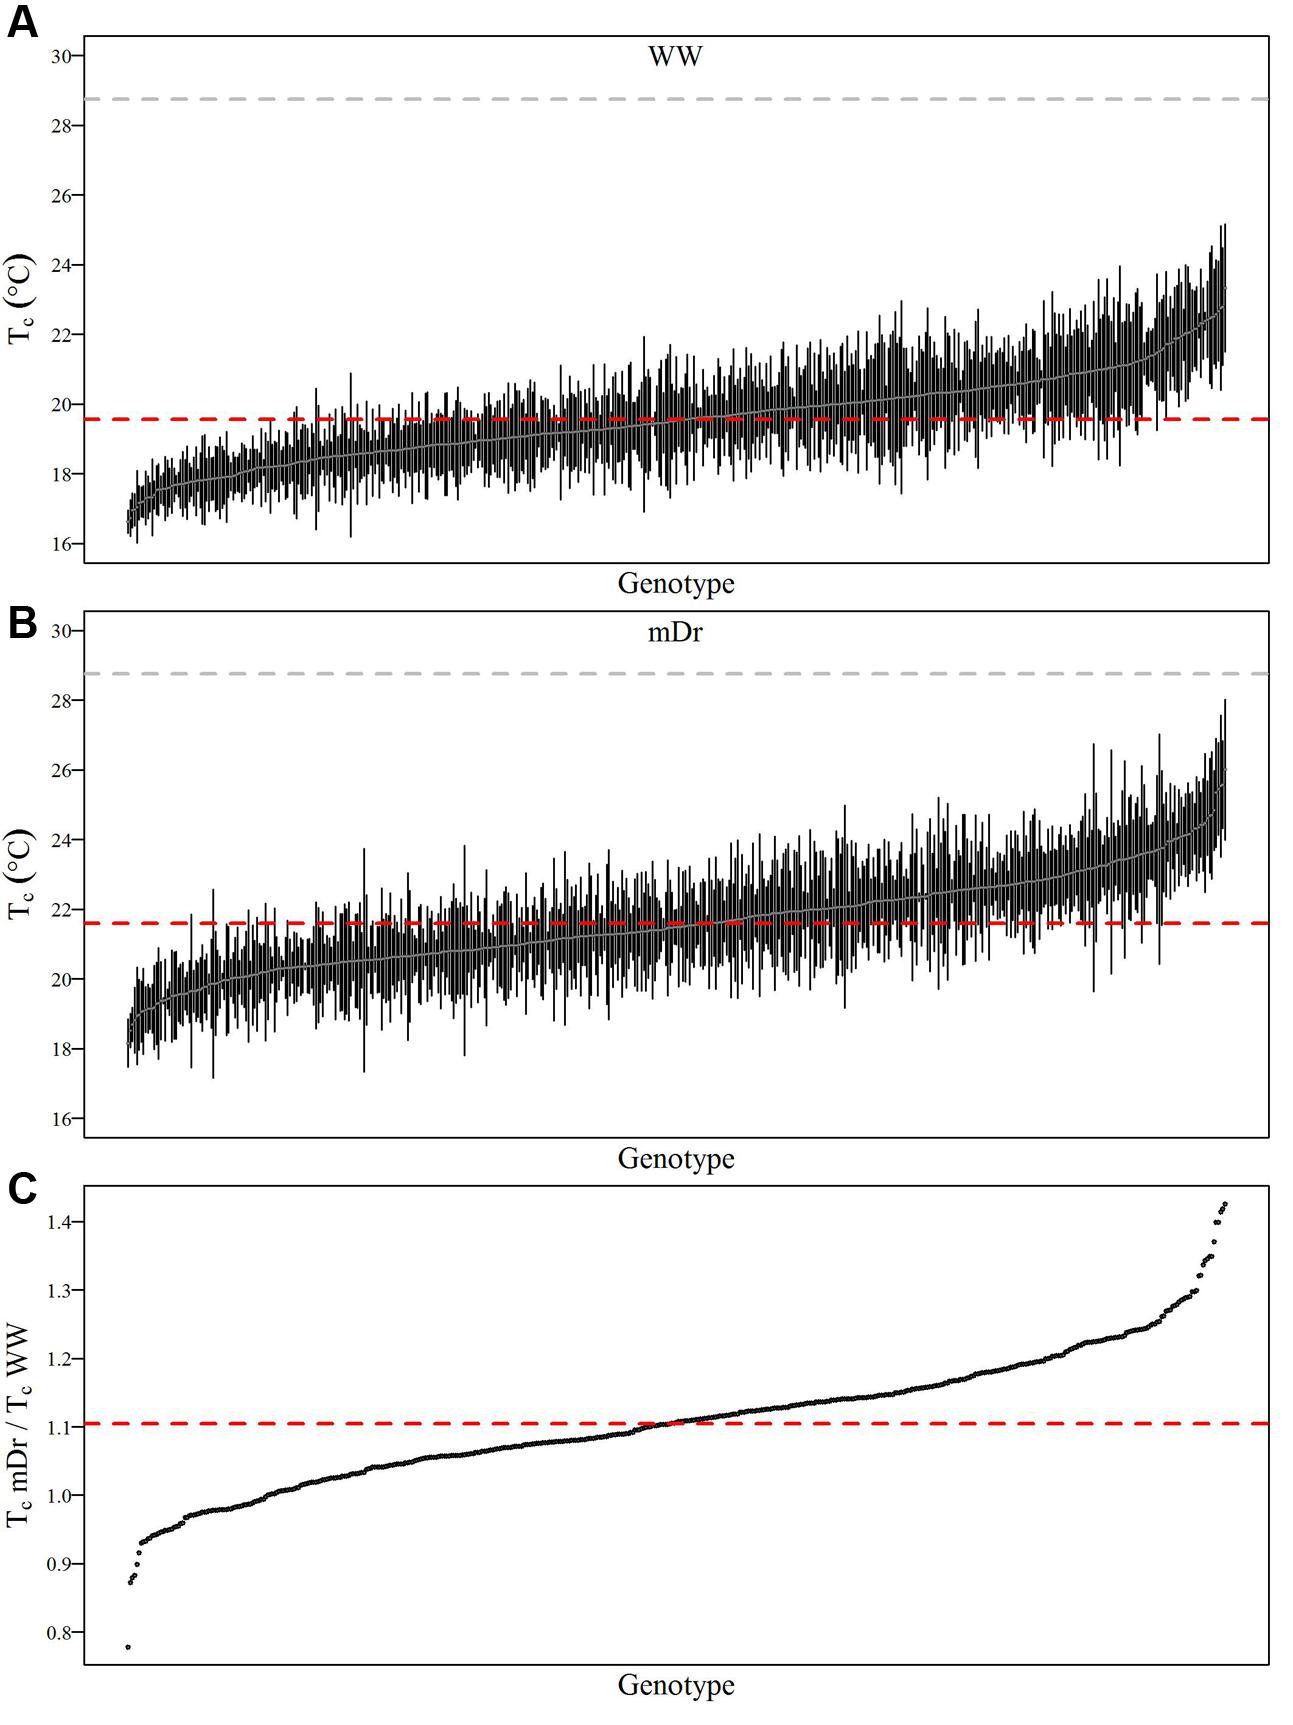
FIGURE 4. Average Tc (°C) for each genotype in WW and mDr. (A) Genotypic mean Tc (gray circles) and standard error (black bars) in WW conditions. (B) Genotypic mean Tc (gray circles) and standard error (black bars) in mDr conditions. (C) Ratio of TcmDr to TcWW (black circles). Genotypes in (A,B) are ordered based on increasing Tc. Genotypes in (C) are ordered based on increasing ratios. The dashed gray line and dashed red lines in (A,B) show Ta during the unmanned aerial vehicle (UAV) flights and population averaged Tc, respectively. The dashed red line in (C) displays population averaged TcmDr/TcWW. A total number of 503 genotypes is shown in (A–C).
In Figure 4A, a percentage of 49.3% of genotypes lies above the average Tc of 19.55°C. For Matlab, 48.4% of genotypes were found above a consistent average Tc of 19.55°C. Further, the standard error of each genotypic mean ranges from 0.05 to 2.86 for eCognition and from 0.05 to 3.24 for Matlab. In Figure 4B, a percentage of 46.3% of genotypes lies above the average Tc of 21.60°C. For Matlab, 47.4% of genotypes were found above a similar average Tc of 21.55°C. Further, the standard error of each genotypic mean ranges from 0.08 to 3.56 for eCognition and from 0.16 to 3.17 for Matlab. Genotypic mean Tc in mDr was on average warmer than in WW conditions. In WW settings, in eCognition, average Tc ranged from 16.62 to 23.33°C (Matlab: Tc ranged from 16.62 to 23.06°C). With regards to mDr settings, in eCognition, average Tc spanned from 18.16 to 26.00°C (average Tc in mDr ranged from 18.14 to 24.87°C for Matlab).
In Figure 4C, the average ratio is equal to 1.11 for both eCognition and Matlab. The percentage of genotypes lying above such value (up to a maximum value of 1.41) is equal to 49.7 and 48.6% for eCognition and Matlab, respectively. A total of 37.38% (Matlab: 38.49%) of genotypes are found between 1 and 1.11, whereas only 12.92% (Matlab: 12.90%) of genotypes have ratios ranging from 0.79 to 1.
To inspect the frequency distribution of genotypic response to drought, in Figure 5 we report histograms for genotypic mean Tc obtained with eCognition for WW (A) and mDr (B) conditions. Such frequency distribution is expected to provide insights into POP6 average response to treatments and also the population response with respect to 58-861 and Poli. Both graphs display an approximately symmetric distribution (skewness lower than 0.4) with a slightly platykurtic shape (kurtosis almost equal to 0). Similar data distributions were found for Matlab (Table 2). Further, we show average Tc for 58-861 and Poli genotypes. In WW, parental genotypes present a similar Tc (58-861 equal to 19.84 and 19.80°C; Poli equal to 19.76 and 19.75°C in eCognition and Matlab, respectively). Conversely, a greater difference in Tc between parental genotypes was found in mDr than in WW (58-861 equal to 20.88 and 20.93°C; Poli equal to 21.78 and 21.66°C in eCognition and Matlab, respectively). Different from parental genotypes, POP6 showed a large range of variation within WW and mDr treatments for both segmentation procedures. Indeed, for eCognition, average Tc ranged from 16.62 to 23.33°C in WW, and from 18.20 to 26.01°C in mDr. For Matlab, a very similar range of variation (with respect to eCognition) was found in WW (from 16.62 to 23.05°C), whereas a narrower range was observed in mDr (from 18.16 to 24.84°C).
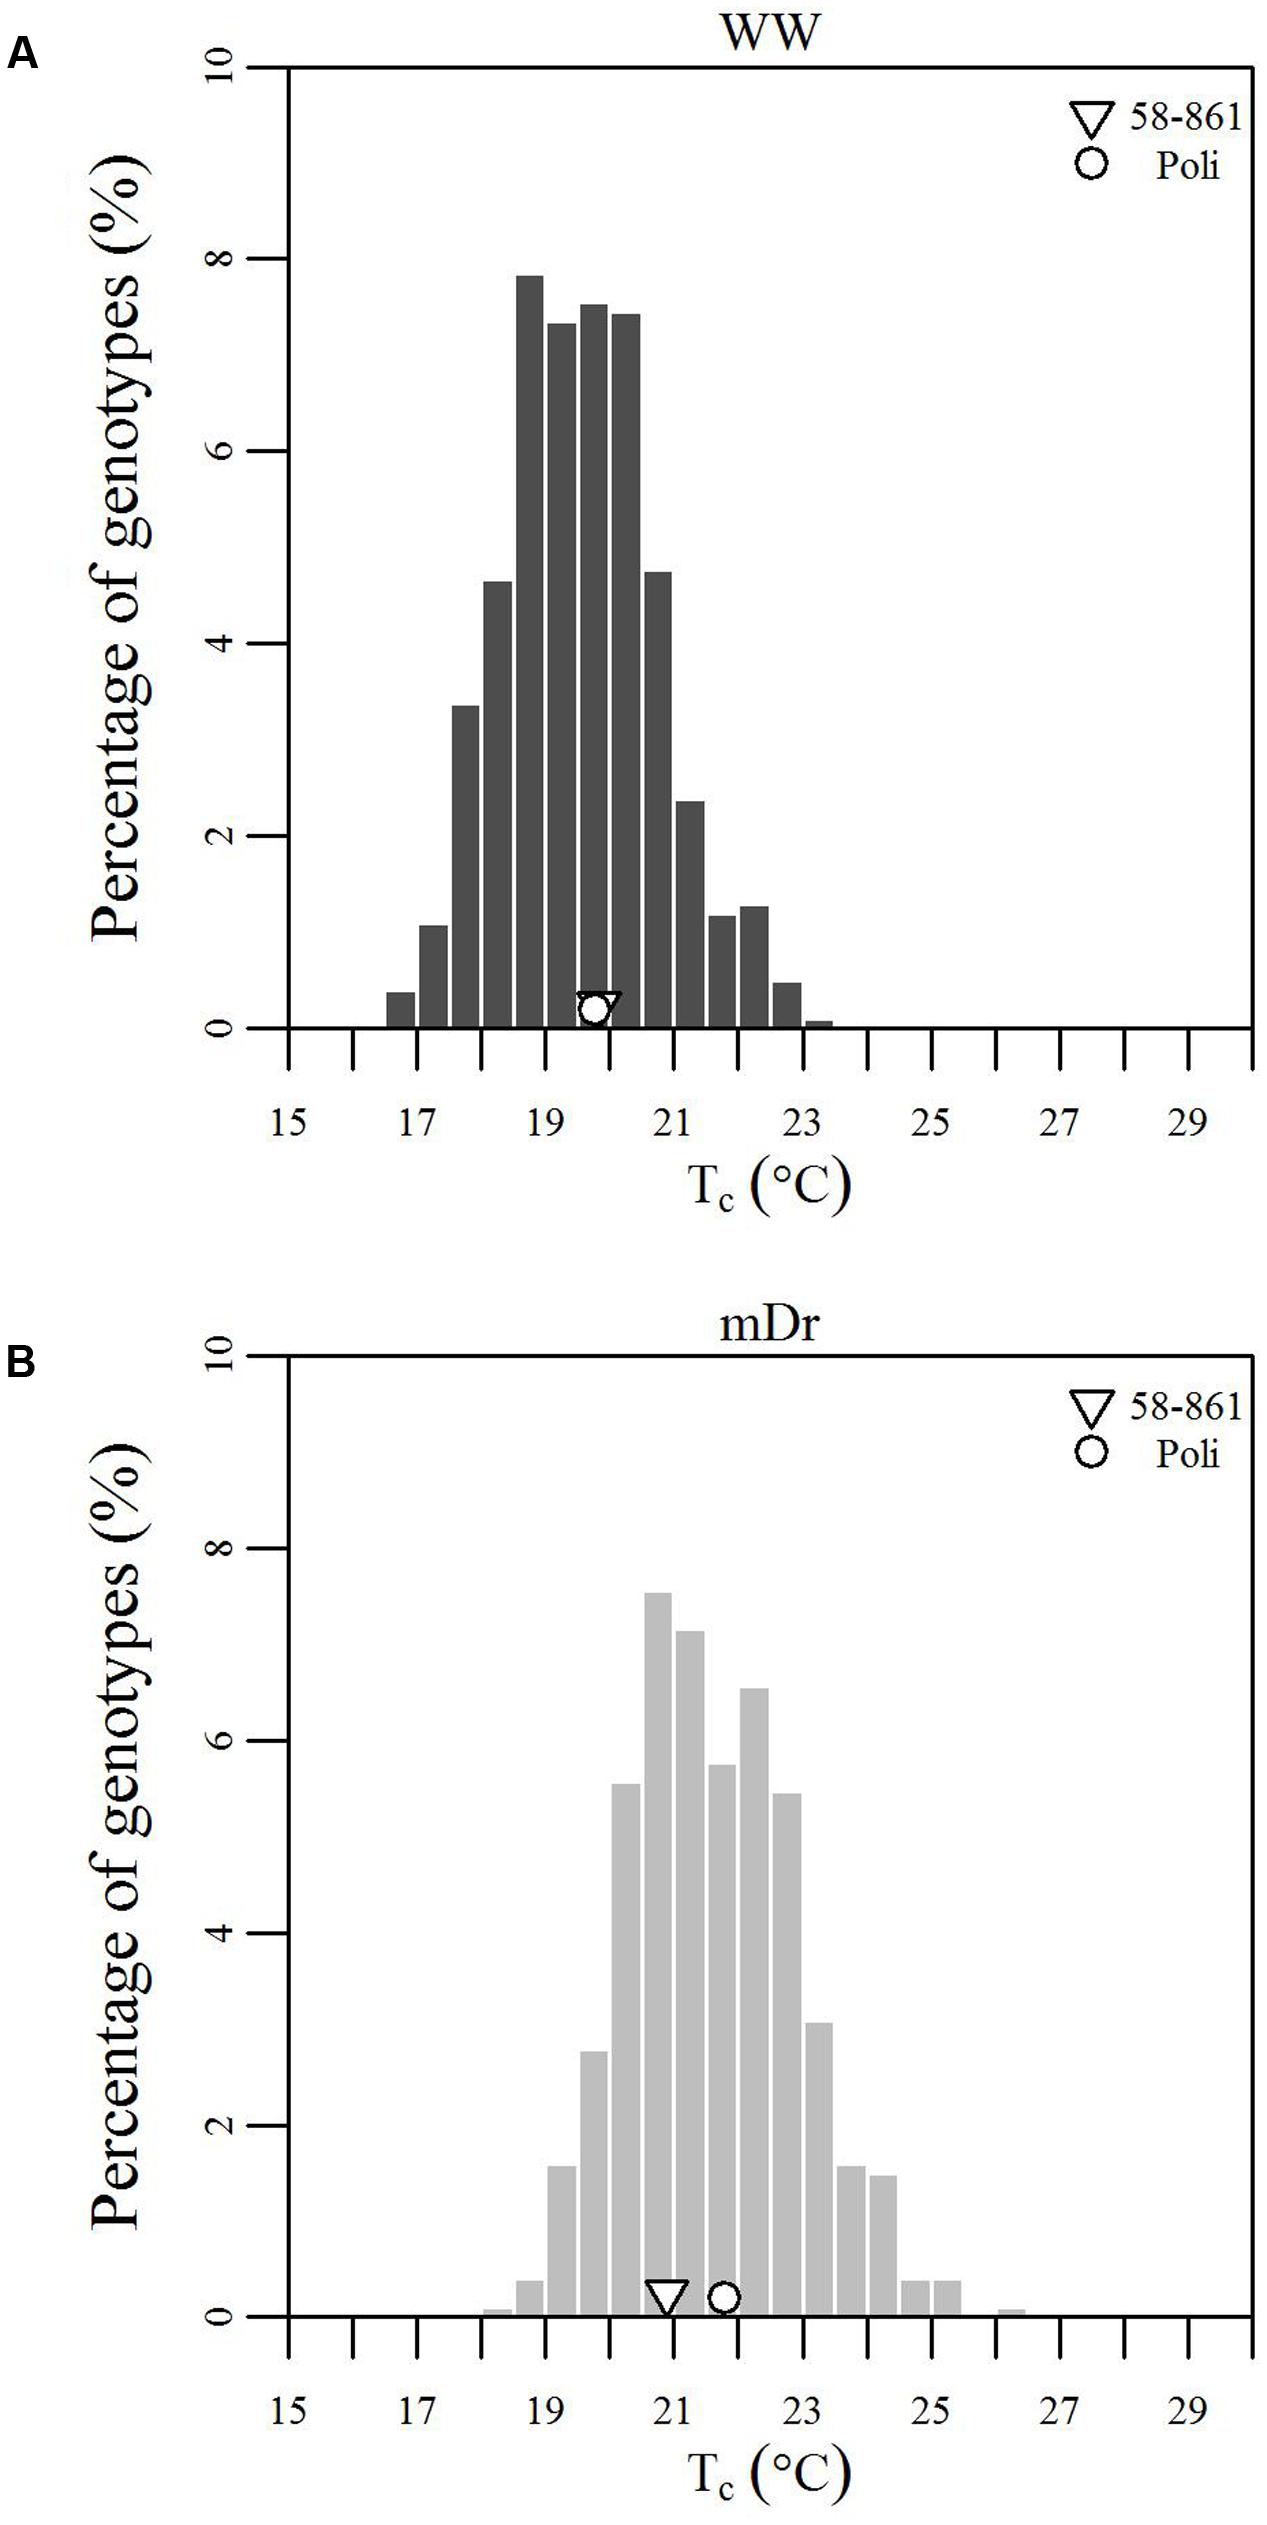
FIGURE 5. Frequency distributions of genotypic mean Tc (°C). (A) eCognition data for WW and (B) mDr conditions. Histogram bins are 0.5°C in width. The triangle and circle indicate genotypic mean Tc for 58-861 and Poli, respectively.
TABLE 2. Frequency distribution shape parameters.
To quantitatively assess the effect of the treatments on POP6, a two-way ANOVA was used to analyze Tc differences among genotypes, between treatments, and due to G × T interaction (Table 3). Notably, differences among genotypes were not statistically significant. On the other hand, differences between treatments were statistically significant. Finally, G × T interaction was not statistically significant for both eCognition- and Matlab-based Tc.
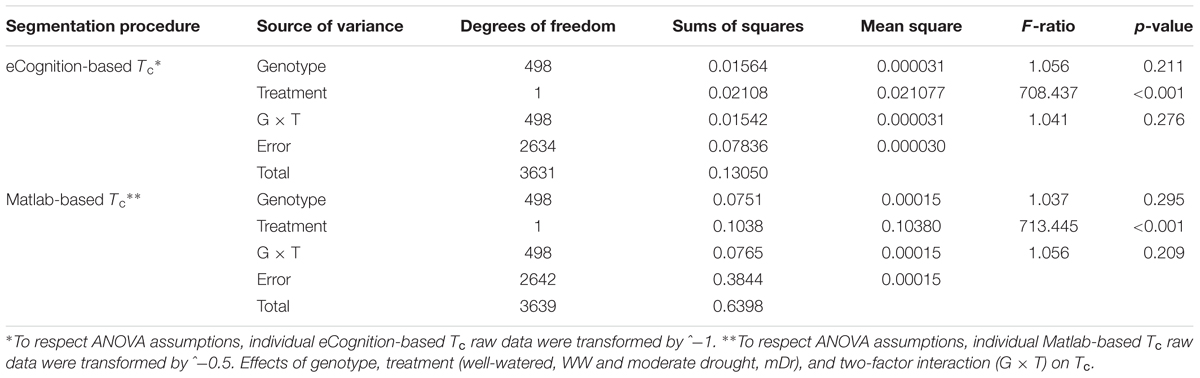
TABLE 3. Two-way ANalysis Of VAriance (ANOVA) on eCognition and Matlab-based Tc (°C) in POP6.
To address the relationship between genetic and environmental sources of variance, H2 of the Tc was estimated. Within treatment analysis resulted in very low H2 for both eCognition (WW: 0.09, mDr: <0.01) and Matlab-based Tc (WW: 0.10, mDr: <0.01). Similarly, very low H2 (0.015 in eCognition and <0.01 in Matlab) was observed for combined treatments.
Selection of Putative Drought-Tolerant Genotypes
Although the genotypic effect did not show a statistically significant influence on trait variance, we further analyzed Tc data to identify genotypes with improved drought tolerance. Genotype performance in response to drought is illustrated in Figure 6. Herein, the difference between single genotypic mean TcmDr and POP6 cmDr is plotted against the difference between genotypic mean TcmDr and TcWW conditions. Data show a positive correlation, where highly stressed individuals are located at the tails of the distribution and correspond to a less frequent behavior. Genotypes are mostly evenly distributed above and below the X-axis; however, stressed conditions lead to a majority of data points lying in the first and fourth quadrants.
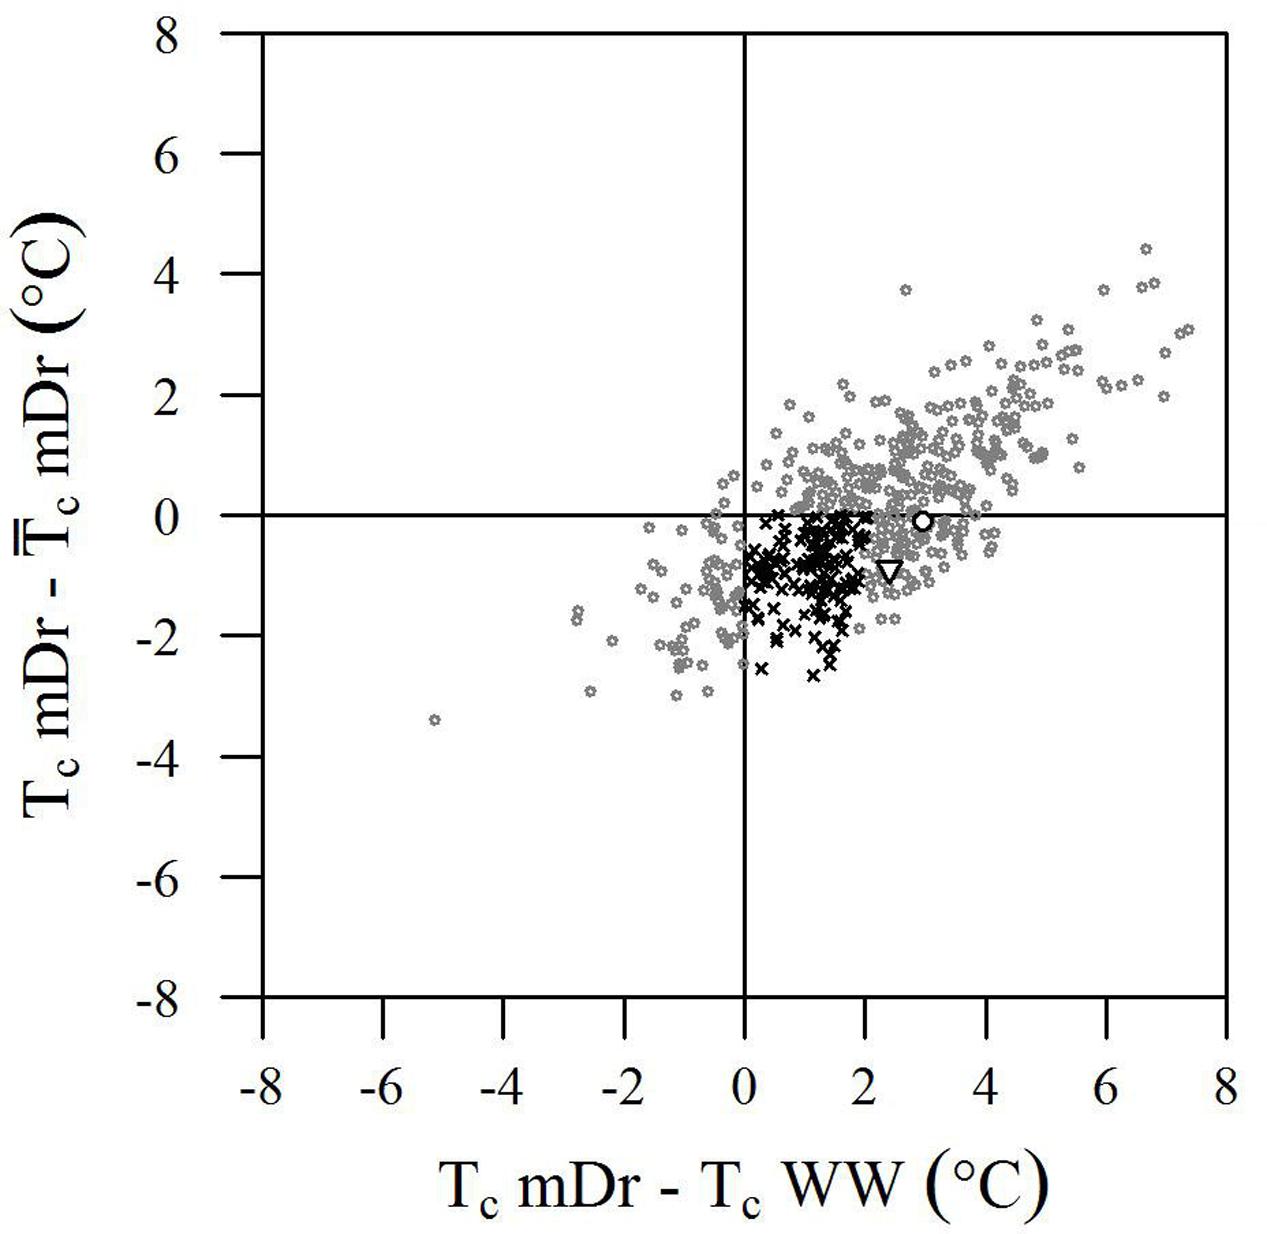
FIGURE 6. Biplot of genotype performance in response to drought stress. The difference between genotypic mean Tc (°C) and POP6 mean Tc in mDr is plotted against the difference between genotypic mean Tc in mDr and WW conditions. Genotypes are indicated with gray circles. White circles and white triangles correspond to Poli and 58-861, respectively. Black crosses indicate genotypes with (TcmDr – cmDr) less than 0 (genotypes are less stressed than the average POP6 response), and whose stress susceptibility index (SSI, defined in Section “Stress Susceptibility Index”) lies between 0 and 1 (the temperature increase in mDr with respect to WW in the genotype is lower than the temperature increase observed in the population). Such genotypes suggest an improved response to drought stress as compared to the overall population behavior.
From a drought-response perspective, the fourth quadrant in the biplot in Figure 6 provides the most relevant information. Genotypes lying in the first and fourth quadrants [436 (86.68%) in eCognition and 438 (86.88%) in Matlab] present a TcmDr greater than TcWW. While genotypes in the first quadrant have a TcmDr greater than cmDr, those in the fourth quadrant show a TcmDr smaller than cmDr. A few genotypes display greater TcWW than TcmDr [data points in the second and third quadrants, 67 (13.32%) out of the total number of genotypes in eCognition and 66 (13.12%) in Matlab].
Due to mDr treatment, in genotypes found in the fourth quadrant (TcmDr > TcWW and TcmDr < cmDr), Tc increased less than POP6 cmDr. This suggested the onset of acclimation mechanisms and, therefore, an improved response to drought stress with respect to the overall population. Among such drought-tolerant genotypes, 25% of the total number of tested ones (25.65% in eCognition and 25.79% in Matlab) presented an SSI ranging from 0 to 1, that is, the relative increase in Tc from WW to mDr conditions was lower than the increase observed on average in the population. Genotypes 58-861 and Poli were also located in the fourth quadrant; however, none of them had an SSI comprised between 0 and 1.
Discussion
In this study, we developed a UAV-based HTFP approach to investigate the response of P. nigra to mDr conditions in the field. We assessed the effects of two water treatments on the observed phenotypic variance of an F2 partially inbred population of 503 genotypes. Notably, we remotely captured high resolution images, whereby image pixels were several orders of magnitude smaller than a single tree crown, and smaller than POP6 average leaf area. Such a resolution could be essential to uncover physiological differences within single crowns. A large leaf-to-leaf variability has been observed for gs and leaf temperature in wheat (Triticum aestivum), which has led to low values of H2 when estimated on a single-leaf basis (Rebetzke et al., 2001, 2013). Gonzalez-Dugo et al. (2012) detected in mildly stressed almond (Prunus dulcis) that few areas within the crown had substantial stomatal closure while, in the rest of the crown, the stomata were still open and this increased heterogeneity of the Tc. It has also been proposed that in cotton (Gossypium sp.) the variability of leaf temperature may provide important information about the degree of stomatal closure (Fuchs, 1990). In apple trees (Malus pumila) grown under drought conditions, the spatial variability of leaf temperature and gs was higher for the whole crown than for the top crown (Ngao et al., 2017). By contrast, our UAV-based thermal imaging provides an ideal approach for the collection of the large number of individual leaf temperatures, which are necessary for methods based on temperature frequency distributions simultaneously in one image, rather than point-wise approaches for investigating tree response to drought. We also expect gs to be consistently homogeneous in the upper canopy, that is, where gs measurements were conducted herein.
High image resolution enabled the extraction of biologically meaningful data; in fact, plant leaves were attributed several image pixels, thus allowing accurate estimations of Tc. Such a rapid and non-invasive UAV-based procedure is expected to highly benefit phenotypic-based assisted-mass selection in early generation screening in breeding programs for bioenergy purposes. UAVs could, indeed, be adopted to capture high resolution images over sparsely vegetated environments, such as orchards (Sepulcre-Canto et al., 2006; Sepulcre-Canto et al., 2007), or over very extended areas, such as natural forests (Torresan et al., 2016). While UAV-based phenotyping approaches have been already tested in agriculture, screening high dimensionality populations is a remarkable bottleneck in forestry applications and this is the first time that these measures have been applied to forest species.
Image processing at high speeds is a central challenge in the field of HTFP. Thermal imaging also allows leaves to be distinguished from the background. If done manually, however, the necessary image processing can be rather labor-intensive and may also be dependent on subjective image interpretation. Our images also identified thousands of tree canopies against background soil and weed through two independent semi-automated segmentation procedures. Segmentation was utilized to reduce the mixed-pixel problem by extracting contours of areas at consistent temperatures. Then, areas relative to trees were identified based on visual inspection of orthomosaics and retained for data processing. Alternative approaches, which are based on manually drawing tree canopies (Virlet et al., 2014), would be extremely time-consuming and may lead to user-biased results. In this study, we developed and standardized a semi-automated image-based analysis procedure and directly applied it on thermal orthomosaics. Without relying on RGB images, we evaluated the sensitivity of the method to image segmentation by experimenting with two independent algorithms. Remarkably, both segmentations led to statistically similar tree responses to drought, thus supporting the robustness of the methodology.
The level of stress induced by the treatment was fully captured through thermal images. This was indicated by the inverse linear relationship between gs and Tc. An increase in the difference of Tc with respect to Ta corresponded to a decrease in transpiration flux and, therefore, to a decrease in the ratio of actual to potential transpiration (Farooq et al., 2009; Virlet et al., 2014). Similar linear regressions with slightly higher R2 have also been observed for orange (Citrus sinensis) (R2 = 0.70–0.78) (Zarco-Tejada et al., 2012; Ballester et al., 2013a), persimmon (Diospyros kaki) (R2 = 0.46) (Ballester et al., 2013b), and almond (Prunus dulcis) (R2 = 0.59–0.66) (Gonzalez-Dugo et al., 2012), using UAV, small airplanes, and ground screening techniques. However, comparable results for forest tree species through UAV-based phenomics are still undocumented.
As already pointed out in a previous greenhouse study on early effects of drought on P. nigra, Poli tended to quickly respond to stress by closing stomata due to the fact that Poli is adapted to dry/hot climatic conditions. However, 58-861 reacted more slowly to drought as it is considered better adapted to cool and moist climates (Cocozza et al., 2010). This behavior could be explained by proved geographical and environmental gradients of gs, with higher gs values observed in northern proveniences of Populus sp. (McKown et al., 2013; Kaluthota et al., 2015). This motivates lower Tc values for 58-861 than Poli as observed in Figure 5B.
Due to drought stress, POP6 Tc increased and tended to the temperature of the environment as similarly seen in Mahan and Upchurch (1988). During the UAV flights, Ta was equal to 28.75°C; in WW conditions, the average difference between Tc and Ta was equal to -9.19°C. Similar differences (from 10 to 15°C) between air and leaf temperatures have already been demonstrated to be plausible (Jackson et al., 1981). As expected, such a difference decreased to -7.14°C in case of mDr conditions, when transpiration flux was reduced. These findings are consistent with previous drought studies (Zarco-Tejada et al., 2012; Ballester et al., 2013a,b). Also, in agreement with Ballester et al. (2013a,b), and Costa et al. (2013), the treatment resulted in a difference of 2°C between WW and mDr POP6 average Tc. Figures 5A,B demonstrated that drought induced high phenotypic variability (large ranges of variation in frequency distributions). In fact, genotypic mean Tc followed a Gaussian distribution with a high degree of transgressive segregation in both treatments (thermal response of POP6 was extreme as compared to parental response). The high variability in F2 populations may be due to the transgressive segregation as was previously observed by Wu and Stettler (1994) and Rae et al. (2009) for growth-related traits in similar populations. This suggests that thermal response to drought is a quantitative trait controlled by several genes (polygenic trait) (White et al., 2007), and that Tc is under complex but repeatable genetic control (Rebetzke et al., 2013). In our study, the lack of statistically significant G × T interaction suggests that POP6 response is consistent between both treatments (i.e., stressed genotypes increase their Tc, and genotypes with higher TcWW with respect to other genotypes also display higher TcmDr). Such consistency may facilitate the selection of genotypes of interest.
Poplar Tc response to water stress was further explored by investigating H2. A very low H2 was observed for POP6, due to a large residual error and a modest genetic influence on the phenotypic variance. Generally, H2 of a trait varies across different populations and environments (Griffiths et al., 2000), and it is overestimated when G × T interaction is significant (White et al., 2007). To the best of our knowledge, H2 estimation of Tc in forest tree species is still not reported. Yet, it was observed in the range from 0.05 to 0.91 in T. aestivum, with higher values of H2 obtained for multi-year and multi-environment trials (Rebetzke et al., 2013). Such a large variation supports the urge to conduct experiments in different environments and water limitation conditions. Moreover, it is noted that recurrent selection is optimal for improving traits with low H2 (Hopkins et al., 2009). Therefore, recurrent selection of the herein identified putative drought-tolerant genotypes would be a promising approach to accumulate favorable alleles in future crosses of POP6.
In addition, our technique aids in identifying genotypes that appear to be risk-takers versus those that are risk-averse; such an observation is known to occur in response to drought (Sade et al., 2012; Moshelion et al., 2014; Attia et al., 2015). In our experiment, Poli exhibits a risk-averse strategy by limiting transpiration and allowing Tc to increase, as opposed to 58-861, which appears to be a risk-taker genotype. In fact, Poli considerably increases its Tc from WW to mDr conditions. This response supports the fact that Poli could have a sensing mechanism that detects reduced water availability, and thereby closes stomata to avoid stress due to drought. Closed stomata at high light intensities could lead to photo-damage, and thus drought stress may become photo-oxidative stress, ultimately leading to biomass yield loss. In 58-861, a lower Tc increment (1.05°C in eCognition and 1.12°C in Matlab) than Poli was observed between treatments. This suggests that 58-861 could employ a less conservative strategy, and thus, being a putative risk-taker, which developed an anisohydric survival strategy to drought. This adaptive choice may be beneficial in moderate stress conditions; however, it may not provide any advantages in case of prolonged and more intense drought conditions. The likelihood of anisohydric genotypes to succumb earlier to drought would increase, and that of isohydric genotypes to more likely die of carbon starvation is a function of drought intensity and duration.
Our findings show that, among trees exposed to mDr conditions, 63 (13.32%) out of 503 genotypes were found in the third quadrant in Figure 6, thus indicating greater TcWW than TcmDr. This behavior may be attributed to lower-density canopies (with short and sparse branches and with a small canopy surface area covered with leaves) in WW than in mDr. Conversely, 129 genotypes (25%) were located in the fourth quadrant and displayed an SSI comprised between 0 and 1. Even though gs measurements are required to validate this response, these POP6 genotypes could be considered more risk-takers, which supposedly maintain high gs and lower Tc. However, whether or not these risk-taker genotypes could be considered drought tolerant would depend on the period and severity of drought, and on the rate at which plants recover from drought exposure (Sade et al., 2012). For example, in Alvarez et al. (2007), anisohydric purple lovegrass (Eragrostis spectabilis) maintained higher gs and CO2 assimilation, and showed better performance than isohydric miscanthus (Miscanthus sinensis) plants under optimal and mild-to-moderate drought conditions, but little difference was noted when both plants were subjected to severe drought. A greater research effort is currently needed to better understand the physiological mechanisms involved when plants tend to be risk-takers in stressed and risk-averse in non-stressed conditions.
Even if genotypic effect was not statistically significant, risk-taking genotypes accounting for 25% of the tested ones support that crossing genotypes with divergent morphological and ecological traits, such as 58-861 and Poli, resulted in augmented phenotypic variability (see also the large ranges of variation in Figure 5) in the early F2 POP6 generation. Higher-order crossings with differential breeding techniques based on selection are expected to lead to higher H2 and improved genetic gains. Promising genotypes were capable of controlling stomatal closure to raise their Tc by less than 2°C with respect to non-stressed conditions (SSI ranging from 0 to 1). Interestingly, in Rizhsky et al. (2002, 2004), upon similar drought conditions, leaf temperature increased by 2–5°C. This supports our finding that trees whose Tc increases by less than 2°C showed a better response within POP6.
The extensive HTP executed in this study was done in drought trials under natural field conditions. The results of this study prove that this methodology enabled high-throughput data analysis in the field upon fast and non-invasive acquisition of thermal images. Notably, this approach allowed efficient and precise phenotyping of large population of individuals at the same time, thus minimizing the influence of variable meteorological conditions on control (in this case WW) and treated (in this case mDr) trees. Image resolution was remarkably higher than in previous studies (Berni et al., 2009) and highly sufficient for accurately characterizing tree response even at crown and leaf levels. We indicate that flight elevation was also standardized to 25 m to ensure high image definition while guaranteeing that UAV rotor downwash did not disturb Tc. Finally, the degree of automation employed in the developed HTFP method is highly desirable and will be widely adopted in field-based phenomics for forest trees genetics and genomics research. Since Tc is strongly related to gs, photosynthetic rate (Way and Oren, 2010), and leaf water potential (Testi et al., 2008), UAV-based thermal sensing may be an efficient, robust, and high-throughput tool for indirectly screening breeding populations, for selecting drought-tolerant, as well as risk-takers and risk-averse genotypes. This methodology is also promising toward monitoring the dynamics of stomatal movement in response to environmental stresses through rapid and repeated surveys. Improved knowledge of stress response will also be enabled through the synergistic integration of UAV remote sensing with more direct ground-based measurements (i.e., leaf fluorescence, leaf gas exchange, leaf water potential, leaf morphology, tree sap flow, and biomass production). Coupled with ground-penetrating radar, field-based phenomics will accelerate screening for drought tolerance by multi-scale analysis of root, crown, and leaf traits. Currently, UAVs have been outfitted with multispectral, hyperspectral, thermal, RGB, and near-infrared cameras, which are useful to evaluate plant response to stress (Costa et al., 2013; Shi et al., 2016). Future technological ameliorations will afford unprecedented measurements such as chlorophyll fluorescence imaging and 3D mapping using light detection and ranging (LIDAR) sensors, directly from drones, thus opening novel avenues in high-throughput stress phenotyping in forest trees. Promising examples of this vision can also include UAV integrated platforms equipped with multiple sensors for simultaneous data collection.
In breeding programs, this new aerial screening method may sensibly alleviate the effect of environmental factors such as varying exposure to sunlight according to time of the day, local climatic conditions, background radiation due to soil vegetative cover and soil water content, being precise, automated and quick. In fact, utilizing highly sensitive radiometrically calibrated TIR cameras may speed up tree screening, thus enabling repeated observations over longer periods of time and larger scale areas. Furthermore, augmenting breeders’ visual definition by selecting low flight altitudes may provide novel insights on the response to drought stress at the single leaf scale.
Conclusion
In this study, we developed a high-resolution and high-throughput UAV-based phenomics method to investigate drought in the field. We applied this screening method to precisely and efficiently assess the response to drought of a P. nigra F2 population consisting of 503 genotypes planted on an area of 1.67 ha. We captured thermal images of stressed and non-stressed trees from an elevation of 25 m. We reconstructed thermal mosaics and extracted the average Tc by using two independent image segmentation techniques. We statistically analyzed genotypic temperatures, and identified putative drought-tolerant genotypes. This newly developed approach enabled high resolution thermal orthomosaics from quick UAV-based acquisitions and simultaneous screening of a significant number of individuals.
Two segmentation techniques for accurately analyzing TIR images, one developed in-house using Matlab, and another relying on commercial software eCognition, were successfully implemented to eliminate the mixed-pixel problem. They both led to consistent results, indicating that it is possible to use HTFP-based thermography for the screening of tolerance to drought stress in forest trees. However, considering the complexity of drought tolerance, we suggest it can only act as an accessory means in an active breeding program for drought by contributing significantly to phenotyping of tree response to water stress. Future studies will aim at extending the methodology to rapidly generate environmentally nuanced temporal measurements of physiological differences to contribute to predictive environmental stress response models. Through the approach developed here, candidate genes for drought stress responses can also be identified when this HTFP is combined with advanced genomics approaches.
Based on our analysis, a good correlation was found between UAV-based parental genotypic mean Tc and ground-truth gs measurements. Genotypic mean temperatures exhibited a Gaussian distribution centered about parental behavior. Furthermore, the statistically significant differences observed between treatments were attributed to environmental conditions. Finally, based on SSI values, 25% of the population exhibited increase in temperature under mDr conditions by less than 2°C, and, thus, can be regarded as candidate drought-tolerant genotypes.
The use of UAV for field-based tree phenotyping under drought conditions is novel, but is expected to become an important tool for improving efficiency in forest-tree breeding for climate change. To date, no studies have been carried out attempting to use UAV-based HTFP for forest tree phenotyping in managed stress trials in which specific and well-defined conditions are imposed, and effectively deploy such platform in a breeding program. Thanks to its high resolution aerial imagery, accurate data processing, and relatively simple implementation, this HTFP shows promise as a precise and efficient tool for use in phenomics studies.
Author Contributions
RL performed the ground-truthing, analyzed experimental data, and executed phenotypic and statistical data analyses. FT executed Matlab segmentation and, together with RL, developed results and wrote the manuscript. RS planned the airborne campaign, reconstructed thermal mosaics, and executed eCognition segmentation. SK contributed to develop the workflow and write the manuscript. GSM contributed to the original concept of the project. AH conceived the project and its components, designed and supervised the study, and revised the manuscript. All authors discussed the results, read and approved the manuscript.
Funding
This research was partially supported by the Regione Lazio/Lazio Innova under the grant “AgroEnVision -Unmanned Aerial Vehicles as Mobile Multi-Sensor Platforms for Innovative and Sustainable Management of Agro-Environmental Ecosystems” (FILAS-RU-2014-1191), grants from the European Community’s Seventh Framework Program (WATBIO FP7-311929) and the Brain Gain Program (Rientro dei cervelli) of the Italian Ministry of Education, University, and Research (AH).
Conflict of Interest Statement
The authors declare that the research was conducted in the absence of any commercial or financial relationships that could be construed as a potential conflict of interest.
Acknowledgments
We wish to thank Vincenzo Mantovano for providing the UAV remote sensing platform. We are very grateful to Francesco Fabbrini for his help in developing the experimental design, to Paolo Latini and Chiara Evangelistella for their assistance during the airborne campaign and for collecting ground-truth data, and to Maurizio Sabatti for providing plant material. All authors thank Alasia Franco Vivai for plantation management and field maintenance.
Supplementary Material
The Supplementary Material for this article can be found online at: http://journal.frontiersin.org/article/10.3389/fpls.2017.01681/full#supplementary-material
Footnotes
References
Allen, R. G., Pereira, L. S., Raes, D., and Smith, M. (1998). Crop Evapotranspiration: Guidelines for Computing Crop Water Requirements. FAO Irrigation and Drainage Paper No. 56. Rome: FAO.
Alvarez, E., Scheiber, S. M., Beeson, R. C. Jr., and Sandrock, D. R. (2007). Drought tolerance responses of purple Lovegrass and ‘Adagio’ maiden grass. HortScience 42, 1695–1699.
Amichev, B. Y., Johnston, M., and Van Rees, K. C. N. (2010). Hybrid poplar growth in bioenergy production systems: biomass prediction with a simple process-based model (3PG). Biomass Bioenerg. 34, 687–702. doi: 10.1016/j.biombioe.2010.01.012
Araus, J. L., and Cairns, J. E. (2014). Field high-throughput phenotyping: the new crop breeding frontier. Trends Plant Sci. 19, 52–61. doi: 10.1016/j.tplants.2013.09.008
Attia, Z., Domec, J.-C., Oren, R., Way, D. A., and Moshelion, M. (2015). Growth and physiological responses of isohydric and anisohydric poplars to drought. J. Exp. Bot. 66, 4373–4381. doi: 10.1093/jxb/erv195
Ballester, C., Castel, J., Jiménez-Bello, M. A., Castel, J. R., and Intrigliolo, D. S. (2013a). Thermographic measurement of canopy temperature is a useful tool for predicting water deficit effects on fruit weight in citrus trees. Agric. Water Manage. 122, 1–6. doi: 10.1016/j.agwat.2013.02.005
Ballester, C., Jiménez-Bello, M. A., Castel, J. R., and Intrigliolo, D. S. (2013b). Usefulness of thermography for plant water stress detection in citrus and persimmon trees. Agric. For. Meteorol. 168, 120–129. doi: 10.1016/j.agrformet.2012.08.005
Benetka, V., Novotná, K., and Štochlová, P. (2012). Wild populations as a source of germplasm for black poplar (Populus nigra L.) breeding programmes. Tree Genet. Genomes 8, 1073–1084. doi: 10.1007/s11295-012-0487-6
Berni, J. A. J., Zarco-Tejada, P. J., Suárez, L., and Fereres, E. (2009). Thermal and narrowband multispectral remote sensing for vegetation monitoring from an unmanned aerial vehicle. IEEE Trans. Geosci. Remote Sens. 47, 722–738. doi: 10.1109/TGRS.2008.2010457
Box, G. E. P., and Cox, D. R. (1964). An analysis of transformations. J. Roy. Stat. Soc. B 26, 211–252.
Bréda, N., and Badeau, V. (2008). Forest tree responses to extreme drought and some biotic events: towards a selection according to hazard tolerance? C. R. Geosci. 340, 651–662. doi: 10.1016/j.crte.2008.08.003
Bréda, N., Huc, R., Granier, A., and Dreyer, E. (2006). Temperate forest trees and stands under severe drought: a review of ecophysiological responses, adaptation processes and long-term consequences. Ann. For. Sci. 63, 625–644. doi: 10.1051/forest:2006042
Cairns, J. E., Impa, S. M., O’Toole, J. C., Jagadish, S. V. K., and Price, A. H. (2011). Influence of the soil physical environment on rice (Oryza sativa L.) response to drought stress and its implications for drought research. Field Crop Res. 121, 303–310. doi: 10.1016/j.fcr.2011.01.012
Cantero-Martínez, C., Angás, P., and Lampurlanés, J. (2007). Long-term yield and water use efficiency under various tillage systems in Mediterranean rainfed conditions. Ann. Appl. Biol. 150, 293–305. doi: 10.1111/j.1744-7348.2007.00142.x
Chamaillard, S., Fichot, R., Vincent-Barbaroux, C., Bastien, C., Depierreux, C., Dreyer, E., et al. (2011). Variations in bulk leaf carbon isotope discrimination, growth and related leaf traits among three Populus nigra L. populations. Tree Physiol. 31, 1076–1087. doi: 10.1093/treephys/tpr089
Chaves, M. M., Maroco, J. P., and Pereira, J. S. (2003). Understanding plant responses to drought – from genes to the whole plant. Funct. Plant Biol. 30, 239–264. doi: 10.1071/FP02076
Chéné, Y., Rousseau, D., Lucidarme, P., Bertheloot, J., Caffier, V., Morel, P., et al. (2012). On the use of depth camera for 3D phenotyping of entire plants. Comput. Electron. Agric. 82, 122–127. doi: 10.1016/j.compag.2011.12.007
Cocozza, C., Cherubini, P., Regier, N., Saurer, M., Frey, B., and Tognetti, R. (2010). Early effects of water deficit on two parental clones of Populus nigra grown under different environmental conditions. Funct. Plant Biol. 37, 244–254. doi: 10.1071/FP09156
Costa, J. M., Grant, O. M., and Chaves, M. M. (2013). Thermography to explore plant–environment interactions. J. Exp. Bot. 64, 3937–3949. doi: 10.1093/jxb/ert029
Deery, D., Berni, J. A. J., Jones, H., Sirault, X., and Furbank, R. (2014). Proximal remote sensing buggies and potential applications for field-based phenotyping. Agronomy 5, 349–379. doi: 10.3390/agronomy4030349
Deery, D. M., Rebetzke, G. J., Berni, J. A. J., James, R. A., Condon, A. G., Bovill, W. D., et al. (2016). Methodology for high-throughput field phenotyping of canopy temperature using airborne thermography. Front. Plant Sci. 7:1808. doi: 10.3389/fpls.2016.01808
DeWoody, J. D., Trewin, H. T., and Taylor, G. T. (2015). Genetic and morphological differentiation in Populus nigra L.: isolation by colonization or isolation by adaptation? Mol. Ecol. 24, 2641–2655. doi: 10.1111/mec.13192
Dhondt, S., Wuyts, N., and Inzé, D. (2013). Cell to whole-plant phenotyping: the best is yet to come. Trends Plant Sci. 18, 428–439. doi: 10.1016/j.tplants.2013.04.008
Díaz-Varela, R. A., de la Rosa, R., León, L., and Zarco-Tejada, P. J. (2015). High-resolution airborne UAV imagery to assess olive tree crown parameters using 3D photo reconstruction: application in breeding trials. Remote Sens. 7, 4213–4232. doi: 10.3390/rs70404213
Dillen, S. Y., Marron, N., Sabatti, M., Ceulemans, R., and Bastien, C. (2009). Relationships among productivity determinants in two hybrid poplar families grown during three years at two contrasting sites. Tree Physiol. 29, 975–987. doi: 10.1093/treephys/tpp036
Djomo, S. N., Ac, A., Zenone, T., De Groote, T., Bergante, S., Facciotto, G., et al. (2015). Energy performances of intensive and extensive short rotation cropping systems for woody biomass production in the EU. Renew. Sustain. Energy Rev. 41, 845–854. doi: 10.1016/j.rser.2014.08.058
Edrisi, S. A., and Abhilash, P. C. (2016). Exploring marginal and degraded lands for biomass and bioenergy production: an Indian scenario. Renew. Sustain. Energy Rev. 54, 1537–1551. doi: 10.1016/j.rser.2015.10.050
Fahlgren, N., Feldman, M., Gehan, M. A., Wilson, M. S., Shyu, C., Bryant, D. W., et al. (2015a). A versatile phenotyping system and analytics platform reveals diverse temporal responses to water availability in Setaria. Mol. Plant 8, k1520–1535. doi: 10.1016/j.molp.2015.06.005
Fahlgren, N., Gehan, M. A., and Baxter, I. (2015b). Lights, camera, action: high-throughput plant phenotyping is ready for a close-up. Curr. Opin. Plant Biol. 24, 93–99. doi: 10.1016/j.pbi.2015.02.006
FAO (2016). “Poplars and other fast-growing trees - Renewable resources for future green economies - Synthesis of country progress reports,” in 25th Session of the International Poplar Commission, 13-16 September 2016, Berlin.
Farooq, M., Wahid, A., Kobayashi, N., Fujita, D., and Basra, S. M. A. (2009). Plant drought stress: effects, mechanisms and management. Agron. Sustain. Dev. 29, 185–212. doi: 10.1051/agro:2008021
Fischer, R., and Maurer, R. (1978). Drought resistance in spring wheat cultivars. I. Grain yield responses. Crop Pasture Sci. 29, 897–912. doi: 10.1071/AR9780897
Fuchs, M. (1990). Infrared measurement of canopy temperature and detection of plant water stress. Theor. Appl. Climatol. 42, 253–261. doi: 10.1007/BF00865986
Gago, J., Douthe, C., Coopman, R. E., Gallego, P. P., Ribas-Carbo, M., Flexas, J., et al. (2015). UAVs challenge to assess water stress for sustainable agriculture. Agric. Water Manage. 153, 9–19. doi: 10.1016/j.agwat.2015.01.020
Ghanem, M. E., Marrou, H., and Sinclair, T. R. (2015). Physiological phenotyping of plants for crop improvement. Trends Plant Sci. 20, 139–144. doi: 10.1016/j.tplants.2014.11.006
Goggin, F. L., Lorence, A., and Topp, C. N. (2015). Applying high-throughput phenotyping to plant-insect interactions: picturing more resistant crops. Curr. Opin. Insect. Sci. 9, 69–76. doi: 10.1016/j.cois.2015.03.002
Gómez-Candón, D., Virlet, N., Labbé, S., Jolivot, A., and Regnard, J.-L. (2016). Field phenotyping of water stress at tree scale by UAV-sensed imagery: new insights for thermal acquisition and calibration. Precis. Agric. 17, 786–800. doi: 10.1007/s11119-016-9449-6
Gonzalez-Dugo, V., Zarco-Tejada, P., Berni, J. A. J., Suárez, L., Goldhamer, D., and Fereres, E. (2012). Almond tree canopy temperature reveals intra-crown variability that is water stress-dependent. Agric. For. Meteorol. 15, 156–165. doi: 10.1016/j.agrformet.2011.11.004
Griffiths, A. J. F., Miller, J. H., Suzuki, D. T., Lewontin, R. C., and Gelbart, W. M. (eds). (2000). “Quantifying heritability,” in An Introduction to Genetic Analysis, 7th Edn (New York, NY: W. H. Freeman).
Guidi, W., Piccioni, E., and Bonari, E. (2008). Evapotranspiration and crop coefficient of poplar and willow short-rotation coppice used as vegetation filter. Bioresour. Technol. 99, 4832–4840. doi: 10.1016/j.biortech.2007.09.055
Harfouche, A., Meilan, R., and Altman, A. (2014). Molecular and physiological responses to abiotic stress in forest trees and their relevance to tree improvement. Tree Physiol. 34, 1181–1198. doi: 10.1093/treephys/tpu012
Harfouche, A., Meilan, R., Kirst, M., Morgante, M., Boerjan, W., Sabatti, M., et al. (2012). Accelerating the domestication of forest trees in a changing world. Trends Plant Sci. 17, 64–72. doi: 10.1016/j.tplants.2011.11.005
Herr, J. R., and Carlson, J. E. (2013). “Traditional breeding, Genomics-assisted breeding, and biotechnology modification of forest trees and short rotation woody crops,” in Wood-Based Energy in the Northern Forests, eds M. Jacobson and D. Ciolkosz (New York, NY: Springer Science + Business Media),k69–89.
Hopkins, A. A., Saha, M. C., and Wang, Z. Y. (2009). “Breeding, genetics, and cultivars,” in Tall Fescue for the Twenty-first Century. Agronomy Monographs, eds H. A. Fribourg, D. B. Hannaway, and C. P. West (Madison, WI: American Society of Agronomy), 339–366.
Huang, X., Xiao, X., Zhang, S., Korpelainen, H., and Li, C. (2009). Leaf morphological and physiological responses to drought and shade in two Populus cathayana populations. Biol. Plant. 53, 588–592. doi: 10.1007/s10535-009-0107-y
IPCC (2014). “Climate change 2014: synthesis report. contribution of working groups I, II and III to the fifth assessment report of the intergovernmental panel on climate change,” in Core Writing Team, eds R. K. Pachauri and L. A. Meyer (Geneva: IPCC), 151.
Izawa, T. (2015). Deciphering and prediction of plant dynamics under field conditions. Curr. Opin. Plant Biol. 24, 87–92. doi: 10.1016/j.pbi.2015.02.003
Jackson, R. D., Idso, S. B., Reginato, R. J., and Pinter, P. J. Jr. (1981). Canopy temperature as a crop water stress indicator. Water Resour. Res. 17, 1133–1138. doi: 10.1029/WR017i004p01133
Jiménez-Bello, M. A., Ballester, C., Caste, J. R., and Intrigliolo, D. S. (2011). Development and validation of an automatic thermal imaging process for assessing plant water status. Agric. Water Manage. 98, 1497–1504. doi: 10.1016/j.agwat.2011.05.002
Jones, H. G. (1999). Use of thermography for quantitative studies of spatial and temporal variation of stomatal conductance over leaf surfaces. Plant Cell Environ. 22, 1043–1055. doi: 10.1046/j.1365-3040.1999.00468.x
Jones, H. G., Serraj, R., Loveys, B. R., Xiong, L., Wheaton, A., and Price, A. H. (2009). Thermal infrared imaging of crop canopies for the remote diagnosis and quantification of plant responses to water stress in the field. Funct. Plant Biol. 36, 978–989. doi: 10.1071/FP09123
Jones, H. G., and Sirault, X. R. R. (2014). Scaling of thermal images at different spatial resolution: the mixed pixel problem. Agronomy 4, 380–396. doi: 10.3390/agronomy4030380
Kaluthota, S., Pearce, D. W., Evans, L. M., Letts, M. G., Whitham, T. G., and Rood, S. B. (2015). Higher photosynthetic capacity from higher latitude: foliar characteristics and gas exchange of southern, central and northern populations of Populus angustifolia. Tree Physiol. 35, 936–948. doi: 10.1093/treephys/tpv069
Kottek, M., Grieser, J., Beck, C., Rudolf, B., and Rubel, F. (2006). World map of the Köppen-Geiger climate classification updated. Meteorol. Z. 15, 259–263. doi: 10.1127/0941-2948/2006/0130
Levitt, J. (1972). Responses of Plants to Environmental Stresses. New York, NY: Academic Press, 698.
Lindner, M., Fitzgerald, J. B., Zimmermann, N. E., Reyer, C., Delzon, S., van der Maaten, E., et al. (2014). Climate change and European forests: what do we know, what are the uncertainties, and what are the implications for forest management? J. Environ. Manage. 146, 69–83. doi: 10.1016/j.jenvman.2014.07.030
Maes, W. H., and Steppe, K. (2012). Estimating evapotranspiration and drought stress with ground-based thermal remote sensing in agriculture: a review. J. Exp. Bot. 67, 4671–4712. doi: 10.1093/jxb/ers165
Mahan, J. R., and Upchurch, D. R. (1988). Maintenance of constant leaf temperature by plant. 1. Hypothesis limited homeothermy. Environ. Exp. Bot. 28, 351–357. doi: 10.1016/0098-8472(88)90059-7
Marron, N., Delay, D., Petit, J. M., Dreyer, E., Kahlem, G., Delmotte, F. M., et al. (2002). Physiological traits of two Populus × euramericana clones, Luisa avanzo and dorskamp, during water stress and re-watering cycle. Tree Physiol. 22, 849–858. doi: 10.1093/treephys/22.12.849
McKown, A. D., Guy, R. D., Klápště, J., Geraldes, A., Friedmann, M., Cronk, Q. C. B., et al. (2013). Geographical and environmental gradients shape phenotypic trait variation and genetic structure in Populus trichocarpa. New Phytol. 201, 1263–1276. doi: 10.1111/nph.12601
Monclus, R., Dreyer, E., Villar, M., Delmotte, F. M., Delay, D., Petit, J. M., et al. (2006). Impact of drought on productivity and water use efficiency in 29 genotypes of Populus deltoids × Populus nigra. New Phytol. 169, 765–777. doi: 10.1111/j.1469-8137.2005.01630.x
Moshelion, M., Halperin, O., Wallach, R., Oren, R., and Way, D. A. (2014). Role of aquaporins in determining transpiration and photosynthesis in water-stressed plants: crop water-use efficiency, growth and yield. Plant Cell Environ. 38, 1785–1793. doi: 10.1111/pce.12410
Neale, D. B., and Kremer, A. (2011). Forest tree genomics: growing resources and applications. Nat. Rev. Genet. 12, 111–122. doi: 10.1038/nrg2931
Ngao, J., Boris, A., and Saudreau, M. (2017). Intra-crown spatial variability of leaf temperature and stomatal conductance enhanced by drought in apple tree as assessed by the RATP model. Agric. For. Meteorol. 23, 340–354. doi: 10.1016/j.agrformet.2017.02.036
Otsu, N. (1979). A threshold selection method from gray-level histograms. IEEE Trans. Syst. Man Cybern. 9, 62–66. doi: 10.1109/TSMC.1979.4310076
Passioura, J. B. (2012). Phenotyping for drought tolerance in grain crops: when is it useful to breeders? Funct. Plant Biol. 39, 851–859. doi: 10.1071/FP12079
Paulson, M., Bardos, P., Harmsen, J., Wilczek, J., Barton, M., and Edwards, D. (2003). The practical use of short rotation coppice in land restoration. Land Contam. Reclam. 11, 323–338. doi: 10.2462/09670513.624
Pintó-Marijuan, M., and Munné-Bosch, S. (2014). Photo-oxidative stress markers as a measure of abiotic stress-induced leaf senescence: advantages and limitations. J. Exp. Bot. 65, 3845–3857. doi: 10.1093/jxb/eru086
Poland, J. (2015). Breeding-assisted genomics. Curr. Opin. Plant Biol. 24, 119–124. doi: 10.1016/j.pbi.2015.02.009
Rae, A. M., Street, N. R., Robinson, K. M., Harris, N., and Taylor, G. (2009). Five QTL hotspots for yield in short rotation coppice bioenergy poplar: the poplar biomass loci. BMC Plant Biol. 9:23. doi: 10.1186/1471-2229-9-23
Rebetzke, G. J., Condon, A. G., Richards, R. A., and Read, J. J. (2001). Phenotypic variation and sampling for leaf conductance in wheat (Triticum aestivum L.) breeding populations. Euphytica 121, 335–341. doi: 10.1023/A:1012035720423
Rebetzke, G. J., Rattey, A. R., Farquhar, G. D., Richards, R. A., and Condon, A. G. (2013). Genomic regions for canopy temperature and their genetic association with stomatal conductance and grain yield in wheat. Funct. Plant Biol. 40, 14–33. doi: 10.1071/FP12184
Regier, N., Streb, S., Cocozza, C., Schaub, M., Cherubini, P., Zeeman, S. C., et al. (2009). Drought tolerance of two black poplar (Populus nigra L.) clones: contribution of carbohydrates and oxidative stress defence. Plant Cell Environ. 32, 1724–1736. doi: 10.1111/j.1365-3040.2009.02030.x
Richards, L. R., and Weaver, L. A. (1944). Moisture retention by some irrigated soils as related to soil moisture tension. J. Agric. Res. 69, 215–235.
Richardson, J., Isebrands, J. G., and Ball, J. B. (2014). “Ecology and physiology of poplars and willows,” in Poplars and Willows: Trees for Society and the Environment, eds J. G. Isebrands and J. Richardson (Rome: The Food and Agriculture Organization of United Nations and CABI), 92–123. doi: 10.1079/9781780641089.0092
Rizhsky, L., Liang, H., and Mittler, R. (2002). The combined effect of drought stress and heat shock on gene expression in tobacco. Plant Physiol. 130, 1143–1151. doi: 10.1104/pp.006858
Rizhsky, L., Liang, H., Shuman, J., Shulaev, V., Davletova, S., and Mittler, R. (2004). When defense pathways collide. The response of Arabidopsis to a combination of drought and heat stress. Plant Physiol. 134, 1683–1696. doi: 10.1104/pp.103.033431
Rockwood, D. L., Naidu, C. V., Carter, D. R., Rahmani, M., Spriggs, T. A., Lin, C., et al. (2004). Short-rotation woody crops and phytoremediation: opportunities for agroforestry? Agroforest. Syst. 61, 51–63. doi: 10.1023/B:AGFO.0000028989.72186.e6
Rohde, A., Bastien, C., and Boerjan, W. (2011). Temperature signals contribute to the timing of photoperiodic growth cessation and bud set in poplar. Tree Physiol. 31, 472–482. doi: 10.1093/treephys/tpr038
Sabatti, M., Fabbrini, F., Harfouche, A., Beritognolo, I., Mareschi, L., Carlini, M., et al. (2014). Evaluation of biomass production potential and heating value of hybrid poplar genotypes in a short-rotation culture in Italy. Ind. Crop Prod. 61, 62–73. doi: 10.1016/j.indcrop.2014.06.043
Sade, N., Gebremedhin, A., and Moshelion, M. (2012). Risk-taking plants. Anisohydric behavior as a stress-resistance trait. Plant Signal. Behav. 7, 767–770. doi: 10.4161/psb.20505
Sade, N., and Moshelion, M. (2014). The dynamic isohydric-anisohydric behavior of plants upon fruit development: taking a risk for the next generation. Tree Physiol. 34, 1199–1202. doi: 10.1093/treephys/tpu070
Sánchez, E., Scordia, D., Lino, G., Aries, A., Cosentino, S. L., and Nogués, S. (2015). Salinity and water stress effects on biomass production in different Arundo donax L. clones. Bioenerg. Res. 8, 1461–1479. doi: 10.1007/s12155-015-9652-8
Sannigrahi, P., Ragauskas, A. J., and Tuskan, G. (2010). Poplar as a feedstock for biofuels: a review of compositional characteristics. Biofuels Bioprod. Bioref. 4, 209–226. doi: 10.1002/bbb.206
Sehgal, D., Skot, L., Singh, R., Srivastava, R. K., Das, S. P., Taunk, J., et al. (2015). Exploring potential of pearl millet germplasm association panel for association mapping of drought tolerance traits. PLOS ONE 10:e0122165. doi: 10.1371/journal.pone.0122165
Sepulcre-Canto, G., Zarco-Tejada, P., Jimenez-Munoz, J., Sobrino, J., de Miguel, E., and Villalobos, F. J. (2006). Detection of water stress in an olive orchard with thermal remote sensing imagery. Agric. For. Meteorol. 136, 31–44. doi: 10.1016/j.agrformet.2006.01.008
Sepulcre-Canto, G., Zarco-Tejada, P., Jimenez-Munoz, J., Sobrino, J., Soriano, M., Fereres, E., et al. (2007). Monitoring yield and fruit quality parameters in open-canopy tree crops under water stress. Implications for ASTER. Remote Sens. Environ. 107, 455–470. doi: 10.1016/j.rse.2006.09.014
Shi, Y., Thomasson, J. A., Murray, S. C., Pugh, N. A., Rooney, W. L., Shafian, S., et al. (2016). Unmanned aerial vehicles for high-throughput phenotyping and agronomic research. PLOS ONE 11:e0159781. doi: 10.1371/journal.pone.0159781
Sims, R. E. H., and Venturi, P. (2004). All-year round harvesting of short rotation coppice Eucalyptus compared with the delivered costs of biomass from more conventional short season, harvesting systems. Biomass Bioenerg. 26, 27–37. doi: 10.1016/S0961-9534(03)00081-3
Stanton, B. J., Neale, D. B., and Li, S. (2010). “Populus breeding: from the classical to the genomic approach,” in Genetics and Genomics of Populus (Plant Genetics and Genomics: Crop and Models), eds S. Jansson, R. Bhalerao, and A. Groover (New York, NY: Springer Science + Business Media), 309–348. doi: 10.1007/978-1-4419-1541-2_14
Stanton, B. J., Serapiglia, M. J., and Smart, L. B. (2013). “The domestication and conservation of Populus and Salix genetic resources,” in Poplars and Willows: Trees for Society and the Environment, eds J. G. Isebrands and J. Richardson (Rome: The Food and Agriculture Organization of United Nations and CABI), 124–199.
Stettler, R. F., Fenn, R. C., Heilman, P. E., and Stanton, B. J. (1988). Populus trichocarpa × Populus deltoides hybrids for short rotation culture: variation patterns and 4-year field performance. Can. J. For. Res. 18, 745–753. doi: 10.1139/x88-114
Street, N. R., Skogstrom, O., Sjodin, A., Tucker, J., Rodriguez-Acosta, M., Nilsson, P., et al. (2006). The genetics and genomics of the drought response in Populus. Plant J. 48, 321–341. doi: 10.1111/j.1365-313X.2006.02864.x
Struthers, R., Ivanova, A., Tits, L., Swennen, R., and Coppin, P. (2015). Thermal infrared imaging of the temporal variability in stomatal conductance for fruit trees. Int. J. Appl. Earth Obs. 39, 9–17. doi: 10.1016/j.jag.2015.02.006
Tardieu, F., and Simonneau, T. (1998). Variability among species of stomatal control under fluctuating soil water status and evaporative demand: modelling isohydric and anisohydric behaviours. J. Exp. Bot. 49, 419–432. doi: 10.1093/jxb/49.Special_Issue.419
Tardieu, F., and Tuberosa, R. (2010). Dissection and modelling of abiotic stress tolerance in plants. Curr. Opin. Plant Biol. 13, 206–212. doi: 10.1016/j.pbi.2009.12.012
Testi, L., Goldhamer, D. A., Iniesta, F., and Salinas, M. (2008). Crop water stress index is a sensitive water stress indicator in pistachio trees. Irrig. Sci. 26, 395–405. doi: 10.1007/s00271-008-0104-5
Torresan, C., Berton, A., Carotenuto, F., Di Gennaro, S. F., Gioli, B., Matese, A., et al. (2016). Forestry applications of UAVs in Europe: a review. Int. J. Remote Sens. 38, 2427–2447. doi: 10.1080/01431161.2016.1252477
van der Schoot, J., Pospíšková, M., Vosman, B., and Smulders, M. J. M. (2000). Development and characterization of microsatellite markers in black poplar (Populus nigra L.). Theor. Appl. Genet. 101, 317–322. doi: 10.1007/s001220051485
Viger, M., Smith, H. K., Cohen, D., Dewoody, J., Trewin, H., Steenackers, M., et al. (2016). Adaptive mechanisms and genomic plasticity for drought tolerance identified in European black poplar (Populus nigra L.). Tree Physiol. 36, k909–928. doi: 10.1093/treephys/tpw017
Virlet, N., Lebourgeois, V., Martinez, S., Costes, E., Labbé, S., and Regnard, J. (2014). Stress indicators based on airborne thermal imagery for field phenotyping a heterogeneous tree population for response to water constraints. J. Exp. Bot. 65, 5429–5442. doi: 10.1093/jxb/eru309
Way, D. A., and Oren, R. (2010). Differential responses to changes in growth temperature between trees from different functional groups and biomes: a review and synthesis of data. Tree Physiol. 30, 669–688. doi: 10.1093/treephys/tpq015
White, J. F., Andrade-Sanchez, P., Gore, M. A., Bronson, K. F., Coffelt, T. A., Conley, M. M., et al. (2012). Field-based phenomics for plant genetics research. Field Crop Res. 133, 101–112. doi: 10.1016/j.fcr.2012.04.003
White, T. L., Adams, W. T., and Neale, D. B. (eds). (2007). “Quantitative genetics – polygenic traits, heritabilities and genetic correlations,” in Forest Genetics (Wallingford: CABI), 113–148. doi: 10.1079/9781845932855.0113
Wu, R., and Stettler, R. F. (1994). Quantitative genetics of growth and development in Populus. I. A three-generation comparison of tree architecture during the first 2 years of growth. Theor. Appl. Genet. 89, 1046–1054. doi: 10.1007/BF00224537
Zarco-Tejada, P. J., González-Dugo, V., and Berni, J. A. J. (2012). Fluorescence, temperature and narrow-band indices acquired from a UAV platform for water stress detection using a micro-hyperspectral imager and a thermal camera. Remote Sens. Environ. 117, 322–337. doi: 10.1016/j.rse.2011.10.007
Keywords: UAV remote sensing, high-throughput field phenotyping (HTFP), phenomics, poplar thermal imagery, image processing, stomatal conductance, drought
Citation: Ludovisi R, Tauro F, Salvati R, Khoury S, Scarascia Mugnozzaa G and Harfouche A (2017) UAV-Based Thermal Imaging for High-Throughput Field Phenotyping of Black Poplar Response to Drought. Front. Plant Sci. 8:1681. doi: 10.3389/fpls.2017.01681
Received: 07 January 2017; Accepted: 13 September 2017;
Published: 27 September 2017.
Edited by:
John Doonan, Aberystwyth University, United KingdomReviewed by:
Véronique Jorge, Institut National de Recherche Agronomique, FranceStephen Hunt, Queen’s University, Canada
Copyright © 2017 Ludovisi, Tauro, Salvati, Khoury, Scarascia Mugnozza and Harfouche. This is an open-access article distributed under the terms of the Creative Commons Attribution License (CC BY). The use, distribution or reproduction in other forums is permitted, provided the original author(s) or licensor are credited and that the original publication in this journal is cited, in accordance with accepted academic practice. No use, distribution or reproduction is permitted which does not comply with these terms.
*Correspondence: Antoine Harfouche, aharfouche@unitus.it
†These authors have contributed equally to this work.