 Lijun Meng
 Baoxiang Wang3
 Kimberly Ponce
 Qian Qian
 Guoyou Ye
- 1CAAS-IRRI Joint Laboratory for Genomics-Assisted Germplasm Enhancement, Agricultural Genomics Institute in Shenzhen, Chinese Academy of Agricultural Sciences, Shenzhen, China
- 2Rice Breeding Platform, International Rice Research Institute, Metro Manila, Philippines
- 3Lianyungang Institute of Agricultural Sciences in Jiangsu Xuhuai Region, Jiangsu Academy of Agricultural Sciences, Lianyungang, China
- 4Institute of Crop Science and Nuclear Technology Utilization, Zhejiang Academy of Agricultural Sciences, Zhejiang, China
Excessive amounts of metal are toxic and severely affect plant growth and development. Understanding the genetic control of metal tolerance is crucial to improve rice resistance to Fe, Zn, and Al toxicity. The multi-parent advanced generation inter-cross (MAGIC) populations were genotyped using a 55 K rice SNP array and screened at the seedling stage for Fe, Zn, and Al toxicity using a hydroponics system. Association analysis was conducted by implementing a mixed linear model (MLM) for each of the five MAGIC populations double cross DC1 (founders were SAGC-08, HHZ5-SAL9-Y3-Y1, BP1976B-2-3-7-TB-1-1, PR33282-B-8-1-1-1-1-1), double cross DC2 (founders of double cross were FFZ1, CT 16658-5-2-2SR-2-3-6MP, IR 68, IR 02A127), eight parents population 8way (founders were SAGC-08, HHZ5-SAL9-Y3-Y1, BP1976B-2-3-7-TB-1-1, PR33282-B-8-1-1-1-1-1, FFZ1, CT 16658-5-2-2SR-2-3-6MP, IR 68, IR 02A127), DC12 (DC1+DC2) and rice multi-parent recombinant inbred line population RMPRIL (DC1+DC2+8way). A total of 21, 30, and 21 QTL were identified for Fe, Zn, and Al toxicity tolerance, respectively. For multi tolerance (MT) as Fe, Zn, and Al tolerance-related traits, three genomic regions, MT1.1 (chr.1: 35.4–36.3 Mb), MT1.2 (chr.1: 35.4–36.3 Mb), and MT3.2 (chr.3: 35.4-36.2 Mb) harbored QTL. The chromosomal regions MT2.1 (chr.2: 2.4–2.8 Mb), MT2.2 (chr.2: 24.5–25.8 Mb), MT4 (chr.4: 1.2 Mb Mb), MT8.1 (chr.8: 0.7–0.9 Mb), and MT8.2 (chr.8: 2.2–2.4 Mb) harbored QTL for Fe and Zn tolerance, while MT2.3 (chr.2: 30.5–31.6 Mb), MT3.1 (chr.3: 12.5–12.8 Mb), and MT6 (chr.6: 2.0–3.0 Mb) possessed QTL for Al and Zn tolerance. The chromosomal region MT9.1 (chr.9: 14.2–14.7 Mb) possessed QTL for Fe and Al tolerance. A total of 11 QTL were detected across different MAGIC populations and 12 clustered regions were detected under different metal conditions, suggesting that these genomic regions might constitute valuable regions for further marker-assisted selection (MAS) in breeding programs.
Introduction
Trace amounts of metal ions are essential for plant growth and development; however high concentrations result in perturbations in physiological processes, and ultimately productivity. Rice is among the cereal crop able to accumulate high levels of metal, including Ferrous (Fe), Aluminum (Al), and Zinc (Zn). These metals are naturally present at very low levels in paddy soils, but long-term use of chemical fertilizers result to acidity and increased concentration of phytotoxic ion form. Low soil pH (<5.0) favors the production of soluble phytotoxic Al3+ ion easily taken up by the root system inhibiting cell division. These results to poor root growth and therefore low ion and water uptake (Panda et al., 2009; Tanaka and Navasero, 2012). Moreover, the anaerobic nature and low redox potential of paddy soils results to the reduction of Fe to Fe2+, another soluble ion easily taken up by plants. Excessive amount of Fe2+ catalyze the formation of reactive oxygen species (ROS) causing irreversible damage in the cells (Becker and Asch, 2005). Zn is taken up by plant in the form of Zn2+ ion during early stages of the plant, which is highly phytotoxic. It was reported that Zn2+ has a key role in photosynthetic system. Specifically, it interferes in the photochemical reaction of chloroplast as proven by chlorophyll degradation in lichens, thereby decreasing its photosynthetic activity (Rout and Das, 2003).
Remediation strategies for metal contaminated paddy fields via chemical, physical, or biological means are necessary. However, the available methods are not effective or practical to use due to high input and running costs as well as low efficiency. Breeding new varieties with low metal accumulation in the grain constitutes a cost effective and efficient method to reduce the risk of low rice productivity and improve food safety. Understanding the genetics of metal tolerance is crucial to developing metal tolerance rice varieties.
Quantitative Trait Loci (QTL) mapping is an effective means of dissecting the genetic factors underlying agronomic traits such as metal tolerance. A number of studies have reported QTL for tolerance to a variety of metal. With regards to Fe toxicity in rice, a total of 197 QTL have been reported (Wu et al., 1997, 1998, 2014; Wan J. L. et al., 2003a; Wan J. M. et al., 2003b; Wan et al., 2005; Shimizu et al., 2005; Ouyang et al., 2007; Dufey et al., 2009, 2012, 2015; Fukuda et al., 2012; Zhang et al., 2013; Zhao et al., 2013; Matthus et al., 2015; Ruengphayak et al., 2015; Liu et al., 2016). A total of four chromosomal regions (CR), including CR1 on chromosome 1 between markers RM246 and RM443; CR2 on chromosome 2 between markers RM526 and R758; CR3 on chromosome 3 between markers C515 and C25; and CR4 on chromosome 7 between markers R1245 and RM429, have been found to be involved in the resistance of rice to Fe toxicity (Dufey et al., 2014). However, no genes have yet been cloned. A total of 148 QTL were identified for Al tolerance in rice via linkage mapping using biparental crosses (Wu et al., 2000; Nguyen et al., 2001, 2002, 2003; Ma et al., 2002; Mao et al., 2004; Xue et al., 2006a,b, 2007) and association mapping using natural populations (Famoso et al., 2011; Zhang et al., 2016). The association mapping of 383 rice accessions and linkage mapping populations of recombinant inbred lines (RIL) derived from IR64/Azucena and backcross inbred lines (BIL) derived from Nipponbare/Kasalath//Nipponbare were reported by Famoso et al. (2011). Al-tolerant QTL (AltTRG12.1) encompassing the ART1 locus on chromosome 12 exhibited a large effect (LOD = 7.85, R2 = 19.3%) in a RIL population. Moreover, three regions corresponding to induced Al-sensitive rice mutants (ART1, STAR2, and Nrat1) were identified through biparental QTL mapping (Famoso et al., 2011). Association mapping for relative root elongation (RRE) was performed using a core collection of 150 accessions of rice landraces with the highest phenotypic variation (R2) explained by significant associations of 20.03% (for PSM365) at 21.4 Mb on chromosome 11 (Zhang et al., 2016). A transcription factor, ART1 (Al resistance transcription factor 1), has been identified for Al tolerance in rice. ART1 regulates the internal and external detoxification of Al by affecting at least 30 genes (Yamaji et al., 2009; Ma et al., 2014). It is clear that the exposure of the roots to Al triggers both the induction and expression of many Al-resistance genes in rice including OsNrat1, OsSTAR1/2, OsALS1, and OsFRDL4 (Huang et al., 2009, 2012; Xia et al., 2010; Yokosho et al., 2011). Three studies have reported 53 QTL for Zn tolerance using RIL populations (Dong et al., 2006; Zhang et al., 2013; Liu et al., 2016). Among of them, the major QTL qZNT-1 at interval marker XNpb93-C3029C on chromosome 1 explained 21.9% of the variance (Dong et al., 2006). Four QTL were detected using two independent backgrounds in reciprocal introgression populations, with QSh2b, QSh7, and QSdw5 simultaneously identified in both Teqing-ILs and Lemont-ILs backgrounds (Zhang et al., 2013), while qZRRDW3 was detected in both MH63-ILs and 02428-ILs backgrounds (Liu et al., 2016). The expression of these QTL in different genetic backgrounds suggests that they might be widespread. Two QTL, QSdw5 at 17.3–19.5 Mb on chromosome 5 (Zhang et al., 2013) and qFRSDW11 at C11S49-C11S60 on chromosome 11 (Liu et al., 2016) were expressed under Fe and Zn stress, suggesting that there is a genetic overlap in Fe and Zn toxicity tolerance at the seedling stage.
The genetic architecture of tolerance to Fe, Zn, and Al toxicity in rice appears complex and not yet fully understood. No major locus has been identified, fine-mapped, or cloned thus far. Two limitations of previous studies include that biparental populations cover only a small genetic variability and a small number of genetic markers, resulting in the detection of only a few QTL confined to few genetic backgrounds (Matthus et al., 2015). The use of MAGIC populations with high allelic and phenotypic diversity, in combination with high-density genotyping is an effective means of increasing the genetic mapping resolution for metal tolerance.
Effective phenotyping techniques are a prerequisite in QTL mapping for metal tolerance. Artificial hydroponic systems provide an effective method for metal tolerance screening, as environmental factors such as temperature and acidity of the culture solution are highly controlled (Marmiroli et al., 2011). Moreover, growth rate, leaf color, and the extent of plant injury are common phenotypic traits used to measure the metal tolerance at the seedling stage in rice. The greatest indicator of plant sensitivity to Fe and Zn toxicity is related to leaf symptoms (Audebert and Fofana, 2009). Leaf discoloration and the leaf bronzing index (LBI) are both used to measure the extent of Zn toxicity (Dong et al., 2006), whereas the LBI is used for Fe toxicity (Dufey et al., 2009).
In this study, we aimed to illuminate the genetic basis of tolerance to Fe, Zn, and Al toxicity at the seedling stage by screening highly diverse MAGIC populations in a hydroponic system and employing a 50 K single nucleotide polymorphism (SNP) array. A genome-wide association study (GWAS) was conducted using mixed linear models (MLMs) to determine the loci associated with metal tolerance. The results will be valuable in gene cloning and marker assisted selection (MAS)-based breeding for metal tolerance.
Materials and Methods
Plant Materials
Five MAGIC populations were used in this study. DC1 derived from SAGC-08 (A), HHZ5-SAL9-Y3-Y1 (B), BP1976B-2-3-7-TB-1-1 (C), PR33282-B-8-1-1-1-1-1 (D) parents. DC2 derived from FFZ1 (E), CT 16658-5-2-2SR-2-3-6MP (F), IR 68 (G), IR 02A127 (H) parents. 8way derived from SAGC-08 (A), HHZ5-SAL9-Y3-Y1 (B), BP1976B-2-3-7-TB-1-1 (C), PR33282-B-8-1-1-1-1-1 (D), FFZ1 (E), CT 16658-5-2-2SR-2-3-6MP (F), IR 68 (G), IR 02A127 (H). DC12 was combined use of DC1 and DC2 populations. RMPRIL was combined use of DC1, DC2 and 8-way populations. The eight founders were pairwise crossed to produce four two-way hybrids. These four two-way hybrids were intercrossed in a diallel fashion leading to six 4-way crosses. Two of the 4-way crosses, ABCD and EFGH, were advanced by single seed decent (SSD) to develop the DC1 and DC2 RILs populations. An 8-way cross was made by intercrossing 100 F1 plants of the 4-way cross ABCD and 100 F1 plants of the 4-way cross EFGH. One thousand 8-way cross F1 plants were advanced by SSD to develop the 8-way RILs population. Eight parents showing obvious differences in the agronomic traits and biotic/abiotic stresses (Table 1) were used to develop the population as described by Meng et al. (2016a). A total of 218, 210, 445, 428, and 873 RIL lines of the 4way DC1, 4way DC2, 8way, DC12 and RMPRIL populations were used, respectively.
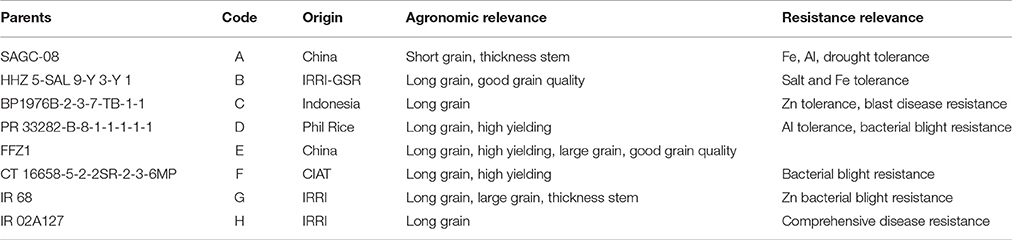
Table 1. Description of the eight parental lines used for developing the MAGIC populations.
Metals Tolerance Screening
The screening for Al experiment was conducted under 200 μmol AlCl3 and control conditions from July 15 in 2015 in a greenhouse with the day/night temperature of 30/25°C at CAAS, Beijing, China. Rice seeds of 873 MAGIC lines and 8 parents were surface sterilized with 5% sodium hypochlorite, rinsed with water, pre-germinated for 48 h under dark condition and temperature of 30°C. Experiment was conducted using randomized complete block design (RCBD) with two replicates: for one replicate 24 germinated uniform seeds of each line were randomly sown in 96 wells PCR plate (8 × 12). One line was sown in three different plates (8 × 3) that plates have perforated wells at the bottom to facilitate the roots to fully contact with the standard rice nutrient solution (Yoshida et al., 1976). The screening for Fe and Zn experiments were conducted under 300 mg/L Fe2+ (as FeSO4 × 7H2O), 300 mg/L ZnSO4 and control conditions from September 10 in 2014 in a greenhouse (NG04-02) with the day/night temperature being about 30/25°C at IRRI (International Rice Research Institute), Laguna, Philippines. Rice seeds including 8 parents and 873 RILs were soaked in demineralized water and germinated at 30°C in the dark for 48 h. Subsequently, 56 uniform seeds per line were directly sown into perforated Styrofoam sheets covered with nylon net at the bottom placed on standard rice nutrient solution. Each hole contained two seeds of the same line or parent. An Augmented RCBD was adopted with six sets of incomplete blocks 8 parents being replicated six times. The 10 days old plants were exposed to Fe, Zn, and Al stress for further 20 days. The pH of the control and all treated groups were adjusted to 4.5 using 1 N NaOH or 1 N HCl, pH were maintained every day and solutions were changed after every 5 days.
The metal tolerance scores (MTS) were measured at 20 days after treatment according to the modified standard evaluation system (Dufey et al., 2012). The MTS for Fe and Zn indicates the severity of toxicity: 1 (Highly tolerance: Normal growth with no leaf symptoms), 3 (Tolerance: Nearly normal growth, but leaf tips or few leaves whitish and rolled), 5 (Moderately tolerant: Growth severely retarded; most leaves rolled; only a few are elongating), 7 (Susceptible: Complete cessation of growth; most leaves dry; some plants dying) and 9 (Highly susceptible: Almost all plants dead or dying).
Three plants of each line from each replicate were harvested for measuring the shoot length (SL) and root length (RL). The roots and shoots were put in craft paper envelop and dried at 60°C for 72 h in an oven. The shoot dry weight (SDW) and root dry weight (RDW) were determined. The indexes of toxicity tolerance, relative shoot length (RSL), relative root length (RRL), relative shoot dry weight (RSDW) and relative root dry weight (RRDW) were calculated according to the following formula: relative trait value (%) = (trait value in treatment)/(trait value in control) × 100.
Genotyping with the 55 K SNP Array
A total of 873 RILs from the MAGIC population, plus the eight parents were genotyped. Approximately 200 ng of DNA from each inbred line was used for genotyping using the Affymetrix® GeneTitan® platform with the Affymetrix® Axiom® Rice Genotyping Array, conducted by the CapitalBio Technology (Beijing, China) according to the manufacturer's protocol. The raw signal CEL files were processed using the Axiom® genotyping best practices. A total of 881 plates passed Dish Quality Control (QC). The probe QC was then determined using samples that passed the QC and were classified into six major categories including “Poly High Resolution,” “Mono High Resolution,” “No Minor Homozygote,” “Off Target Variant,” “Call Rate Below Threshold,” and “Other.” Finally, 39,066 high-quality (Poly High Resolution) SNPs displaying genetic diversity were selected from the common SNPs. In addition, a three-step filtering strategy was applied to select high quality SNPs for QTL mapping. Firstly, markers that were non-polymorphic among the parents were removed. Secondly, all heterozygous genotypes were set as “missing” and markers with more than 10% missing values were removed. Finally, markers with a minor allele frequency (MAF) less than 3% were removed. The number of markers remaining were 22,160, 22,020, 28,505, 28,540, and 28,531 for the DC1, DC2, 8way, DC12 (DC1+DC2), and RMPRIL (DC1+DC2+8way) populations, respectively (Supplementary Table S1).
Statistical Analysis
Adjusted trait value for each RIL was obtained using the PBTools developed by IRRI (http://bbi.irri.org/). Association analysis was conducted using MLM implemented in TASSEL v5.2 (Bradbury et al., 2007). The model uses PCA and kinship to control population structure and the familiar relationship. Bonferroni-corrected threshold probability based on individual tests was calculated to correct for multiple comparisons, using 1/N, where N is the number of individual trait-SNP combinations tested. Significant marker trait associations (MTAs) were identified based on probability level of 1.0 × 10⁻⁴. Peaks exhibiting significance threshold level within a physical distance of 1.0 Mb were delineated into a single QTL. A QTL explaining more than 10% of the phenotypic variation was considered a major QTL. QTLs detected for different metal stresses with an overlapping confidence interval of 1.0 Mb were defined as a QTL cluster. The R-qqman package was used for creating the Manhattan plot (Turner, 2014). All other statistical analyses were conducted in R 3.3.1 (R Development Core Team, 2016).
Results
Phenotypic Variation
All the parental lines differed significantly for MTS under Fe and Zn stress (Table 2). For Fe, the parental lines A (1.0) and B (2.0) had the lowest MTS, while G (4.5) and H (5.0) had the highest MTS among the eight parental lines. For Zn, the parental lines C (3.0) and G (3.0) were the most tolerant, while the parental line B (6.5) was the most sensitive. Transgressive segregations were observed in both directions for all the populations (Figure 1), though the mean scores were not significantly different among populations (Table 2). For Fe, the average values of the DC1 population were 77.8, 70.2, 82.4, and 100.9 for RSL, RRL, RSDW, and RRDW, respectively; for the DC2 population these were 77.8, 68.7, 70.2, and 95.2%; and those of the 8way population were 82.5, 114.7, 88.4, and 113.7. For Zn, the average values of RSL, RRL, RSDW, and RRDW were 78.9, 82.9, 91.8, and 71.9%, respectively, in the DC1 population; 76.4, 82.6, 73.9, and 63.8%, respectively, in the DC2 population; and 63.8, 91.1, 54.5, and 72.4%, respectively, in the 8way population. For Al, the average trait values were 90.0, 73.0, 60.8, and 50.3% for RSL, RRL, RSDW, and RRDW, respectively, in the DC1 population; 89.3, 81.3, 66.0, and 54.0%, respectively, in the DC2 population; and 88.6, 84.1, 75.2, and 61.1%, respectively, in the 8way population. Transgressive segregations were observed for SL, RL, SDW, RDW, RSL, RRL, RSDW, and RRDW of Fe, Zn and Al stresses in all MAGIC populations.
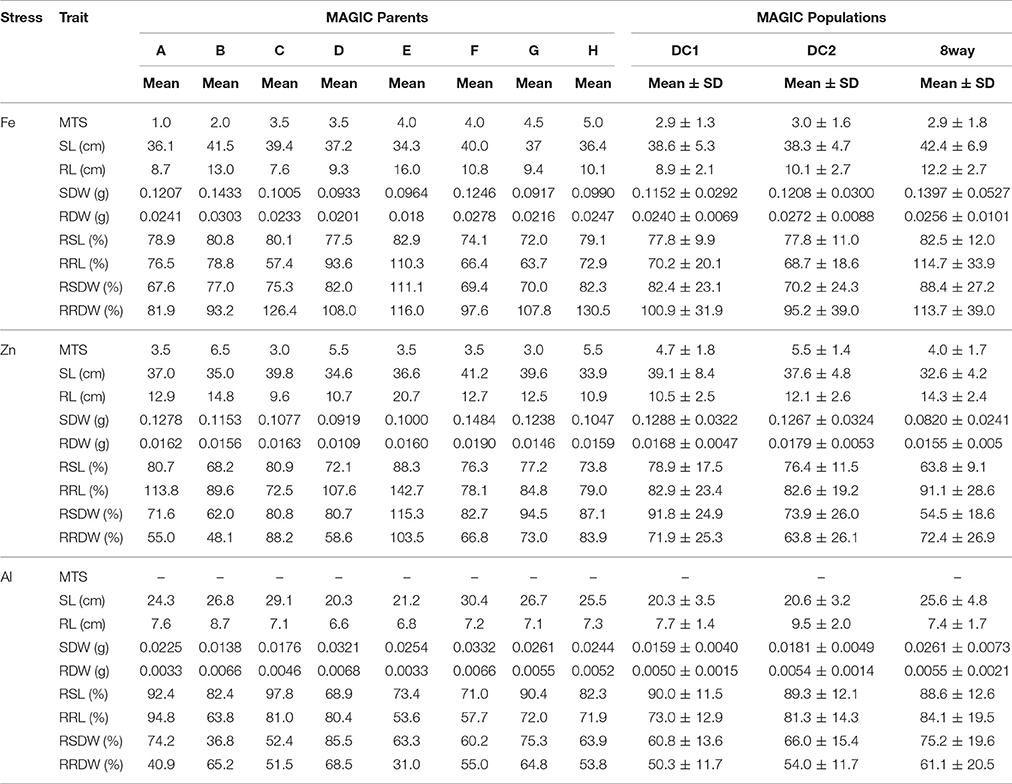
Table 2. Performance of nine growth traits of the parental lines and MAGIC populations under Fe, Zn, and Al stress conditions.
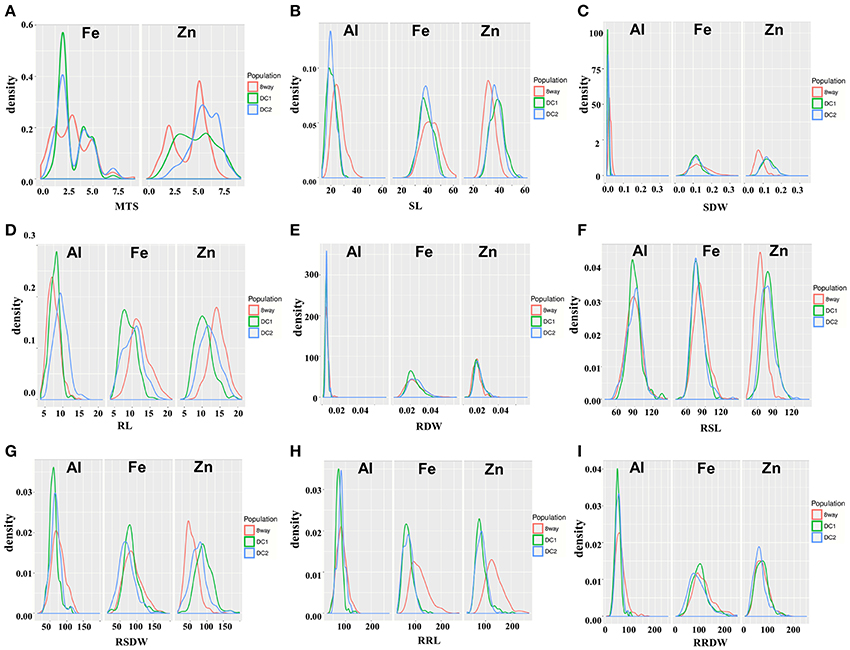
Figure 1. Distribution of nine traits in the DC1, DC2, and 8way populations measured under Fe, Zn, and Al stress conditions. (A) MTS, Metal tolerance scores. (B) SL, Shoot length. (C) RL, Root length. (D) SDW, Shoot dry weight. (E) RDW, Root dry weight. (F) RSL, Relative shoot length. (G) RRL, Relative root length. (H) RSDW, Relative shoot dry weight. (I) RRDW, Relative root dry weight.
Trait Correlations
The trait correlations were in the same direction for all MAGIC populations with respect to all the trait pairs (Figure 2; Supplementary Table S2). The most significant and positive correlations were observed between SL and SDW (0.741 in DC2), RL and RRL (0.672 in DC2), RDW and RRDW (0.864 in 8way), and RSL and RSDW (0.748 in DC2) for Al stress conditions. For Zn stress, these were between RL and RRL (0.694 in DC2), SDW and RDW (0.805 in DC2), and RSDW and RRDW (0.769 in DC2). For Fe stress these were between SDW and RDW (0.896 in 8way) and RL and RRL (0.817 in DC2). This was considered to be the result of the strong positive correlation observed between the different traits of SL and SDW, RL and RDW, SDW and RDW. The same trait correlations were highly significant and positive for MTS (0.335 in DC2), SL (0.761 in DC1), RSL (0.779 in DC2), and RSDW (0.795 in DC2) under Fe and Zn stress. These results strongly suggest that great potential exists for the selection of Fe and Zn toxicity-tolerant materials.
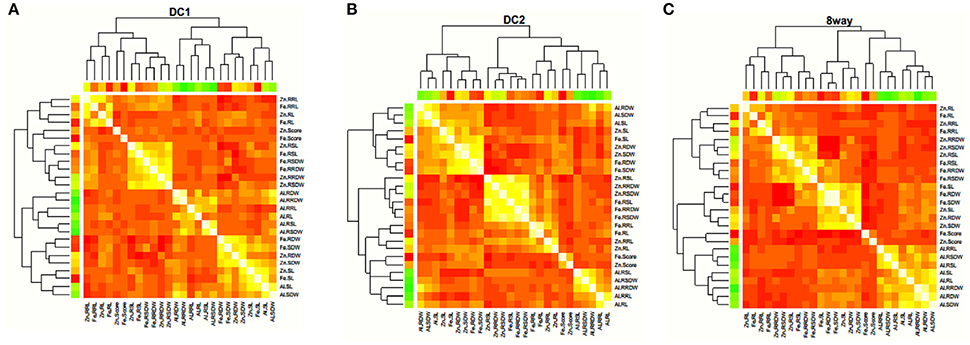
Figure 2. Correlation coefficients among different stress traits estimated in DC1 (A), DC2 (B), and 8way (C), respectively. The colors showed the absolute value of corresponding r. Light yellow and red indicated high and low correlations, respectively.
QTL for Fe Toxicity Tolerance
In the five MAGIC populations, a total of 21 QTL were mapped for MTS, SL, RL, SDW, RDW, RSL, and RRDW on all the chromosomes, with the exception of chromosome 10. Among these, two, one, eight, two, and 11 were detected in the DC1, DC2, 8way, DC12, and RMPRIL populations, respectively (Table 3; Supplementary Figure S1). For MTS, three putative QTL were detected on chromosome 2. qFeMTS2.1 and qFeScore2.2 were identified in RMPRIL, and explained 2.2 and 2.4% of the phenotypic variation, respectively. qFeMTS2.3 was detected in the 8way population and explained 3.9% of the phenotypic variation. For SL, seven putative QTL were detected on chromosomes 1, 3, 7, and 9. qFeSL1.1, qFeSL3.3, qFeSL7, and qFeSL9 were detected in the RMPRIL population and accounted for 1.8–2.0% of the phenotypic variation, whereas qFeSL3.1 and qFeSL3.2 were detected in the 8way population and explained 3.5 and 4.0% of the phenotypic variation, respectively. qFeSL1.2 was detected in the DC1, 8way, DC12, and RMPRIL populations and explained 3.6–18.9% of the phenotypic variation. For RL, three QTL were detected on chromosomes 6, 7, and 8. qFeRL6 and qFeRL8 were detected in the 8way population and explained 3.4 and 4.3% of the phenotypic variation. qFeRL7 was detected in DC12 and explained 3.6% of the phenotypic variation. For SDW, two QTL were detected on chromosomes 2 and 5. qFeSDW2 was detected in the DC1 population and accounted for 7.5% of the phenotypic variation. qFeSDW5 was detected in the RMPRIL population and explained 1.9% of the phenotypic variation. For RDW, only one QTL, qFeRDW5, located on chromosome 5 was detected in the 8way population for RDW and explained 4.4% of the phenotypic variation. For RSL, four QTL were detected on chromosomes 6, 8, 11, and 12. qFeRSL6 and qFeRSL11 were detected in RMPRIL and explained 2.7 and 1.8% of the phenotypic variation, respectively. qFeRSL8 and qFeRSL12, which explained 3.8 and 8.1% of the phenotypic variation, were detected in both the 8way and DC2 populations. For RRDW, only one QTL located on chromosome 4 was detected in the RMPRIL population, which accounted for 1.9% of the phenotypic variation. One major QTL, qFeSL1.2, located at 38.4 Mb on chromosome 1 was detected for SL in all populations except in DC2. The QTL explained phenotypic variation of about 18.9% in the DC1 population and 12.8% in the DC12 population. The allele from parental line C increased SL with an average effect of 6.4 and 7.6 cm.
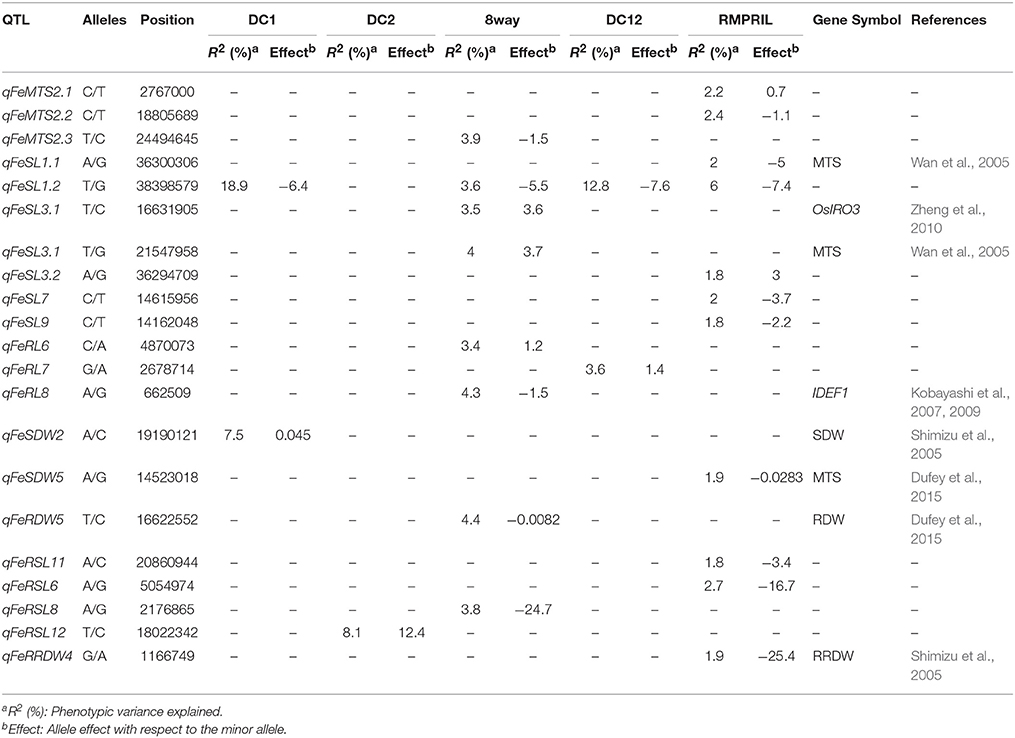
Table 3. Putative QTL detected for Fe tolerance in five MAGIC populations.
QTL for Zn Toxicity Tolerance
In the five MAGIC populations, a total of 30 QTL were mapped for nine traits on all chromosomes except 5 and 9. No SNP markers were detected to be significantly associated in the DC2 population, while six, two, eight, and 23 QTL were detected in the DC1, 8way, DC12, and RMPRIL populations, respectively (Table 4; Supplementary Figure S2). For MTS, one QTL, qZnMTS7, was detected on chromosome 7 and explained 7.7, 4.2, and 2.0% of the phenotypic variation in the DC1, DC12, and RMPRIL populations, respectively. For SL, 12 putative QTL were detected on chromosomes 1, 2, 3, 4, 6, 8, and 12, of which six QTL (qZnSL1.1, qZnSL2.1, qZnSL3.1, qZnSL3.2, qZnSL8.1, and qZnSL8.2) were detected in RMPRIL and explained 1.8–2.8% of the phenotypic variation. Three QTL (qZnSL4.1, qZnSL4.2, and qZnSL12) were detected in DC12 and explained 3.9–5.1% of the phenotypic variation. qZnSL6 was detected in DC1, explaining 8.4% of the phenotypic variation, while qZnSL2.2 was detected on chromosome 2 and explained 2.7–8.8% of the phenotypic variation in DC1, DC12, and RMPRIL, respectively. qZnSL1.2 was associated in the DC1, 8way, DC12, and RMPRIL populations, and explained 6.2–11.8% of the phenotypic variation. For RL, four QTL were detected on chromosomes 2, 6, and 11, the qZnRL2 was detected in the DC1 population and explained 9.0% of the phenotypic variation. qZnRL6.1, qZnRL6.2, and qZnRL11 were detected in the RMPRIL population and explained 1.7–3.7% of the phenotypic variation. For SDW, five QTL were detected on chromosomes 1, 2, 3, 4, and 8. qZnSDW1, qZnSDW2, qZnSDW3, qZnSDW4, and qZnSDW8 were detected in the RMPRIL population and explained 3.6% of the phenotypic variation. For RDW, two QTL qZnRDW2.1 and qZnRDW2.2 were detected on chromosome 2 in the DC12 and RMPRIL populations, respectively, accounting for 3.7 and 2.3% of the phenotypic variation. For RSL, two QTL were detected on chromosomes 2 and 4. qZnRSL2 was detected in both the DC1 and RMPRIL populations and explained 7.8 and 2.4% of the phenotypic variation, respectively. qZnRSL4 was detected in DC12 and RMPRIL and was associated with 3.7 and 1.8% of the phenotypic variation, respectively. For RSDW, two QTL (qZnRSDW8 and qZnRSDW10) were detected on chromosomes 8 and 10 in the 8way and RMPRIL populations, explaining 4.1 and 1.9% of the phenotypic variation, respectively. For RRL, a single QTL, qZnRRL3, was detected in RMPRIL and explained 1.8% of the phenotypic variation. For RRDW, one QTL qZnRRDW4 was detected on chromosome 4 in the RMPRIL population, which explained 2.1% of the phenotypic variation. One major QTL qZnSL1.2 (chr.1: 38.4 Mb) was detected for SL in all populations except DC2, which explained 11.8 and 11.3% of the phenotypic variation in DC1 and DC12, respectively. The allele from parental line C increased SL with an average effect of 6.7 and 9.1 cm.
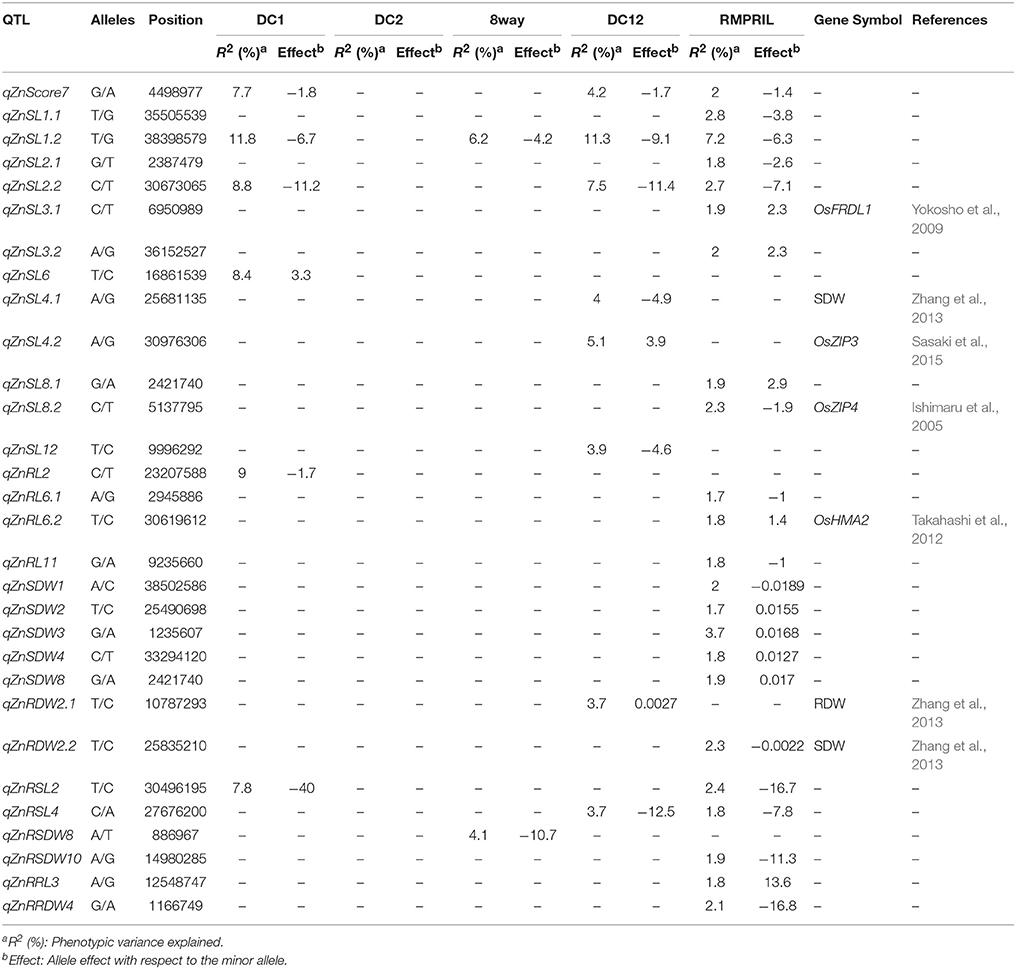
Table 4. Putative QTL detected for Zn tolerance in five MAGIC populations.
QTL for Al Toxicity Tolerance
A total of 21 QTL were mapped for the eight traits on all chromosomes except chromosome 4. Among them, seven, three, three, five, and 10 QTL were detected in the DC1, DC2, 8way, DC12, and RMPRIL populations, respectively (Table 5; Supplementary Figure S3). For SL, three putative QTL were detected on chromosomes 1 and 3. qAlSL1.1 was detected in DC2 and explained 4.0% of the phenotypic variation, while qAlSL3 was detected in the RMPRIL population and explained 2.8% of the phenotypic variation. qAlSL1.2 was detected in the DC1, 8way, DC12, and RMPRIL populations and explained 6.2–15.0% of the phenotypic variation. For RL, seven QTL were detected on chromosomes 1, 6, and 12. qAlRL1.1 and qAlRL1.2 were detected in the DC2 population and both explained 0.1% of the phenotypic variation. qAlRL6, qAlRL12.1, and qAlRL12.2 were detected in RMPRIL, explaining 1.9, 1.9, and 2.1% of the phenotypic variation, respectively. qAlRL1.3 was detected in the DC1 and DC12 populations and explained 9.4 and 5.1% of the phenotypic variation, respectively. qAlRL1.4 was detected in the DC2 and RMPRIL populations and accounted for 0.1 and 2.2% of the phenotypic variation, respectively. For SDW, five QTL were detected on chromosomes 1, 5, 6, 7, and 9. qAlSDW1 was detected in 8way and explained 4.2% of the phenotypic variation. qAlSDW6 was detected in the DC1 population and explained 9.2% of the phenotypic variation. qAlSDW7 and qAlSDW9 were detected in the RMPRIL population and accounted for 2.0 and 2.2% of the phenotypic variation, respectively. qAlSDW5 was detected in the DC1 and DC12 populations and explained 10.2 and 4.9% of the phenotypic variation, respectively. For RDW, qAlRDW3 was detected in the DC1 and DC12 populations and explained 8.2 and 4.4% of the phenotypic variation, respectively. qAlRDW6 was detected in the 8way population and explained 4.4% of the phenotypic variation. For RSL, RRL, RSDW, and RRDW, only one QTL was detected in the single population. qAlRSL11, qAlRRL2, qAlRSDW10, and qAlRRDW12 were detected in the 8way, RMPRIL, DC1, and RMPRIL populations on chromosomes 11, 2, 10, and 12 and explained 2.0–9.6% of the phenotypic variation. Two major QTL were detected for SL and SDW. The major QTL qAlSL1.2 (chr.1: 38.4 Mb) was detected in all populations except in DC2, with a phenotypic variation of 15.0% for the DC1 population and 14.6% for the 8way population. The allele from parental line C increased SL with an average effect of 3.7 and 8.0 cm. Another major QTL qAlSDW5 (chr.5: 5.4 Mb) was detected in the DC1 and DC12 populations and explained 10.2 and 4.9% of the phenotypic variation, respectively. The allele from parental line A increased SDW with an average effect of 0.0037 g.
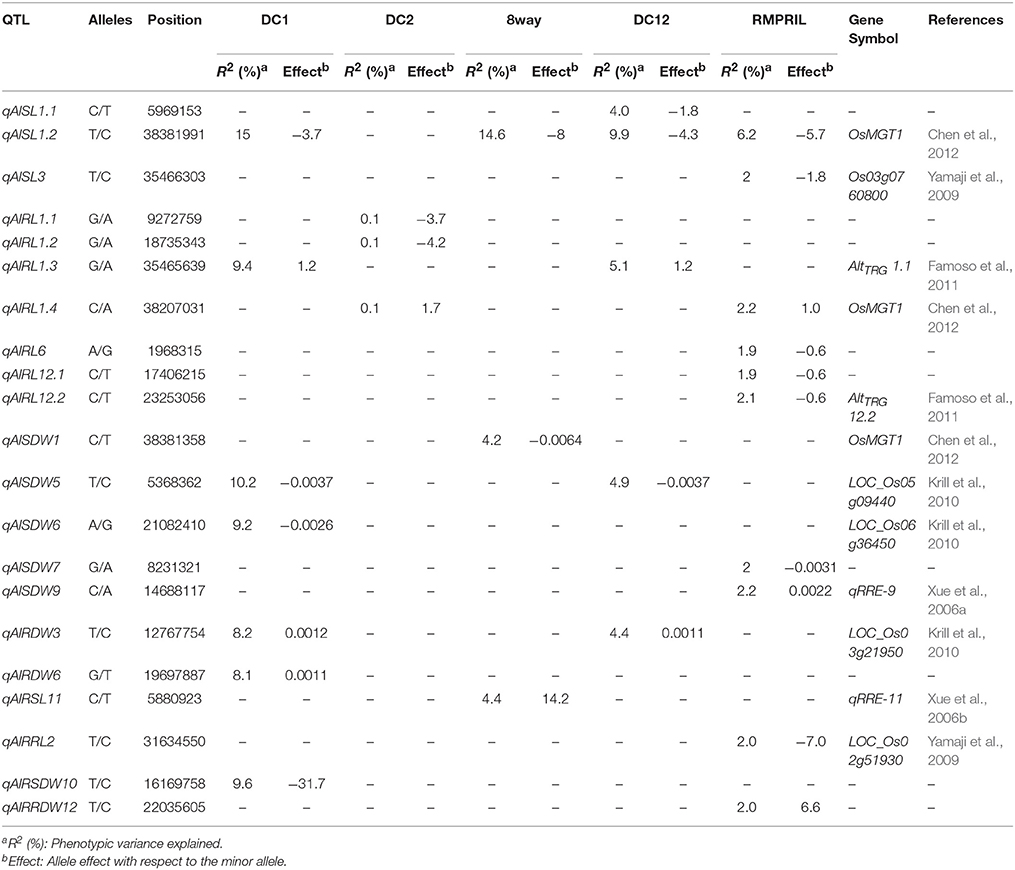
Table 5. Putative QTL detected for Al tolerance in five MAGIC populations.
QTL Clusters
A total of 33 QTL were grouped into 12 clusters on chromosomes 1, 2, 3, 4, 6, 8, and 9 (Figure 3). Three QTL clusters were detected under three stress conditions. The cluster MT1.1 at 35.4-36.3 Mb was covered by qAlRL1.3, qZnSL1.1, and qFeSL1.1, while MT1.2 at 38.2–38.5 Mb was covered by qFeSL1.2, qZnSL1.2, qZnSDW1, qAlRL1.4, qAlSDW1, and qAlSL1.2. Cluster MT3.2 at 35.4–36.2 Mb was covered by qAlSL3, qZnSL3.2, and qFeSL3.3. Five QTL clusters, MT2.1 (qZnSL2.1 and qFeMTS2 at 2.4–2.8 Mb), MT2.2 (qFeMTS2, qZnSDW2, and qZnRDW2.2 at 24.5–25.8 Mb), MT4 (qFeRRDW4 and qZnRRDW4 at 1.2 Mb), MT8.1 (qFeRL8 and qZnRSDW8 at 0.7–0.9 Mb), and MT8.2 (qFeRSL8, qZnSL8.1, and qZnSDW8 at 2.2–2.4 Mb), were detected under both Fe and Zn stress conditions. Three QTL clusters, MT2.3 (qZnRSL2, qZnSL2.2, and qAlRRL2 at 30.5–31.6 Mb), MT3.1 (qZnRRL3 and qAlRDW3 at 12.5–12.8 Mb), and MT6 (qAlRL6 and qZnRL6.1 at 2.0–3.0 Mb) were detected under both Zn and Al stress conditions. The QTL cluster MT9.1 (qFeSL9 and qAlSDW9 at 14.2–14.7 Mb) was detected under the Fe and Al treatments. The results suggest that these chromosomal regions are significantly associated with metal tolerance and might be pleiotropic or encode multiple tightly linked genes.
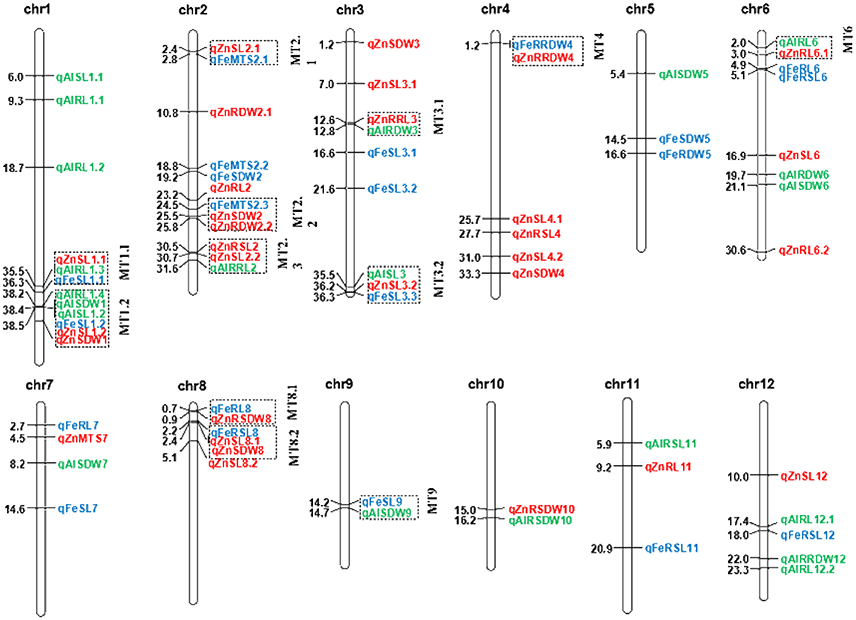
Figure 3. Positions of the QTL for SL, RL, SDW, RDW, RSL, RRL, RSDW, RRDW, and MTS on all chromosomes under Fe, Zn, and Al stress conditions. Blue, red, and green correspond to the Fe, Zn, and Al QTL detected, respectively. Individual QTL are designated with the italicized abbreviation of the trait and the chromosome number. When more than one QTL affecting a trait is identified on the same chromosome, they are distinguished by decimal numbers. The distances between the markers (Mb) are listed to the left of each figure. The clustered QTL for different tolerance traits are indicated using dashed outline boxes.
Discussion
Mapping Power and Resolution of the Magic Populations
We were able to overcome the limitations of bi-parental populations, in which only two alleles are analyzed and the genetic recombination is limited. In this study by using multiple parents to produce mapping populations with high allelic and phenotypic diversity, in combination with high levels of recombination events brought about by several cycles of intermating. The efficacy of MAGIC populations for high resolution mapping in rice has been previously reported (Bandillo et al., 2013; Li et al., 2013; Meng et al., 2016a,b). The eight parents used for the MAGIC population in this study displayed obvious differences in agronomic traits and biotic/abiotic stresses, such as resistance to drought, salinity, ferrous, zinc, aluminum, cadmium, and bacterial blight (Table 1). These populations possess a slightly higher genetic diversity than a population of 248 of IRRI's breeding lines (Meng et al., 2016a). Due to the multiple hybridizations and selfing used in developing the populations, the DC1, DC2, and 8way populations exhibited no clear population structure and thus the effect of population structure on the mapping results is negligible. These populations were also used to identify QTL for 14 yield-related traits in the dry season (DS) and wet season (WS) during 2014 at the headquarters of the IRRI (Meng et al., 2016b). The mapping resolution and power of the DC12 and RMPRIL populations was higher than the DC1, DC2, and 8way populations as a result of the larger population size of the former. Greater metal toxicity-tolerant QTL were identified in the RMPRIL population (44 QTL) in comparison to the DC12 (15 QTL), 8way (13 QTL), DC1 (15 QTL), and DC2 (four QTL) populations. A total of 11 QTL were detected across the different MAGIC populations, particularly qFeSL1.2, qZnSL1.2, and qAlSL1.2, which were identified in all the populations except DC2. The QTL corresponding to known genes were also identified in the RMPRIL (13 QTL), DC12 (7 QTL), 8way (seven QTL), DC1 (six QTL), and DC2 (one QTL) populations. This suggests that the combined populations possess substantially higher QTL detection power and precision brought by the large population size and high level of recombination (Coles et al., 2010; Steinhoff et al., 2011). Although the MAGIC populations exhibited no clear population structure, approximately 20 lines showed exceptionally high kinship, and 32 lines were slightly different compared to the other lines in the DC2 population (Meng et al., 2016a). These results explain the observed low detection power in DC2 compared with the DC1 and 8way populations. The use of DC12 (DC1 + DC2) and RMPRIL (DC1 + DC2 + 8way) improved the mapping power and resolution. In addition, the mapping resolution in previously reported studies was limited by low marker density (several hundreds), which only covered a limited number of chromosomal recombination events occurring in biparental crosses (Huang and Han, 2014). In the present study, the high density 55 K rice SNP array genotyping platform was used to increase the mapping resolution.
Comparison of Identified and Reported QTL
In the present study, a total of 21, 30, and 21 putative QTL were detected under treatment with Fe, Zn, and Al, respectively. With respect to Fe tolerance, qFeSL1 and qFeSL3, located on chromosomes 1 and 3, were mapped closely to the leaf bronzing score-based QTL identified by Wan et al. (2005). qFeRDW5 and qFeSDW5 on chromosome 5 co-located with the QTL detected by Dufey et al. (2015) for RDW and MTS. qFeSDW2 co-localized with the QTL detected for SDW and MTS by Shimizu et al. (2005), and qFeSL3 associated with SL (Chr.3: 16.6 Mb) detected in the 8way population was located 1 Mb away from the previously reported OsIRO3 gene (helix-loop-helix family transcription factor) (Zheng et al., 2010). The qFeRL8 gene associated with RL detected in 8way (Chr.8: 0.7 Mb) was located 0.5 Mb away from the IDEF1 gene (Iron Deficiency-responsive Element-binding Factor 1) (Inoue et al., 2009).
The QTL peaks of qZnRDW2, qZnRDW2, and qZnSL4 on chromosomes 2 and 5 were previously reported by Zhang et al. (2013) using reciprocal advanced backcross introgression lines (cross between Lemont and Teqing) for RDW and SDW traits. The Zn tolerance-related QTL located with the genes responsible for the translocation of metal in plants. The qZnSL3 (Chr.8: 6.9 Mb) gene was located 0.8 Mb away from the OsFRDL1 gene (citrate transporter), which is required for the translocation of iron (Yokosho et al., 2009). The qZnRL6 (Chr.6: 30.6 Mb) gene was located 264 kb away from the OsHMA2 gene (heavy metal ATPase 2), a P1B-ATPase that is involved in the root-to-shoot translocation of Zn and Cd in rice (Satoh-Nagasawa et al., 2012; Takahashi et al., 2012). The qZnSL8 (Chr.9: 5.1 Mb) gene was located 1.1 Mb away from the OsZIP4 gene; a zinc-regulated zinc transporter (Ishimaru et al., 2005). The qZnSL4 (Chr.4: 30.1 Mb) gene was positioned at 102 kb away from the OsZIP3 gene; a zinc transporter (Sasaki et al., 2015).
Twelve of the 21 QTL for Al toxicity tolerance co-localized with known genes and previously mapped QTL. Three QTL, namely qAlSL1, qAlRL1, and qAlSDW1, located at 38.2–38.4 on chromosome 1, co-localized with the known gene OsMGT1 at 39,419,964 bp. The OsMGT1 gene acts as an Mg transporter in the roots and its up-regulation is required for conferring Al tolerance in rice (Chen et al., 2012). The qAlRL1.3 (Chr.1: 35.5 Mb) and qAlRL12.2 (Chr.12: 23.3 Mb) co-localized with two QTL, AltTRG 1.1 and AltTRG 12.2, for total root growth (Dufey et al., 2015). Three QTL, qAlRDW3 (Chr.3: 12.8 Mb), qAlSDW5 (Chr.5: 5.4 Mb), and qAlSDW6 (Chr.6: 21.1 Mb) co-localized with the genes LOC_Os03g21950, LOC_Os05g09440, and LOC_Os06g36450, respectively. These genes constitute rice orthologs of a maize isocitrate lyase, which is an a priori candidate gene associated with Al tolerance in maize (Krill et al., 2010). qAlRRL2 (Chr.2: 31.6 Mb) was found to co-localize with the gene LOC_Os02g51930, while qAlSL3 (Chr.3: 35.5 Mb) localized with the Os03g0760800; both of which were detected by microarray analysis using the art1 mutant and wild-type rice (Yamaji et al., 2009). The qAlSDW9 (Chr.9: 14.7 Mb) and qAlRSL11 (Chr.11: 5.9 Mb) genes co-localized with two QTL, namely qRRE-9 and qRRE-11, detected for relative root elongation via biparental linkage mapping (Xue et al., 2006a,b). The QTL qFeSL1 (38.4 Mb, p = 8.9E-13 in DC12 and RMPRIL), qZnSL1(38.4 Mb, p = 9.2E-14 in 8way), and qAlSL1 (38.4 Mb, p = 5.1E-15 in RMPRIL) associated with shoot length at seedling stage under three metal conditions were located in the region harboring the QTL for plant height (Lee et al., 2014), seedling shoot length (Abe et al., 2012) and seed dormancy (Ye et al., 2015) using biparental and plant height MAGIC populations (Meng et al., 2016a,b).
Multi-Trait QTL for Tolerance to Fe, Zn, and Al Toxicity
Thirty-three of the identified QTL in the present study occurred in 12 regions on chromosomes 1, 2, 3, 4, 6, 8, and 9, each of which harbor QTL for more than two metal conditions (Figure 3). Five chromosomal regions were repeatedly covered by overlapping QTL for Fe and Zn stress. This is believed to be caused by the strong correlation observed between Fe and Zn stress tolerance in all the populations (Supplementary Table S2). Hence, it is plausible that the QTL for Fe and Zn were identified in the same QTL cluster. In previous QTL analyses it has been observed that the QTL for significantly correlated traits are usually located in the same chromosomal region. Two Zn toxicity tolerance-related QTL, QSdw2a and QSdw5, were mapped together with the Fe toxicity tolerance QTL (Zhang et al., 2013). One Fe toxicity tolerance QTL (qFRSDW11) and three Zn toxicity tolerance QTL (qZRRDW11, qZRTDW11, and qZRSDW11-1) were previously mapped together (Liu et al., 2016). In studies of tetraploid and hexaploid wheat, a grain Zn QTL on chromosome 2B co-localized with a grain Fe QTL, suggesting the possibility of simultaneous improvement of Fe and Zn tolerance (Velu et al., 2017). OsIRT1 (iron-regulated metal transporter) is not only a functional metal transporter for iron, and also involve as transporter for Zn and Cd (Lee and An, 2009). OsYSL2 is a rice metal-NA transporter that is responsible for the phloem transport of iron and manganese, including the translocation of iron and manganese into the grain (Koike et al., 2004). Expression of a rice NAS gene, OsNAS3, led to increased tolerance to Fe and Zn deficiencies and to excess metal (Zn, Cu, and Ni) toxicities (Lee and An, 2009). OZT1 confers plant tolerance to Zn and Cd ions (Lan et al., 2013). P1B-ATPases (also known as Heavy Metal ATPases: HMAs) are energized by ATP hydrolysis, and translocate heavy metals (Zn, Co, Cu, Cd, and Pb) out of cytoplasm (to plasma membrane and into vacuole) and thus play important roles in their transport, compartmentalization and detoxification. OsHMA2 transporter is involved in root-to-shoot translocation of Zn and Cd in rice (Satoh-Nagasawa et al., 2012; Takahashi et al., 2012). OsHMA3 can reduce the toxicity of Cd to rice seedling and maintains Zn balance in the rice stem (Sasaki et al., 2014). OsHMA4 is a causal gene for quantitative trait locus controlling Cu accumulation in rice grain (Huang et al., 2016). Heavy metal P-type ATPase, OsHMA5 and OsHMA4, involves in xylem loading of Cu in rice (Deng et al., 2013; Huang et al., 2016). In addition, more overlapping regions were detected for Fe and Zn tolerance QTL compared to previous studies (Zhang et al., 2013; Liu et al., 2016). A total of three and six multi-trait QTL were identified under three metal conditions with extremely significant values, p = 7.4E-7 and 5.1E-15, and were closely positioned (MT1.1 for SL and RL; MT1.2 for SL, RL, and SDW) at 35.5 Mb and 38.4 Mb of chromosome 1, respectively. The direction of the effect of all the clustered QTL detected for different tolerance traits were always equivalent, which may be caused by the pleiotropic effects of the same gene. Genetic overlaps for tolerance to different stresses have been reported in various stress conditions, including salt and drought (Wang et al., 2012) and blast resistance and drought (Xiong and Yang, 2003). These two aforementioned regions were previously reported to be associated with plant height using the same MAGIC populations (Meng et al., 2016a,b) as well as seedling shoot length (Abe et al., 2012). The 13 promising lines with MTS = 1 were selected under both Fe and Zn conditions, they are all from 8way populations. In our previous study, we also found that 8way was more powerful than the DC1 and DC2 populations for QTL identification useful for breeding (Meng et al., 2016a). The 13 ILs had an average higher RRL than average of eight parents by 29.5% (27.6%) under the Fe conditions and by 27.6% (22.3%) under Zn stress, respectively. The 13 ILS could be used as resistant donors in for breeding. For qFeMTS2.1, all lines had the same favorable allele from parental line A, C, D, E, F and G. The results indicated that the MAGIC populations are ideal material for genetic study and marker-assisted breeding (MAB), showing a tight integration of genetic research and breeding application in rice. Genetically overlapping loci can be easily exploited in the development of cultivars with tolerance to multiple metal toxicities, as it simplifies the process of MAB and is also associated with reduced costs.
Conclusion
The present study has identified the QTL associated with the toxicity tolerance of rice to three essential metal (Fe, Zn, and Al). As resistance cannot be measured directly, several parameters such as MTS and decreased biomass production were selected as indicators. A total of 21, 30, and 21 QTL were detected for traits related to Fe, Zn, and Al toxicity tolerance, respectively. Twenty-seven of the 72 QTL are in close proximity of previously reported QTL/genes for metal toxicity tolerance. Furthermore, three clusters MT1.1 (chr.1: 35.4–36.3 Mb), MT1.2 (chr.1: 35.4–36.3 Mb), and MT3.2 (chr.3: 35.4–36.2 Mb) were identified under all three metal conditions. The regions of the end of chromosomes 1 and 3 may play important roles in ion homeostasis and the maintenance of high biomass when rice is grown under different metal stress conditions. These results provide an opportunity to develop novel metal tolerant rice varieties via MAS.
Author Contributions
QQ and GY designed the experiment; LM, XZ, and KP performed all the phenotypic evaluation; LM, BW, and XZ performed analysis and interpretation of the data; LM and GY drafted the manuscript; all authors revised the paper and approved the final version to be published.
Funding
This research was financially supported by the CAAS Innovative Team Award to GY's team, Shenzhen Science and Technology Projects (No. JSGG20160608160725473 to QQ), the National Natural Science Foundation of China (No. 31601286 to LM), China Postdoctoral Science Foundation (No. 2016M590160 to LM), and Dapeng district industry development special funds (No. KY20150203 to LM).
Conflict of Interest Statement
The authors declare that the research was conducted in the absence of any commercial or financial relationships that could be construed as a potential conflict of interest.
The reviewer LG declared a shared affiliation, with no collaboration, with one of the authors QQ to the handling Editor.
Acknowledgments
We acknowledge the Dr. Zhikang Li and his team from the Chinese Academy of Agricultural Sciences (CAAS) for their generous help in Al toxicity screening.
Supplementary Material
The Supplementary Material for this article can be found online at: https://www.frontiersin.org/articles/10.3389/fpls.2017.01822/full#supplementary-material
Supplementary Figure S1. Genome-wide association mapping for Fe tolerance in DC1 (A), DC2 (B), 8way (C), DC12 (D), and RMPRIL (E) populations. Manhattan plots for Fe tolerance at the seedling stage (red, khaki, blue, magenta, and green dots represent significant loci for traits RDW (RRDW), RL (RRL), SDW (RSDW), SL (RSL) and MTS in Fe stress condition, respectively) are on the left side of (A–E), horizontal short dash line on the Manhattan plot indicates the genome-wide significance threshold p ≤ 0.0001; Quantile-Quantile plots for Fe tolerance are on the right side of (A–E).
Supplementary Figure S2. Genome-wide association mapping for Zn tolerance in DC1 (A), DC2 (B), 8way (C), DC12 (D), and RMPRIL (E) populations. Manhattan plots for Zn tolerance at the seedling stage (red, khaki, blue, magenta, and green dots represent significant loci for traits RDW (RRDW), RL (RRL), SDW (RSDW), SL (RSL), and MTS in Zn stress condition, respectively) are on the left side of (A–E), horizontal short dash line on the Manhattan plot indicates the genome-wide significance threshold p ≤ 0.0001; Quantile-Quantile plots for Zn tolerance are on the right side of (A–E).
Supplementary Figure S3. Genome-wide association mapping for Al tolerance in DC1 (A), DC2 (B), 8way (C), DC12 (D), and RMPRIL (E) populations. Manhattan plots for Al tolerance at the seedling stage (red, khaki, blue, magenta, and green dots represent significant loci for traits RDW (RRDW), RL (RRL), SDW (RSDW), and SL (RSL) in Al stress condition, respectively) are on the left side of (A–E), horizontal short dash line on the Manhattan plot indicates the genome-wide significance threshold p ≤ 0.0001; Quantile-Quantile plots for Al tolerance are on the right side of (A–E).
Supplementary Table S1. Summary of the SNP selection procedure for the construction of the genetic map.
Supplementary Table S2. Correlation coefficients between different traits estimated under Fe, Zn, and Al conditions in the DC1, DC2, and 8way populations.
References
Abe, A., Takagi, H., Fujibe, T., Aya, K., Kojima, M., Sakakibara, H., et al. (2012). OsGA20ox1, a candidate gene for a major QTL controlling seedling vigor in rice. Theor. Appl. Genet. 125, 647–657. doi: 10.1007/s00122-012-1857-z
Audebert, A., and Fofana, M. (2009). Rice yield gap due to iron toxicity in West Africa. J. Agron. Crop Sci. 195, 66–76. doi: 10.1111/j.1439-037X.2008.00339.x
Bandillo, N., Raghavan, C., Muyco, P. A., Sevilla, M. A. L., Lobina, I. T., Dilla-Ermita, C. J., et al. (2013). Multi-parent advanced generation inter-cross (MAGIC) populations in rice: progress and potential for genetics research and breeding. Rice 6:11. doi: 10.1186/1939-8433-6-11
Becker, M., and Asch, F. (2005). Iron toxicity in rice conditions and management concepts. J. Plant Nutr. Soil Sci. 168, 558–573. doi: 10.1002/jpln.200520504
Bradbury, P. J., Zhang, Z., Kroon, D. E., Casstevens, T. M., Ramdoss, Y., and Buckler, E. S. (2007). TASSEL: software for association mapping of complex traits in diverse samples. Bioinformatics 23, 2633–2635. doi: 10.1093/bioinformatics/btm308
Chen, Z. C., Yamaji, N., Motoyama, R., Nagamura, Y., and Ma, J. F. (2012). Up-Regulation of a magnesium transporter gene OsMGT1 is required for conferring Aluminum tolerance in Rice. Plant Physiol. 159, 1624–1633. doi: 10.1104/pp.112.199778
Coles, N. D., McMullen, M. D., Balint-Kurti, P. J., Pratt, R. C., and Holland, J. B. (2010). Genetic control of photoperiod sensitivity in maize revealed by joint multiple population analysis. Genetics 184, 799–812. doi: 10.1534/genetics.109.110304
Deng, F. L., Yamaji, N., Xia, J. X., and Ma, J. F. (2013). A member of the heavy metal P-type ATPase OsHMA5 is involved in xylem loading of copper in rice. Plant Physiol. 163, 1353–1362. doi: 10.1104/pp.113.226225
Dong, Y. J., Ogawa, T., Lin, D. Z., Koh, H.-J., Kamiunten, H., Matsuo, M., et al. (2006). Molecular mapping of quantitative trait loci for zinc toxicity tolerance in rice seedling (Oryza sativa L.). F. Crop. Res. 95, 420–425. doi: 10.1016/j.fcr.2005.03.005
Dufey, I., Draye, X., Lutts, S., Lorieux, M., Martinez, C., and Bertin, P. (2015). Novel QTLs in an interspecific backcross Oryza sativa×Oryza glaberrima for resistance to iron toxicity in rice. Euphytica 204, 609–625. doi: 10.1007/s10681-014-1342-7
Dufey, I., Hakizimana, P., Draye, X., Lutts, S., and Bertin, P. (2009). QTL mapping for biomass and physiological parameters linked to resistance mechanisms to ferrous iron toxicity in rice. Euphytica 167, 143–160. doi: 10.1007/s10681-008-9870-7
Dufey, I., Hiel, M. P., Hakizimana, P., Draye, X., Lutts, S., Koné, B., et al. (2012). Multienvironment quantitative trait loci mapping and consistency across environments of resistance mechanisms to ferrous iron toxicity in rice. Crop Sci. 52, 539–550. doi: 10.2135/cropsci2009.09.0544
Dufey, I., Mathieu, A.-S., Draye, X., Lutts, S., and Bertin, P. (2014). Construction of an integrated map through comparative studies allows the identification of candidate regions for resistance to ferrous iron toxicity in rice. Euphytica 203, 59–69. doi: 10.1007/s10681-014-1255-5
Famoso, A. N., Zhao, K., Clark, R. T., Tung, C.-W., Wright, M. H., Bustamante, C., et al. (2011). Genetic architecture of aluminum tolerance in rice (Oryza sativa) determined through Genome-Wide Association Analysis and QTL mapping. PLoS Genet. 7:e1002221. doi: 10.1371/journal.pgen.1002221
Fukuda, A., Shiratsuchi, H., Fukushima, A., Yamaguchi, H., Mochida, H., Terao, T., et al. (2012). Detection of chromosomal regions affecting iron concentration in rice shoots subjected to excess ferrous iron using chromosomal segment substitution lines between Japonica and Indica. Plant Prod. Sci. 15, 183–191. doi: 10.1626/pps.15.183
Huang, C. F., Yamaji, N., Chen, Z. C., and Ma, J. F. (2012). A tonoplast-localized half-size ABC transporter is required for internal detoxification of aluminum in rice. Plant J. 69, 857–867. doi: 10.1111/j.1365-313X.2011.04837.x
Huang, C. F., Yamaji, N., Mitani, N., Yano, M., Nagamura, Y., and Ma, J. F. (2009). A bacterial-type ABC transporter is involved in aluminum tolerance in rice. Plant Cell 21, 655–667. doi: 10.1105/tpc.108.064543
Huang, X. H., and Han, B. (2014). Natural variations and genome-wide association studies in crop plants. Annu. Rev. Plant Biol. 65, 531–551. doi: 10.1146/annurev-arplant-050213-035715
Huang, X. Y., Deng, F. L., Yamaji, N., Pinson, S. R. M., FujiiKashino, M., Danku, J., et al. (2016). A heavy metal P-type ATPase OsHMA4 prevents copper accumulation in rice grain. Nat. Commun. 7:12138. doi: 10.1038/ncomms12138
Inoue, H., Kobayashi, T., Nozoye, T., Takahashi, M., Kakei, Y., Suzuki, K., et al. (2009). Rice OsYSL15 is an iron-regulated iron(III)-deoxymugineic acid transporter expressed in the roots and is essential for iron upake in early growth of the seedlings. J. Biol. Chem. 284, 3470–3479. doi: 10.1074/jbc.M806042200
Ishimaru, Y., Suzuki, M., Kobayashi, T., Takahashi, M., Nakanishi, H., Mori, S., et al. (2005). OsZIP4, a novel zinc-regulated zinc transporter in rice. J. Exp. Bot. 56, 3207–3214. doi: 10.1093/jxb/eri317
Kobayashi, T., Itai, R. N., Ogo, Y., Kakei, Y., Nakanishi, H., Takahashi, M., et al. (2009). The rice transcription factor IDEF1 is essential for the early response to iron deficiency, and induces vegetative expression of late embryogenesis abundant genes. Plant J. 60, 948–961. doi: 10.1111/j.1365-313X.2009.04015.x
Kobayashi, T., Ogo, Y., Itai, R. N., Nakanishi, H., Takahashi, M., Mori, S., et al. (2007). The transcription factor IDEF1 regulates the response to and tolerance of iron deficiency in plants. Proc. Natl. Acad. Sci. U.S.A. 104, 19150–19155. doi: 10.1073/pnas.0707010104
Koike, S., Inoue, H., Mizuno, D., Takahashi, M., Nakanishi, H., Mori, S., et al. (2004). OsYSL2 is a rice metal-nicotianamine transporter that is regulated by iron and expressed in the phloem. Plant J. 39, 415–424. doi: 10.1111/j.1365-313X.2004.02146.x
Krill, A. M., Kirst, M., Kochian, L. V., Buckler, E. S., and Hoekenga, O. A. (2010). Association and linkage analysis of aluminum tolerance genes in maize. PLoS ONE 5:e9958. doi: 10.1371/journal.pone.0009958
Lan, H. X., Wang, Z. F., Wang, Q. H., Wang, M. M., Bao, Y. M., Huang, J., et al. (2013). Characterization of a vacuolar zinc transporter OZT1 in rice (Oryza sativa L.). Mol. Biol. Rep. 40, 1201–1210. doi: 10.1007/s11033-012-2162-2
Lee, S., and An, G. (2009). Over-expression of OsIRT1 leads to increased iron and zinc accumulations in rice. Plant, Cell Environ. 32, 408–416. doi: 10.1111/j.1365-3040.2009.01935.x
Lee, S., Jia, M. H., Jia, Y. L., and Liu, G. J. (2014). Tagging quantitative trait loci for heading date and plant height in important breeding parents of rice (Oryza sativa). Euphytica 197, 191–200. doi: 10.1007/s10681-013-1051-7
Li, X. F., Liu, Z. X., Lu, D. B., Liu, Y. Z., Mao, X. X., Li, Z. X., et al. (2013). Development and evaluation of multi-genotype varieties of rice derived from MAGIC lines. Euphytica 192, 77–86. doi: 10.1007/s10681-013-0879-1
Liu, H., Soomro, A., Zhu, Y. J., Qiu, X. J., Chen, K., Zheng, T., et al. (2016). QTL underlying iron and zinc toxicity tolerances at seedling stage revealed by two sets of reciprocal introgression populations of rice (Oryza sativa L). Crop J. 4, 280–289. doi: 10.1016/j.cj.2016.05.007
Ma, J. F., Chen, Z. C., and Shen, R. F. (2014). Molecular mechanisms of Al tolerance in gramineous plants. Plant Soil 381, 1–12. doi: 10.1007/s11104-014-2073-1
Ma, J. F., Shen, R. F., Zhao, Z. Q., Wissuwa, M., Takeuchi, Y., Ebitani, T., et al. (2002). Response of rice to Al stress and identification of quantitative trait loci for Al tolerance. Plant Cell Physiol. 43, 652–659. doi: 10.1093/pcp/pcf081
Mao, C. Z., Yang, L., Zheng, B. S., Wu, Y. R., Liu, F. Y., Yi, K. K., et al. (2004). Comparative mapping of QTLs for Al tolerance in rice and identification of positional Al-induced genes. J. Zhejiang Univ. 5, 634–643. doi: 10.1631/jzus.2004.0634
Marmiroli, M., Pietrini, F., Maestri, E., Zacchini, M., Marmiroli, N., and Massacci, A. (2011). Growth, physiological and molecular traits in Salicaceae trees investigated for phytoremediation of heavy metals and organics. Tree Physiol. 31, 1319–1334. doi: 10.1093/treephys/tpr090
Matthus, E., Wu, L. B., Ueda, Y., Höller, S., Becker, M., and Frei, M. (2015). Loci, genes, and mechanisms associated with tolerance to ferrous iron toxicity in rice (Oryza sativa L.). Theor. Appl. Genet. 128, 2085–2098. doi: 10.1007/s00122-015-2569-y
Meng, L. J., Guo, L. B., Ponce, K., Zhao, X. Q., and Ye, G. Y. (2016a). Characterization of three Indica rice multiparent advanced generation intercross (MAGIC) populations for quantitative trait loci identification. Plant Genome 9, 1–14. doi: 10.3835/plantgenome2015.10.0109
Meng, L. J., Zhao, X. Q., Ponce, K., Ye, G. Y., and Leung, H. (2016b). QTL mapping for agronomic traits using multi-parent advanced generation inter-cross (MAGIC) populations derived from diverse elite indica rice lines. F. Crop. Res. 189, 19–42. doi: 10.1016/j.fcr.2016.02.004
Nguyen, B. D., Brar, D. S., Bui, B. C., Nguyen, T. V., Pham, L. N., and Nguyen, H. T. (2003). Identification and mapping of the QTL for aluminum tolerance introgressed from the new source, Oryza Rufipogon Griff., into indica rice (Oryza sativa L.). Theor. Appl. Genet. 106, 583–593. doi: 10.1007/s00122-002-1072-4
Nguyen, V. T., Burow, M. D., Nguyen, H. T., Le, B. T., Le, T. D., and Paterson, A. H. (2001). Molecular mapping of genes conferring aluminum tolerance in rice (Oryza sativa L.). Theor. Appl. Genet. 102, 1002–1010. doi: 10.1007/s001220000472
Nguyen, V., Nguyen, B., Sarkarung, S., Martinez, C., Paterson, A., and Nguyen, H. (2002). Mapping of genes controlling aluminum tolerance in rice: comparison of different genetic backgrounds. Mol. Genet. Genomics 267, 772–780. doi: 10.1007/s00438-002-0686-1
Ouyang, Y., Zeng, F., Zhuang, J., Yu, S., Zhu, L., Jin, Q., et al. (2007). Genetic analysis of genotype × iron nutrition interaction on coleoptile elongation rate in rice (Oryza sativa L.). Euphytica 156, 311–318. doi: 10.1007/s10681-007-9374-x
Panda, S. K., Baluška, F., and Matsumoto, H. (2009). Aluminum stress signaling in plants. Plant Signal. Behav. 4, 592–597. doi: 10.4161/psb.4.7.8903
R Development Core Team (2016). R: A Language and Environment for Statistical Computing. Vienna: R foundation for statistical computing.
Rout, G. R., and Das, P. (2003). Effect of metal toxicity in plant growth and metabolism: I. Zinc. Agronomie 23, 3–11. doi: 10.1051/agro:2002073
Ruengphayak, S., Ruanjaichon, V., Saensuk, C., Phromphan, S., Tragoonrung, S., Kongkachuichai, R., et al. (2015). Forward screening for seedling tolerance to Fe toxicity reveals a polymorphic mutation in ferric chelate reductase in rice. Rice 8:3. doi: 10.1186/s12284-014-0036-z
Sasaki, A., Yamaji, N., and Ma, J. F. (2014). Overexpression of OsHMA3 enhances Cd tolerance and expression of Zn transporter genes in rice. J. Exp. Bot. 65, 6013–6021. doi: 10.1093/jxb/eru340
Sasaki, A., Yamaji, N., Mitani-Ueno, N., Kashino, M., and Ma, J. F. (2015). A node-localized transporter OsZIP3 is responsible for the preferential distribution of Zn to developing tissues in rice. Plant J. 84, 374–384. doi: 10.1111/tpj.13005
Satoh-Nagasawa, N., Mori, M., Nakazawa, N., Kawamoto, T., Nagato, Y., Sakurai, K., et al. (2012). Mutations in rice (Oryza sativa) heavy metal ATPase 2 (OsHMA2) restrict the translocation of zinc and cadmium. Plant Cell Physiol. 53, 213–224. doi: 10.1093/pcp/pcr166
Shimizu, A., Guerta, C. Q., Gregorio, G. B., Kawasaki, S., and Ikehashi, H. (2005). QTLs for nutritional contents of rice seedlings (Oryza sativa L.) in solution cultures and its implication to tolerance to iron-toxicity. Plant Soil 275, 57–66. doi: 10.1007/s11104-004-4683-5
Steinhoff, J., Liu, W., Maurer, H. P., Würschum, T., Longin, C. F. H., Ranc, N., et al. (2011). Multiple-line cross quantitative trait locus mapping in european elite maize. Crop Sci. 51, 2505–2516. doi: 10.2135/cropsci2011.03.0181
Takahashi, R., Ishimaru, Y., Shimo, H., Ogo, Y., Senoura, T., Nishizawa, N. K., et al. (2012). The OsHMA2 transporter is involved in root-to-shoot translocation of Zn and Cd in rice. Plant. Cell Environ. 35, 1948–1957. doi: 10.1111/j.1365-3040.2012.02527.x
Tanaka, A., and Navasero, S. A. (2012). Aluminum toxicity of the rice plant under water culture conditions. Soil Sci. Plant Nutr. 12, 9–14. doi: 10.1080/00380768.1966.10431183
Turner, S. D. (2014). qqman: an R package for visualizing GWAS results using QQ and manhattan plots. bioRxiv, 005165. doi: 10.1101/005165
Velu, G., Tutus, Y., Gomez-Becerra, H. F., Hao, Y., Demir, L., Kara, R., et al. (2017). QTL mapping for grain zinc and iron concentrations and zinc efficiency in a tetraploid and hexaploid wheat mapping populations. Plant Soil 411, 81–99. doi: 10.1007/s11104-016-3025-8
Wan, J. L., Zhai, H. Q., and Wan, J. M. (2005). Mapping of QTLs for ferrous iron toxicity tolerance in rice (Oryza sativa L.). Acta Genet. Sin. 32, 1156–1166.
Wan, J. L., Zhai, H. Q., Wan, J. M., Yasui, H., and Yoshimura, A. (2003a). Mapping QTL for traits associated with resistance to ferrous iron toxicity in rice (Oryza sativa L.), using japonica chromosome segment substitution lines. Acta Genet. Sin. 30, 893–898.
Wan, J. M., Zhai, H. Q., and Ikehashi, H. (2003b). Detection and analysis of QTLs for ferrous iron toxicity tolerance in rice, Oryza sativa L. Euphytica 131, 201–206. doi: 10.1023/A:1023915710103
Wang, Y., Zang, J. P., Sun, Y., Ali, J., Xu, J. L., and Li, Z. K. (2012). Identification of genetic overlaps for salt and drought tolerance using simple sequence repeat markers on an advanced backcross population in rice. Crop Sci. 52, 1583–1592. doi: 10.2135/cropsci2011.12.0628
Wu, L. B., Shhadi, M. Y., Gregorio, G., Matthus, E., Becker, M., and Frei, M. (2014). Genetic and physiological analysis of tolerance to acute iron toxicity in rice. Rice 7:8. doi: 10.1186/s12284-014-0008-3
Wu, P., Hu, B., Liao, C. Y., Zhu, J. M., Wu, Y. R., Senadhira, D., et al. (1998). Characterization of tissue tolerance to iron by molecular markers in different lines of rice. Plant Soil 203, 217–226. doi: 10.1023/A:1004321218387
Wu, P., Liao, C. Y., Hu, B., Yi, K. K., Jin, W. Z., Ni, J. J., et al. (2000). QTLs and epistasis for aluminum tolerance in rice (Oryza sativa L.) at different seedling stages. Theor. Appl. Genet. 100, 1295–1303. doi: 10.1007/s001220051438
Wu, P., Luo, A., Zhu, J., Yang, J., Huang, N., and Senadhira, D. (1997). Molecular markers linked to genes underlying seedling tolerance for ferrous iron toxicity. Plant Soil 196, 317–320. doi: 10.1023/A:1004288427140
Xia, J. X., Yamaji, N., Kasai, T., and Ma, J. F. (2010). Plasma membrane-localized transporter for aluminum in rice. Proc. Natl. Acad. Sci. U.S.A. 107, 18381–18385. doi: 10.1073/pnas.1004949107
Xiong, L. Z., and Yang, Y. N. (2003). Disease resistance and abiotic stress tolerance in rice are inversely modulated by an abscisic acid-inducible mitogen-activated protein kinase. Plant Cell 15, 745–759. doi: 10.1105/tpc.008714.ported
Xue, Y., Jiang, L., Su, N., Wang, J. K., Deng, P., Ma, J. F., et al. (2007). The genetic basic and fine-mapping of a stable quantitative-trait loci for aluminium tolerance in rice. Planta 227, 255–262. doi: 10.1007/s00425-007-0613-0
Xue, Y., Wan, J. M., Jiang, L., Liu, L. L., Su, N., Zhai, H. Q., et al. (2006a). QTL analysis of aluminum resistance in rice (Oryza sativa L.). Plant Soil 287, 375–383. doi: 10.1007/s11104-006-9086-3
Xue, Y., Wan, J. M., Jiang, L., Wang, C. M., Liu, L. L., Zhang, Y. M., et al. (2006b). Identification of quantitative trait loci associated with aluminum tolerance in rice (Oryza sativa L.). Euphytica 150, 37–45. doi: 10.1007/s10681-006-9089-4
Yamaji, N., Huang, C. F., Nagao, S., Yano, M., Sato, Y., Nagamura, Y., et al. (2009). A zinc finger transcription factor ART1 regulates multiple genes implicated in aluminum tolerance in rice. Plant Cell 21, 3339–3349. doi: 10.1105/tpc.109.070771
Ye, H., Feng, J. H., Zhang, L. H., Zhang, J. F., Mispan, M. S., Cao, Z., et al. (2015). Map-based cloning of qSD1−2 identified a gibberellin synthesis gene regulating the development of endosperm-imposed dormancy in rice. Plant Physiol. 169, 2152–2165. doi: 10.1104/pp.15.01202
Yokosho, K., Yamaji, N., and Ma, J. F. (2011). An Al-inducible MATE gene is involved in external detoxification of Al in rice. Plant J. 68, 1061–1069. doi: 10.1111/j.1365-313X.2011.04757.x
Yokosho, K., Yamaji, N., Ueno, D., Mitani, N., and Ma, J. F. (2009). OsFRDL1 is a citrate transporter required for efficient translocation of iron in rice. Plant Physiol. 149, 297–305. doi: 10.1104/pp.108.128132
Yoshida, S., Forni, D.A., and Cock, J. H. G. K. (1976). Laboratory Manual for Plant Physiological Studies of Rice, 3rd Edn. Manila: International Rice Research Institute.
Zhang, J., Aijaz, A. S., Chai, L., Cui, Y. R., Wang, X. Q., Zheng, T., et al. (2013). Mapping of QTL for iron and zinc toxicity tolerance at seedling stage using a set of reciprocal introgression lines of rice. Acta Agron. Sin. 39, 1754–1765. doi: 10.3724/SP.J.1006.2013.01754
Zhang, P., Zhong, K. Z., Liu, X. D., Tong, H. H., Qasim, M., and Li, J. Q. (2016). Association mapping for aluminum tolerance in a core collection of rice landraces. Front. Plant Sci. 7:1415. doi: 10.3389/fpls.2016.01415
Zhao, C. F., Zhou, L. H., Ding, D., Zhang, Y. D., Zhao, Q. Y., Xin, Y., et al. (2013). Mapping of quantitative trait loci associated with ferrous iron toxicity tolerance at seedling stage based on chromosome segment substitution line in rice. Jiangsu J. Agric. Sci. 29, 461–467. doi: 10.3969/j.issn.1000-4440.2013.03.001
Keywords: metal tolerance, seedling stage, MAGIC population, association mapping, rice
Citation: Meng L, Wang B, Zhao X, Ponce K, Qian Q and Ye G (2017) Association Mapping of Ferrous, Zinc, and Aluminum Tolerance at the Seedling Stage in Indica Rice using MAGIC Populations. Front. Plant Sci. 8:1822. doi: 10.3389/fpls.2017.01822
Received: 05 August 2017; Accepted: 09 October 2017;
Published: 26 October 2017.
Edited by:
Meixue Zhou, University of Tasmania, AustraliaReviewed by:
Longbiao Guo, China National Rice Research Institute (CAAS), ChinaMichael Frei, University of Bonn, Germany
Copyright © 2017 Meng, Wang, Zhao, Ponce, Qian and Ye. This is an open-access article distributed under the terms of the Creative Commons Attribution License (CC BY). The use, distribution or reproduction in other forums is permitted, provided the original author(s) or licensor are credited and that the original publication in this journal is cited, in accordance with accepted academic practice. No use, distribution or reproduction is permitted which does not comply with these terms.
*Correspondence: Guoyou Ye, g.ye@irri.org
Qian Qian, qianqian188@hotmail.com