 María D. Serret1
 Salima Yousfi1
 Rubén Vicente1
 María C. Piñero2
 Ginés Otálora-Alcón2
 Francisco M. del Amor2
 José L. Araus1*
- 1Departament de Biologia Evolutiva, Ecologia i Ciències Ambientals, Universitat de Barcelona, Barcelona, Spain
- 2Departamento de Hortofruticultura, Instituto Murciano de Investigación y Desarrollo Agrario y Alimentario, La Alberca-Murcia, Spain
Sweet pepper is among the most widely cultivated horticultural crops in the Mediterranean basin, being frequently grown hydroponically under cover in combination with CO2 fertilization and water conditions ranging from optimal to suboptimal. The aim of this study is to develop a simple model, based on the analysis of plant stable isotopes in their natural abundance, gas exchange traits and N concentration, to assess sweet pepper growth. Plants were grown in a growth chamber for near 6 weeks. Two [CO2] (400 and 800 μmol mol−1), three water regimes (control and mild and moderate water stress) and four genotypes were assayed. For each combination of genotype, [CO2] and water regime five plants were evaluated. Water stress applied caused significant decreases in water potential, net assimilation, stomatal conductance, intercellular to atmospheric [CO2], and significant increases in water use efficiency, leaf chlorophyll content and carbon isotope composition, while the relative water content, the osmotic potential and the content of anthocyanins did change not under stress compared to control conditions support this statement. Nevertheless, water regime affects plant growth via nitrogen assimilation, which is associated with the transpiration stream, particularly at high [CO2], while the lower N concentration caused by rising [CO2] is not associated with stomatal closure. The stable isotope composition of carbon, oxygen, and nitrogen (δ13C, δ18O, and δ15N) in plant matter are affected not only by water regime but also by rising [CO2]. Thus, δ18O increased probably as response to decreases in transpiration, while the increase in δ15N may reflect not only a lower stomatal conductance but a higher nitrogen demand in leaves or shifts in nitrogen metabolism associated with decreases in photorespiration. The way that δ13C explains differences in plant growth across water regimes within a given [CO2], seems to be mediated through its direct relationship with N accumulation in leaves. The changes in the profile and amount of amino acids caused by water stress and high [CO2] support this conclusion. However, the results do not support the use of δ18O as an indicator of the effect of water regime on plant growth.
Introduction
After tomato, sweet pepper is the second largest horticultural product cultivated in the Mediterranean basin in terms of area (del Amor, 2007). Moreover, a significant area is devoted to its cultivation under cover (greenhouses of different categories), and is frequently combined with the application of CO2 fertilization (Piñero et al., 2016). Essentially, a high CO2 concentration ([CO2]) stimulates photosynthesis and may contribute to increasing productivity in greenhouses while palliating environmental problems such as water stress or high temperature. Nevertheless, plant responses to elevated [CO2] may be affected in one or another way as a result of photosynthetic acclimation (Long et al., 2004) or due to differences in growing conditions such as water regime (O'Leary et al., 2015). Thus, some degree of water stress may increase the efficiency of water use, and at the same time positively affect the quality of the final product (López-Marín et al., 2017). However, the interaction of elevated [CO2] with water stress has not been widely studied and there are studies supporting either the positive or the negative effects of elevated [CO2] on water stress tolerance (Medina et al., 2016). Exposure to elevated [CO2] may mitigate the inhibition of photosynthesis under water stress and improve water use efficiency by a positive synergistic effect of both factors on stomatal closure, but can also stimulate oxidative stress and not affect plant growth (Erice et al., 2007, 2014; Bencze et al., 2014; Medina et al., 2016). In addition, plant size may limit the direct physiological effects of elevated [CO2] (Xu et al., 2016). Moreover, some studies indicated that this interaction is highly dependent on the genotypic variability and the severity of water stress (Erice et al., 2014; Medina et al., 2016; Xu et al., 2016).
Therefore, a better understanding of the interactions between high [CO2] and water stress is important for predicting the agricultural consequences of the expected increase in [CO2]. In the case of sweet pepper the genotypic performance and the specific responses to the combinations of [CO2] and water conditions have usually been monitored through photosynthetic and transpirative gas exchange traits (Peñuelas et al., 1995; del Amor et al., 2010). However, the use of methodologies that are able to integrate physiological processes on a larger temporal scale is an alternative that needs exploration. The analysis of the natural abundances of stable isotopes in plant matter may represent an alternative (Dawson et al., 2002; Araus et al., 2008) that is worth exploring.
Carbon isotope composition (δ13C), frequently expressed as discrimination (Δ13C) against the surrounding air, provides information on the effect of growing conditions on photosynthetic carbon assimilation (Farquhar et al., 1982; Condon et al., 1990). Plants discriminate against the heavier carbon isotope (13C) during photosynthesis and the extent of this discrimination depends on the ratio of the intercellular vs. the atmospheric [CO2] (Ci/Ca) in photosynthetic organs (Farquhar et al., 1982, 1989). Since the Ci/Ca ratio depends on the balance between the photosynthetic activity and the stomatal conductance (A/gs) of the plant (Farquhar et al., 1982, 1989; Rebetzke et al., 2002; Condon et al., 2004), when analyzed in plant dry matter Δ13C becomes a time-integrated indicator of the A/gs ratio and therefore of water use efficiency of the plant (Farquhar and Richards, 1984). Under drought stress, the Δ13C (or δ13C) is also a good predictor of stomatal conductance (Condon et al., 2002) and of water input received by the crop (Araus et al., 2003). For growing conditions where the water regime is not the main environmental variable, it remains challenging to assess whether variation in the carbon isotope signature is the result of changes in intrinsic photosynthetic capacity or stomatal conductance (Scheidegger et al., 2000; Farquhar et al., 2007). Due to this, the analysis of the stable oxygen isotope signature in plants may contribute toward understanding the nature of the changes in δ13C (Barbour and Farquhar, 2000).
The oxygen isotope composition (δ18O) in plant tissues can be influenced by three main factors. The first factor is the isotopic composition of the source water taken up by the plant (Roden and Ehleringer, 1999). The second factor is the enrichment in 18O in the leaves due to evaporation in comparison to source water (Pande et al., 1995). The third factor is the fractionation of oxygen isotopes during biochemical reactions involved in the synthesis of organic matter (Farquhar and Lloyd, 1993). Sugars and other metabolites formed in leaves incorporate the leaf water isotopic signal, which is then retained in structural organic compounds, such as cellulose (Barbour, 2007; Gessler et al., 2014). Stomatal conductance plays a crucial role in regulating the water balance of the plant. Providing there is constancy in the δ18O of the water taken up by the plant, the δ18O of plant matter integrates evaporative conditions throughout the life cycle of the plant, and this is largely unaffected by photosynthesis (Barbour and Farquhar, 2000; Farquhar et al., 2007). Therefore, δ18O has been proposed for estimating stomatal conductance and transpiration and thus plant water use in different species (Barbour and Farquhar, 2000; Barbour et al., 2000; Sheshshayee et al., 2005; Farquhar et al., 2007; Cabrera-Bosquet et al., 2009a, 2011; Cernusak et al., 2009a).
Nitrogen is the most growth-limiting nutrient element for plants (Piñero et al., 2016). In fact, the nitrogen isotope composition (δ15N) in plant matter is an indicator of the effect of growing conditions on the nitrogen metabolism of the plant, even though a complete knowledge of the underlying biochemical mechanisms is lacking (Cernusak et al., 2009b; Tcherkez, 2010; Yousfi et al., 2012). The natural abundance of δ15N has been used in sweet pepper to assess the source of nitrogen fertilization (Flores et al., 2007; del Amor and Navarro, 2008). However, to the best of our knowledge, studies on the interactive effect of [CO2] and water regime on the δ15N and δ18O of the plant are scarce.
This study compared the δ13C, δ18O, and δ15N, together with N concentration, of the leaf dry matter of sweet pepper plants growing under different [CO2] and water regimes. Further the stable isotope signatures of these three elements were correlated with plant growth. Moreover, gas exchange and amino acid profiles were measured on similar leaves. The final aim of this study is to produce a single conceptual model, integrating different key physiological traits, that explains the variability in sweet pepper biomass due to growing conditions and genotypic variability. To that end, plants were grown under hydroponic conditions at a relatively low light intensity and mild to moderate water stress, resembling the growing conditions usually experienced, in a mild Mediterranean climate, by sweet pepper plants within commercial plastic/polycarbonate greenhouses adapted to CO2 fertilization and which often include a shadow sheet (Dueck et al., 2006; del Amor and Gómez-López, 2009; del Amor et al., 2010; Pérez-Jiménez et al., 2016).
Materials and Methods
Plant Material and Growth Conditions
The experiment was carried at the Instituto Murciano de Investigación y Desarrollo Agrario y Alimentario (IMIDA), La Alberca, Murcia, Spain. Four sweet pepper (Capsicum annuum L.) cultivars were studied: Tallante (Ta; De Ruiter Vegetable Seeds, Inc.), Coyote (Co; Syngenta Seeds SA), Herminio (He; Syngenta Seeds SA), and Velez (Ve; Enza Zaden BV). These cultivars are commonly used in commercial greenhouses in SE Spain (Almeria and Murcia regions). Seedlings were transplanted to 5-l black containers filled with coconut coir fiber (Pelemix, Alhama de Murcia, Murcia, Spain) and acclimated during 5 days to the new conditions. Then three irrigation treatments were applied for 41 days: the control (an amount of 500 ml of nutrient solution was applied every day), mild stress (same amount every 2 days), and moderate stress (same amount every 3 days). Plants were irrigated with a modified Hoagland solution with the following composition in meq L−1; : 12.0; H2: 1.0; : 3.5; K+: 7.0; Ca2+: 4.5; Mg2+: 2.0. Irrigation was supplied via pressure-compensating and anti-drain drippers (2 l h−1) and fresh nutrient solution was applied to avoid salt accumulation, with a minimum of 35% drainage (del Amor and Gómez-López, 2009).
Plants were grown in a climate chamber designed to mimic usual environmental conditions experienced by pepper plants within greenhouses (del Amor et al., 2010), with fully-controlled environmental parameters: 70% RH, 16/8 h day/night photoperiod, 28/16°C and a photosynthetically-active radiation (PAR) of 250 μmol m−2 s−1 provided by a combination of fluorescent lamps (TL-D Master reflex 830 and 840, Philips, the Netherlands) and high-pressure sodium lamps (Son-T Agro, Philips, the Netherlands). Plants were grown at [CO2] of 400 μmol mol−1 (atmospheric [CO2]) and 800 μmol mol−1 (high [CO2]). The [CO2] was regulated by injection of external compressed CO2 (bottle [CO2] ≥ 99.9%), controlled by an infrared gas analyser (Dräger Politron IR CO2, Sweden). For each cultivar within a specific water regime and [CO2], five replications (each consisting in a single plant) were run. Thus, 24 treatments were studied, corresponding to the combination of four cultivars, three irrigation levels, and two [CO2], totalling 120 plants. All the study was done in the same growth chamber. Therefore, the experiment was done consecutively, with the only difference being [CO2]. We carefully verified that the germination and seedling growth conditions were the same (by using a small growth chamber (BINDER KBWF 240, BINDER GmbH, Tuttlingen, Germany), with light, temperature, and RH control. Plants were grown under a randomized complete block design (n = 60).
Photosynthetic and Transpirative Gas Exchange and Chlorophyll Content
At the end of the experimental period, net CO2 assimilation, stomatal conductance, transpiration, and the Ci/Ca ratio were measured in the youngest fully-expanded leaf of five plants per treatment, using a CIRAS-2 portable photosynthesis system (PP Systems, Amesbury, MA, USA) with a PLC6 (U) Automatic Universal Leaf Cuvette of 1.7 cm2. The cuvette provided light (LED) with a photon flux of 800 μmol m−2 s−1, 400 or 800 μmol mol−1 [CO2] and a leaf temperature of 22°C. Water use efficiency (WUE) was determined as the ratio of net CO2 assimilation to transpiration.
The leaf chlorophyll content on an area basis was determined in the same leaves used for gas exchange with a SPAD-502 (Konica-Minolta Sensing, Japan) portable meter. Three measurements were made on each leaf.
Measurement of Tissue Anthocyanins
Anthocyanins were extracted from oven-dried (after a minimum of 72 h at 65°C), ground tissue samples of plant leaves, suspended in acidified methanol (methanol:water:HCl, 79:20:1, by vol.), autoextracted at 0°C for 72 h, centrifuged and absorbance measured at 530 and 657 nm for each supernatant (Mirecki and Teramura, 1984). Anthocyanin concentration was calculated as Ab530 nm-1/3 Ab657 nm g−1 dry matter (Lindoo and Caldwell, 1978).
Leaf Water and Osmotic Potentials and Relative Water Content
The leaf water potential (Ψw) was measured in the same leaves used for gas exchange determinations, using a Scholander pressure chamber (model 3000, Soil Moisture Equipment Corp., Santa Barbara, USA) as reported elsewhere (Turner, 1988). Measurements were performed after gas exchange determinations and then the leaves were put in Eppendorf tubes with holes at the bottom and rapidly frozen. These tubes were then centrifuged twice, at 4,000 g for 4 min (4°C), using an Eppendorf centrifuge so that all sap was extracted from the samples. The osmotic potential (Ψπ) of the leaf sap was assessed with a vapor pressure osmometer (Wescor 5500, Logan, Utah, USA) used to measure the osmolality (mmol kg−1) of the expressed sap; this was converted to osmotic potential according to the Van't Hoff equation: Ψπ (MPa) = −RTC, where R is the gas constant (0.00832 l MPa K−1 mol−1), T is the temperature (293 K) and C is the number of moles of solute in 1 kg of water (= 1 l at 293 K). The leaf relative water content (RWC) was measured on same-age leaves as those used for Ψπ. Three small disks (2.07 cm2) per leaf from each of the six plants were cut and weighed immediately to obtain fresh mass (FM), and then they were placed for 24 h in the dark in a beaker (30 cm3) filled with distilled water. After this, they were reweighed to obtain turgid fresh mass (TM), and dry mass (DM) after drying at 80°C for 48 h. The relative water content (RWC), expressed as a percentage, was calculated as RWC = [(FM–DM)/(TM–DM)] × 100%.
Shoot Biomass
Plants were harvested at the end of the experiment (41 days after transplanting), and 120 plants (five plants per treatment) were analyzed. The aerial parts (thereafter referred as shoot biomass, including leaves plus stems and petioles) were dried and the dry weight determined after a minimum of 72 h at 65°C. The specific leaf area (SLA) was calculated as the ratio between the area and the dry weight of leaf discs of 6.91 cm2.
Leaf N-Total Concentration and Stable Carbon, Nitrogen, and Oxygen Isotope Composition
Total nitrogen concentration and the stable carbon (13C/12C) and (15N/14N) isotope ratios in the whole pool of shoot leaves were measured using an elemental analyser (Flash 1112 EA, ThermoFinnigan, Germany) coupled with an isotope ratio mass spectrometer (Delta C IRMS, ThermoFinnigan, Germany), operating in continuous mode. Samples of 1 mg and reference materials were weighed into tin capsules, sealed, and then loaded into an automatic sampler (ThermoFinnigan, Germany) prior to EA-IRMS analysis. Measurements were carried out at the CCiT (Centres Científics i Tecnològics) of the University of Barcelona. Nitrogen was expressed as a concentration (percent of dry weight). The 13C/12C ratios were expressed in δ notation (Coplen, 2008): δ13C (‰) = (13C/12C)sample/(13C/12C)standard−1, where “sample” refers to plant material and “standard” to international secondary standards of known 13C/12C ratios (IAEA CH7 polyethylene foil, IAEA CH6 sucrose, and USGS 40 L-glutamic acid) calibrated against Vienna Pee Dee Belemnite calcium carbonate (VPDB) with an analytical precision (SD) of 0.10‰. The same δ notation was used for the 15N/14N ratio (δ15N), but in this case using international secondary standards of known 15N/14N ratios (IAEA N1 and IAEA N2 ammonium sulfate and IAEA NO3 potassium nitrate) referred to N2 in air, with an analytical precision of 0.18‰.
For the δ18O, the 18O/16O was determined by an on-line pyrolysis technique using a Thermo-Chemical Elemental Analyser (TC/EA Thermo Quest Finnigan, Germany) coupled with an IRMS (Delta C Finnigan MAT, Germany). Samples of 1 mg were weighed into silver capsules, sealed and oven-dried at 60°C for not less than 72 h to remove moisture and loaded into an automatic sampler. Results were expressed as δ18O values, using two secondary standards (IAEA 601 and IAEA 602) calibrated against Vienna Standard Mean Oceanic Water (VSMOW) (Coplen, 2011); the analytical precision was ≈ 0.25%. Analyses were conducted at Iso-Analytical Limited (Crewe, Cheshire, UK).
Free Amino Acids
The free amino acids were extracted from leaves (frozen at −80°C): the sap was extracted, after vortexing at 5,000 rpm (10 min, 4°C), and analyzed by the AccQ·Tag-ultra ultraperformance liquid chromatography (UPLC) method (Waters, UPLC Amino Acid Analysis Solution, 2006). For derivatization, 70 μl of borate buffer was added to 10 μl of the fruit sap and 20 μl of reagent solution. The reaction mixture was mixed instantly and heated at 55°C for 10 min. After the temperature was lowered, an aliquot of the reaction mixture was used for injection. The column was an Acquity BEH C18 1.7 μm, 2.1–100 mm (Waters), and the wavelengths were set at 266 nm (excitation) and 473 nm (emission). The solvent system consisted of two eluents: (A) AccQ·Tag-ultra eluent A concentrate (5%, v/v) and water (95%, v/v); and (B) AccQ·Tag-ultra eluent B. The following elution gradient procedure was used for the analysis: 0–0.54 min, 99.9% A−0.1% B; 5.74 min, 90.9% A− 9.1% B; 7.74 min, 78.8% A−21.2% B; 8.04 min, 40.4% A−59.6% B; 8.05–8.64 min, 10% A−90% B; 8.73–10 min, 99.9% A−0.1% B. The injection volume was 1 μl, with a flow rate of 0.7 ml min−1. The temperature of the column was maintained at 55°C. External standards (Thermo Scientific) were used for the quantification of the amino acids, and Empower 2 (Waters) software for data acquisition and processing.
Statistical Analysis
Data were subjected to factorial ANOVA to test the effects of the growing conditions ([CO2] and water regime), genotype, and their interactions. Mean comparisons were performed using Tukey's honestly significant difference (HSD) test. A bivariate correlation procedure was used to calculate the Pearson correlation coefficients between the different traits measured. Multiple linear regression (stepwise) analysis was used to analyse the criterion included to explain variation in shoot biomass under different growing conditions. Principal component analysis was produced to analyse the interrelationships among the shoot biomass, leaf nitrogen concentration, and chlorophyll content, the stable isotope composition of C, O, and N, and the gas exchange variables. Data were analyzed using IBM SPSS Statistics 24 (SPSS Inc., Chicago, IL, USA). Figures were created using a Sigma-Plot 11.0 program for Windows (Systat Software Inc., Point Richmond, CA, USA). Finally, we performed path analyses (Li, 1975) to quantify the relative contributions of direct and indirect effects of stable isotopes and other key traits on aboveground biomass. This methodology offers the possibility of building associations between variables that is based on prior knowledge. A path analysis determines simple correlations between independent factors (in this case δ13C), and regresses them on each intermediary (Ci/Ca, gs, δ15N and N concentration) or dependent factor (shoot biomass) to obtain direct effects in the form of partial regression coefficients (i.e., path coefficients). This model was aimed at understanding biomass responses to genotypic differences across water regimes under different levels of [CO2]. A model with a comparative fit index (CFI) (Arbuckle, 1997) with values > 0.9 was taken as indicative of a good fit. Data were analyzed using the Amos Graphics package (IBM SPSS Amos, USA). A clustered heat map of amino acid profile was built using the R statistics environment (R Development Core Team, Vienna, Austria). Additionally, after generating a correlation matrix of all parameters analyzed in R, we performed a network analysis of significant correlations (Pearson correlation coefficient cut-off of 0.7 and P < 0.05) under ambient and elevated [CO2] using Cytoscape software (Shannon et al., 2003).
Results
Effect of Growing Conditions and Genotype on Shoot Biomass
Compared with control plants water stress negatively affected shoot biomass (SB), plant height (PH), and the leaf water potential (Ψw), whereas leaf chlorophyll (LC) content slightly increased and no differences existed in the specific leaf area (SLA), relative water content (RWC), leaf osmotic potential (Ψπ), and anthocyanin content (Table 1). Increasing ambient [CO2] significantly increased SB, PH, LC, anthocyanin, and Ψπ, whereas all the other traits reported in Table 1 decreased. A genotypic effect was significant for all the traits except RWC, anthocyanin, and Ψπ.
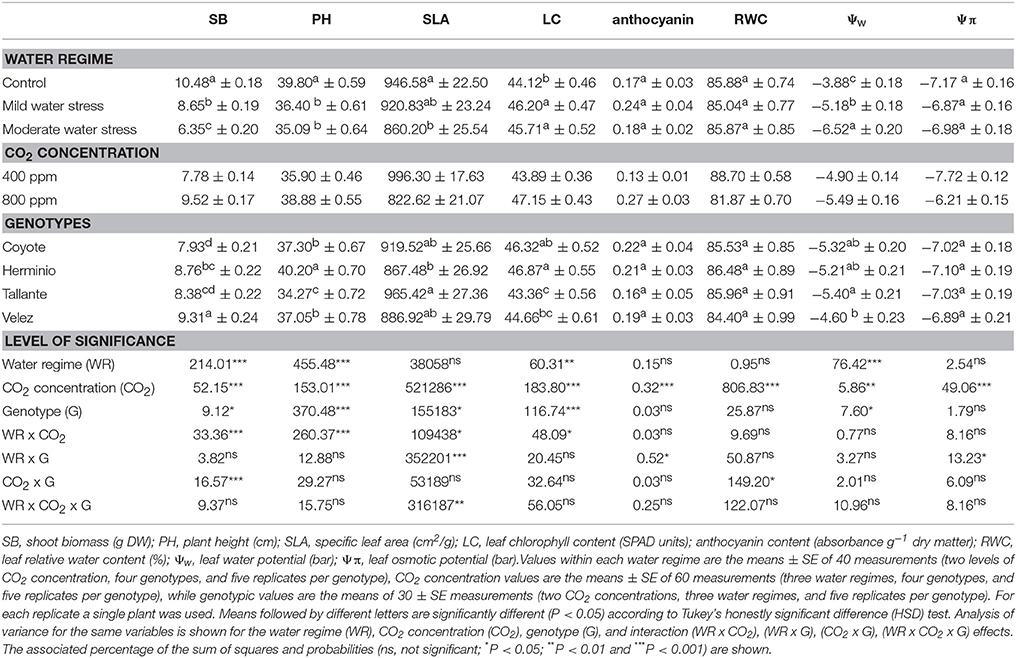
Table 1. Water regime, CO2 concentration and genotype effects on biomass, growth parameters, anthocyanin content, and leaf water status of four sweet pepper genotypes grown under different combinations of CO2 concentration and water supply.
The interactions between water regime (WR) and [CO2] were significant for all the traits of Table 1 except RWC, anthocyanin, and Ψw, meaning that, except for these two traits, the response to water regime differed depending on [CO2]. Most of the interactions of genotypes with growing conditions were not significant, even when it is worth to mention the significant interaction between genotype and [CO2] for SB.
Effect of Growing Conditions and Genotype on Gas Exchange and Stable Isotope Signatures
Water stress significantly decreased the leaf net CO2 assimilation (A), stomatal conductance (gs), the intercellular to ambient CO2 concentration (Ci/Ca), the stable oxygen isotope composition (δ18O) and the nitrogen concentration (N), whereas the water use efficiency (WUE), the stable carbon isotope composition (δ13C), and the stable nitrogen isotope composition (δ15N) increased and no significant differences existed for the transpiration (T) (Table 2). Rising [CO2] significantly increased A, gs, T, Ci/Ca, WUE, and δ18O, whereas N, δ13C and δ15N decreased. The genotypic effect was significant for all traits except A and T. The interaction between WR and [CO2] was significant for all the traits except δ18O (P = 0.060) and T. The interactions between genotype and [CO2] were significant for A, gs, Ci/Ca, and WUE, and near significant for T (P = 0.056), whereas the interaction between genotype and WR were also significant for gs, Ci/Ca, and WUE. Except for an interaction between genotype and WR for δ15N, no interactions between genotype and growing conditions were found.
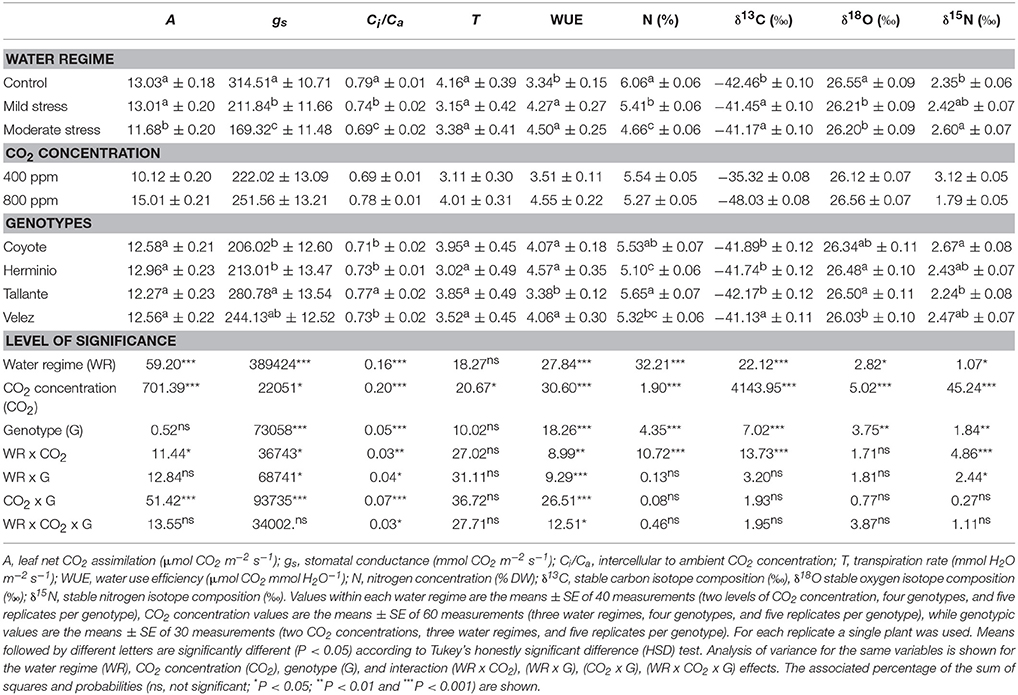
Table 2. Water regime, CO2 concentration, and genotype effects on gas-exchange parameters, carbon, oxygen, and nitrogen isotope composition, and nitrogen concentration of four sweet pepper genotypes grown under different combinations of CO2 concentration and water supply.
Given the significance of the interactions between WR and [CO2] for most of the traits in Tables 1, 2, a subset of traits in these tables was analyzed across water regimes within each [CO2] (Table 3). At atmospheric [CO2] the water regime significantly affected SB, A, gs, Ci/Ca, N, and δ18O, and the effect for δ13C (P = 0.068) and δ15N (P = 0.057) approached significance, whereas at high [CO2] the water regime significantly affected all the traits except δ18O. The genotypic effect at atmospheric [CO2] was significant for all the traits, except δ15N (P = 0.057) and SB, whereas at high [CO2] the genotypic effect was significant for all the traits except δ15N and δ18O. Interactions of genotypes with WR at atmospheric [CO2] were only significant for A, Ci/Ca and δ18O, whereas at high [CO2] no interactions were detected.
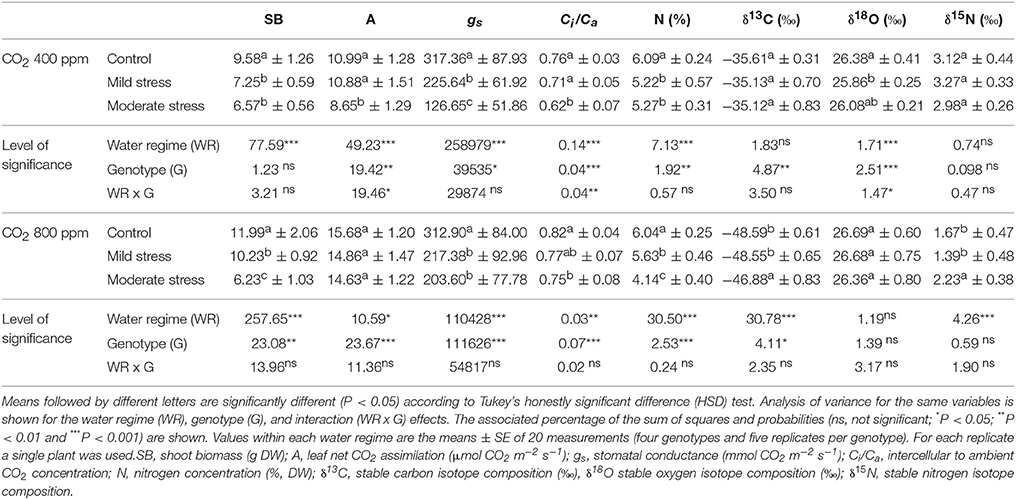
Table 3. Effect of water regime treatments in each CO2 concentration (400 and 800 ppm) on shoot biomass, gas-exchange parameters, nitrogen content, and carbon, oxygen, and nitrogen stable composition.
Relationships of Shoot Biomass with Gas Exchange and Stable Isotopes
The range of A rates measured across the different water conditions at the end of the experiment was only weakly correlated with SB (r = 0.34, P < 0.05) at atmospheric [CO2] and was not correlated at high [CO2] (data not shown). In fact, while A and gs were less affected by water limitation at high compared to atmospheric [CO2], the opposite occurred for leaf growth, where the greatest decrease in biomass occurred at high [CO2].
The single correlations between the signatures of the different isotopes against SB were plotted for each [CO2] level across the three water regimes. δ13C correlated negatively against SB at high [CO2], whereas the negative relationship at atmospheric [CO2] did not reach significance (Figure 1A). By contrast δ18O correlated with SB in a weak, albeit significant, positive manner at atmospheric [CO2], whereas the positive relationship did not reach significance at high [CO2] (Figure 1B). δ15N correlated negatively with SB at high [CO2],whereas no correlation existed at atmospheric [CO2] (Figure 1C). The nitrogen concentration correlated positively with SB at both [CO2] levels (Figure 2C) in a stronger manner than any of the three stable isotopes. In addition, the N concentration correlated negatively with δ13C at atmospheric [CO2] and in a far stronger way at high [CO2] (Figure 2A). Moreover, δ13C correlated with the total shoot nitrogen content (calculated as a SB x N/100) in a weaker manner (r = −0.43 and −0.64, both P < 0.01, for 400 and 800 μmol mol−1 [CO2], respectively) than the nitrogen concentration alone (Figure 2A). In contrast the N concentration correlated negatively with δ15N only at high [CO2] (Figure 2B) and a weak positive correlation existed between nitrogen concentration and δ18O at atmospheric [CO2] (r = 0.33, P < 0.05; data not shown). Moreover, gs correlated positively with the N concentration at both [CO2] levels, and while it also correlated with SB, this was only at atmospheric [CO2] (Figure S1). Ci/Ca correlated with the N concentration and SB in a similar way, but in a somewhat weaker manner than gs.
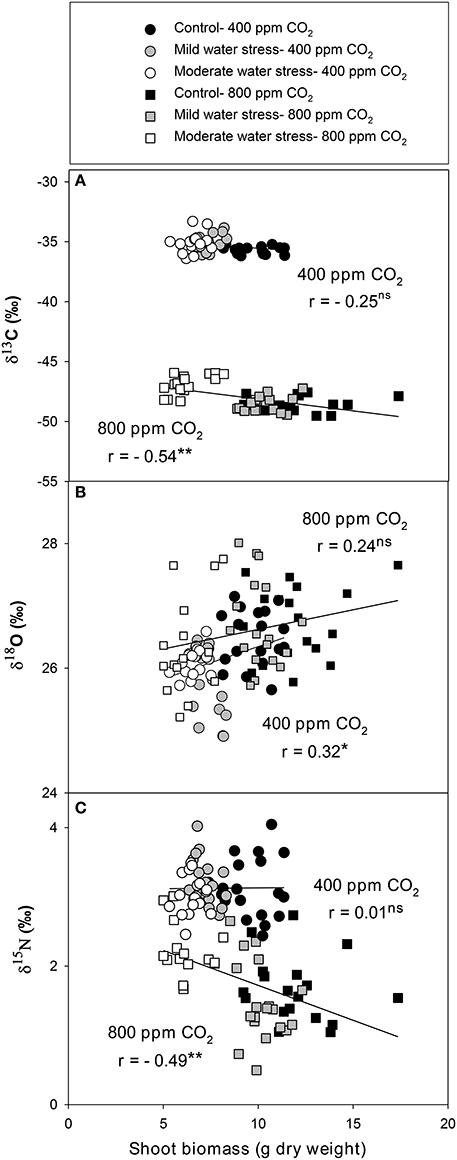
Figure 1. Relationships of shoot biomass with the stable isotope compositions of (A) carbon (δ13C), (B) oxygen (δ18O), and (C) nitrogen (δ15N) analyzed in the leaves of sweet pepper grown hydroponically under different [CO2] and water regimes. Levels of significance: ns, no significant; *P < 0.05 and **P < 0.01.
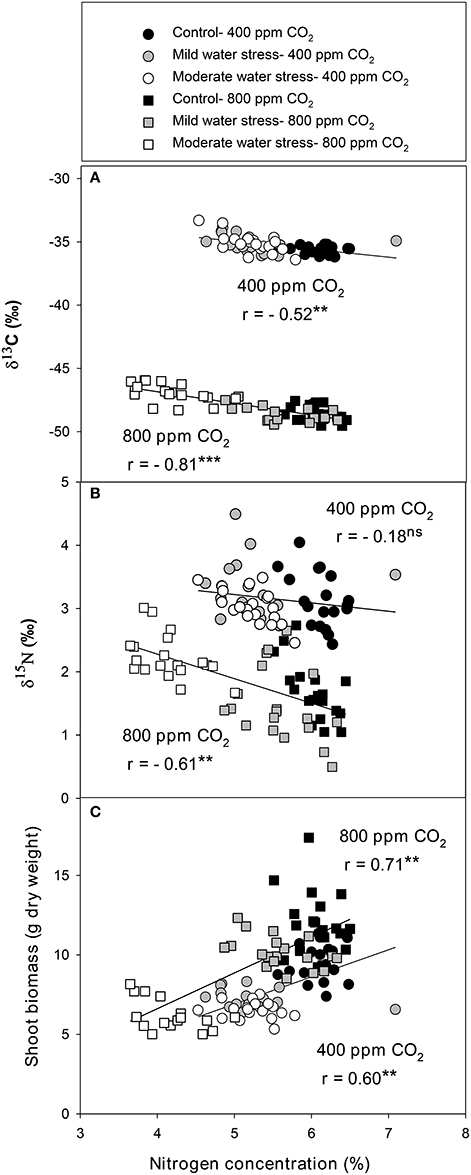
Figure 2. Relationships of leaf nitrogen concentration with the stable isotope compositions of (A) carbon (δ13C) and (B) nitrogen (δ15N) and the (C) shoot biomass of sweet pepper grown hydroponically under different [CO2] and water regimes. Levels of significance: **P < 0.01 and ***P < 0.001.
In order to get an overall view of the relationships between shoot biomass and all the different physiological traits, a principal component analysis (PCA) was undertaken that included SB and LC together with the gas exchange traits and stable isotope signatures in Table 2. For all the water regimes and [CO2] combined, the two first components explained 60% of variability. SB was placed nearly opposite to δ13C and δ15N and surrounded, at a certain distance, by δ18O, N and the A, gs, Ci/Ca, and T gas-exchange parameters, whereas LC was placed further away (Figure 3A). For the three water regimes at atmospheric [CO2] the two first component axes of the PCA accounted for more than 62% variability. In this case SB, and particularly N, were placed clearly opposite to δ13C, LC and δ15N, with the first isotope the furthest away and the second the closest to the center (Figure 3B), whereas Ci/Ca (together with N) surrounded SB. The rest of the gas exchange traits were placed more (gs, and T) or less (A) close to Ci/Ca, while δ18O had the least alignment to SB. In the case of the PCA for the three water regimes at high [CO2], the two first component axes explained around 55% of variability. As in the previous PCAs, δ13C and δ15N were placed opposite to SB, whereas for the rest of the parameters only N was placed relatively near SB and all the gas exchange traits, together with δ18O and LC, were placed on the same side of the representation as SB but far away from it (Figure 3C).
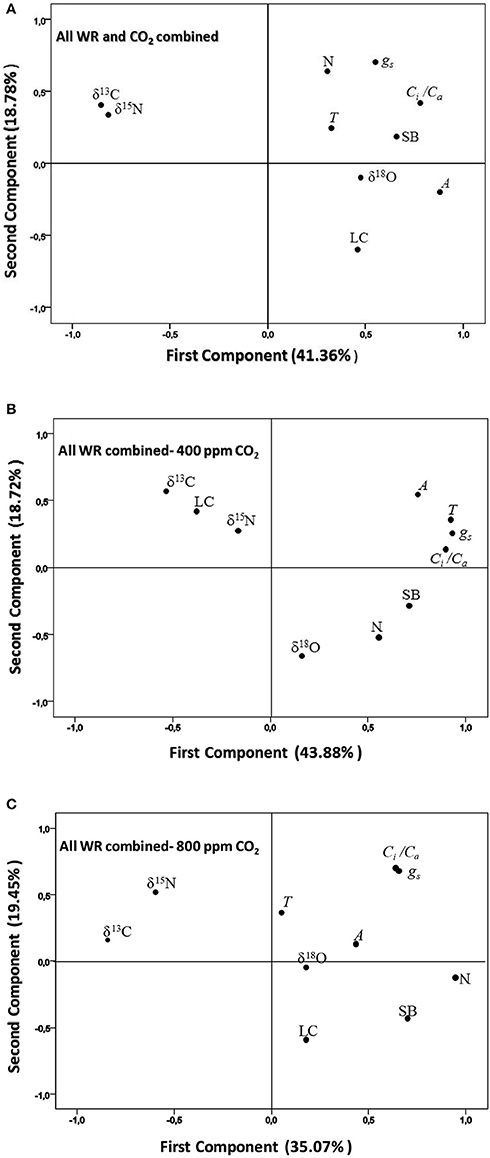
Figure 3. Principal component analysis of shoot biomass (SB) and different physiological traits related to the photosynthetic, transpirative, and nitrogen status of the plant were set for four sweet pepper varieties grown under (A) three different water regimes (WR) and two [CO2] combined, (B), three water regimes at atmospheric [CO2], and (C) three water regimes at high [CO2]. The physiological traits included as variables are: the stable carbon, oxygen and nitrogen isotope compositions (δ13C, δ18 O, δ15N), the nitrogen concentration (N), the chlorophyll content (LC), and the net CO2 Assimilation (A), transpiration (T), stomatal conductance (gs), and the ratio of the intercellular vs. the atmospheric [CO2] (Ci/Ca) of leaves.
The relationships between SB with the different traits of Table 2 in combination were assessed through a stepwise regressions analysis (Table 4). At atmospheric [CO2] and the three water regimes combined, the first variable chosen by the model was gs, which on its own explained 30% of the variability in SB. The second variable chosen by the model was N, with the two variables explaining together 44% of the variability in SB. At elevated [CO2] and the three water regimes combined, the first variable chosen by the model was N concentration, which on its own explained 51% of the variability in SB. The second variable chosen by the model was Ci with the two variables explaining 58% of the variability in SB. In control conditions and both [CO2] combined, the first variable chosen by the model was δ13C, explaining 34% of the variability in SB. The second variable chosen by the model was gs; the two variables together explaining 44% of the variability in SB. Under mild stress and both [CO2] combined, the first variable chosen by the model was also δ13C, which on its own explained 76% of the variability; the second variable chosen by the model was N concentration, with the two variables together explaining 81% of the variability in SB. Concerning the moderate stress, only T was chosen by the model and it explained merely 16% of the variability in SB.
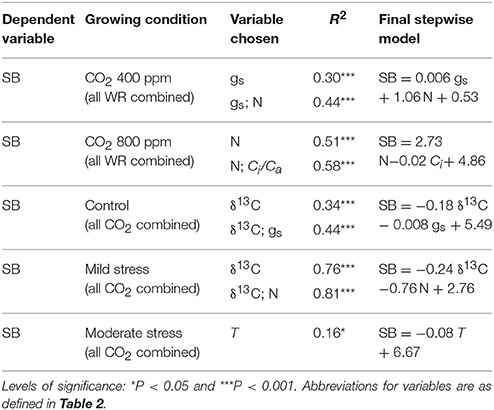
Table 4. Multiple linear regressions (stepwise) explaining shoot biomass (SB) variation across genotypic groups in each CO2 concentration and all water regimes (WR) combined and in each water regime condition and all [CO2] combined as a dependent variable, and all the gas exchange traits and stables isotope signatures and nitrogen concentration in the same growing conditions as independent variables.
Path Analysis
Further, we used the traits best correlated with shoot biomass to develop a conceptual model via a path-analysis. Besides SB, the model included δ13C and δ15N, (as time-integrated indicators of water conditions and nitrogen metabolism, respectively), together with the N concentration and the gas exchange traits, gs and Ci/Ca (Figure 4). In this case only the models across water regimes within each of the two [CO2] levels were assayed, but excluding the model combining the two [CO2], because the different δ13C of the ambient air and the compressed CO2. At atmospheric [CO2], both the gs and N concentration had quite similar direct positive effects on the shoot biomass. However, gs also indirectly affected N concentration through its strong direct effect on Ci/Ca and δ13C. Thus, δ13C was negatively related with the N concentration in dry matter. The relationship of δ13C on δ15N was small, whereas there was no direct relation of δ15N on the N concentration. At high [CO2] most of the direct effect on shoot biomass corresponded to the N concentration, whereas the effect of gs was minor and apparently negative. The direct effect of gs on Ci/Cawas very strong but its direct effect on δ13C was minor. However, the effect of δ13C on N concentration was stronger than atmospheric [CO2] and included a direct negative effect, together with an indirect effect mediated through changes in δ15N.
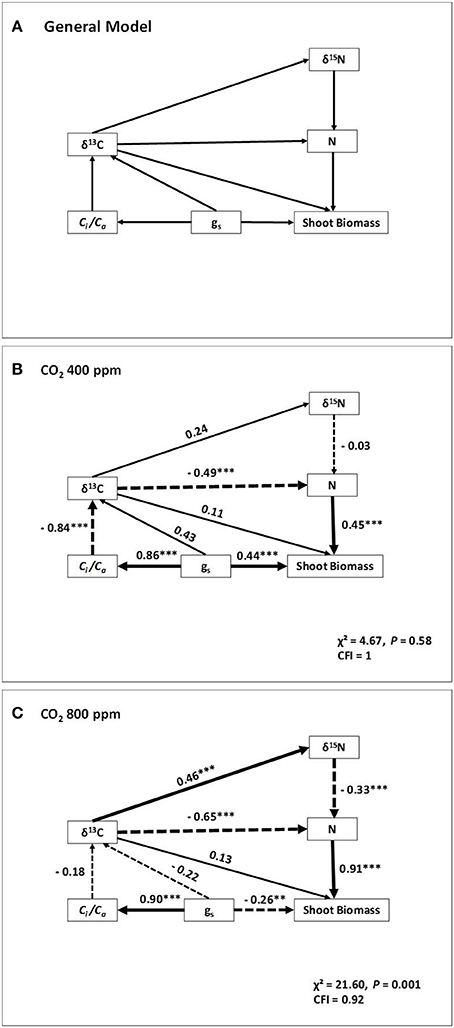
Figure 4. Path analyses of four sweet pepper varieties grown under different water regimes and two [CO2]. The conceptual model quantifying the relative strengths of direct and indirect relationships of gas exchange, stable isotope compositions and nitrogen concentration on shoot biomass (SB) is shown in (A). Physiological parameters included in the model are: gs, stomatal conductance; Ci/Ca, the ratio of the intercellular vs. the atmospheric [CO2]; δ13C, carbon isotope composition; δ15N, nitrogen isotope composition and N concentration of leaves. The width of arrows is proportional to the path coefficient values. Dashed lines indicate negative relationships. Overall fit statistics for each path model (x2 and comparative fit index, CFI), the latter useful for small sample sizes (with values >0.9 taken as indicative of a good fit), are shown at the bottom right of each panel. **P < 0.01, ***P < 0.001.
Amino Acid Profile and Network Analysis
The profile of 17 amino acids were assayed in the leaves of the four sweet pepper genotypes grown under contrasting [CO2] and water regimes and plotted in a hierarchically clustered heat map (Figure 5). The significance of the three main factors and their interactions revealed that water regime, [CO2] and the CO2 x water stress interaction were the most relevant conditions affecting amino acid contents (all of them except lysine, methionine, and histidine). Although genotypic variability was only significant for three amino acids (proline, glycine, and glutamate), the interaction genotype by [CO2] affected nine amino acids, almost exactly the amino acids that were altered under the CO2 x water regime. CO2 enrichment significantly decreased the content of 8 amino acids (serine, asparagine, glutamate, threonine, proline, cysteine, and valine), and tended to decrease the content of other amino acids, and only increased the levels of tyrosine. Water stress, regardless of the severity, decreased the contents of eight amino acid (serine, glycine, asparagine, threonine, alanine, proline, cysteine, and valine). In spite of some genotypic differences the [CO2] x water regime interaction highlighted that, although elevated CO2 and water stress led to a decrease of amino acid levels, this decrease was less clear under mild compared with the most severe water stress.
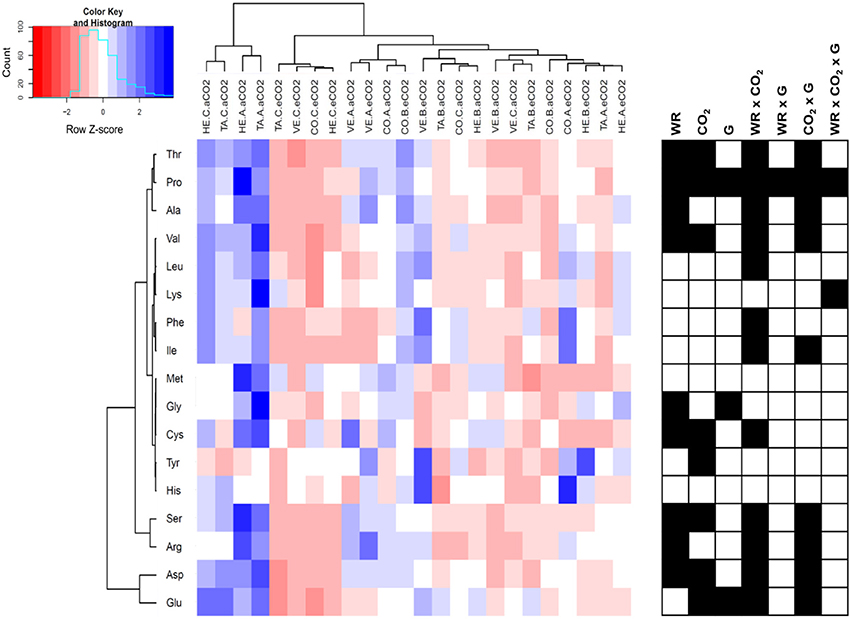
Figure 5. Hierarchically clustered heat map of amino acid content of four sweet pepper genotypes (TA, Tallante; CO, Coyote; HE, Herminio; VE, Velez) grown hydroponically under different [CO2] (aCO2, ambient [CO2]; eCO2, elevated [CO2]) and water regimes (A, control; B, mild water stress; C, moderate water stress). Values were scaled in the row direction as presented in the color key. Significance of main factors (WR, water regime; CO2, [CO2]; and G, genotype) and their interactions are shown as black cells (P < 0.05).
Based on significant correlations between trait pairs we built a correlation network for ambient and elevated [CO2] treatments, including amino acid content (Figure S2). They showed similar number of nodes (32 and 31, respectively) and edges (128), although there were some differences with more negative correlations under elevated [CO2]. In both networks amino acid levels were positively correlated between them. However, most amino acids correlated positively with shoot biomass under elevated [CO2], while at ambient [CO2] only cysteine and tyrosine did. In ambient [CO2] network (Figure S2A) amino acids levels were also positively associated with SLA, N content, and δ18O and negatively with δ15N. By contrast, in elevated [CO2] network (Figure S2B) amino acids levels were associated with more traits: positively with PH, A, and N content and negatively with RWC, Ψw, δ13C, T, and δ15N.
Discussion
Water stress affected negatively plant growth as compared with control conditions and regardless the [CO2] assayed. Water stress also decreased Ψw but did not have any effect on RWC and Ψπ. These kinds of responses do not support osmotic adjustment, which contrasts with the available literature (e.g., Wullschleger and Oosterhuis, 1991; del Amor et al., 2010), and may be due to the mild to moderate nature of the water stress applied. In fact, the relatively small (but significant) changes in A rates, gs, LC, and δ13C and the lack of differences for SLA and anthocyanins under stress compared to control conditions support this statement. Moreover, although anthocyanins have protective functions during drought stress, their contribution to osmotic regulation might be low (Manetas, 2006).
The effects of high [CO2] on increasing plant growth and biomass have been widely reported in many plant species including pepper (del Amor et al., 2010), with the positive effect being less evident at the most severe water stress (Peñuelas et al., 1995; Medina et al., 2016). The decrease in SLA has also been reported following increases in [CO2] (Peñuelas et al., 1995; Piñero et al., 2016) and as a consequence of water stress (Xu et al., 2014). These results suggest that the leaf thickness of mesophyll packing increased in response to high [CO2] (Oberbauer et al., 1985). The LC and anthocyanins also increased in response to high [CO2]. Previous results in pepper only exhibited a trend toward higher chlorophyll content following exposure to high [CO2] (Peñuelas et al., 1995). The increase of anthocyanins under elevated [CO2], as it was also observed in Takatani et al. (2014) in response to higher carbon/nitrogen balance observed under these growth conditions. Indeed, the accumulation of anthocyanins is an indicative of nitrogen limitation in the plant according to these authors. The high sucrose levels usually reported under elevated [CO2] might stimulate the expression of MYB75/PAP1 transcription factor that further enhances the production of anthocyanins (Tzin and Galili, 2010). Moreover, the levels of tyrosine, a precursor of anthocyanins, were induced under elevated [CO2] and they could also induce the anthocyanin biosynthesis, as showed in Arabidopsis thaliana (Zhou et al., 2014). Regarding the genotype x water regime interaction, we observed that in most of the genotypes anthocyanin content increased with water stress as a response to water limitation. However, in the case of Coyote we observed a reduction of anthocyanins with water stress; that could suggest a limitation of the protective functions of anthocyanins in response to water stress in this genotype, which in part accounts for the lowest shoot biomass of this genotype.
In addition, high [CO2] decreased leaf RWC and Ψw, and increased Ψπ. A previous study in pepper found a tendency to lower Ψw in response to high [CO2] under well-watered conditions, whereas the RWC increased regardless of the water regime considered, and the Ψπ increased but only under water stress (del Amor et al., 2010). However, the high [CO2] concentration assayed in this paper was nearly three times higher than in the present study. The effect of high [CO2] decreasing water status seems fairly surprising, but it may be due to a larger transpiration area compared with plants grown under normal [CO2].
As expected high [CO2] increased A and WUE compared with atmospheric [CO2], but surprisingly did not decrease gs and transpiration under control and mild-stress conditions, and even these rates increased under moderate water stress. A small number of studies have noted similar patterns, including work on sweet pepper (del Amor et al., 2010; del Amor, 2013), other herbaceous crops (Morison, 1998; Medina et al., 2016) and in tree species that were not acclimated (Medlyn et al., 2001). The results of the current study suggest that there was no acclimation of gs to elevated [CO2]. Moreover, the response of photosynthesis to growth in elevated [CO2] is commonly tested by comparing the gas exchange of plants grown at atmospheric- and high-[CO2] at the same [CO2] across both sets of plants (e.g., Drake et al., 1997; Curtis and Wang, 1998).
Effect of [CO2] and Water Regime on δ13C, δ18O, and δ15N
The increase in δ13C under water stress is in line with earlier work (Farquhar et al., 1982, 1989). However, the effect was more evident at high [CO2], which agrees with the findings of del Amor (2013) for sweet pepper plants that were subjected to different levels of salinity under these two different [CO2]. This may be due to the δ13C dilution effect of the CO2 used to raise the air [CO2] up to 800 ppm (i.e., the industrial CO2 is a by-product of combusting fossil fuels and therefore its δ13C is far more negative than atmospheric CO2). Indeed, δ13C decreased around 3‰ for each 100 μmol mol−1 of increase in [CO2], which is in line with previous reports (Schubert and Jahren, 2012; del Amor, 2013). Therefore at high [CO2], water stress slows the increase of new biomass with lower δ13C. The effect (pointed out above) of high [CO2] decreasing water status due to a larger transpiration area, compared with plants grown under normal [CO2], may be also involved in the larger range of δ13C values as response to water stress. Thus, at high [CO2] the absolute changes in δ13C were more in parallel with the SB than with the net assimilation or Ci/Ca. In that regard, δ13C correlated negatively with SB across water regimes at high [CO2], but the negative relationship did not reach significance at atmospheric [CO2]. Significantly, stronger negative relationships between δ13C and SB at high vs. atmospheric [CO2] have been reported before for sweet pepper when plants growing across different levels of salinity were compared (del Amor, 2013). Moreover, genotypic effects on δ13C were significant at both [CO2]. To the best of our knowledge there are no studies reporting on the genotypic variability in δ13C of sweet pepper under different levels of water stress and [CO2].
Water stress slightly decreased δ18O but only at high [CO2]. Such decreases in δ18O in response to water stress and a lower transpiration are opposite to most of the reports (Barbour and Farquhar, 2000; Farquhar et al., 2007; Cabrera-Bosquet et al., 2009a, 2011). The increase in δ18O in plant material exposed to high [CO2] has been reported before and may be caused by increases in the δ18O of the leaf water (Cooper and Norby, 1994). Although it has been shown that the oxygen isotopic content of atmospheric carbon dioxide has little direct influence on the δ18O of either leaf water or cellulose (DeNiro and Epstein, 1979), increasing atmospheric carbon dioxide concentrations may have significant indirect effects on heavy stable isotope enrichment in leaf water. This would result from the expected decreases in transpiration and increases in WUE by plants as [CO2] levels increase (Eamus and Jarvis, 1989). The processes leading to concentration of the heavy isotopes 18O in leaf water are similar in many respects to evaporation, which alters the isotopic composition of terrestrial surface waters (Cooper and Norby, 1994). Alternative explanations for the increase in δ18O at high [CO2] are not supported by our results. Indeed, a higher CO2 release due to photorespiration at atmospheric compared with high [CO2] levels would cause an increase in δ18O at atmospheric [CO2] levels (Farquhar et al., 1993), which does not agree with the increase we found in δ18O at high [CO2]. Changes in gs do not seem to be involved because, regardless of the presence or absence of differences in gs within a given water regime between the atmospheric and high [CO2], all water regimes at high [CO2] exhibited higher δ18O than the corresponding water regimes at atmospheric [CO2]. Moreover, genotypic variability was only significant at atmospheric [CO2]. In spite of some positive results (Barbour et al., 2000; Cabrera-Bosquet et al., 2009b), the weak performance of δ18O in correlating with biomass and yield has been extensively reported (Araus et al., 2013; Bort et al., 2014; Foulkes et al., 2016; Munjonji et al., 2016). This poor performance appears to be caused by post photosynthetic fractionations of the 18O signature in the photoassimilates (Sánchez-Bragado et al., 2016). The same reasoning may be extended for the weak and erratic correlations of δ18O with gas exchange traits and δ13C that we found.
Plants under the strongest water stress exhibited slightly lower δ15N values than the other two treatments at atmospheric [CO2], and the opposite occurred at high [CO2]. Decreases in δ15N following water limitation (Araus et al., 2013; Bort et al., 2014) or growing conditions causing water stress, such as salinity (Yousfi et al., 2009, 2012), have been reported before. The effect of rising [CO2] on δ15N was clearer than the effect of the water regime; in this case decreasing the isotopic composition, irrespective of the water regime considered. Depletion of the heavier N isotope in plants grown under high [CO2] and water deficit conditions has been reported before in a study with alfalfa (Ariz et al., 2015), whereas another recent study, this time in durum wheat, concluded that elevated [CO2] was the main factor that increased δ15N (Medina et al., 2016). The decrease in δ15N under elevated [CO2] may reflect decreased gs, but could also be related to a higher nitrogen demand in leaves, as suggested by the decreased in leaf N (Ariz et al., 2015) or shifts in nitrogen metabolism associated with decreases in photorespiration (Tcherkez, 2010).
The photorespiratory nitrogen cycle extending over different plant compartments implicates several reactions related to nitrogen recycling that may have 15N-kinetic isotope effects (Yu and Woo, 1991; Werner and Schmidt, 2002). Normally, the kinetic isotope effects on these reactions should not become evident when there is a total recycling of the intermediates without input or net production of substrates and products (Werner and Schmidt, 2002). However, plants can excrete gaseous ammonia (Francis et al., 1997; Pearson et al., 1998) as a consequence of photorespiration. If the uptake/loss of NH3 from plant stomata is rate-limited by the diffusion of NH3 in air, the transported NH3 will be depleted in 15N by around 18‰ relative to the δ15N of the source (Farquhar et al., 1980; Tcherkez and Hodges, 2008). As a consequence an increase in δ15N may be expected as a response to photorespiration, which may be the case for plants exposed to atmospheric [CO2] compared to enhance [CO2].
The correlation of δ15N with SB across water regimes was only significant (and negative) at the high [CO2]. The lack of correlation at atmospheric [CO2] may be due, as for δ13C, to the relatively narrow range of variability in SB associated with the response to water regimes at atmospheric [CO2]. Negative relationships between δ15N and SB and yield at atmospheric [CO2] have been frequently reported (Robinson et al., 2000; Yousfi et al., 2009; Raimanová and Haberle, 2010; Araus et al., 2013).
Growing Conditions, N Concentration, and Plant Growth
The effects of water stress decreasing the N concentration in leaves have been extensively reported (Shangguan et al., 2000; Yousfi et al., 2012). In accordance with this, the N concentration was positively correlated with the gs (r = 0.36, P < 0.01; r = 0.51, P < 0.001, at atmospheric and high [CO2], respectively), suggesting that the N concentration in leaves depends to some extent on the transpirative stream (Dalla Costa and Gianquinto, 2002). This may be the case for plants growing under hydroponic conditions in particular, where water and nitrogen are provided together through the nutrient solution (Peñuelas et al., 1995) and the transpiration stream largely determines the availability of mineral N in the rhizosphere (Gonzalez-Dugo et al., 2010). In support of that, our results show a general decrease in the content of the different amino acids as response to water stress. Such decrease is nonspecific, as shown by the fact these amino acids belong to different metabolic pathways (Galili et al., 2016). This may highlight that primary substrate(s) for the synthesis of all amino acids were reduced, involving the provision of C skeletons or N. It has been reported for Arabidopsis plants that a reduction in the levels of transpiration, decreased the capacity for nitrogen uptake and the shoot nitrogen concentration of the plant but only when water availability was not restricted (Hepworth et al., 2015).
Increasing the [CO2] had a significant, albeit minor effect, decreasing the N concentration. In fact, the results of an increase in [CO2] decreasing N concentration were only significant at the strongest water stress. A decrease in nitrogen concentration has been widely reported in non-leguminous plants following increases in [CO2] (Jablonski et al., 2002), irrespective of the water regime (Medina et al., 2016). In fact, the predicted growth response to elevated [CO2] is reduced at low N availability (McMurtrie et al., 2008; Vicente et al., 2016b). In our study, water deficit combined with high [CO2] caused the lowest SB and N concentration in the leaves among the six different growing conditions.
As expected at elevated [CO2], the levels of photorespiratory intermediates, glycine and serine decreased (Geiger et al., 1998, 1999; Yu et al., 2012; Aranjuelo et al., 2013; Noguchi et al., 2015). However, different to previous studies (Fritz et al., 2006; Krapp et al., 2011; Noguchi et al., 2015), the levels of (other) major amino acids (e.g., aspartate, asparagine, glutamate, and alanine) decreased. Such decrease has been reported as response to insufficient nitrogen conditions; specifically under and ambient [CO2] conditions (Noguchi et al., 2015; Vicente et al., 2016b). This pattern suggests that in our system some limitation of N availability may be present. Nevertheless, the relative decrease of glycine as response to inhibition of photorespiration (i.e., at high compared with ambient [CO2]) was much lower than that of serine which is against a low N availability (Sulpice et al., 2013; Noguchi et al., 2015). On the other hand in agreement with previous studies the amount of minor amino acids (e.g., threonine, valine, cysteine, methionine, lysine, leucine, etc.) decrease at elevated [CO2] (Noguchi et al., 2015).
Summarizing the decrease in the amount of several amino acids under elevated CO2, reported in our study may have several causes. Some of them, decreased probably due to the inhibition of photorespiration under elevated CO2 (glycine and serine). The rest of the amino acids could have been reduced due to the inhibition of N assimilation; this has been reported in several plants under elevated CO2, such as Arabidopsis and wheat (Aranjuelo et al., 2013; Noguchi et al., 2015; Vicente et al., 2016b). The inhibition of N assimilation under elevated CO2 is not completely understood, but it could be due, as reported in Vicente et al. (2016b) and in agreement with previous studies (Bloom et al., 2010; Aranjuelo et al., 2013), to (i) lower rates of photorespiration in elevated CO2 that decrease the availability of reductant in the cytosol, and inhibition of influx into chloroplasts; or to increased demand for to match the increase in net photosynthetic assimilation in elevated CO2, leading to a decline of the metabolic pool that restricts induction of nitrate reductase and thus assimilation.
Interestingly tyrosine was the only amino acid clearly increasing as response to a high [CO2]. Moreover, under water stress, high [CO2] also increased phenylalanine. Both are aromatic amino acids, which have low N/C ratios, involved as precursors in the synthesis of anthocyanin. In fact an increase in both amino acids has been reported in Arabidopsis leaves at elevated [CO2] in + media (Noguchi et al., 2015) which is our case (i.e., nutrient solution). Cysteine was strongly decreased under elevated [CO2] regardless of water regime. It constitutes the first stable product of the sulfur assimilation, and acts as precursor of the majority of organic sulfur compounds (Hawkesford et al., 2012).
Independently of [CO2], the levels of all amino acids were correlated (Supplementary Material Figure S2). However, the relationships between amino acids with other physiological traits varied depending on [CO2]. It was especially remarkable that amino acid contents correlated positively with SB under high [CO2] and negatively with traits related to water status (RWC, Ψw, δ13C, and T), while under atmospheric [CO2] the correlations between amino acids and other traits were scarce. These findings suggest that amino acid pool greatly influences biomass accumulation under elevated [CO2] and its amount is influenced by leaf and plant water status in a highly-dependent manner.
Decreases in transpiration associated with mass flow of soil solution, have been proposed to limit plant N acquisition. In an experiment with cottonwood, where relative humidity and atmospheric [CO2] were manipulated to alter the transpirative stream, N gain was positively correlated across all treatments with root mass, and a significant portion of the remaining variation (44%) was positively related to transpiration per unit root mass (McDonald et al., 2002). Thus, decreases in plant N concentration under water stress are attributable in part to associated decreases in gs and transpiration. However, other mechanisms may be involved for the decrease in plant N under [CO2] enrichment. Thus, in our study no clear differences existed in the rates of gs measured at different [CO2] and even transpiration was increased at high [CO2] relative to atmospheric [CO2]. Besides the potential effect of diminishing transpirative stream, [CO2] enrichment is reported to inhibit the assimilation of nitrate into organic nitrogen compounds (Bloom et al., 2010; Vicente et al., 2016b). This inhibition may be largely responsible for [CO2] acclimation, that is, the decrease in photosynthesis and growth of C3 plants after long exposures to [CO2] enrichment. Different studies have shown that the effect of elevated [CO2] on reducing N content was related at the transcript level to a down-regulation of genes encoding for Rubisco subunits and N-assimilation enzymes (GS1 and GS2), indicating a co-regulation of primary C and N metabolism (Stitt and Krapp, 1999; Vicente et al., 2015, 2016a,b; Medina et al., 2016).
As a consequence of the effect of water regime on N concentration, the trait best correlated with total biomass within each of the two [CO2] was the total leaf N concentration (and amino acid contents), although the correlation was stronger at high [CO2]. Overall, the results showed that greater plant growth across water regimes was linked to an increase in shoot N concentration associated to a higher transpiration stream, even when changes in N metabolism appear also involved (Hirel et al., 2007; Medina et al., 2016). A study of Peñuelas et al. (1995) on sweet pepper also found that the effect of [CO2] and water regime was dependent on the accumulated N supply. All these studies have plants grown under hydroponic conditions in common, where irrigation and fertilization are provided together through the nutrient solution under relatively low photosynthetic photon flux density.
The leaf N concentration was negatively correlated with δ13C within each [CO2] across water regimes, whereas nitrogen concentration and gs correlated positively (but in a weaker manner). Moreover, δ13C correlated with the total shoot nitrogen content in a weaker manner than the nitrogen concentration alone. In fact, both the δ13C and nitrogen concentration were expressed on a dry matter basis, which may explain their better correlation. δ13C is not just an indicator of water use efficiency (Farquhar et al., 1982, 1989) but it is also strongly negatively affected by the amount of available water (Araus et al., 1997, 2003) and therefore when analyzed on a dry matter basis it may be considered an indicator on the total (i.e., through time) water used by the plant. Moreover, in the Principal Component Analysis the nitrogen concentration was placed clearly opposite to δ13C. In other words, the negative relationship between δ13C and nitrogen concentration on a dry leaf basis may be understood as the nitrogen concentration in the leaves being, at least in part, the consequence of the amount of water transpired by the plant. The Path Analysis further supported the direct contribution of the nitrogen concentration in determining total biomass as well as the positive role of an increased water use (assessed through a lower δ13C of the dry matter) on the N accumulation. This model worked better under high [CO2]. In sweet pepper growing under hydroponic conditions, strong negative correlations across salinity levels for leaf δ13C with both gs and nitrate accumulation have been reported, with the correlations being higher at elevated [CO2] compared with atmospheric [CO2] (del Amor, 2013).
Conclusion
The signatures of the three different stable isotopes are significantly affected by water regime, [CO2], and genotypic effects. However, the results do not support the use of δ18O as an indicator of the effect of growing conditions and genotypes on plant growth. This study proves that the effect of water regime on sweet pepper growth in a hydroponic system is caused by changes in the amount of nitrogen assimilated, which is associated with the plant's water use. In that sense, the role of δ13C in explaining differences in plant growth across water regimes appears mediated via its direct relationship with N accumulation in leaves, particularly at high [CO2]. However, our study does not support stomatal closure as being associated with an elevated [CO2]-induced reduction in N concentration in the shoot.
Author Contributions
FdA and JA conceived and designed the experiments. MP, MS, and GO-A contributed to the experimental work. SY and RV contributed to the data analysis and preparation of tables and figures. MS wrote the paper under the supervision of FdA and JA and all three revised the manuscript. All authors read and approved the final manuscript.
Conflict of Interest Statement
The authors declare that the research was conducted in the absence of any commercial or financial relationships that could be construed as a potential conflict of interest.
Acknowledgments
This study was supported in part by the European Regional Development Fund (ERDF) 80%—Región de Murcia (FEDER 1420-07) and the 2014-SGR-628 AGAUR project, Generalitat de Catalunya, Spain. MP is the recipient of a pre-doctoral fellowship from INIA. The authors thank Miguel Marín for his technical assistance.
Supplementary Material
The Supplementary Material for this article can be found online at: https://www.frontiersin.org/articles/10.3389/fpls.2017.02180/full#supplementary-material
References
Aranjuelo, I., Sanz-Sáez, A., Jáuregui, I., Irigoyen, J. J., Araus, J. L., Sánchez-Díaz, M., et al. (2013). Harvest index, a parameter conditioning responsiveness of wheat plants to elevated CO2. J. Exp. Bot. 64, 1879–1892. doi: 10.1093/jxb/ert081
Araus, J. L., Buxo, R., Febrero, A., Camalich, M. D., Martin, D., Molina, F., et al. (1997). Identification of ancient irrigation practices based on the carbon isotope discrimination of plant seeds: a case study from the Southeast Iberian Peninsula. J. Archaeol. Sci. 24, 729–740. doi: 10.1006/jasc.1997.0154
Araus, J. L., Serret, M. D., Bort, J., and Nieto-Taladriz, M. T. (2013). Comparative performance of δ13C, δ18O and δ15N for phenotyping durum wheat adaptation to a dryland environment. Funct. Plant Biol. 40, 595–608. doi: 10.1071/FP12254
Araus, J. L., Slafer, G., Royo, C., and Serret, M. D. (2008). Breeding for yield potential and stress adaptation in cereals. Crit. Rev. Plant Sci. 27, 377–412. doi: 10.1080/07352680802467736
Araus, J. L., Villegas, D., Aparicio, N., Garcia del Moral, L. F., El Hani, S., Rharrabti, Y., et al. (2003). Environmental factors determining carbon isotope discrimination and yield in durum wheat under Mediterranean conditions. Crop Sci. 43, 170–180. doi: 10.2135/cropsci2003.1700
Ariz, I., Cruz, C., Neves, T., Irigoyen, J. J., García-Olaverri, C., Nogués, S., et al. (2015). Leaf δ15N as a physiological indicator of the responsiveness of N2-fixing alfalfa plants to elevated [CO2], temperature and low water availability. Front. Plant Sci. 6:574. doi: 10.3389/fpls.2015.00574
Barbour, M. M. (2007). Stable oxygen isotope composition of plant tissue: a review. Funct. Plant Biol. 34, 83–94. doi: 10.1071/FP06228
Barbour, M. M., and Farquhar, G. D. (2000). Relative humidity –and ABA- induced variation in carbon and oxygen isotope ratios of cotton leaves. Plant Cell Environ. 23, 473–485. doi: 10.1046/j.1365-3040.2000.00575.x
Barbour, M. M., Fischer, R. A., Sayre, K. D., and Farquhar, G. D. (2000). Oxygen isotope radio of leaf and grain material correlates with stomatal conductance and grain yield in irrigated wheat. Aust. J. Plant Physiol. 27, 625–637. doi: 10.1071/PP99041
Bencze, S., Bamberger, Z., Janda, T., Balla, K., Varga, B., Bedo, Z., et al. (2014). Physiological response of wheat varieties to elevated atmospheric CO2 and low water supply levels. Photosynthetica 52, 71–82. doi: 10.1007/s11099-014-0008-y
Bloom, A. J., Burger, M., Rubio Asensio, J. S., and Cousins, A. B. (2010). Carbon dioxide enrichment inhibits nitrate assimilation in wheat and Arabidopsis. Science 328, 899–903. doi: 10.1126/science.1186440
Bort, J., Belhaj, M., Latiri, K., Kehel, Z., and Araus, J. L. (2014). Comparative performance of the stable isotope signatures of carbon, nitrogen and oxygen in assessing early vigour and grain yield in durum wheat. J. Agric. Sci. 152, 408–426. doi: 10.1017/S0021859613000269
Cabrera-Bosquet, L., Albrizio, R., Nogués, S., and Araus, J. L. (2011). Dual Δ13C/δ18O response to water and nitrogen availability and its relationship with yield in field-grown durum wheat. Plant Cell Environ. 34, 418–433. doi: 10.1111/j.1365-3040.2010.02252.x
Cabrera-Bosquet, L., Molero, G., Nogués, S., and Araus, J. L. (2009a). Water and nitrogen conditions affect the relationship of Δ13C and Δ18O to gas exchange and growth in durum wheat. J. Exp. Bot. 60, 1633–1644. doi: 10.1093/jxb/erp028
Cabrera-Bosquet, L., Sanchez, C., and Araus, J. L. (2009b). Oxygen isotope enrichment (Δ18O) reflects yield potential and drought resistance in maize. Plant Cell Environ. 32, 1487–1499. doi: 10.1111/j.1365-3040.2009.02013.x
Cernusak, L. A., Winter, K., and Turner, B. L. (2009a). Physiological and isotopic (δ13C and δ18O) responses of three tropical tree species to water and nutrient availability. Plant Cell Environ. 32, 1441–1455. doi: 10.1111/j.1365-3040.2009.02010.x
Cernusak, L. A., Winter, K., and Turner, B. L. (2009b). Plant δ15N correlates with the transpiration efficiency of nitrogen acquisition in tropical trees. Plant Physiol. 151, 1667–1676. doi: 10.1104/pp.109.145870
Condon, A. G., Farquhar, G. D., and Richards, R. A. (1990). Genotypic variation in carbon isotope discrimination and transpiration efficiency in wheat. Leaf gas exchange and whole plant studies. Aust. J. Plant Physiol. 17, 9–22. doi: 10.1071/PP9900009
Condon, A. G., Richards, R. A., Rebetzke, G. J., and Farquhar, G. D. (2002). Improving intrinsic water use efficiency and crop yield. Crop Sci. 42, 122–131. doi: 10.2135/cropsci2002.1220
Condon, A. G., Richards, R. A., Rebetzke, G. J., and Farquhar, G. D. (2004). Breeding for high water-use efficiency. J. Exp. Bot. 55, 2447–2460. doi: 10.1093/jxb/erh277
Cooper, L. W., and Norby, R. J. (1994). Atmospheric CO2 enrichment can increase the 18O content of leaf water and cellulose: paleoclimatic and ecophysiological implications. Clim. Res. 4, 1–11. doi: 10.3354/cr004001
Coplen, T. B. (2008). Explanatory Glossary of Terms Used in Expression of Relative Isotope Ratios and Gas Ratios. IUPAC Recommendations 2008. International Union of Pure and Applied Chemistry Inorganic Chemistry Division, Commission on Isotopic Abundances and Atomic Weights: Research Triangle Park, NC, USA. Available online at: https://old.iupac.org/reports/provisional/abstract08/coplen_310508.html
Coplen, T. B. (2011). Guidelines and recommended terms for expression of stable-isotope-ratio and gas-ratio measurement results. Rapid Commun. Mass Spectrom. 25, 2538–2560. doi: 10.1002/rcm.5129
Curtis, P. S., and Wang, X. (1998). A meta-analysis of elevated CO2 effects on woody plant mass, form, and physiology. Oecologia 113, 299–313. doi: 10.1007/s004420050381
Dalla Costa, L., and Gianquinto, G. (2002). Water stress and watertable depth influence yield, water use efficiency, and nitrogen recovery in bell pepper: Lysimeter studies. Aust. J. Agric. Res. 53, 201–210. doi: 10.1071/AR00133
Dawson, T. E., Mambelli, S., Plamboeck, A. H., Templer, P. H., and Tu, K. P. (2002). Stable isotopes in plant ecology. Annu. Rev. Ecol. Syst. 33, 507–559. doi: 10.1146/annurev.ecolsys.33.020602.095451
del Amor, F. M. (2007). Yield and fruit quality response of sweet pepper to organic and mineral fertilization. Renew. Agric. Food Syst. 22, 233–238. doi: 10.1017/S1742170507001792
del Amor, F. M. (2013). Variation in the leaf δ13C is correlated with salinity tolerance under elevated CO2 concentration. J. Plant Physiol. 170, 283–290. doi: 10.1016/j.jplph.2012.10.019
del Amor, F. M., and Gómez-López, M. D. (2009). Agronomical response and water use efficiency of sweet pepper plants grown in different greenhouse substrates. Hortscience 44, 810–814.
del Amor, F. M., and Navarro, J. (2008). Isotopic discrimination as a tool for organic farming certification in sweet pepper. J. Environ. Qual. 37, 182–185. doi: 10.2134/jeq2007.0329
del Amor, F. M., Cuadra-Crespo, P., Walker, D. J., Cámara, J. M., and Madrid, R. (2010). Effect of foliar application of antitranspirant on photosynthesis and water relations of pepper plants under different levels of CO2 and water stress. J. Plant Physiol. 167, 1232–1238. doi: 10.1016/j.jplph.2010.04.010
DeNiro, M. J., and Epstein, S. (1979). Relationship between the oxygen isotope ratios of terrestrial plant cellulose, carbon dioxide, and water. Science 204, 51–53. doi: 10.1126/science.204.4388.51
Drake, B. G., Gonzalez-Meler, M. A., and Long, S. P. (1997). More efficient plants: a consequence of rising atmospheric CO2? Annu. Rev. Plant Physiol. Plant Mol. Biol. 48, 609–639. doi: 10.1146/annurev.arplant.48.1.609
Dueck, T. A., Grashoff, C., Broekhuijsen, G., and Marcelis, L. F. M. (2006). Efficiency of light energy used by leaves situated in different levels of a sweet pepper canopy. Acta Horticult. 711, 201–206. doi: 10.17660/ActaHortic.2006.711.25
Eamus, D., and Jarvis, P. J. (1989). The direct effects of increase in the global atmospheric CO2 concentration on natural and commercial temperate trees and forests. Adv. Ecol. Res. 19, 1–55. doi: 10.1016/S0065-2504(08)60156-7
Erice, G., Aranjuelo, I., Irigoyen, J. J., and Sánchez-Díaz, M. (2007). Effect of elevated CO2, temperature and limited water supply on antioxidant status during regrowth of nodulated alfalfa. Physiol. Plant. 130, 33–45. doi: 10.1111/j.1399-3054.2007.00889.x
Erice, G., Sanz-Sáez, A., Urdiain, A., Araus, J. L., Irigoyen, J. J., and Aranjuelo, I. (2014). Harvest index combined with impaired N availability constrains the responsiveness of durum wheat to elevated CO2 concentration and terminal water stress. Funct. Plant. Biol. 41, 1138–1147. doi: 10.1071/FP14045
Farquhar, G. D., and Lloyd, J. (1993). “Carbon and oxygen isotope effects in the exchange of carbon dioxide between terrestrial plants and the atmosphere,” in Stable Isotopes and Plant-Carbon Water Relations, eds J. R. Ehleringer, A. E. Hall, and G. D. Farquhar (San Diego, CA: Academic Press), 47–70.
Farquhar, G. D., and Richards, R. A. (1984). Isotopic composition of plant carbon correlates with water-use efficiency of wheat genotypes. Aust. J. Plant Physiol. 11, 539–552. doi: 10.1071/PP9840539
Farquhar, G. D., Cernusak, L. A., and Barnes, B. (2007). Heavy water fractionation during transpiration. Plant Physiol. 143, 11–18. doi: 10.1104/pp.106.093278
Farquhar, G. D., Ehleringer, J. R., and Hubick, K. T. (1989). Carbon isotope discrimination and photosynthesis. Annu. Rev. Plant Physiol. Mol. Biol. 40, 503–537. doi: 10.1146/annurev.pp.40.060189.002443
Farquhar, G. D., Firth, P. M., Wetselaar, R., and Weir, B. (1980). On the gaseous exchange of ammonia between leaves and the environment: determination of the ammonia compensation point. Plant Physiol. 66, 710–714. doi: 10.1104/pp.66.4.710
Farquhar, G. D., Lloyd, J., Taylor, J. A., and Ehleringer, J. R. (1993). Vegetation effects on the oxygen isotopic composition of atmospheric CO2. Nature 363, 439–443. doi: 10.1038/363439a0
Farquhar, G. D., O'Leary, M. H., and Berry, J. A. (1982). On the relationship between carbon isotope discrimination and intercellular carbon dioxide concentration in leaves. Aust. J. Plant Physiol. 9, 121–137.
Flores, P., Fenoll, J., and Hellín, P. (2007). The feasibility of using δ15N and δ13C values for discriminating between conventionally and organically fertilized pepper (Capsicum annuum L.). J. Agric. Food Chem. 55, 5740–5745. doi: 10.1021/jf0701180
Foulkes, M. J., DeSilva, J., Gaju, O., and Carvalho, P. (2016). Relationships between δ13C, δ18O and grain yield in bread wheat genotypes under favourable irrigated and rain-fed conditions. Field Crops Res. 196, 237–250. doi: 10.1016/j.fcr.2016.07.006
Francis, D. D., Schepers, J. S., and Sims, A. L. (1997). Ammonia exchange from corn foliage during reproductive growth. Agron. J. 89, 941–946. doi: 10.2134/agronj1997.00021962008900060015x
Fritz, C., Mueller, C., Matt, P., Feil, R., and Stitt, M. (2006). Impact of the C–N status on the amino acid profile in tobacco source leaves. Plant Cell Environ. 29, 2055–2076. doi: 10.1111/j.1365-3040.2006.01580.x
Galili, G., Amir, R., and Fernie, A. R. (2016). The regulation of essential amino acid synthesis and accumulation in plants. Annu. Rev. Plant Biol. 67, 153–178. doi: 10.1146/annurev-arplant-043015-112213
Geiger, M., Haake, V., Ludewig, F., Sonnewald, U., and Stitt, M. (1999). The nitrate and ammonium nitrate supply have a major influence on the response of photosynthesis, carbon metabolism, nitrogen metabolism and growth to elevated carbon dioxide in tobacco. Plant Cell Environ. 22, 1177–1199. doi: 10.1046/j.1365-3040.1999.00466.x
Geiger, M., Walch-Liu, P., Engels, C., Harnecker, J., Schulze, E. D., Ludewig, F., et al. (1998). Enhanced carbon dioxide leads to a modified diurnal rhythm of nitrate reductase activity in older plants, and a large stimulation of nitrate reductase activity and higher levels of amino acids in young tobacco plants. Plant Cell Environ. 21, 253–268. doi: 10.1046/j.1365-3040.1998.00277.x
Gessler, A., Ferrio, J. P., Hommel, R., Treydte, K., Werner, R. A., and Monson, R. K. (2014). Stable isotopes in tree rings: towards a mechanistic understanding of isotope fractionation and mixing processes from the leaves to the wood. Tree Physiol. 34, 796–818. doi: 10.1093/treephys/tpu040
Gonzalez-Dugo, V., Durand, J. L., and Gastal, F. (2010). Water deficit and nitrogen nutrition of crops. Rev. Agron. Sustain. Dev. 30, 529–544. doi: 10.1051/agro/2009059
Hawkesford, M., Horst, W., Kichey, T., Lambers, H., Schjoerring, J., Møller, I. S., et al. (2012). “Functions of macronutrients,” in Marschner's Mineral Nutrition of Higher Plants, 3rd Edn, ed P. Marschner (San Diego,CA: Academic Press), 135-189.
Hepworth, C., Doheny-Adams, T., Hunt, L., Cameron, D. D., and Gray, J. E. (2015). Manipulating stomatal density enhances drought tolerance without deleterious effect on nutrient uptake. New Phytol. 208, 336–341. doi: 10.1111/nph.13598
Hirel, B., Le Gouis, J., Ney, B., and Gallais, A. (2007). The challenge of improving nitrogen use efficiency in crop plants: towards a more central role for genetic variability and quantitative genetics within integrated approaches. J. Exp. Bot. 58, 2369–2387. doi: 10.1093/jxb/erm097
Jablonski, L. M., Wang, X., and Curtis, P. S. (2002). Rapid report. Plant reproduction under elevated CO2 conditions: a meta-analysis of reports on 79 crop and wild species. New Phytol. 156, 9–26. doi: 10.1046/j.1469-8137.2002.00494.x
Krapp, A., Berthomeo, R., Orsel, M., Mercey-Boutet, S., Yu, A., Castaings, L., et al. (2011). Arabidopsis roots and shoots show distinct temporal adaptation patterns toward nitrogen starvation. Plant Physiol. 157, 1255–1282. doi: 10.1104/pp.111.179838
Lindoo, S. J., and Caldwell, M. M. (1978). Ultraviolet-B radiation-induced inhibition of leaf expansion and promotion of anthocyanin production. Plant Physiol. 61, 278–282. doi: 10.1104/pp.61.2.278
Long, S. P., Ainsworth, E. A., Rogers, A., and Ort, D. R. (2004). Rising atmospheric carbon dioxide: plants FACE the future. Annu. Rev. Plant Biol. 55, 591–628. doi: 10.1146/annurev.arplant.55.031903.141610
López-Marín, J., Gálvez, A., del Amor, F. M., Albacete, A., Fernández, J. A., Egea-Gilabert, C., et al. (2017). Selecting vegetative/generative/dwarfing rootstocks for improving fruit yield and quality in water stressed sweet peppers. Sci. Hortic. 214, 9–17. doi: 10.1016/j.scienta.2016.11.012
Manetas, Y. (2006). Why some leaves are anthocyanic and why most anthocyanic leaves are red? Flora 201, 163–177. doi: 10.1016/j.flora.2005.06.010
McDonald, E. P., Erickson, J. E., and Kruger, E. L. (2002). Research note: can decreased transpiration limit plant nitrogen acquisition in elevated CO2? Funct. Plant Biol. 29, 1115–1120. doi: 10.1071/FP02007
McMurtrie, R. E., Norby, R. J., Medlyn, B. E., Dewar, R. C., Pepper, D. A., Reich, P. B., et al. (2008). Why is plant-growth response to elevated CO2 amplified when water is limiting, but reduced when nitrogen is limiting? A growth-optimisation hypothesis. Funct. Plant Biol. 35, 521–534. doi: 10.1071/FP08128
Medina, S., Vicente, R., Amador, A., and Araus, J. L. (2016). Interactive effects of elevated [CO2] and water stress on physiological traits and gene expression during vegetative growth in four Durum Wheat genotypes. Front. Plant Sci. 7:1738. doi: 10.3389/fpls.2016.01738
Medlyn, B. E., Barton, C. V. M., Broadmeadow, M. S. J., Ceulemans, R., De Angelis, P., Forstreuter, M., et al. (2001). Stomatal conductance of forest species after long-term exposure to elevated CO2 concentration: a synthesis. New Phytol. 149, 247–264. doi: 10.1046/j.1469-8137.2001.00028.x
Mirecki, R. M., and Teramura, A. H. (1984). Effects of ultraviolet-B irradiance on soybean.V. The dependence of plant sensitivity on the photosynthetic photon flux density during and after leaf expansion. Plant Physiol. 74, 478–480. doi: 10.1104/pp.74.3.475
Morison, J. I. L. (1998). Stomatal response to increased CO2 concentration. J. Exp. Bot. 49, 443–452. doi: 10.1093/jxb/49.Special_Issue.443
Munjonji, L., Ayisi, K. K., Vandewalle, B., Haesaert, G., and Boeck, P. (2016). Combining carbon-13 and oxygen-18 to unravel triticale grain yield and physiological response to water stress. Field Crops Res. 195, 36–49. doi: 10.1016/j.fcr.2016.06.001
Noguchi, K., Watanabe, C. K., and Terashima, I. (2015). Effects of elevated atmospheric CO2 on primary metabolite levels in Arabidopsis thaliana Col-0 leaves: an examination of metabolome data. Plant Cell Physiol. 56, 2069–2078. doi: 10.1093/pcp/pcv125
Oberbauer, S. F., Strain, B. R., and Fetcher, N. (1985). Effect of CO2-enrichment on seedling physiology and growth of two tropical tree species. Physiol. Plant. 65, 352–356. doi: 10.1111/j.1399-3054.1985.tb08658.x
O'Leary, G. J., Christy, B., Nuttall, J., Huth, N., Cammarano, D., Stöckle, C., et al. (2015). Response of wheat growth, grain yield and water use to elevated CO2 under a Free-Air CO2 Enrichment (FACE) experiment and modelling in a semi-arid environment. Glob. Chang. Biol. 21, 2670–2686. doi: 10.1111/gcb.12830
Pande, P., Datta, P., Bhattacharya, S., and Tyagi, S. (1995). Post-anthesis metabolic-enrichment of H218O in wheat grain. Indian J. Exp. Biol. 33, 394–396.
Pearson, J., Clough, E. C. M., Woodall, J., Havill, D. C., and Zhang, X. H. (1998). Ammonia emissions to the atmosphere from leaves of wild plants and Hordeum vulgare treated with methionine sulphoximine. New Phytol. 138, 37–48. doi: 10.1046/j.1469-8137.1998.00880.x
Peñuelas, J., Biel, C., and Estiarte, M. (1995). Growth, biomass allocation, and phenology responses of pepper to elevated CO2 concentrations and different water and nitrogen supply. Photosynthetica 31, 91–99.
Pérez-Jiménez, M., Pazos-Navarro, M., Piñero, M. C., Otálora-Alcón, G., López-Marín, J., and del Amor, F. M. (2016). Regulation of the drought response of sweet pepper (Capsicum annuum L.) by foliar-applied hormones, in Mediterranean-climate greenhouse conditions. Plant Growth Reg. 80, 159–169. doi: 10.1007/s10725-016-0153-3
Piñero, M. C., Pérez-Jiménez, M., López-Marín, J., and del Amor, F. M. (2016). Changes in the salinity tolerance of sweet pepper plants as affected by nitrogen form and high CO2 concentration. J. Plant Physiol. 200, 18–27. doi: 10.1016/j.jplph.2016.05.020
Raimanová, I., and Haberle, J. (2010). The effects of differentiated water supply after anthesis and nitrogen fertilization on δ15N of wheat grain. Rapid Commun. Mass Spectrom. 24, 261–266. doi: 10.1002/rcm.4382
Rebetzke, G. J., Condon, A. G., Richards, R. A., and Farquhar, G. D. (2002). Selection for reduced carbon isotope discrimination increases aerial biomass and grain yield of rainfed bread wheat. Crop Sci. 42, 739–745. doi: 10.2135/cropsci2002.0739
Robinson, D., Handley, L. L., Scrimgeour, C. M., Gordon, C., Forster, B. P., and Ellis, R. P. (2000). Using stable isotope natural abundances (δ15N and δ13C) to integrate the stress responses of wild barley (Hordeum spontaneum C Koch.) genotypes. J. Exp. Bot. 51, 41–50. doi: 10.1093/jexbot/51.342.41
Roden, J. S., and Ehleringer, J. R. (1999). Observations of hydrogen and oxygen isotopes in leaf water confirm the Craig-Gordon model under wide-ranging environmental conditions. Plant Physiol. 120, 1165–1173. doi: 10.1104/pp.120.4.1165
Sánchez-Bragado, R., Araus, J. L., Scheerer, U., Cairns, J. E., Rennenberg, H., and Ferrio, J. P. (2016). Factors preventing the performance of oxygen isotope ratios as indicators of grain yield in maize. Planta 243, 355–368. doi: 10.1007/s00425-015-2411-4
Scheidegger, Y., Saurer, M., Bahn, M., and Siegwolf, R. (2000). Linking stable oxygen and carbon isotopes with stomatal conductance and photosynthetic capacity: a conceptual model. Oecologia 125, 350–357. doi: 10.1007/s004420000466
Schubert, B. A., and Jahren, A. H. (2012). The effect of atmospheric CO2 concentration on carbon isotope fractionation in C3 land plants. Geochim. Cosmochim. Acta 96, 29–43. doi: 10.1016/j.gca.2012.08.003
Shangguan, Z. P., Shao, M. A., and Dyckmans, J. (2000). Nitrogen nutrition and water stress effects on leaf photosynthetic gas exchange and water use efficiency in winter wheat. Environ. Exp. Bot. 44, 141–149. doi: 10.1016/S0098-8472(00)00064-2
Shannon, P., Markiel, A., Ozier, O., Baliga, N. S., Wang, J. T., Ramage, D., et al. (2003). Cytoscape: a software environment for integrated models of biomolecular interaction networks. Genome Res. 13, 2498–2504. doi: 10.1101/gr.1239303
Sheshshayee, M. S., Bindumadhava, H., Ramesh, R., Prasad, T. G., Lakshminarayana, M. R., and Udayakumar, M. (2005). Oxygen isotope enrichment (Delta O-18) as a measure of time averaged transpiration rate. J. Exp. Bot. 56, 3033–3039. doi: 10.1093/jxb/eri300
Stitt, M., and Krapp, A. (1999). The interaction between elevated carbon dioxide and nitrogen nutrition: the physiological and molecular background. Plant Cell Environ. 22, 583–621. doi: 10.1046/j.1365-3040.1999.00386.x
Sulpice, R., Nikoloski, Z., Tschoep, H., Antonio, C., Kleessen, S., Larhlimi, A., et al. (2013). Impact of the carbon and nitrogen supply on relationships and connectivity between metabolism and biomass in a broad panel of Arabidopsis accessions. Plant Physiol. 162, 347–363. doi: 10.1104/pp.112.210104
Takatani, N., Ito, T., Kiba, T., Mori, M., Miyamoto, T., Maeda, S., et al. (2014). Effects of high CO2 on growth and metabolism of Arabidopsis seedlings during growth with a constantly limited supply of nitrogen. Plant Cell Physiol. 55, 281–292. doi: 10.1093/pcp/pct186
Tcherkez, G. (2010). Natural 15N/14N isotope composition in C3 leaves: are enzymatic isotope effects informative for predicting the 15N- abundance in key metabolites? Funct. Plant Biol. 38, 1–12. doi: 10.1071/FP10091
Tcherkez, G., and Hodges, M. (2008). Special issue opinion paper. How stable isotopes may help to elucidate primary nitrogen metabolism and its interaction with (photo)respiration in C3 leaves. J. Exp. Bot. 59, 1685–1693. doi: 10.1093/jxb/erm115
Turner, N. C. (1988). Measurement of plant water status by the pressure chamber technique. Irrigation Sci. 9, 289–308.
Tzin, V., and Galili, G. (2010). New insights into the shikimate and aromatic amino acids biosynthesis pathways in plants. Mol. Plant 3, 956–972. doi: 10.1093/mp/ssq048
Vicente, R., Martínez-Carrasco, R., Pérez, P., and Morcuende, R. (2016a). An association network reveals co-regulation of carbon and nitrogen metabolism-related parameters in durum wheat grown under different environmental conditions. New Biotechnol. 33:414. doi: 10.1016/j.nbt.2015.10.079
Vicente, R., Pérez, P., Martínez-Carrasco, R., Feil, R., Lunn, J. E., Watanabe, M., et al. (2016b). Metabolic and transcriptional analysis of durum wheat responses to elevated CO2 at low and high nitrate supply. Plant Cell Physiol. 57, 2133–2146. doi: 10.1093/pcp/pcw131
Vicente, R., Pérez, P., Martínez-Carrasco, R., Usadel, B., Kostadinova, S., and Morcuende, R. (2015). Quantitative RT-PCR platform to measure transcript levels of C and N metabolism-related genes in durum wheat: transcript profiles in elevated [CO2] and high temperature at different nitrogen supplies. Plant Cell Physiol. 56, 1556–1573. doi: 10.1093/pcp/pcv079
Werner, R. A., and Schmidt, H. L. (2002). The in vivo nitrogen isotope discrimination among organic plant compounds. Phytochemistry 61, 465–484. doi: 10.1016/S0031-9422(02)00204-2
Wullschleger, S. D., and Oosterhuis, D. M. (1991). Osmotic adjustment and the growth response of seven vegetable crops following water-deficit stress. Horstscience 26, 1210–1212.
Xu, Z., Jiang, Y., Jia, B., and Zhou, G. (2016). Elevated-CO2 response of stomata and its dependence on environmental factors. Front. Plant Sci. 7:657. doi: 10.3389/fpls.2016.00657
Xu, Z., Shimizu, H., Ito, S., Yagasaki, Y., Zou, C., Zhou, G., et al. (2014). Effects of elevated CO2, warming and precipitation change on plant growth, photosynthesis and peroxidation in dominant species from North China grassland. Planta 239, 421–435. doi: 10.1007/s00425-013-1987-9
Yousfi, S., Serret, M. D., and Araus, J. L. (2009). Shoot δ15N gives a better reflection than ion concentration or Δ13C of genotypic differences in the response of durum wheat to salinity. Funct. Plant Biol. 36, 144–155. doi: 10.1071/FP08135
Yousfi, S., Serret, M. D., Márquez, A. J., Voltas, J., and Araus, J. L. (2012). Combined use of δ13C, δ18O and δ15N tracks nitrogen metabolism and genotypic adaptation of durum wheat to salinity and water deficit. New Phytol. 194, 230–244. doi: 10.1111/j.1469-8137.2011.04036.x
Yu, J., and Woo, K. C. (1991). Correlation between the development of photorespiration and the change in activities of NH3 assimilation enzymes in greening oat leaves. Aust. J. Plant Physiol. 18, 583–588.
Yu, J., Du, H., Xu, M., and Huang, B. (2012). Metabolic responses to heat stress under elevated atmospheric CO2 concentration in a cool-season grass species. J. Am. Soc. Hortic. Sci. 137, 221–228. Available online at: http://journal.ashspublications.org/content/137/4/221.abstract
Keywords: [CO2], nitrogen, sweet pepper, photosynthesis, water stress, δ13C, δ15N, δ18O
Citation: Serret MD, Yousfi S, Vicente R, Piñero MC, Otálora-Alcón G, del Amor FM and Araus JL (2018) Interactive Effects of CO2 Concentration and Water Regime on Stable Isotope Signatures, Nitrogen Assimilation and Growth in Sweet Pepper. Front. Plant Sci. 8:2180. doi: 10.3389/fpls.2017.02180
Received: 26 July 2017; Accepted: 12 December 2017;
Published: 04 January 2018.
Edited by:
Roberto Tuberosa, Università di Bologna, ItalyReviewed by:
Iker Aranjuelo, Instituto de Agrobiotecnología (IDAB), SpainPedro Revilla, Misión Biológica de Galicia (CSIC), Spain
Copyright © 2018 Serret, Yousfi, Vicente, Piñero, Otálora-Alcón, del Amor and Araus. This is an open-access article distributed under the terms of the Creative Commons Attribution License (CC BY). The use, distribution or reproduction in other forums is permitted, provided the original author(s) or licensor are credited and that the original publication in this journal is cited, in accordance with accepted academic practice. No use, distribution or reproduction is permitted which does not comply with these terms.
*Correspondence: José L. Araus, jaraus@ub.edu