 Francesco Giunta
 Pasquale De Vita
 Anna M. Mastrangelo
 Gavino Sanna
 Rosella Motzo
- 1Sez. Agronomia, Coltivazioni erbacee e Genetica, Dipartimento di Agraria, University of Sassari, Sassari, Italy
- 2Consiglio per la Ricerca in Agricoltura e L'analisi Dell'economia Agraria-Centro Cerealicoltura e Colture Industriali (CREA-CI), Foggia, Italy
- 3Consiglio per la Ricerca in Agricoltura e L'analisi Dell'economia Agraria-Centro Cerealicoltura e Colture Industriali (CREA-CI), Bergamo, Italy
Phenology has a profound effect on adaptation and productivity of crops. The impact of phenology on tillering and fertility traits of durum wheat (Triticum turgidum L. subsp. durum Desf.) was evaluated with the aim of specifying which group of flowering genes (Vrn, Ppd, or eps) was involved in their control. A recombinant inbred line population was grown under four contrasting conditions of vernalization and daylength. Phenotyping was carried out according to robust phenological models dissecting both phenological and yield related traits. Whole-genome profiling was performed using the DArT-Seq technology. The genetic variability for tillering was mainly related to the genetic variability for vernalization sensitivity, as shown by the many quantitative trait loci (QTLs) identified in non-vernalized plants associated to both tillering and phenological traits. No effects of photoperiod sensitivity on spikelet number were detected in short-day-grown plants, apparently because of limited genetic variability in photoperiod sensitivity of the population. Earliness per se was involved in control of spikelet number via final leaf number, with these traits genetically correlated and sharing some QTLs. Chaff weight and number of kernels per g chaff were negatively associated and related to anthesis date under most conditions. QTL mapping uncovered novel loci involved in phenological control of tillering and fertility traits, and confirmed the presence of several well-established loci. Phenotyping of both phenology and kernel number according to a robust physiological model amplified the possibility of identifying genetic factors underlying their variations. Also, isolating known flowering gene cues by manipulation of environmental conditions provided the opportunity for each group of genes to be expressed without confounding effects of the others. This information helps to predict the consequences of either genetic manipulation of flowering genes and changes in environmental conditions on the potential yield of durum wheat.
Introduction
Grain yield improvements in wheat have been highly associated with increased kernel number per unit area, with little change achieved for the individual kernel weight (Giunta et al., 2007; Foulkes et al., 2011, and references therein). The numerical yield component of kernel number per unit area can be further split into the number of fertile spikes per unit area and the number of kernels per spike, or the spike fertility. Both the number of tillers produced by a wheat plant, which is a component of the number of spikes per unit area, and the spike fertility are determined in part by the wheat development (Hay and Porter, 2006). Wheat development is a complex process that is controlled by several genes that are classified according to whether they respond to vernalization (Vrn) or the photoperiod (Ppd), or whether they confer earliness per se (Eps) (Snape et al., 1996, 2001; Worland, 1996; Law and Worland, 1997; Laurie et al., 2004). These genes modulate flowering time through their control of variations in the final leaf number, the phyllochron, and the duration of the flag leaf–anthesis interval (Sanna et al., 2014).
The emergence of the first leaf tiller coincides with the appearance of the tip of leaf 4. The subsequent primary tillers emerge at regular intervals of one phyllochron (Baker and Gallagher, 1983; Kirby et al., 1985; Masle, 1985). Around the time that the main shoot apex reaches the terminal spikelet stage, the tillers begin to die in the reverse order of their emergence (Hay and Kirby, 1991; Evers et al., 2006, and references therein). In bread and durum wheat, and in barley, the leaf number of the main shoot at which tillering ceases is correlated with the total number of leaves on the main shoot (Kirby et al., 1985; Giunta et al., 2015). The phyllochron and the final leaf number therefore set the upper limit to the number of tillers per plant (Kirby et al., 1985; Borràs et al., 2009). A number of quantitative trait loci (QTLs) that control tillering have been described in wheat, and generally in bread wheat (Kato et al., 2000; Li et al., 2002, 2010; Huang et al., 2003, 2004; Kumar et al., 2007; Naruoka et al., 2011; Jia et al., 2013; Yang et al., 2013; Zhang et al., 2013; Deng et al., 2015; Xie et al., 2016). However, in only a few cases have any attempts been made to relate these QTLs to flowering genes.
The spike-fertility trait that is more closely related to development is the number of spikelets per spike. The period of spikelet initiation on the apex begins when the interplay of the responses of the genotype to the photoperiod and to vernalization determines the switch from the vegetative to the reproductive phase (McMaster, 1997). Therefore, the timing of the transition of the main stem apex to the reproductive stage influences both the tillering ability and the spike fertility. The duration of spikelet initiation from the formation of the first reproductive primordium, or collar, to the appearance of the terminal spikelet, lasts at least 2–3 weeks (i.e., several hundred degree-days; Hay and Kirby, 1991). This is directly controlled by the temperature and the photoperiod (Kirby, 1990).
Spike fertility can also be analyzed in terms of the chaff weight and the number of kernels per g chaff (Stapper and Fischer, 1990; Motzo et al., 2011; Guo et al., 2017), and the developmental rate is also involved here. Variation in chaff weight is associated with phasic development via its association with both the spikelet number (Gaju et al., 2009) and the length of the stem elongation phase, when spike growth takes place. This latter period is crucial for spike fertility (Gonzáles et al., 2005; Slafer et al., 2009), and hence it is also linked to the number of kernels per g chaff.
To date, a number of QTLs have been found in wheat in terms of fertility traits, and these numbers have grown rapidly in the last few years (Miura et al., 1992, 1994; Araki et al., 1999; Huang et al., 2004; Zhou et al., 2006; Li et al., 2007; Cui et al., 2012; Hu et al., 2015), although only in a few cases has any relationship been established between fertility traits and development (Kato et al., 2000; Hu et al., 2015).
In the light of the tight link between both tillering and spikelet number and development, any breeding studies that are aimed at modification of these traits has to take into account their genetic and physiological interrelationships with the flowering genes. This might also include the need to discriminate the different impacts of these three groups of genes that control development.
The objectives of the present study were essentially two-fold: (i) to determine to what degree the variability in tillering and spike fertility traits is associated with the variability in development, and more specifically, whether the genotypic relationships between the tillering and spike fertility traits are differentially affected by Eps, or show differential sensitivity to the photoperiod or vernalization; and (ii) to identify the chromosomal locations of the genes and/or QTLs that influence the expression of tillering and spike-related traits under different environmental conditions.
Materials and Methods
Plant Materials and Experimental Design
This study was carried out at Ottava, Sardinia, Italy (41°N, 8°E, 80 m a.s.l.) across the 2010/11 and 2012/13 seasons with a RIL population bred from the cross between cv. “Ofanto” (an early flowering, semi-dwarf cultivar that was released in 1990) and cv. “Senatore Cappelli” (a late flowering, tall cultivar that was released in 1915). For the 2010–11 season, 98 RILs and the parents were used to compare three conditions that were previously described in Sanna et al. (2014): May-sown plants (thus with long daylight period) that were artificially vernalised (LD-V) and not vernalised (LD-NV) were grown in pots outdoors, and December-sown plants (with short daylight period) that were artificially vernalised (SD-V) were grown in pots in a greenhouse (Table 1). Two pots (each containing three plants) arranged in a completely randomized design were assigned to each RIL/treatment combination. Then this same RIL population, which included the parents, was sown in the field on 11 December 2012 (SD-FI). These seeds were not artificially vernalized, but their December sowing guaranteed some natural vernalization, in contrast to the LD-NV condition for the May sowing, which excluded any natural vernalization. The plots comprised six 1.2-m rows, each separated by 15 cm, laid out as a randomized complete block design with three replications.
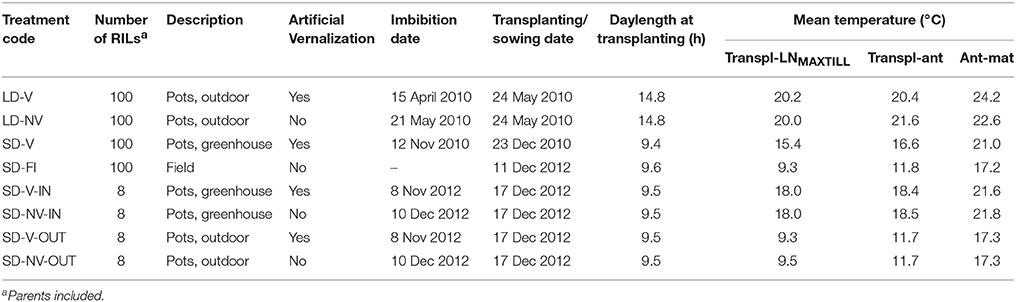
Table 1. Conditions applied to the plants and prevailing thermal and photoperiod conditions.
In the 2012–13 season, another study was carried out in pots with a sub-set of six of these RILs and the two parents. The six RILs selected were those with the more extreme final leaf number (FLN) that was recorded for each of the three 2010–11 conditions. A set of similarly sized artificially vernalized and non-vernalized seedlings was transplanted into a total of 48 pots, both within a greenhouse (i.e., SD-V-IN, SD-NV-IN) and outdoors (i.e., SD-V-OUT, SD-NV-OUT) on 17 December 2012. Vernalization was achieved according to Sanna et al. (2014). Three pots (each containing three plants) were assigned to each condition × RIL combination. The pots were arranged according to a completely randomized design, and their relative positions were periodically changed. All of the experiments plants were grown under conditions of optimal water and nutrient availability.
Phenotyping
In all of the experiments, the plants were monitored on a twice-weekly basis, to record the time of anthesis (ANT) of the main stem (i.e., stage 65; Zadoks et al., 1974). For the 2010/11 part of the study, the time of arrival at the “terminal spikelet” stage (TS) was estimated non-destructively from the measurements of the rate of elongation of the plantlets, as described by Sanna et al. (2014). For all of the study, the Haun stage (Haun, 1973) was recorded twice weekly, and used to calculate the regression against the accumulated thermal time, to obtain the rate of leaf appearance and its inverse, the phyllochron (PHY). These Haun stage measurements also allowed determination of time of the flag leaf appearance (FLA) and final leaf number (FLN).
Tillering was monitored throughout the study, except for the SD-FI group. The number of tillers per plant was recorded weekly during the Haun stage determination, and continued until no more tillers were produced for three subsequent sampling dates. At maturity, the number of tillers bearing spikes for each plant was counted, together with the number of fertile spikes. The tillering data were used to calculate the maximum number of tillers (MAXTILL), the number of fertile tillers (i.e., tillers bearing a fertile ear; FERTTILL), the percentage of fertile tillers (FERTTILL%), the Haun stage when MAXTILL was reached (LNMAXTILL), and the rate of tillering (RATE = MAXTILL/LNMAXTILL; number of tillers per emerged leaf).
At maturity the spikes of the main stems were harvested separately from the spikes on the tillers. The following measurements were determined separately on the main stem and tiller spikes: number of total spikelets (SPKLT); number of kernels per spike (K/SPIKE) and per fertile spikelet (K/SPKLT); and chaff weight (CHAFF). The number of kernels per g chaff (K/CHAFF) was obtained by dividing K/SPIKE by CHAFF (Gonzalez et al., 2011; Guo et al., 2017).
Statistical Treatment of the Phenotypic Data
For the whole RIL population, the statistical analysis was the same as that described in Sanna et al. (2014). For the subset dataset that included six RILs and the parents (i.e., the 2012–13 pot experiment), analysis of variance was performed to define any effects of vernalization and or the thermal regime (i.e., outdoor vs. greenhouse) on the traits measured according to a complete randomized design.
Map Construction and QTL Mapping
An updated version of the “Ofanto” × “Cappelli” genetic map that was reported previously (Marone et al., 2012) was developed and used for the QTL analysis. Whole-genome profiling was performed using the DArT-Seq technology (Diversity Arrays Technology Pty Ltd, Australia). Briefly, the genetic map was composed of 32 linkage groups that covered all of the chromosomes, except chromosome 1A. The total number of markers was 9,267, of which 4,033 were on the A genome and 5,594 were on the B genome. The number of markers per chromosome varied from 162 (chromosome 4B) to 1,217 (chromosome 6B). The map length spanned 2,119.2 cM, as 965.5 cM for the A genome, and 1,153.7 cM for the B genome.
QTL analysis was performed using the composite interval mapping method (Zeng, 1994) with the Qgene software, version 4.3.10 (Joehanes and Nelson, 2008). A simplified, but representative, version of the linkage map with a total of 1,627 non-co-mapping markers was used to speed up the computation time. A scanning interval of 1 cM between markers and putative QTLs was used, with a window size of 10 cM, to detect the QTLs. Marker cofactors for the background control were set by single marker regression and simple interval analysis, with a maximum of five controlling markers. Putative QTLs were defined as two or more linked markers that were associated with a trait at a logarithm of the odds ratio (LOD) equal to or >3. Suggestive QTLs at the sub-thresholds as 2.0 < LOD < 3.0 values were also considered only where they co-localized with one or more statistically significant QTLs. For the main QTL effects, the positive sign of the estimates indicates that the “Ofanto” allele contributed toward higher values for the trait. The intervals of the QTLs and the flanking markers were determined following the method described by Darvasi and Soller (1997). The proportion of phenotypic variance explained (PVE) by a single QTL was determined by the square (R2) of the partial correlation coefficient. Graphical representations of the linkage groups were carried out using the MapChart 2.2 software (Voorrips, 2002). Candidate genes were searched in the chromosomal interval of the major QTLs identified in the present study. The sequences of the DArTseq markers (around 70 bp) within the estimated interval of each QTL were used as queries in a BLAST search against the bread wheat genome in the EnsemblPlants website with default parameters, except the “short sequences” option in the “search sensitivity” field, (https://plants.ensembl.org/Triticum_aestivum/Tools/Blast?db=core). The output of this search was the scaffold corresponding to each marker, and for each scaffold the physical and the genetic position were available (Clavijo et al., 2017). These positions were compared to those obtained in the same way for a number of candidate genes retrieved in the literature for the traits considered in the present study. In particular, the sequences of candidate genes were retrieved in the Gene Bank through the NCBI website (https://www.ncbi.nlm.nih.gov/) with the accession numbers and gene names reported in literature (see references for each gene in the Results section).
Results
Phenology
In the two experiments with May sowing, the daylength was the maximum natural daylength for the latitude of this Mediterranean environment (i.e., long day; LD; Table 1), whereas all the other experiments had December sowing where the plants were grown under short-day conditions (SD). The thermal environment was highly variable across the conditions, not only as a consequence of the various sowing/transplanting dates, but also because three of the experiments were performed in greenhouses (i.e., SD-V, SD-V-IN, SD-NV-IN) and the others outdoors (i.e., LD-V, LD-NV, SD-FI, SD-V-OUT, SD-NV-OUT). This also resulted in variations in the radiative environment between the greenhouse and outdoors, as the photosynthetically active radiation within the greenhouse was about half that recorded outdoors.
The eight conditions/ environments compared had large effects on the length of the transplanting–anthesis period (Table 2), which varied from 42 to 147 days. The shorter transplanting–anthesis periods were during the long-day studies and were mainly attributable to the short phyllochron (<80 °Cd). In response to the artificial vernalization, about two leaves less were produced (FLN, 11 vs. 13, P < 0.0001). A detailed discussion of the phenological data relative to these LD and SD-V studies was given in Sanna et al. (2014).
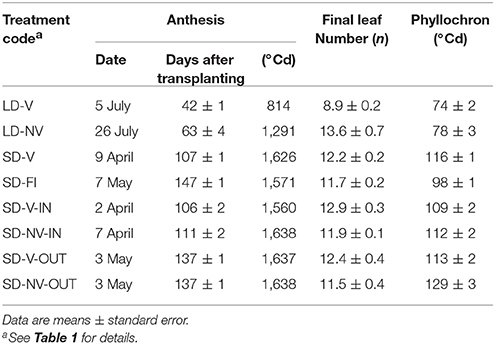
Table 2. Phenological traits recorded for the eight conditions (based on the eight lines in common).
Quantitative Trait Loci Mapping and Phenology
In general, the QTLs associated with the phenological traits were characterized by higher LOD scores, and they had higher PVE than the tillering and fertility traits (Table 3). The inclusion of the field study in addition to the three pot experiments of Sanna et al. (2014), and the updated genetic map used here with respect to that used by Sanna et al. (2014), resulted in the detection of more QTLs for developmental traits than in Sanna et al. (2014). The most important among these new QTLs (PVE > 20%) that were identified in these four environments according to the phenological traits were mainly located on chromosomes of groups 1, 2, 3, and 7 (Figure S1). Three relevant new QTLs were detected under the LD-V conditions: QTL 19 on linkage group 3B-1 associated to ANT (PVE = 20%), and two other QTLs (i.e., 4, 58) associated to FLN with PVE 30 and 20%, respectively. The lack of artificial vernalization under the long-day conditions resulted in the mapping of QTL 33, as QTL 10 previous described by Sanna et al. (2014), with the new map giving higher LOD scores and PVE (up to 59% for ANT and 47% for PHY). Three new QTLs for PHY were identified in SD-grown plants, as two on chromosome 2B (QTL 10, PVE = 21%; QTL 15, PVE = 20%) and one on chromosome 7A-1 (QTL 50, PVE = 28%). Three other QTLs were detected for the SD-V plants, associated to FLA and ANT (QTL 11) and FLN (QTLs 22, 50). The new SD-FI conditions resulted in detection of QTL 16 for FLA, QTL 58 for ANT, and QTL 10 associated to FLA and ANT as well as PHY. This last (i.e., QTL 10) corresponded to QTL 4 of Sanna et al. (2014), although with higher LODs and PVE (FLA, 40%; ANT, 69%). In general, under the SD conditions either in the greenhouse or in the field, the contributions of the chromosomal regions around the Ppd-B1 locus (i.e., linkage group 2B-1) were demonstrated, even if the peak markers and the relative QTLs associated with ANT and FLA were different.
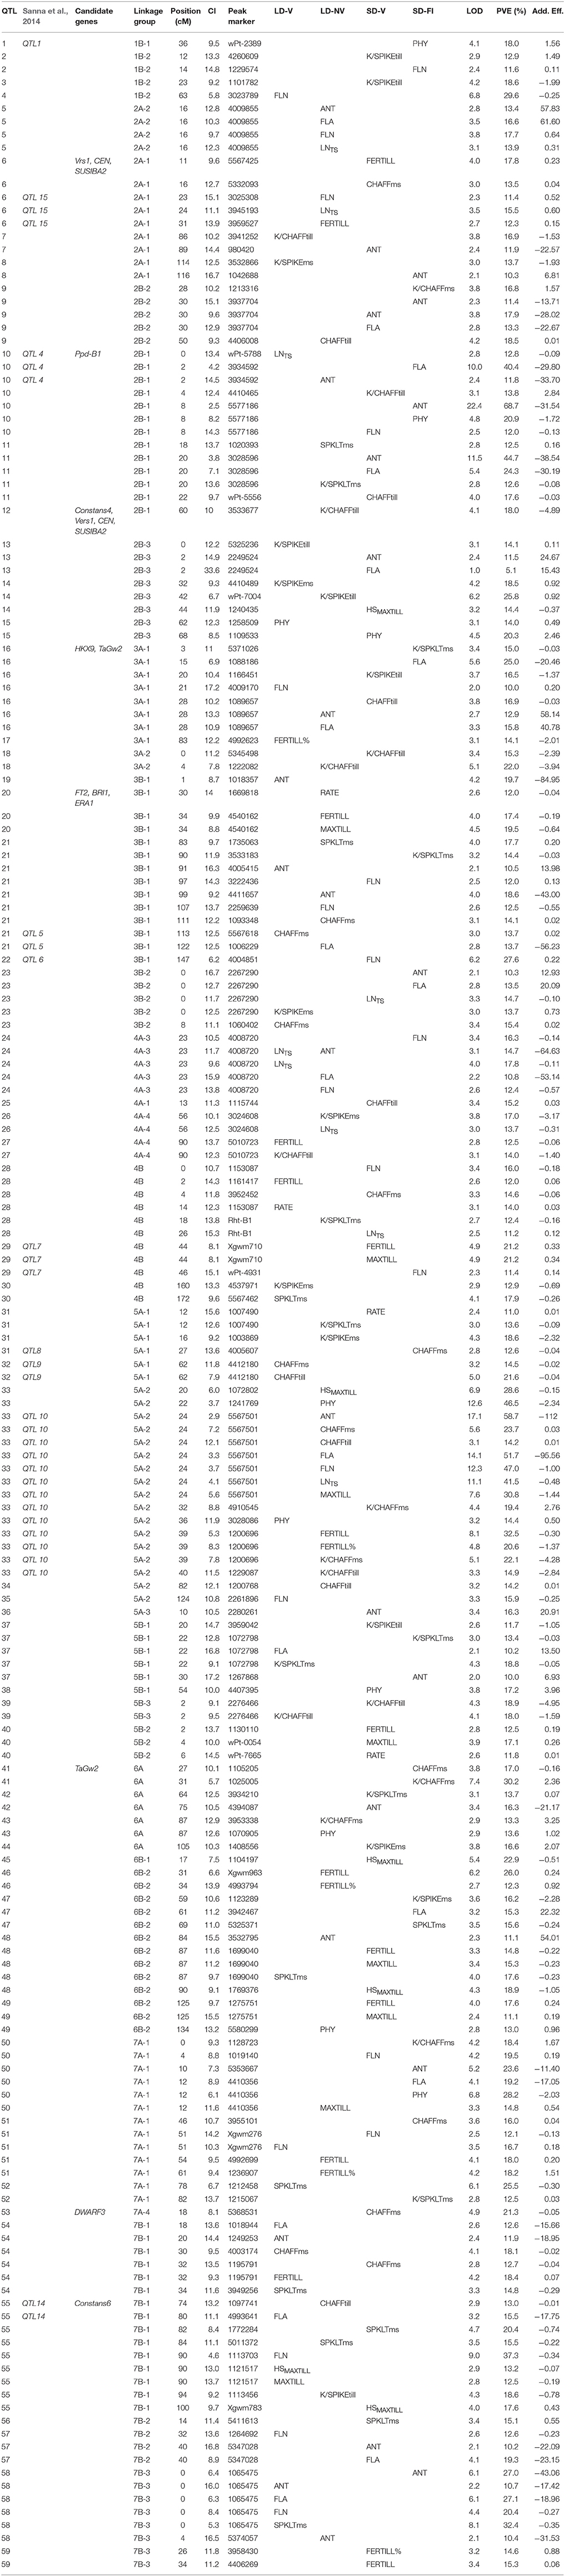
Table 3. Quantitative trait loci identified for each condition, their position relative to each linkage group, their confidence interval, LOD, PVE, and additive effect.
Tillering Phenotyping
The ANOVA derived from the full dataset indicated the absence of any main genetic effects for most of the tillering traits, and the presence of a major genotype × treatment interaction (Table S1). The range of variability between the RILs for MAXTILL and RATE was highest under the LD-NV condition (11 tillers; 0.6 tillers per leaf, respectively; Figure 1). This large genetic variability reflected transgressive segregation, as the differences between the parents were much smaller than the range of RILs. The distributions of the RILs for the tillering traits were normal or skewed toward smaller values.
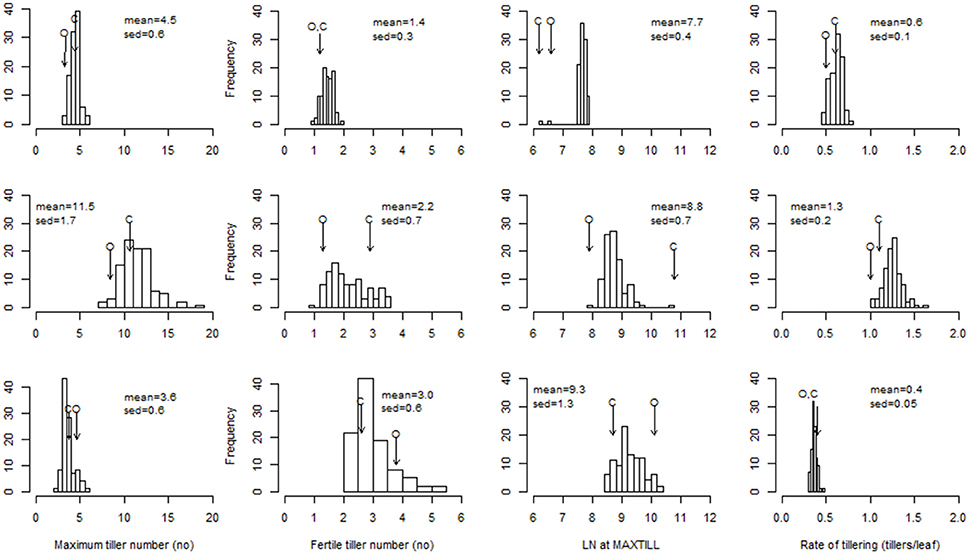
Figure 1. Distribution of the ril best linear unbiased predictors (BLUPs) for maximum tiller number, fertile tiller number, leaf number at MAXTILL, and rate of tillering. Top row to bottom row: LD-V plants, LD-NV plants, SD-V plants. Arrows indicate the performance of the parents (O: cv. “Ofanto”; C: cv. “Senatore Cappelli”). sed: standard error of the difference between BLUPs.
The comparison between the LD-V and LD-NV environments allowed estimation of the effects of vernalization on the tillering traits. Absence of vernalization defined higher MAXTILL (11.5 vs. 4.5), which was derived from both higher LNMAXTILL (8.8 vs. 7.7 leaves) and higher RATE (1.3 vs. 0.6 tillers per leaf; Figure 1). A rate of tillering >1.0 means that tillers of order >1.0 were produced. This can explain why this effect of vernalization on the MAXTILL was reduced when the FERTILL numbers (i.e., tillers bearing a spike at maturity) were compared (1.96 vs. 1.42). Most of the secondary and tertiary tillers did not survive to produce a spike, and the proportion of sterile tillers increased at the higher MAXTILL numbers of the NV environment (from 73 to 83%). On the other hand, these high percentages of sterile tillers cannot be attributed to inter-plant competition for resources, as these plants were grown in pots with optimal nutrient and water availability and without any competition for radiation. In any case, a genetic correlation was observed within each environment between MAXTILL and FERTILL (r = 0.31, P ≤ 0.01 in LDV; r = 0.58, P ≤ 0.001 in LDNV; r = 0.89, P ≤ 0.001 in SDV).
These effects of vernalization were also analyzed in the “subsets” shown in Table 4, with the aim being to determine whether the vernalization effects on tillering observed in the population under the long-day conditions and the relatively high temperatures of May and June were also evident under the short-days and the different thermal conditions. This subset confirmed the positive effects of the lack of vernalization on tillering. The non-vernalized RILs produced a mean of 9.6 ± 0.3 tillers, vs. 7.4 ± 0.2 produced by the vernalized RILs. However, this difference was derived solely from the higher number of tillers per leaf produced without vernalization, as LNMAXTILL was the same. The smaller, although still significant, difference in MAXTILL observed in this case between vernalization and non-vernalization can be attributed to some natural vernalization of the NV plants, as the temperatures were lower than those of the LD conditions (Table 1) due to the different thermal environments of the different sowing dates. The tiller mortality or sterility was of the same order of magnitude to that observed for the long days, which lead to a lack of any effects of vernalization on the number of fertile tillers.
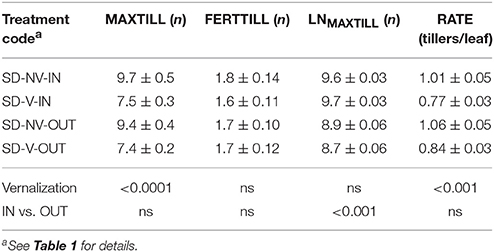
Table 4. Tillering traits recorded for the subsets, and results of ANOVA.
Cultivar “Senatore Cappelli” was the parent with the highest MAXTILL and FERTILL under all of the non-vernalized conditions (including the subsets). This was not a consequence of the Rht genes, because the comparison of the two groups of 100 RILs of different genotypes at the Rht-B1 locus showed that their differences in MAXTILL and FERTILL were not significant.
The effects of temperature on tillering were evaluated in the subsets by comparing plants grown in the greenhouse (Table 4, IN) with those grown in the same period outdoors (Table 4, OUT). These data show that the higher temperatures inside the greenhouse only increased LNMAXTILL (from 8.8 ± 0.04 to 9.6 ± 0.02), without any effects on MAXTILL.
The genetic correlations between the tillering and phenological traits reported in Table 5 clearly show that the lack of vernalization resulted in the strongest relationships between phenology and tillering traits. In contrast, the limiting photoperiod conditions of SD-V had almost no effects on the establishing of any relationships between phenology and tillering. A role of the Eps genes on tillering was also apparent, as most of the phenological traits were correlated with most of the tillering traits in the LD-V plants.
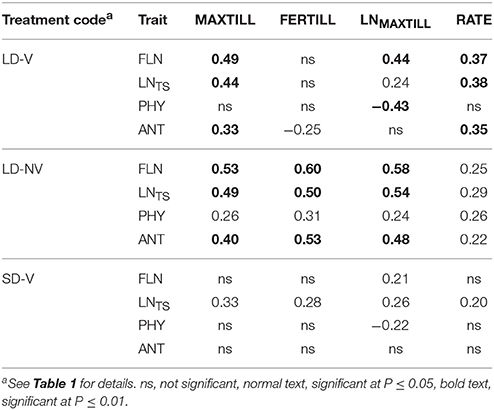
Table 5. Genetic correlations among the measured tillering and phenological traits for the long day vernalized and non-vernalized plants, and the short day vernalized plants.
The only phenological trait that was always associated with tillering was LNTS, which affected MAXTILL, RATE, and LNMAXTILL in all of the environments. This indicates that the higher the LNTS, the longer the period available for tillering (i.e., expressed as number of leaves produced during tillering), the higher the number of tillers per leaf, and ultimately, the higher the MAXTILL. A high LNTS can derive from the long duration of the sowing–TS period and/or from a high rate of leaf primordia production due to high temperatures. In both cases, the increased number of leaves at TS represented more potential tillering sites. Time to anthesis and FLN affected tillering in the two long-day environments, but not under the SD-V conditions, when the photoperiod alone was controlling development, because in this case genetic variability in LNTS was not related to anthesis. PHY had only a marginal impact on tillering.
Tillering QTLs
For the tillering traits, this study identified a total of 33 QTLs, where nine of these explained phenotypic variance >20% (Table 3). Under the SD-V conditions, where the Ppd genes were active, the QTLs associated with the LNMAXTILL, FERTILL and MAXTILL traits were located on chromosomes 6B (QTLs 45, 48) and 4B (QTL 29), respectively. Under these conditions, although the region on chromosome 2B that was close to the Ppd-B1 locus was very active in its effects on the duration of the main phenological stages of the crop, it did not affect tillering.
In contrast, when the Vrn genes were active (i.e., under the SD-NV conditions), the association with the major QTL 33 located on the linkage group 5A-2 in the same region as the Vrn-A1 locus was highly significant for all tillering traits (from 21 to 33%), except for RATE. QTL 33 was also associated with all of the phenological traits examined, and in all cases it explained phenotypic variation >40%. Under these conditions (i.e., SD-NV), also the effects of QTL 46 (chromosome 6B) on FERTILL (Xgwm963) and QTL 20 (chromosome 3B) on MAXTILL were significant.
On the contrary, under the conditions in which the Eps genes were active (i.e., LD-V), the only significant associations identified were those for RATE on chromosome 4B (QTL 28) and for FERTILL on chromosome 7B (QTL 54). RATE was the main determinant of MAXTILL under the LD-V conditions, and the chromosomal regions identified for this trait flanked the Rth-B1 locus on chromosome 4B (QTLs 28, 29). Accordingly, when the RILs were grouped based on their genotypes at the Rht-B1 locus, significant difference was detected for MAXTILL under the LD-V conditions (4.08 vs. 4.55, P < 0.05). The apparent effect of the Eps genes on tillering traits that was highlighted by the genetic correlations was not confirmed by the molecular analysis.
Fertility Phenotyping
The SD-V conditions provided the environment where there was the largest range of variability between the RILs (Figure 2) in fertility traits, and where the highest heritabilities within the environment (Table S2) were observed. For most of the traits, the large genetic variability of the SD-V–grown RILs was not reflected in transgressive segregation, as the differences between the parents were almost as large as the population range (Figure 2). In general, environmental conditions induced a higher variation in SPKLT (i.e., from means of 13 for LD-V to 24 for SD-V) compared to genotype (i.e., from 2.5 to 5.3 under the SD-V conditions).
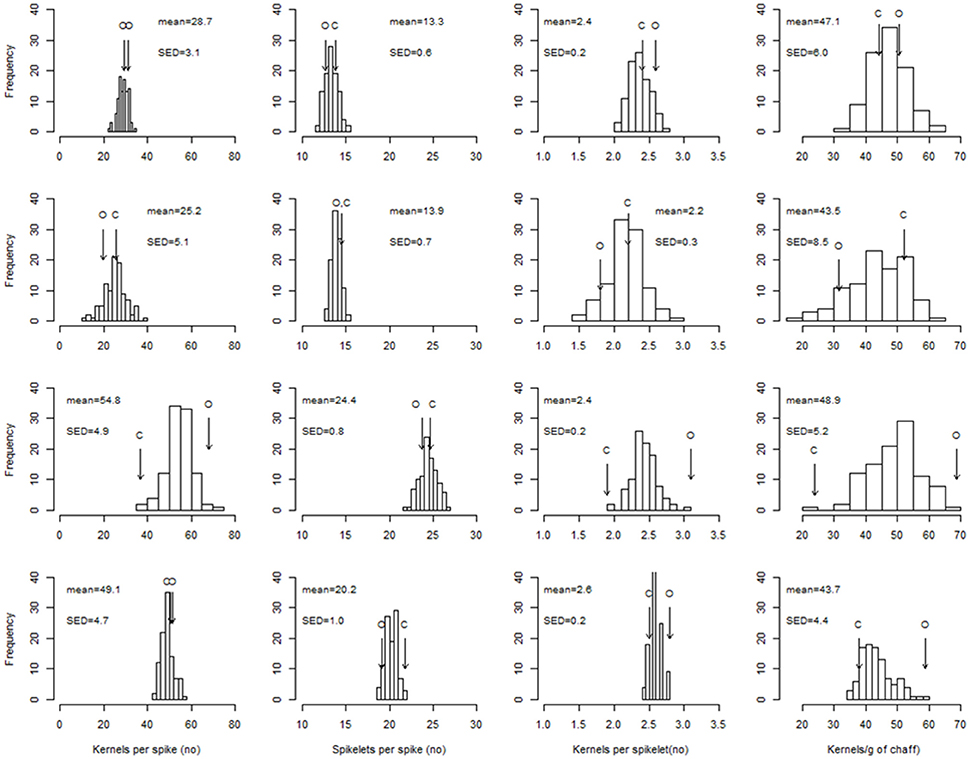
Figure 2. Distribution of the RIL best linear unbiased predictors (BLUPs) for the number of kernels per spike, spikelets per spike, kernels per spikelet, and kernels per g chaff. Top row to bottom row: LD-V plants, LD-NV plants, SD-V plants, SD-FI plants. Arrows indicate the performance of the parents (O: cv. “Ofanto”; C: cv. “Senatore Cappelli”). SED: standard error of the difference between BLUPs.
According to the mean population values, the short-day conditions had positive effects on both SPKLT (i.e., from 13.3 to 24.4 with the vernalized plants) and K/SPIKE (i.e., from 28.7 to 54.8 with the vernalized plants), although the short days of the December sowing and the long days of the May sowing also differed greatly for the thermal conditions (16.6 vs. 20.4°C, respectively, in the sowing–anthesis period). To reduce this difference in temperature, the plants grown in the greenhouse in the SD-V-IN subset (i.e., 18.4°C in the sowing–anthesis period; Table 6) were compared with the same subset of lines extracted from the LD-V (data not shown). SPKLT was still significantly higher under the short days (23.7 vs. 13.4, P < 0.001), as was K/SPIKE (49.0 vs. 32.4, P < 0.001) and CHAFF (1.57 vs. 0.64 g spike−1, P < 0.001), whereas K/CHAFF was lower (32 vs. 51 grains g−1, P < 0.001). The subsets supported the positive effect of the higher temperatures recorded in the greenhouse compared to outdoors seen for SPKLT (23.8 ± 0.2 vs. 20.4 ± 0.4) and CHAFF (1.44 ± 0.06 vs. 1.04 ± 0.04). In contrast to the daylength effect, higher SPKLT was not accompanied by higher K/SPIKE, because of the negative effect of the greenhouse conditions on K/SPKLT (2.2 ± 0.1 vs. 2.5 ± 0.1). A higher K/CHAFF was observed outdoors (44.8 ± 2.0) compared to in the greenhouse (33.1 ± 1.7), which was probably derived from the lower radiation in the greenhouse during spike growth, compared to outdoors.
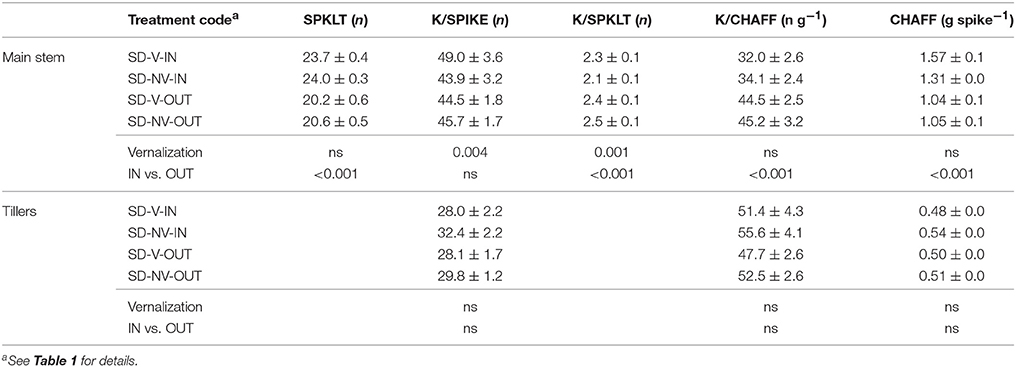
Table 6. Fertility traits recorded for the subset for main stems and tillers, and results of ANOVA.
The environmental association between SPKLT and K/SPIKE was also seen at the genetic level (Table 7), although in this case, K/SPKLT and K/CHAFF explained a greater proportion of K/SPIKE than SPKLT for all of the environments. The impact of phenology on fertility traits, and on SPKLT in particular, was maximum under the LD-V conditions, when the genetic variation in SPKLT was associated with the concomitant variation in FLN, ANT, and LNTS.
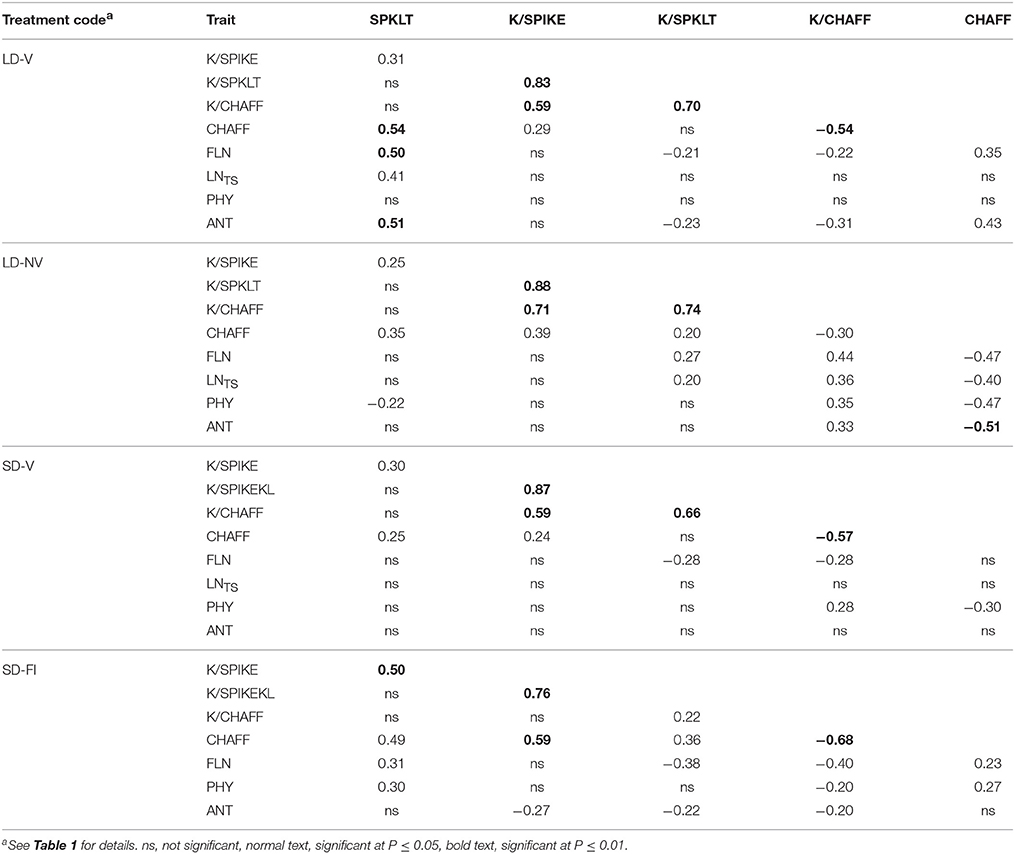
Table 7. Genetic correlations among the measured fertility and phenological traits for the long day vernalized and non-vernalized plants, and the short day vernalized and naturally vernalized plants.
The same genes controlled the main stem and tiller fertility traits, as was seen by the close association between these (data not shown).
Fertility QTLs
The number of significant QTLs associated with spike fertility and detected for the main stem (ms) and tillers (till) were 39 and 21, respectively, and were almost equally distributed among the environments. For SPKLTms, 11 QTLs were identified in the present study, three of which explained more than 20% of phenotypic variance and were located on chromosomes 7A and 7B (QTLs 58, 52, 55). All of the associations recorded for group 7 chromosomes for the SPKLTms trait overlapped with the FLN trait. In particular, SPKLTms and FLN shared the same peak marker 1065475 that was identified in LD-V plants for QTL 58 on chromosome 7B, and shared with QTL 55 on chromosome 7B, although with different peak markers. Then, on linkage group 7A-1, both of these traits reported a QTL closely associated in the same region. In addition, under the LD-V conditions, QTL 30 on chromosome 4B and QTL 48 on chromosome 6B were also identified.
For K/SPKLTms, eight QTLs were identified. One of these (i.e., QTL 37) showed a good PVE (19%), was localized on chromosome 5B with peak marker 1072798, and was co-located with the phenological trait FLA in the same environment (LD-V). Another QTL for K/SPKLTms (i.e., QTL 28 on chromosome 4B) had the Rht-B1 gene as a peak marker, and explained 12% of the phenotypic variation in the fertility trait.
For K/SPIKEms, eight QTLs were identified located on eight different chromosomes, which explained up to 19% of its phenotypic variation. Of these, QTL 26 (PVE = 17%) shared the same peak marker with the phenological trait LNTS in the LD-NV plants. K/SPIKEms also shared the same QTL 47 (PVE = 16%) with the phenological trait FLA for the SD-FI conditions. Of all of the QTLs for K/SPIKEms, only QTL 14 on linkage group 2B-3 showed a close association with the same trait detected for tillers (K/SPIKEtill). Apart from QTL 14, the chromosomal regions significantly involved in the expression of K/SPIKEtill were localized on linkage group 7B-1 (QTL 55) and 1B-2 (QTL 3).
For CHAFFms, 11 QTL were identified (nine with LOD >3), and those with a more marked effect were located on chromosomes 5A (QTL 33), 7A (QTL 53), 7B (QTL54), and 6A (QTL 41). Of these, QTL 54 overlapped with the QTL identified for SPKLT, FLN, and ANT, whereas QTL 33 (under the LD-NV conditions) and QTL 41 (under the SD-FI conditions) overlapped with two of the most important QTLs identified for K/CHAFFms. The association between CHAFFms and K/CHAFFms on QTL 41 and the opposite sign of their additive affects strongly support the negative genetic correlation (r = −0.68, P < 0.01) calculated between CHAFF and K/CHAFF under the SD-FI conditions. The analysis of tillers revealed seven QTLs associated with CHAFFtill, only two of which (i.e., QTLs 32, 33, on chromosome 5A) overlapped with those recorded for the main stem.
K/CHAFFms was associated with five QTLs, two of which (i.e., QTL 41 on chromosome 6A, QTL 33 on chromosome 5A) explained 30 and 22%, respectively, of its variation. QTL 41 was identified under the SD-V conditions, but QTL 33 was found under the NV conditions. This established a link between K/CHAFF and most of the phenological traits governed by the Vrn genes. The genetic correlation between K/CHAFF and K/SPIKLT seen for all of the environments was not confirmed at the molecular level, although QTL 41 co-located on the same chromosome (6A) at a relatively short distance, with QTL 42 associated with both K/SPIKLT and ANT under the SD-V conditions. Of the eight QTLs associated with K/CHAFFtill, only two QTLs were common to K/CHAFFms, while the rest (with greater PVE) were located on other chromosomal regions (i.e., QTL 12, 2B-1; QTL 39, 5B-3).
Search for Candidate Genes
The search for candidate genes within the confidence interval of the major QTLs identified in the present study revealed some interesting correspondences (Table 3 and Figure S1). First of all, the Ppd-B1 gene was found in the region of QTLs 10 and 11, as already suggested by its position in the genetic map. The wheat orthologous genes corresponding to Constans4 (Griffiths et al., 2003), Six-rowed spike 1 (Vrs1—Komatsuda et al., 2007), CENTRORADIALS (CEN—Comadran et al., 2012), and SUSIBA2 (SUGAR SIGNALLING IN BARLEY 2—Su et al., 2015) were mapped within the interval of the QTL 12 on chromosome 2B, and their homoeologous copies were also mapped to chromosome 2A in correspondence of the QTL 6. Other correspondences with candidate genes were identified for QTLs of the group 3. The wheat gene TaGID2 (Lou et al., 2016) and the wheat orthologous of the rice gene HEXOKINASE9 (HKX9—Cho et al., 2006) were mapped to the same interval of the QTL 16 on chromosome 3A, while the wheat orthologous of the barley genes FT2 (Faure et al., 2007), and BRASSINOSTEROID-INSENSITIVE 1 (BRI1—Saisho et al., 2004), were located within the interval of the QTL 20 on chromosome 3B, together with the wheat gene ENHANCED RESPONSE TO ABSCISIC ACID 1 (ERA1—Edae et al., 2013). The region of QTL 41 on chromosome 6A corresponded to the wheat gene TaGw2 (Simmonds et al., 2014). Finally, two correspondences were also found for the group 7: the wheat orthologous of the rice gene DWARF3 (Zhao et al., 2014) with the QTL 53 on chromosome 7A, and the barley one Constans 6 (Griffiths et al., 2003) with the QTL 55 on chromosome 7B.
Discussion
The physiological association between phenology and the yield components of tillering and spike fertility in wheat was analyzed at the molecular level using the QTLs already identified by Sanna et al. (2014), and several other QTLs identified in the same population through a novel field experiment and the use of an updated genetic map. Among these, the most interesting new QTLs for phenology were associated with the phyllochron in the SD-V and SD-FI (natural vernalization) plants. These QTLs were located on chromosomes 2B and 7A, and they explained a high proportion of the phenotypic variation for PHY (i.e., from 20 to 28 %). In particular, the Ppd-B1 gene was found in the region of QTL 10 on linkage group 2B-1 (corresponding to QTL 4 of Sanna et al., 2014). This therefore confirms the key role of the variation in PHY in prolonging the sensitivity to the photoperiod of wheat plants after terminal spikelet formation (Miralles and Richards, 2000; Gonzáles et al., 2005; Sanna et al., 2014). In agreement with Sanna et al. (2014), who attributed the long TS-ANT of the SD-V plants to both the number of leaves emerging after TS and PHY, the two new QTLs for PHY defined in the present study were identified for the SD-grown plants.
Tillering
Differences in tillering capacity (Lupton et al., 1974; Ali Dib et al., 1992) and in spike fertility (De Vita et al., 2007; Giunta et al., 2007) between old Italian cultivars, such as “Senatore Cappelli,” and modern Italian cultivars, such as “Ofanto,” gave origin to moderate to large genotypic variation in both the tillering and fertility traits, which depended on the flowering genes activated by the treatment applied.
Although tillering traits are indeed expected to be highly dependent on environmental factors (McMaster, 1997; Dreccer et al., 2013), the absence of nutrient and water limitations and the low plant density adopted here allowed us to demonstrate the genetic variability for tillering in durum wheat, as already seen for barley (Borràs et al., 2009; Alqudah et al., 2016) and bread wheat (Borràs-Gelonch et al., 2012). Both the phenotyping and the QTL analysis demonstrated a major role for the Vrn genes on the control of tillering, which was independent of any photoperiod or temperature effects. This was expected because the length of the vegetative period and the leaf number increase in plants when the vernalization requirements are not satisfied, which thus establishes more potential sites for tillering (Gomez-MacPherson and Richards, 1997). This was reflected in the higher MAXTILL and LNMAXTILL of the non-vernalized plants, a trait that was associated with development via LNTS. The effect of the lack of vernalization on MAXTILL was much greater than that on FERTILL. Also, in the absence of resource limitations, the onset of stem elongation indeed establishes strong intra-plant competition, which results in senescence of the youngest tillers (McMaster, 1997). In any case, the RILs with more MAXTILL also showed higher FERTILL, as already discussed by Dreccer et al. (2013), and many QTLs controlling both traits were detected.
At the molecular level, the role of the Vrn genes on tillering was established by the co-location of the Vrn-A1 locus with QTL 33 on chromosome 5A. This QTL was heavily involved in the control of tillering under the NV conditions, which confirms some previous studies (Snape et al., 1985; Roberts, 1989; Miura and Kuroshima, 1996; Kato et al., 2000; Kosner and Pankova, 2001; Cui et al., 2012; Jia et al., 2013; Xie et al., 2016), along with the meta-analysis carried out by Zhang et al. (2010). Consistent with our findings, Kato et al. (2000) identified three other QTLs along chromosome 5A that showed minor effects on tillering.
The LD-NV conditions also allowed the identification of significant QTLs for tillering traits on homology group 3 and linkage group 7A-1. In particular, QTL 20 on chromosome 3B is associated with MAXTILL and FERTILL, and represents a new, well-defined and specific QTL. Its importance for tillering was confirmed by the candidate gene analysis which mapped this QTL close to the wheat gene ENHANCED RESPONSE TO ABSCISIC ACID 1 (ERA1). ERA1 was one of the five drought tolerance candidate genes studied by Edae et al. (2013) to identify functional markers involved in drought tolerance in bread wheat. In two environments ERA1-B was associated to spikes per square meter, and this association was detected under both dry and irrigated conditions. QTL 51 on chromosome 7A coincided with QTn.ipk-7A identified by Huang et al. (2004), with the common marker Xgwm276. It is interesting to note that QTL 51 was identified under the NV conditions, and Law (1996) localized the Vrn-B4 locus on chromosome 7. Moreover, the Vrs1 gene mapped to chromosome 2A in correspondence of the QTL 6 confirms the role of this gene for tillering discussed in barley by Alqudah et al. (2016).
The only tillering trait where the variation was not associated with QTL 33 under the LD-NV conditions was RATE. A possible effect of the Rht genes on RATE emerged at the molecular level in the LD-V plants, which confirms the relationship between tillering and the Rht genes that was proposed by Irfaq et al. (2005); this demonstrated that semi-dwarf lines with Rht-B1 or Rht-D1 also show high productive tiller numbers. Under the SD-V conditions, RATE was also associated with QTL 31 on chromosome 5A, although this association explained only 11% of the phenotypic variation for this trait. This QTL is probably the same QTL as that reported previously by Jia et al. (2013) for tiller number (Qtn.nau-5A) on chromosome 5A, flanked by Xbarc56-Xgwm156.1.
In spite of the limiting photoperiod conditions of the SD-V environment, no QTL for tillering was associated with the region on chromosome 2B where the Ppd genes are located. This means that the chromosomal regions controlling the development via photoperiodism are different from those controlling tillering. The reason for this lack of effect of photoperiod sensitivity on tillering is that in this population the Ppd genes acted only on the length of the phenological phases subsequent to the tillering phase; i.e., terminal spikelet–anthesis (Sanna et al., 2014).
Many of the QTLs for tillering identified in this study that were not related with phenology and that each explained 18–19% of the phenotypic variance were located on chromosomes of homology groups 6 and 7, according to previous studies (Li et al., 2002; Huang et al., 2003; An et al., 2006; Kumar et al., 2007; Naruoka et al., 2011; Yang et al., 2013).
Fertility
The impact on grain yield of variations in spikelet numbers induced by phasic development was shown by Rawson (1970), who demonstrated that grain yield per spike was dependent on spikelet numbers within each cultivar, when spikelet numbers were varied by daylength or vernalization conditions. The limiting daylength of the SD conditions had large positive effects on spikelet numbers, compared with the LD conditions, as was observed previously by Miralles and Richards (2000) and by Giunta et al. (2001). This appears to be due to the lengthening of the period available for spikelet initiation (Rawson, 1970; Arduini et al., 2009). The difference of about 10 spikelets per spike between the SD and LD conditions is comparable to the maximum difference in spikelet numbers between sowing dates observed by Arduini et al. (2009) in durum wheat sown at monthly intervals throughout a whole year. The large genotypic variation (i.e., range of 5.4 spikelets per spike) and relatively high heritability for spikelet number revealed by the limiting daylength of the SD environments was not associated with any developmental trait. In other words, changing the daylength produced an effect on SPKLT that was much larger than that seen when varying the genotypes within a daylength-limiting environment. However, this might be a consequence of the scarce genetic variability in the photoperiod sensitivity that was noted previously by Sanna et al. (2014) for this RIL population.
Genetic correlations highlighted a relationship between SPKLT and development only in the environment where Eps was driving development (i.e., the LD-V conditions). Also, the positive effects of high temperatures on SPKLT observed in the subsets can be interpreted as a result of Eps, because the actions of the Eps genes are modulated by temperature (Slafer and Rawson, 1995). Under the LD-V conditions, SPKLT was correlated with FLN and ANT, an association that was observed previously by Giunta et al. (2001) for both durum wheat and triticale. The Eps genes are believed to act via changes in the number of leaf or spikelet primordia initiated (Hoogendoorn, 1985) or the rate of primordia initiation (Gotoh, 1977), which thus establishes significant correlations between time to flowering and number of spikelets produced on the main stem (Worland et al., 1994; Worland, 1996). The data at the molecular level are consistent with this association, because the main QTLs associated with SPKLT overlapped with those associated with FLN and were mainly detected under the LD-V conditions on chromosomes 7A and 7B. One of these QTLs was common to QTL 14 previously identified by Sanna et al. (2014) for these same materials. Sanna et al. (2014) suggested a role for QTL 14 on Eps, a hypothesis that was also supported by Flood and Halloran (1983) and Hoogendoorn (1985), for which the Eps genes in bread wheat are localized on chromosome 7B. In the present study, QTL 55 on chromosome 7B was associated to FLN, and SPKLTms shared a common marker (wPt-8615) with QTL QKSk.ndsu.7B identified by Echeverry-Solarte et al. (2015), who associated this QTL with a series of yield-related traits and with the number of kernels per spikelet. An association between SPKLT and the Eps genes was also shown by Hu et al. (2015). Among a total of 22 significant associations for spike-related traits, Hu et al. (2015) associated one reliable SNP marker (BG314551_3_A_Y_162) with spikelet number on the main stem on chromosome arm 3AS in the same region as the Eps genes. Also, in diploid wheat, the chromosome region that includes the Eps locus Eps-Am1 affects the duration of early developmental phases and the spikelet number (Lewis et al., 2008).
The Vrn-A1 locus did not affect SPKLT in the present study, in contrast with Kato et al. (2000), who associated spikelet number with the Vrn-A1 alleles on chromosome arm 5AL, and found two QTLs for spikelet number on the same arm. From a physiological point of view, cold requirements are not expected to be directly related to SPKLT, because spikelet primordia are produced once the cold requirements have been satisfied (Brown et al., 2013). On the other hand, the lower developmental rate caused by the lack of cold requirements satisfaction might indirectly change the number of spikelets initiated by moving the period of spikelet primordia induction to different photoperiod conditions.
K/SPKLT contributed greatly to the genetic variation in K/SPIKE in all of the environments, and was associated with Rht-B1 on chromosome 4B. The most important consequence of the introduction of the Rht genes was the greater amount of dry matter allocated to the spikes at the expense of the stems (Austin et al., 1980; Chandler and Harding, 2013). Guo et al. (2017) demonstrated that in bread wheat this change allowed more spikelets to survive, and at the same time, it increased the survival of the distal florets within a spikelet; i.e., K/SPKLT. On the other hand, K/SPKLT was only weakly associated with phenology. Only under SD-FI conditions K/SPKLTms co-located with the phenological trait FLA on QTL 16, where the wheat orthologous of the rice gene HEXOKINASE9 (HXK9—Cho et al., 2006), associated to spikelet fertility in Guo et al. (2017) was mapped. Environmental conditions around FLA can affect floret fertility (Fischer, 2011), particularly under field conditions, thus explaining the co-location of FLA and K/SPIKLT on QTL 16.
Variations in the other two components of spike fertility (i.e., CHAFF, K/CHAFF) were negatively associated at both the genetic and molecular levels. This is in contrast with Motzo et al. (2011), who showed no relationship between these two traits in triticale, but in agreement with Terrile et al. (2017) in bread wheat. The negative correlation between CHAFF and K/CHAFF reduces the possibility of exploiting the high heritability calculated for both traits in the combined ANOVA. Phenology had only limited effects on these two traits. The LD-V plants defined a positive relationship between CHAFF and SPKLT that was supported by the genetic correlations and by QTL 54, as indicated previously by Gaju et al. (2009) (indeed, more spikelets are expected to result in heavier spikes). QTL 54 was also indicative of an effect of phenology on CHAFF via FLA and ANT, which highlights the importance of the Eps genes for CHAFF.
Under the SD-V conditions, K/CHAFF was associated with ANT and FLN because the later anthesis arose in this environment through lengthening of the TS-ANT phase (Sanna et al., 2014); i.e., the period of spike growth. This is of key importance for spike fertility (Slafer et al., 2009).
The LD-NV plants suggested some effects of the Vrn genes on both CHAFF and K/CHAFF, because both of these traits co-located with most of the phenological traits on QTL 33. A role for the Vrn genes on CHAFF was also demonstrated by Kato et al. (2000), who showed significant effects of different regions of chromosome 5A on CHAFF. This apparent association can be interpreted as an indirect effect of the Vrn genes, as Sanna et al. (2014) demonstrated that they can extend their effects beyond terminal spikelet formation, in the TS-ANT phase, via an increase in the number of leaves emerging after TS, and consequently in PHY.
Following Guo and Schnurbusch (2015) the relationship between CHAFF and MAXTILL was explored. The two traits were negatively associated (r = −0.37, P < 0.001) only in the LD-NV environment, i.e., the environment with the highest MAXTILL and hence the greatest intra-plant competition.
As well as the pleiotropic effects that flowering genes can have on fertility traits, some of the QTLs identified in the present study were not related to development. For K/SPIKEms, QTL 26 on chromosome 4A that was associated with this trait coincided with QKS.ndsu.4A defined by Echeverry-Solarte et al. (2015), as demonstrated by the common marker wPt-2247. Moreover, QTL 14 on chromosome 2B-3 associated to K/SPIKEms and K/SPIKEtill was only 5 cM from SNP IAAV1502 that was associated with tiller number in the study of Guo et al. (2017). The association between K/SPIKE and the QTL 55, where the CONSTANS6 gene (Griffiths et al., 2003) was located, confirms the association found by Guo et al. (2017) between CONSTANS6, floret primordia loss and maximum floret number. Also, QTL 21 (chromosome 3B-1) was associated with K/SPKLTms and was located about 20 cM from SNP IWB11679 identified by Guo et al. (2017) for grain number, grains per spike, and tiller and grain number per spikelet. The results of the association mapping for CHAFF also appeared particularly useful. Indeed, in the present study in addition to known regions on chromosome 5A (Guo et al., 2017), we identified new genetic regions on chromosomes 7A (QTL 53), 7B (QTL 54), and 6A (QTL 41) with strong PVE (from 17 to 22%). The mapping of Vrs1 close to QTL 12, which explains 18% of the phenotypic variation in K/CHAFF, might depend on the role of Vrs1 protein, which suppresses floret primordia development within wheat spikelets thus influencing grain number.
Conclusions
Phenotyping of both phenology and kernel number according to a robust physiological model amplified the possibility to identify the genetic factors underlying their variations, and at the same time facilitated the analysis of how phenology impacts on kernel number at the genetic level. Moreover, isolation of known flowering gene cues by manipulation of the environmental conditions provided the opportunity for each group of genes to be expressed without confounding effects of the others, and for the definition of the interactions of each QTL with the environment. This was particularly useful for the Eps genes, which usually have smaller effects than those associated with sensitivity to either photoperiod or vernalization. Unfortunately, the low level of photoperiod sensitivity that characterized the specific RIL population analyzed limited the possibility to detect pleiotropic effects of the Ppd genes on kernel number.
Additional studies on allelic variations of developmental genes using wheat germplasm collections will generalize to a great extent our knowledge of their effects on the yield-related traits of durum wheat.
Author Contributions
FG and RM: Conceived the project, designed the field and pot experiments, analyzed the pertaining data and wrote the article with contributions of all authors; GS: Supervised the field and pot experiment and acquired field and pot data; AM and PD: Provided the recombinant inbred line population, performed the genetic analysis, and complemented the writing on the genetic topics.
Funding
The authors acknowledge the financial support under the special grant ISCOCEM (PON01_01145) from the Italian Ministry of Education, University and Research (MIUR). This research was also supported by Cluster MIUR Project SOFIA (2014–2016) SOSTENIBILITA' DELLA FILIERA AGROALIMENTARE.
Conflict of Interest Statement
The authors declare that the research was conducted in the absence of any commercial or financial relationships that could be construed as a potential conflict of interest.
Acknowledgments
This research represents part of a Ph.D. project carried out by GS at the Doctoral School of “Science and Biotechnology of Agricultural and Forestry Science and of Food Production,” curriculum of “Crop productivity,” of the University of Sassari. The authors wish to thank Christopher Berrie for scientific English language editorial assistance.
Supplementary Material
The Supplementary Material for this article can be found online at: https://www.frontiersin.org/articles/10.3389/fpls.2018.00008/full#supplementary-material
Abbreviations
ANT, time of anthesis; CHAFF, chaff weight; FERTTILL, number of fertile tillers; FERTTILL%, percentage of fertile tillers; FLN, final leaf number; FLA, flag leaf appearance; K/CHAFF, number of kernels per g chaff; K/SPIKE, number of kernels per spike; K/SPKLT, number of kernels per fertile spikelet; LNMAXTILL, leaf number when MAXTILL reached; MAXTILL, maximum number of tillers; PHY, phyllochron; PVE, phenotypic variation explained; QTLs, quantitative trait loci; RATE = MAXTILL/LNMAXTILL, rate of tillering; RIL, recombinant inbred line; SPKLT, number of total spikelets; TS, terminal spikelet stage.
References
Ali Dib, T., Monneveux, P., and Araus, J. L. (1992). Adaptation à la sécheresse et notion d'idéotype chez le blé dur. II. Caractères physiologiques d'adaptation. Agronomie 12, 381–393. doi: 10.1051/agro:19920504
Alqudah, A. M., Koppolu, R., Wolde, G. M., Graner, A., and Schnurbusch, T. (2016). The genetic architecture of barley plant stature. Front. Genet. 7:117. doi: 10.3389/fgene.2016.00117
An, D. G., Su, J. Y., Liu, Q. Y., Zhu, Y. G., Tong, Y. P., Li, J. M., et al. (2006). Mapping QTL for nitrogen uptake in relation to the early growth of wheat (Triticum aestivum L.). Plant Soil 284, 73–84. doi: 10.1007/s11104-006-0030-3
Araki, E., Miura, H., and Sawada, S. (1999). Identification of genetic loci affecting amylose content and agronomic traits on chromosome 4A of wheat. TAG Theor. Appl. Genet. 98, 977–984. doi: 10.1007/s001220051158
Arduini, I., Ercoli, L., Mariotti, M., and Masoni, A. (2009). Sowing date affect spikelet number and grain yield of durum wheat. Cereal Res. Commun. 37, 469–478. doi: 10.1556/CRC.37.2009.3.16
Austin, R. B., Morgan, C. L., Ford, M. A., and Blackwell, R. D. (1980). Contributions to grain-yield from pre-anthesis assimilation in tall and dwarf barley phenotypes in 2 contrasting seasons. Ann. Bot. 45, 309–319. doi: 10.1093/oxfordjournals.aob.a085826
Baker, C. K., and Gallagher, J. N. (1983). The development of winter wheat in the field. 1. Relation between apical development and plant morphology within and between seasons. J. Agric Sci. 101, 327–335. doi: 10.1017/S0021859600037631
Borràs, G., Romagosa, I., van Eeuwijk, F., and Slafer, G. A. (2009). Genetic variability in the duration of pre-heading phases and relationships with leaf appearance and tillering dynamics in a barley population. Field Crops Res. 113, 95–104. doi: 10.1016/j.fcr.2009.03.012
Borràs-Gelonch, G., Rebetzke, G. J., Richards, R. A., and Romagosa, I. (2012). Genetic control of duration of pre-anthesis phases in wheat (Triticum aestivum L.) and relationships to leaf appearance, tillering, and dry matter accumulation. J. Exp. Bot. 63, 69–89. doi: 10.1093/jxb/err230
Brown, H. E., Jamieson, P. D., Brooking, I. R., Moot, D. J., and Huth, N. I. (2013). Integration of molecular and physiological models to explain time of anthesis in wheat. Ann. Bot. 112, 1683–1703. doi: 10.1093/aob/mct224
Chandler, P. M., and Harding, C. A. (2013). ‘Overgrowth’ mutants in barley and wheat: new alleles and phenotypes of the ‘Green Revolution.’ J. Exp. Bot. 64, 1603–1613. doi: 10.1093/jxb/ert022
Cho, J. I., Ryoo, N., Ko, S., Lee, S. K., Lee, J., Jung, K. H., et al. (2006). Structure, expression, and functional analysis of the hexokinase gene family in rice (Oryza sativa L.). Planta 224, 598–611. doi: 10.1007/s00425-006-0251-y
Clavijo, B. J., Venturini, L., Schudoma, C., Accinelli, G. G., Kaithakottil, G., Wright, J., et al. (2017). An improved assembly and annotation of the allohexaploid wheat genome identifies complete families of agronomic genes and provides genomic evidence for chromosomal translocations. Genome Res. 885–896. doi: 10.1101/gr.217117.116
Comadran, J., Kilian, B., Russell, J., Ramsay, L., Stein, N., Ganal, M., et al. (2012). Natural variation in a homolog of Antirrhinum CENTRORADIALIS contributed to spring growth habit and environmental adaptation in cultivated barley. Nat. Genet. 44, 1388–1392. doi: 10.1038/ng.2447
Cui, F., Ding, A., Li, J., Zhao, C., Wang, L., Wang, X., et al. (2012). QTL detection of seven spike-related traits and their genetic correlations in wheat using two related RIL populations. Euphytica 186, 177–192. doi: 10.1007/s10681-011-0550-7
Darvasi, A., and Soller, M. (1997). A simple method to calculate resolving power and confidence interval of QTL map location. Behav. Genet. 27, 125–132. doi: 10.1023/A:1025685324830
Deng, W., Casao, M. C., Wang, P., Sato, K., Hayes, P. M., Finnegan, E. J., et al. (2015). Direct links between the vernalization response and other key traits of cereal crops. Nat. Commun. 6:5882. doi: 10.1038/ncomms6882
De Vita, P., Nicosia, O. L. D., Nigro, F., Platani, C., Riefolo, C., Di Fonzo, N., et al. (2007). Breeding progress in morpho-physiological, agronomical and qualitative traits of durum wheat cultivars released in Italy during the 20th century. Eur. J. Agron. 26, 39–53. doi: 10.1016/j.eja.2006.08.009
Dreccer, M. F., Chapman, S., Rattey, A. R., Neal, J., Song, Y., Christopher, J. J. T., et al. (2013). Developmental and growth controls of tillering and water-soluble carbohydrate accumulation in contrasting wheat (Triticum aestivum L.) genotypes: can we dissect them? J. Exp. Bot. 64, 143–160. doi: 10.1093/jxb/ers317
Echeverry-Solarte, M., Kumar, A., Kianian, S., Mantovani, E., McClean, P. E., Deckard, E. L., et al. (2015). Genome-wide mapping of spike-related and agronomic traits in a common wheat population derived from a supernumerary spikelet parent and an elite parent. Plant Genome 8. doi: 10.3835/plantgenome2014.12.0089
Edae, E. A., Byrne, P. F., Manmathan, H., Haley, S. D., Moragues, M., Lopes, M. S., et al. (2013). Association Mapping and Nucleotide Sequence Variation in Five Drought Tolerance Candidate Genes in Spring Wheat. Plant Genome 6:2. doi: 10.3835/plantgenome2013.04.0010
Evers, J. B., Vos, J., Andrieu, B., and Struik, P. C. (2006). Cessation of tillering in spring wheat in relation to light interception and red:far-red ratio. Ann. Bot. 97, 649–658. doi: 10.1093/aob/mcl020
Faure, S., Higgins, J., Turner, A., and Laurie, D. A. (2007). The FLOWERING LOCUS T-like gene family in barley (Hordeum vulgare). Genetics 176, 599–609. doi: 10.1534/genetics.106.069500
Fischer, R. A. (2011). Wheat physiology: a review of recent developments. Crop Pasture Sci. 62, 95–114. doi: 10.1071/CP10344
Flood, R. G., and Halloran, G. M. (1983). The influence of certain chromosomes of the hexaploid wheat cultivar Thatcher on time to ear emergence in Chinese Spring. Euphytica 32, 121–124. doi: 10.1007/BF00036871
Foulkes, M. J., Slafer, G. A., Davies, W. J., Berry, P., Sylvester-Bradley, R., Martre, P., et al. (2011). Raising yield potential of wheat. III. Optimizing partitioning to grain while maintaining lodging resistance. J. Exp. Bot. 62, 469–486. doi: 10.1093/jxb/erq300
Gaju, O., Reynolds, M. P., Sparkes, D. L., and Foulkes, M. J. (2009). Relationships between large-spike phenotype, grain number, and yield potential in spring wheat. Crop Sci. 49, 961–973. doi: 10.2135/cropsci2008.05.0285
Giunta, F., Motzo, R., Fois, G., and Bacciu, P. (2015). Developmental ideotype in the context of the dual-purpose use of triticale, barley and durum wheat. Ann. Appl. Biol. 166, 118–128. doi: 10.1111/aab.12167
Giunta, F., Motzo, R., and Pruneddu, G. (2007). Trends since 1900 in the yield potential of Italian-bred durum wheat cultivars. Eur. J. Agron. 27, 12–24. doi: 10.1016/j.eja.2007.01.009
Giunta, F., Motzo, R., and Virdis, A. (2001). Development of durum wheat and triticale cultivars as affected by thermo-photoperiodic conditions. Aust. J. Agric. Res. 52, 387–396. doi: 10.1071/AR00034
Gomez-MacPherson, H., and Richards, R. A. (1997). Effect of sowing on development in wheat isolines differing in vernalisation and photoperiod requirements. Field Crops Res. 54, 91–107. doi: 10.1016/S0378-4290(97)00057-9
Gonzáles, F. G., Slafer, G. A., and Miralles, D. J. (2005). Pre-anthesis development and number of fertile florets in wheat as affected by photoperiod sensitivity genes Ppd-D1 and Ppd-B1. Euphytica 146, 253–269. doi: 10.1007/s10681-005-9021-3
Gonzalez, F. G., Terrile, I. I., and Falcon, M. O. (2011). Spike fertility and duration of stem elongation as promising traits to improve potential grain number (and yield): variation in modern argentinean wheats. Crop Sci. 51, 1693–1702. doi: 10.2135/cropsci2010.08.0447
Gotoh, T. (1977). Varietal differences in photoperiodic and thermal responses of wheat. Jpn. J. Breed. 27, 57–69. doi: 10.1270/jsbbs1951.27.57
Griffiths, S., Dunford, R. P., Coupland, G., and Laurie, D. A. (2003). The evolution of CONSTANS-like gene families in barley, rice, and Arabidopsis. Plant Physiol. 131, 1855–1867. doi: 10.1104/pp.102.016188
Guo, Z., Chen, D., Alqudah, A. M., Röder, M. S., Ganal, M. W., and Schnurbusch, T. (2017). Genome-wide association analyses of 54 traits identified multiple loci for the determination of floret fertility in wheat. New Phytol. 214, 257–270. doi: 10.1111/nph.14342
Guo, Z. F., and Schnurbusch, T. (2015). Variation of floret fertility in hexaploid wheat revealed by tiller removal. J. Exp. Bot. 66, 5945–5958. doi: 10.1093/jxb/erv303
Haun, J. R. (1973). Visual quantification of wheat development. Agron. J. 65, 116–119. doi: 10.2134/agronj1973.00021962006500010035x
Hay, R. K., and Porter, J. R. (2006). The Physiology of Crop Yield. Singapore: Blackwell Publishing.
Hay, R. K. M., and Kirby, E. J. M. (1991). Convergence and synchrony- A review of the coordination of development in wheat. Aust. J. Agric. Res. 42, 661–700. doi: 10.1071/AR9910661
Hoogendoorn, J. (1985). The physiology of variation in the time of ear emergence among wheat-varieties from different regions of the world. Euphytica 34, 559–571. doi: 10.1007/BF00022955
Hu, X., Ren, J., Ren, X., Huang, S., Sabiel, S. A., Luo, M., et al. (2015). Association of agronomic traits with SNP markers in durum wheat (Triticum turgidum L. durum (Desf.)). PLoS ONE 10:e0130854. doi: 10.1371/journal.pone.0130854
Huang, X. Q., Cöster, H., Ganal, M. W., and Röder, M. S. (2003). Advanced backcross QTL analysis for the identification of quantitative trait loci alleles from wild relatives of wheat (Triticum aestivum L.). Theor. Appl. Genet. 106, 1379–1389. doi: 10.1007/s00122-002-1179-7
Huang, X. Q., Kempf, H., Ganal, M. W., and Röder, M. S. (2004). Advanced backcross QTL analysis in progenies derived from a cross between a German elite winter wheat variety and a synthetic wheat (Triticum aestivum L.). Theor. Appl. Genet. 109, 933–943. doi: 10.1007/s00122-004-1708-7
Irfaq, M., Muhammad, T., Amin, M., and Jabar, A. (2005). Performance of yield and other agronomic characters of four wheat genotypes under heat stress. Int. J. Bot. 1, 124–127. doi: 10.3923/ijb.2005.124.127
Jia, H., Wan, H., Yang, S., Zhang, Z., Kong, Z., Xue, S., et al. (2013). Genetic dissection of yield-related traits in a recombinant inbred line population created using a key breeding parent in China's wheat breeding. Theor. Appl. Genet. 126, 2123–2139. doi: 10.1007/s00122-013-2123-8
Joehanes, R., and Nelson, J. C. (2008). QGene 4.0, an extensible Java QTL-analysis platform. Bioinformatics 24, 2788–2789. doi: 10.1093/bioinformatics/btn523
Kato, K., Miura, H., and Sawada, S. (2000). Mapping QTLs controlling grain yield and its components on chromosome 5A of wheat. Theor. Appl. Genet. 101, 1114–1121. doi: 10.1007/s001220051587
Kirby, E. J. M. (1990). Coordination of leaf emergence and leaf and spikelet primordium initiation in wheat. Field Crops Res. 25, 253–264. doi: 10.1016/0378-4290(90)90008-Y
Kirby, E. J. M., Appleyard, M., and Fellowes, G. (1985). Leaf emergence and tillering in barley and wheat. Agronomie 5, 193–199. doi: 10.1051/agro:19850301
Komatsuda, T., Pourkheirandish, M., He, C. F., Azhaguvel, P., Kanamori, H., Perovic, D., et al. (2007). Six-rowed barley originated from a mutation in a homeodomain-leucine zipper I-class homeobox gene. Proc. Natl. Acad. Sci. U.S.A. 104, 1424–1429. doi: 10.1073/pnas.0608580104
Kosner, J., and Pankova, K. (2001). Substitution lines of wheat with dominant genes Vrn. Czech J. Genet. Plant Breed. 37, 41–49.
Kumar, N., Kulwal, P. L., Balyan, H. S., and Gupta, P. K. (2007). QTL mapping for yield and yield contributing traits in two mapping populations of bread wheat. Mol. Breed. 19, 163–177. doi: 10.1007/s11032-006-9056-8
Laurie, D. A., Griffiths, S., Dunford, R. P., Christodoulou, V., Taylor, S. A., Cockram, J., et al. (2004). Comparative genetic approaches to the identification of flowering time genes in temperate cereals. Field Crops Res. 90, 87–99. doi: 10.1016/j.fcr.2004.07.007
Law, C. N. (1996). The location of genetic factors affecting quantitative characters in wheat. Genetics 53, 487–498.
Law, C. N., and Worland, A. J. (1997). Genetic analysis of some flowering time and adaptive traits in wheat. New Phytol. 137, 19–28. doi: 10.1046/j.1469-8137.1997.00814.x
Lewis, S., Faricelli, M. E., Appendino, M. L., Valárik, M., and Dubcovsky, J. (2008). The chromosome region including the earliness per se locus Eps-Am1 affects the duration of early developmental phases and spikelet number in diploid wheat. J. Exp. Bot. 59, 3595–3607. doi: 10.1093/jxb/ern209
Li, H., Jiang, D., Wollenweber, B., Dai, T., and Cao, W. (2010). Effects of shading on morphology, physiology and grain yield of winter wheat. Eur. J. Agron. 33, 267–275. doi: 10.1016/j.eja.2010.07.002
Li, S. S., Jia, J. Z., Wei, X. Y., Zhang, X., Li, L., Chen, H., et al. (2007). A intervarietal genetic map and QTL analysis for yield traits in wheat. Mol. Breed. 20, 167–178. doi: 10.1007/s11032-007-9080-3
Li, W. L., Nelson, J. C., Chu, C. Y., Shi, L. H., Huang, S. H., and Liu, D. J. (2002). Chromosomal locations and genetic relationships of tiller and spike characters in wheat. Euphytica 125, 357–366. doi: 10.1023/A:1016069809977
Lou, X., Li, X., Li, A., Pu, M., Shoaib, M., Liu, D., et al. (2016). Molecular characterization of three GIBBERELLIN-INSENSITIVE DWARF2 homologous genes in common wheat. PLoS ONE 11:e0157642. doi: 10.1371/journal.pone.0157642
Lupton, F. G. H., Oliver, R. H., and Ruckenbauer, P. (1974). An analysis of the factors determining yields in crosses between semi-dwarf and taller wheat varieties. J. Agric. Sci. 82, 483–496. doi: 10.1017/S0021859600051388
Marone, D., Laidò, G., Gadaleta, A., Colasuonno, P., Ficco, D. B., Giancaspro, A., et al. (2012). A high-density consensus map of A and B wheat genomes. Theor. Appl. Genet. 125, 1619–1638. doi: 10.1007/s00122-012-1939-y
Masle, J. (1985). “Competition among tillers in winter wheat: consequences for growth and development of the crop,” in Wheat Growth and Modelling, eds W. Day and R. K. Atkin (New York, NY: Plenum Press), 33–54.
McMaster, G. S. (1997). Phenology, development, and growth of the wheat (Triticum aestivum L.) shoot apex: a review. Adv. Agron. 59, 63–118. doi: 10.1016/S0065-2113(08)60053-X
Miralles, D. J., and Richards, R. A. (2000). Responses of leaf and tiller emergence and primordium initiation in wheat and barley to interchanged photoperiod. Ann. Bot. 85, 655–663. doi: 10.1006/anbo.2000.1121
Miura, H., and Kuroshima, M. (1996). Homologous variation for loci controlling agronomic characters on group-5 chromosomes of wheat. Sabrao J. Breed. Genet. 29, 29–35.
Miura, H., Parker, B. B., and Snape, J. W. (1992). The location of major genes and associated quantitative trait loci on chromosome arm 5BL of wheat. Theor. Appl. Genet. 85, 197–204. doi: 10.1007/BF00222860
Miura, H., Tanii, S., Nakamura, T., and Watanabe, N. (1994). Genetic control of amylose content in wheat endosperm starch and differential effects of three Wx genes. Theor. Appl. Genet. 89, 276–280. doi: 10.1007/BF00225154
Motzo, R., Bassu, S., and Giunta, F. (2011). Variation for kernel number and related traits in triticale (x Triticosecale Wittmack). Crop Pasture Sci. 62, 823–829. doi: 10.1071/CP11192
Naruoka, Y., Talbert, L. E., Lanning, S. P., Blake, N. K., Martin, J. M., and Sherman, J. D. (2011). Identification of quantitative trait loci for productive tiller number and its relationship to agronomic traits in spring wheat. Theor. Appl. Genet. 123, 1043–1053. doi: 10.1007/s00122-011-1646-0
Rawson, H. M. (1970). Spikelet number, its control and relation to yield per ear in wheat. Aust. J. Biol. Sci. 23, 1–16.
Roberts, D. W. A. (1989). Identification of loci on chromosome 5A of wheat involved in control of cold hardiness, vernalization, leaf length, rosette growth habit, and height of hardened plants. Genome 33, 247–259. doi: 10.1139/g90-039
Saisho, D., Tanno, K., Chono, M., Honda, I., Kitano, H., and Takeda, K. (2004). Spontaneous brassinolide-insensitive barley mutants ‘uzu’ adapted to East Asia. Breed. Sci. 54, 409–416. doi: 10.1270/jsbbs.54.409
Sanna, G., Giunta, F., Motzo, R., Mastrangelo, A. M., and De Vita, P. (2014). Genetic variation for the duration of pre-anthesis development in durum wheat and its interaction with vernalization treatment and photoperiod. J. Exp. Bot. 65, 3177–3188. doi: 10.1093/jxb/eru170
Simmonds, J., Scott, P., Leverington-Waite, M., Turner, A. S., Brinton, J., Korzum, V., et al. (2014). Identification and independent validation of a stable yield and thousand grain weight QTL on chromosome 6A of hexaploid wheat (Triticum aestivum L.). BMC Plant Biol. 14:191. doi: 10.1186/s12870-014-0191-9
Slafer, G. A., Kantolic, A. G., Appendino, M. L., Miralles, D. J., and Savin, R. (2009). “Crop development: genetic control, environmental modulation and relevance for genetic improvement of crop yield,” in Crop Physiology: Applications for Genetic Improvement and Agronomy, eds G. A. Sadras and D. F. Calderini (Burlington, MA: Elsevier), 277–308. doi: 10.1016/B978-0-12-374431-9.00012-8
Slafer, G. A., and Rawson, H. M. (1995). Intrinsic earliness and basic development rate assessed for their response to temperature in wheat. Euphytica 83, 175–183. doi: 10.1007/BF01678127
Snape, J. W., Butterworth, K., Whitechurch, E., and Worland, A. J. (2001). “Waiting for fine times: genetics of flowering time in wheat,” in Wheat in a Global Environment, eds Z. Bedö and L. Láng (Dordrecht: Springer), 67–74. doi: 10.1007/978-94-017-3674-9_7
Snape, J. W., Law, C. N., Parker, B. B., and Worland, A. J. (1985). Genetical analysis of chromosome 5A of wheat and its influence on important agronomic characters. Theor. Appl. Genet. 71, 518–526. doi: 10.1007/BF00251199
Snape, J. W., Quarrie, S. A., and Laurie, D. A. (1996). Comparative mapping and its use for the genetic analysis of agronomic characters in wheat. Euphytica 89, 27–31. doi: 10.1007/BF00015715
Stapper, M., and Fischer, R. A. (1990). Genotype, sowing date and plant spacing influence on high-yielding irrigated wheat in Southern New South Wales. III. Potential yields and optimum flowering dates. Austr. J. Agric. Res. 41, 1043–1056. doi: 10.1071/AR9901043
Su, J., Hu, C., Yan, X., Jin, Y., Chen, Z., Guan, Q., et al. (2015). Expression of barley SUSIBA2 transcription factor yields high-starch low-methane rice. Nature 523, 602–606. doi: 10.1038/nature14673
Terrile, I. I., Miralles, D. J., and Gonzàlez, F. G. (2017). Fruiting efficiency in wheat (Triticum aestivum L): trait response to different growing conditions and its relation to spike dry weight at anthesis and grain weight at harvest. Field Crops Res. 201, 86–96. doi: 10.1016/j.fcr.2016.09.026
Voorrips, R. E. (2002). MapChart: software for the graphical presentation of linkage maps and QTLs. J. Hered. 93, 77–78. doi: 10.1093/jhered/93.1.77
Worland, A. J. (1996). The influence of flowering time genes on environmental adaptability in European wheats. Euphytica 89, 49–57. doi: 10.1007/BF00015718
Worland, A. J., Appendino, M. L., and Sayers, E. J. (1994). The distribution in European winter wheats, of genes that influence ecoclimatic adaptability whilst determining photoperiodic insensitivity and plant height. Euphytica 80, 219–228. doi: 10.1007/BF00039653
Xie, Q., Mayes, S., and Sparkes, D. L. (2016). Optimizing tiller production and survival for grain yield improvement in a bread wheat × spelt mapping population. Ann. Bot. 117, 51–66. doi: 10.1093/aob/mcv147
Yang, L., Shao, H., Wu, Q. X., Yu, J., Rang, C. F., Li, L. Q., et al. (2013). QTLs mapping and epistasis analysis for the number of tillers and spike number per plant in wheat. J. Tritic. Crops 33, 875–882.
Zadoks, J. C., Chang, T. T., and Konzak, C. F. (1974). Decimal code for the growth stage of cereals. Weed Res. 14, 415–421. doi: 10.1111/j.1365-3180.1974.tb01084.x
Zhang, K., Wang, J., Zhang, L., Rong, C., Zhao, F., Peng, T., et al. (2013). Association analysis of genomic loci important for grain weight control in elite common wheat varieties cultivated with variable water and fertiliser supply. PLoS ONE 8:e57853. doi: 10.1371/journal.pone.0057853
Zhang, L. Y., Liu, D. C., Guo, X. L., Yang, W. L., Sun, J. Z., Wang, D. W., et al. (2010). Genomic distribution of quantitative trait loci for yield and yield-related traits in common wheat. J. Integr. Plant Biol. 52, 996–1007. doi: 10.1111/j.1744-7909.2010.00967.x
Zhao, J., Wang, T., Wang, M., Liu, Y., Yuan, S., Gao, Y., et al. (2014). DWARF3 participates in an SCF complex and associates with DWARF14 to suppress rice shoot branching. Plant Cell Physiol. 55, 1096–1109. doi: 10.1093/pcp/pcu045
Keywords: phenology, kernel number, tillering, spike fertility, durum wheat, QTL, candidate genes
Citation: Giunta F, De Vita P, Mastrangelo AM, Sanna G and Motzo R (2018) Environmental and Genetic Variation for Yield-Related Traits of Durum Wheat as Affected by Development. Front. Plant Sci. 9:8. doi: 10.3389/fpls.2018.00008
Received: 05 September 2017; Accepted: 03 January 2018;
Published: 18 January 2018.
Edited by:
Edmundo Acevedo, Universidad de Chile, ChileReviewed by:
Thorsten Schnurbusch, Leibniz-Institut für Pflanzengenetik und Kulturpflanzenforschung (IPK), GermanyMarco Maccaferri, Department of Agricultural Sciences, University of Bologna, Italy
Copyright © 2018 Giunta, De Vita, Mastrangelo, Sanna and Motzo. This is an open-access article distributed under the terms of the Creative Commons Attribution License (CC BY). The use, distribution or reproduction in other forums is permitted, provided the original author(s) or licensor are credited and that the original publication in this journal is cited, in accordance with accepted academic practice. No use, distribution or reproduction is permitted which does not comply with these terms.
*Correspondence: Rosella Motzo, motzo@uniss.it