 Hong Li1†
 Xiaonan Li
 Yuanhu Xuan
 Yangdou Wei
 Zhongyun Piao
- 1College of Horticulture, Shenyang Agricultural University, Shenyang, China
- 2College of Plant Protection, Shenyang Agricultural University, Shenyang, China
- 3Department of Biology, University of Saskatchewan, Saskatoon, SK, Canada
Plasmodiophora brassicae is a soil borne pathogen and the causal agent of clubroot, a devastating disease of Brassica crops. The pathogen lives inside roots, and hijacks nutrients from the host plants. It is suggested that clubroot galls created an additional nutrient sink in infected roots. However, the molecular mechanism underlying P. brassicae infection and sugar transport is unclear. Here, we analyzed sugar contents in leaves and roots before and after P. brassicae infection using a pair of Chinese cabbage near-isogenic lines (NILs), carrying either a clubroot resistant (CR) or susceptible (CS) allele at the CRb locus. P. brassicae infection caused significant increase of glucose and fructose contents in the root of CS-NIL compared to CR-NIL, suggesting that sugar translocation and P. brassicae growth are closely related. Among 32 B. rapa SWEET homologs, several BrSWEETs belonging to Clade I and III were significantly up-regulated, especially in CS-NIL upon P. brassicae infection. Moreover, Arabidopsis sweet11 mutant exhibited slower gall formation compared to the wild-type plants. Our studies suggest that P. brassicae infection probably triggers active sugar translocation between the sugar producing tissues and the clubbed tissues, and the SWEET family genes are involved in this process.
Introduction
Plasmodiophora brassicae causes clubroot disease, a most challenging disease of the Brassicaceae family worldwide (Dixon, 2009). P. brassicae belongs to an obligate biotrophic protist in the Plasmodiophorids within the Rhizaria. The life cycle of P. brassicae is divided into three stages: the survival of resting spores in soil, the root hair infection (primary infection), and the cortex infection (secondary infection) (Schwelm et al., 2015; Schuller and Ludwig-Müller, 2016). After infection of the plant roots, P. brassicae colonization leads to swelling roots and gall formation, eventually inhibiting roots to uptake nutrients and water from the soil. As one of the most economically serious diseases in Brassica crops, clubroot resulted in significant agricultural losses. Moreover, P. brassicae can survive in the form of resting spores at least 6–8 years in the soil (Karling, 1968), making it difficult to control by chemicals. Therefore, development of clubroot-resistant (CR) varieties is one of the most economic and effective ways to control clubroot disease. In our previous study, a dominant clubroot resistant gene CRb, mapped to the region of 23.667 Mb to 23.752 Mb on B. rapa A03 chromosome, has been identified (Piao et al., 2004; Zhang et al., 2014) and successfully introgressed into a Chinese cabbage inbred line (Zhang et al., 2012).
Sugars are the main carbon source for the living organisms including pathogens and their host plants. In plants, sugars are synthesized in the photosynthetic organs and allocated into the sink organs via long-distance transport. Sugars produced in the living plants not only play key roles for plant growth and development, but also are transferred or secreted into the plant surface. Sugars secreted by plants could be used as carbon supply for pathogen growth (Patrick, 1989; Chen et al., 2010). Especially, biotrophic microbes obtain nutrients from host cells by extracting sugars (Manck-Götzenberger and Requena, 2016; Roman and Rathjen, 2017). In terms of P. brassicae, it has been reported that 2% sucrose solution could promote germination of resting spores (Guo, 2001). In addition, accumulation of soluble sugars (hexoses and sucrose) was found in the galls of P. brassicae-infected Arabidopsis thaliana (Evans and Scholes, 1995; Brodmann et al., 2002) and Brassica plants (Williams et al., 1968; Keen and Williams, 1969), indicating that the galls might act as a newly established carbon sink during clubroot development. Sugar transporters, including well known gene families such as MSTs (monosaccharide transporters) (Toyofuku et al., 2000), SUTs (sucrose transporters) (Reinders et al., 2008, 2011), and SWEETs (sugar will be eventually exported transporters) (Chen et al., 2012) are responsible for translocate monosaccharides or disaccharides. Recently, transcriptome studies revealed that several genes involved in sugar transport and metabolism strongly up-regulated during gall formation in clubroot-infected Arabidopsis (Siemens et al., 2006; Malinowski et al., 2012). A recent transcriptome profiling performed on both shoot and root tissues of A. thaliana challenged by P. brassicae also pointed that genes involved in sucrose and starch biosynthesis were differently expressed in shoot and root (Irani et al., 2018). These transcriptomic and metabolic experiments provided insights that sugar accumulation is important for gall formation, probably depending on some sugar transport genes. Moreover, during the process of plant-pathogen co-evolution, the pathogens have evolved a mechanism to compete for sugars with infected host cells to sustain their life cycle (Doidy et al., 2012; Lemoine et al., 2013). Competition for sugars at the plant–pathogen interface is likely controlled by the sugar transporters mentioned above (Toyofuku et al., 2000; Doidy et al., 2012), thus regulation of those transporters would give a new insight into disease control.
SWEETs are a class of proteins responsible for transporting sugar across cell membranes, involving in diverse physiological processes of various plant species, such as in reproductive development (Ge et al., 2000; Yang et al., 2006; Guan et al., 2008), leaf senescence (Quirino et al., 1999; Seo et al., 2011), and plant responses to abiotic and biotic stresses in Arabidopsis and rice (Chu et al., 2006; Yang et al., 2006; Antony et al., 2010; Chen et al., 2010; Liu et al., 2011). SWEETs genes are evolutionally conserved in both prokaryotes and eukaryotes (Gamas et al., 1996; Artero et al., 1998; Chong et al., 2014; Jian et al., 2016), but plant species possess more SWEETs than that in animals and prokaryotes (Yuan and Wang, 2013). Phylogenetic analysis of plant SWEET genes revealed that they can be grouped into 4 clades as firstly defined in A. thaliana (Chen et al., 2010). It is appeared that SWEETs grouped into clades I and II have priority to transport hexoses, while clade III and IV proteins are preferentially transport sucrose and fructose, respectively (Chen et al., 2010, 2012; Lin et al., 2014). Characterization of SWEET proteins indicated that they contain 7 transmembrane (TM) helices carrying two MtN3/saliva domains in plants and animals, while only one MtN3/saliva domain with 3 TM helices exists in SWEET proteins of prokaryotes (Wang et al., 2014). SWEETs localized on the plasma membrane to import or export sugars (Chen et al., 2012). However, SWEET is a distinct transporter family which mediates energy-independent influx and efflux of sugars compared to MSTs and SUTs, both of which are energy-dependent (Reinders et al., 2008, 2011; Yuan and Wang, 2013). Some SWEETs harboring two MtN3/saliva domains functioned as low-affinity glucose and sucrose transporters, such as glucose transporters AtSWEET4, AtSWEET5, AtSWEET7, and AtSWEET13, and sucrose transporters AtSWEET11 and AtSWEET12 in Arabidopsis as well as OsSWEET11 and OsSWEET14 in rice (Chen et al., 2010, 2012).
SWEETs are also crucial to regulate carbon transport in parasitism and pathogens interaction. Some members of the SWEET genes have been demonstrated as the targets of extracellular pathogens. During the host–microbe interaction, the pathogen infection regulates expression patterns of the SWEET genes to facilitate the pathogen obtaining the sugar. The first identified MtN3 from Medicago truncatula was found to be involved in the interaction between the host and Rhizobium meliloti (Gamas et al., 1996). Indeed, induction of SWEET genes upon pathogen infection has also been reported in Arabidopsis, rice, and other plant species. In Arabidopsis, at least 9 SWEET members (AtSWEET2, -4, -7, -8, -10, -11, -12, -15, and -17) were differentially regulated following infection of different types of pathogens (Ferrari et al., 1994; Chen et al., 2010). In rice, recessive alleles of Xa13/OsSWEET11, Xa25/OsSWEET13, and OsSWEET14, respectively, were identified to be associated with resistance to the rice bacterial blight caused by Xanthomonas oryzae pv. oryzae (Xoo) (Chu et al., 2006; Yang et al., 2006; Antony et al., 2010; Chen et al., 2010; Liu et al., 2011). The dominant alleles of these 3 genes functioned as the low-affinity glucose and sucrose transporters (Chen et al., 2010, 2012), were specifically and transcriptionally activated by the transcription activator-like (TAL) effector after Xoo infection (Antony et al., 2010; Yuan et al., 2011). Strong up-regulation of VvSWEET4 was found in grapevine upon infection with Botrytis cinerea (Chong et al., 2014). In the Arabidopsis–P. brassicae interaction, P. brassicae infection strongly induced the expression of AtSWEET15 during the gall formation (Siemens et al., 2006).
Chinese cabbage belonging to Brassica rapa species, is one of the most important leaf vegetables widely cultivated in China, Korea, and Japan, while it is seriously affected by clubroot disease. To better understand the accumulation and transportation of sugars, as well as the role of SWEETs during P. brassicae-induced gall formation in Chinese cabbage, we examined the sugar contents in roots and leaves of the Chinese cabbage clubroot resistant (CR) and susceptible (CS) near isogenic lines (NILs) after infection of P. brassicae. In addition, the response of B. rapa SWEET (hereafter BrSWEET) sugar transporters to P. brassicae infection as well as clubroot disease development in Arabidopsis sweet11 mutant was examined.
Materials and Methods
Identification of SWEET Family Genes in B. rapa
To identify the SWEET genes in B. rapa genome, amino acid sequences of 17 A. thaliana SWEET (AtSWEET) genes were used as the bait to search against the B. rapa database (BRAD1) by performing a BLASTP analysis. The physicochemical parameters, including molecular weight (kDa) and isoelectric points (pI), were calculated according to the pI/Mw tool at online ExPASy2 database. Proteins containing MtN3/saliva domain, the typical transmembrane domains of eukaryotic SWEET, were defined to belong to the B. rapa SWEET gene family (BrSWEETs). BrSWEETs paralogous genes to the AtSWEET was named by adding a suffix (a, b, c…) according to E values from high to low, representing sequence similarity level to the corresponding AtSWEET.
Multiple Sequence Alignment and Phylogenetic Analysis of BrSWEET Family Genes
To better understand the evolutionary relationships among A. thaliana, B. napus, and B. rapa SWEETs gene family, multiple sequence alignment of all BrSWEET sequences was conducted using the ClustalX program. An unrooted phylogenetic analysis was performed using the neighbor-joining (NJ) method of the MEGA5 program using the full-length SWEET amino acid sequences of A. thaliana, B. napus, and B. rapa. A bootstrap test was performed with 1000 replicates.
Chromosomal Location and Gene Structure of BrSWEETs
All identified SWEET genes were mapped to B. rapa chromosomes using Mapchart (Version 2.1) software based on their physical position available at the B. rapa genome database1. Gene Structure Display Server (GSDS)3 was used to draw the gene structure diagram of the BrSWEET family genes according to the genomic sequences and the corresponding coding sequence of each BrSWEET gene. To further confirm the coding sequence, all BrSWEETs were queried against on line EST database deposited in NCBI and sequences generated from our lab RNA-seq data of B. rapa (Chen et al., 2016) with BLAST.
Analysis of the Protein Structure and the Conserved Motifs of BrSWEET Family
TMHMM Server 2.04 was utilized to forecast the protein structure of BrSWEET family. We performed the MEME (Multiple Expectation maximization for Motif Elicitation) analysis on the predicted BrSWEET with the conditions: (1) optimum motif width was set to 6 and 50; (2) maximum number of motifs was designed to 10 motifs; (3) the iterative cycles were set by default.
Plant Growth and P. brassicae Infection
A pair of Chinese cabbage near-isogenic lines (NIL), carrying either the CR or clubroot-susceptible (CS) allele at the CRb locus, were used in our study. Briefly, CR-NIL was bred by introgressing CRb gene from clubroot-resistant line ‘CR Shinki DH’ to the susceptible inbred line “BJN3-2” based on marker-assisted selection (Zhang et al., 2012). All the plants were maintained in the culture room under a 16 h photoperiod at 25°C. The single-spore isolate (Pb4) of P. brassicae was propagated in CS Chinese cabbage. Resting spores were isolated from homogenized clubbed roots and diluted to a density of 107/mL with sterile distilled water until inoculation. Thirteen-day-old seedlings of CR and CS NILs were inoculated by injecting 1 mL of resting spore suspension into the soil around each plant (Zhang et al., 2012). Plants supplemented with the same volume of water were used as the control. Leaves, roots and hypocotyls from 10 individuals were collected at 0, 0.5, 1, 1.5, 2, 3, 4, 6, and 9 days post inoculation (dpi) for gene expression analysis, respectively. Also, sugar contents of the leaves and roots were determined. To verify the successful infection, a pair of NILs was maintained at the culture room for 30 days. Three biological replicates were included for each treatment, and each replicate contained 10 plants.
For analyzing clubroot formation in Arabidopsis, T-DNA insertion mutant sweet11 (SALK_073269.20.35.X) from the Salk collection and wild type Col-0 were grown for 3 weeks in a chamber with 12 h light/12 h dark cycle. The phenotype of Atsweet11, including plant height, leaf size, leaf color, and flowering showed no difference to wild type Col-0. P. brassicae was infected and the gall formation was checked after 3, 4, and 5 weeks. Three biological replicates were conducted for each treatment, and each replication contained 10 plants. The disease rate (DR) and the disease index (DI) was evaluated after inoculation. Disease symptoms were scored as follows: 0, no symptoms; 1, a few small clubs on the lateral roots; 2, larger clubs on the lateral roots; 3, swelling of the main roots; 4, severe galling of tissues of both lateral and main roots. The DI was calculated according to the formula DI = [nw] × 100/4T, where n is the number of plants in each class, w is disease symptoms (0–4), and T is the total number of plants tested (Chaube and Singh, 1991; Siemens et al., 2010). Data on the phenotype of disease index of the tested lines were analyzed for statistical significance using analysis of variance (ANOVA) conducted using SPSS 17.0.
Total DNA, RNA Extraction and the Quantitative Real-Time PCR Analysis
For pathogen DNA quantification, total DNA was extracted from 1 g roots of the Arabidopsis sweet11 mutants and wild type Col-0 by DNAsecure plant kit (Tiangen, Beijing, China), according to the manufacturer’s instructions. DNA quantity was estimated with Nanodrop instrument and final concentration was adjusted to 10 ng/μl for each PCR reaction. The Arabidopsis F-box protein gene mentioned by Lemarie et al. (2015) was used for normalization and the P. brassicae target gene was described by Faggian et al. (1999). Quantitative real-time PCR reaction was performed following by Lemarie et al. (2015). The relative DNA quantities were expressed as the ratio between the DNA quantities of P. brassicae and the plant DNA value. Three replications were performed for each reaction. Significant differences between the mean values among Arabidopsis wild type and mutants were determined according to ANOVA analysis at P < 0.01 using SPSS 17.0.
For SWEET gene expression analysis, total RNA was extracted from the roots, hypocotyls and leaves of CR and CS NILs by using the RNA prep Pure Plant Total RNA Extraction Kit (Tiangen, Beijing, China) according to the manufacturer’s instructions. cDNA was synthesized from 1 μg RNA after removement of genomic DNA. The quantitative real-time PCR (qRT-PCR) analysis was performed as described by Jain et al. (2006). Briefly, the cDNA samples were used as template and mixed with 200 nmol of each primer and SYBR Green PCR Real Master Mix (Tiangen, Beijing, China) for real-time PCR analysis using ABI 7500 Real Time PCR System and Software 7500 ver. 2.0.3 (Applied Biosystems, United States) according to the manufacturer’s instructions. The thermal cycling was as following: 95°C for 3 min; 40 cycles of 95°C for 30 s, 57°C for 30 s, and 68°C for 1 min. The fluorescence signal was collected during the elongation at 68°C of every cycle. The gene specific primer sequences were listed in Supplementary Table S2. The relative expression levels for each of the SWEET genes were quantified with respect to the internal standard, Actin and 18sRNA. The experiments were repeated at least three times.
Soluble Sugars Extraction and Content Determination
Soluble sugars were extracted from the roots and leaves of CR and CS NILs. After grinding the tissues, 1 g of powder samples were dissolved in 80% ethanol and were kept at 80°C for 1 h. The extracts were concentrated and dissolved with 1 ml deionized and distilled H2O. Sucrose, glucose and fructose were assayed by high performance liquid chromatography (HPLC) using a NH2 Analytical HPLC column (Waters, Milford, MA, United States) with 75% acetonitrile and 25% double-distilled H2O as solvent, the velocity of 1.0 ml⋅min-1 and refractometer Parallax detection, according to manufacturer’s directions (Siemens et al., 2010). Soluble sugars were extracted from three biological replicates at each time point as aforementioned treatments. HPLC analysis were repeated three times for each treatment.
Results
The Variation of Soluble Sugar Contents After P. brassicae Infection
To test the effects of P. brassicae infection on sugar translocation, the contents of soluble sugars (glucose, fructose, and sucrose) in the leaves and roots of CS and CR NILs were examined before and after infection. The contents of sugars had no significant differences between CS and CR NILs without P. brassicae inoculation, but showed variance after infection (Figure 1).
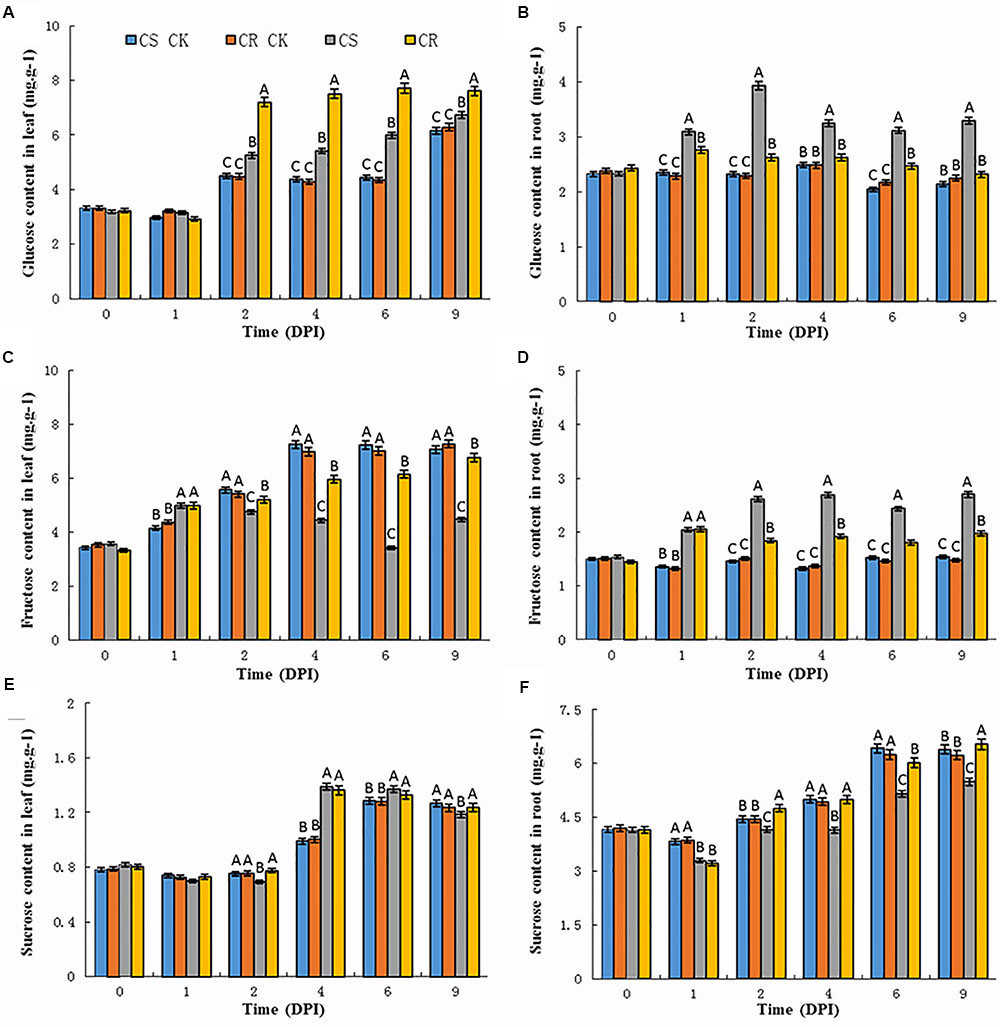
FIGURE 1. Sugar contents in the leaves and roots of Chinese cabbage after P. brassicae infection. (A) Glucose, (C) fructose, (E) sucrose contents in Chinese cabbage leaves after P. brassicae infection, respectively. (B) Glucose, (D) fructose, (F) sucrose contents in Chinese cabbage roots after P. brassicae infection, respectively. Significant differences at least P < 0.01 are indicated by different letters. CS CK and CR CK represent the corresponding sugar content in CS-NIL and CR-NIL without P. brassicae inoculation. CS and CR represent the sugar content in CS-NIL and CR-NIL after P. brassicae inoculation, respectively. Horizontal axis is time point from 0 to 9 days after inoculation (DPI).
Upon P. brassicae inoculation, an increase of glucose contents was observed in the leaves and roots of both two genotypes (Figures 1A,B). The contents of glucose were slightly increased in the leaves of CS and CR NILs at 1 dpi, while increased from 2 dpi. Compared to the CS-NIL, CR-NIL showed dramatically high content of glucose in the leaves from 2 to 9 dpi. However, the contents of glucose were dramatically increased from 12 to 49% in the roots of the CS-NIL from 1 to 9 dpi, and much less increase of the glucose contents occurred in the roots of the CR-NIL (Figures 1A,B).
In the leaves of un-inoculated plants, fructose contents gradually increased in the leaves of both CS and CR NILs at 1 dpi (Figure 1C). Generally, the fructose contents were lower in the leaves of both CS-NIL and CR-NIL than that of un-inoculated plants at each time point after P. brassicae inoculation. It was noticed that significant decreases of fructose contents were observed in the leaves of CS-NIL compared to CR-NIL from 2 dpi. However, significant increases were observed in the roots of both NILs during the infection time course, especially in CS-NIL. The fructose contents in roots of CS-NIL were higher about 35–42% than that in CR-NIL from 1 to 9 dpi (Figure 1D). It could be observed that patterns of fructose and glucose accumulations in the roots of both CS and CR-NILs are similar.
Sucrose contents showed no changes in leaf or root tissues between un-inoculated CS and CR NILs (Figures 1E,F). After P. brassicae infection, lower sucrose contents were detected at the early infection time points (2 dpi) in the leaves of the CS-NIL than that of the CR-NIL. Thereafter, significant increases of sucrose contents were observed in the leaves of both CS and CR NILs, but no significant differences between two NILs. In the root tissues, sucrose contents showed an increase tendency in inoculated and un-inoculated CR-NILs at the late infection time points (from 4 to 9 dpi). However, much less increases of sucrose contents were detected in the roots of the CS-NIL than that of the CR-NIL from 2 dpi.
In summary, glucose and fructose levels reduced in the leaves of CS-NIL, but increased in the roots after P. brassicae infection. Also, sucrose content of CS-NIL was lower than CR-NIL in roots. These results imply that P. brassicae infection may activate translocation of sugar from the leaves to roots.
Identification of SWEET Genes in B. rapa
To analyze the possible sugar transporter involved in long distance transport, we firstly identified SWEET genes in B. rapa genome. Based on the similarities with the 17 Arabidopsis AtSWEETs, totally 32 SWEETs were identified in B. rapa, and named BrSWEET1a to BrSWEET17b on the base of their identity to AtSWEETs (Supplementary Table S1). 28 BrSWEET genes are multicopy either duplication or triplication of corresponding AtSWEET, except for four single copy genes (BrSWEET8, -9, -10, and -13). In addition, the orthologous gene of AtSWEET6 was not found in the B. rapa genomes. Majority of BrSWEET genes were about 1500 base pairs (bp), and amino acids residues are from 178 to 316. Genes longer than 7.5 kb were also found in BrSWEET15b and BrSWEET17b. BrSWEETs contained 3–7 TM helices (Supplementary Figure S1) harboring one or two conservative MtN3/saliva domains (Supplementary Figure S2). The isoelectric points (pI) value of each BrSWEETs was higher than 7.50. Among them, pI of 19 BrSWEETs was higher than 9.0, and others were ranged between 7.59 and 8.97. Noticeably, no single SWEET gene was observed to be closely associated with the CRb locus (Zhang et al., 2014) on the B. rapa genome.
Phylogenetic Analyses of the BrSWEET Genes
Further, to better understand the evolutional relationships of BrSWEETs, amino acid sequences of the 117 SWEET proteins (17, 32, 68 from A. thaliana, B. rapa, and B. napus, respectively) were aligned and an unrooted phylogenetic tree was constructed (Figure 2). All 32 BrSWEET family members contain two conserved regions, and they might have evolved to a closer relationship during evolution (Supplementary Figure S2). Seven sister pairs of genes were identified in the phylogenetic trees with very strong bootstrap support (100%) (Figure 2). Most of the gene pairs had short branch lengths, suggesting their recent divergence (Figure 2).
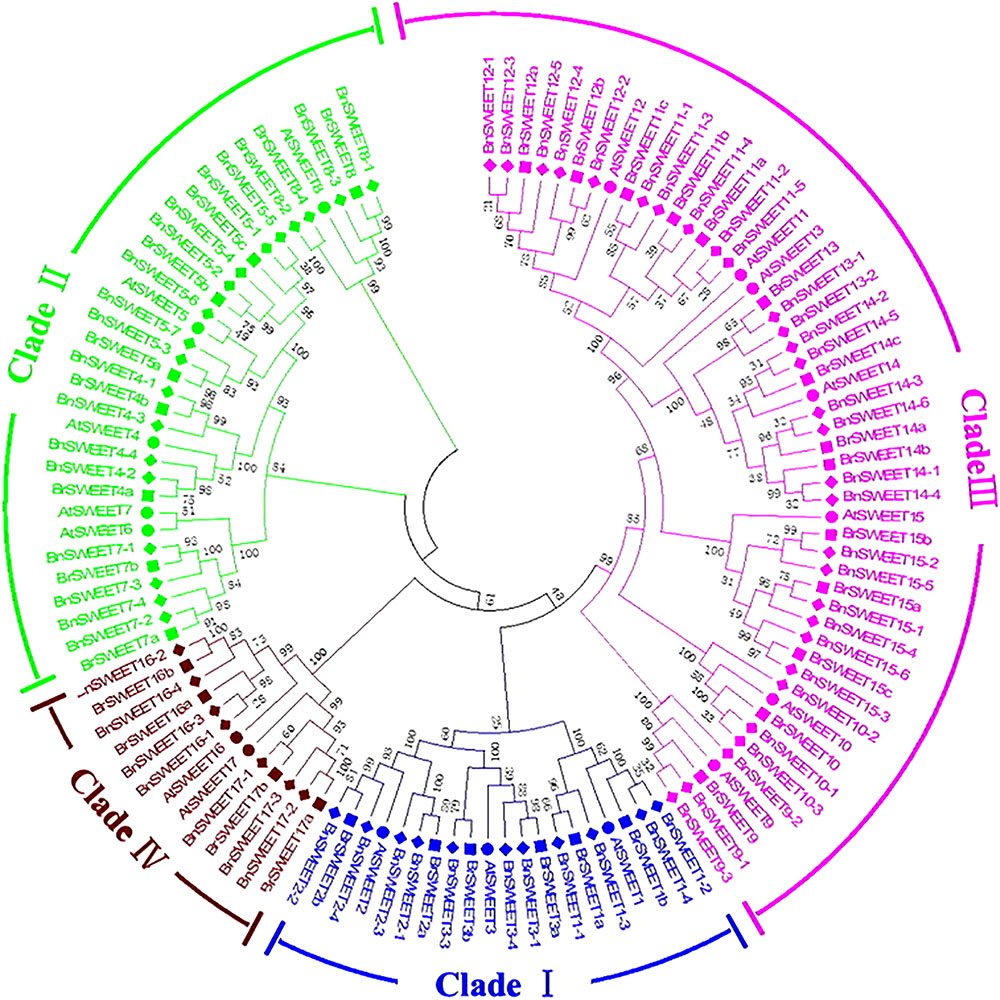
FIGURE 2. Phylogenetic tree of SWEETs from B. rapa, B. napus, and A. thaliana. The phylogenetic tree was built using the neighbor-joining (NJ) method. The unrooted tree was generated using ClustalW in MEGA5 via SWEETs amino acid sequences from A. thaliana (AtSWEET), B. rapa (BrSWEET), and B. napus (BnSWEET). The roman numerals (I – IV) labeled with various colors indicate different clades. The numbers at the nodes represent bootstrap percentage values based on 1000 replications. Genes from each species are marked with different bullet point colors.
All of 32 BrSWEET genes, together with other 85 members were grouped into 4 major clades, namely clade I, II, III, and IV (Figure 2). Gene families in clade III had relative higher molecular weight than others (Supplementary Table S1). All BrSWEET and BnSWEET were clustered closely with their AtSWEET orthologs.
Chromosomal Position of the BrSWEET Genes
According to the gene loci information, all BrSWEET genes were assigned to the 9 chromosomes of B. rapa with the exception for BrSWEET13 (Figure 3 and Supplementary Table S1). Duplication event of AtSWEET genes was found in B. rapa genomes. 8 AtSWEET genes (AtSWEET1, -2, -3, -4, -7, -12, -16, and -17) were duplicated and 4 genes (AtSWEET5, -11, -14, and -15) are triplicated in B. rapa. Most of BrSWEET paralogous genes were dispersed to different chromosomes. However, tandem array of 2 BrSWEET5 and 2 BrSWEET11 was found on the chromosome A02 and A06, respectively. Other 3 BrSWEET genes (BrSWEET14, -16 and -17) were found to be involved in the duplication of chromosomal fragments.
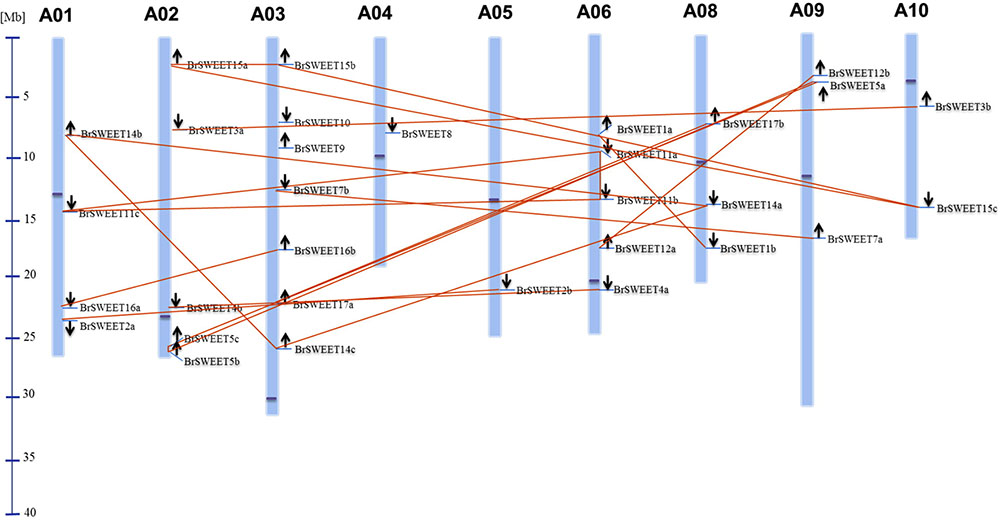
FIGURE 3. Distribution of BrSWEET genes on B. rapa chromosomes. Out of 32 Br SWEET genes identified, 31 genes were mapped to the 9 out of 10 chromosomes, and SWEET13 gene is unable to map to the chromosome. Light blue lines represent the gene position on the chromosome. Paralogous genes are connected with lines in orange color. Black arrows indicate the direction of genes. Blue line in the left panel represents the scale of chromosome. Dark blue dot on each chromosome represents the centromere position.
Gene Structure of BrSWEETs
Exon-intron organizations for each BrSWEET gene were analyzed by alignment of full-length cDNA sequences to the genomic DNA sequences of B. rapa. Characterization of the gene structure diversity revealed that most BrSWEET genes contained 6 exons (Figure 4). Five BrSWEET genes (BrSWEET3b, -7a, -7b, -14c, and -15c) appeared to have exon-intron loss variations, probably due to the fact that loss/gain of one or two intron/exon were happened during the evolution of B. rapa. Most genes had similar exon lengths, while the length of intron varied obviously for each gene. Among which, BrSWEET11c, -15b, -17a, and -17b, had extremely long intron.
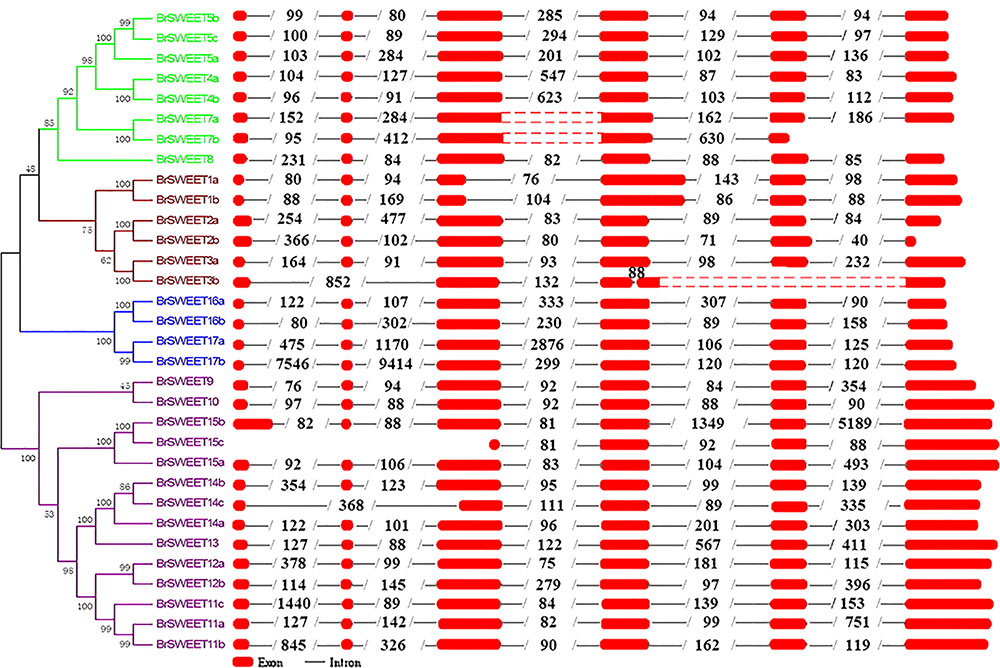
FIGURE 4. Genomic structures of 32 SWEET genes identified in B. rapa. Exon–intron structure of the BrSWEET genes were graphically shown. Exons are represented by red boxes, while introns are represented by gray lines. The boxes with red dot means no sequences in this region, and two red boxes are both sides constitute one exon. The numbers within intron indicate the length of introns.
Conserved Domains and Motifs of BrSWEET Proteins
The common domains for cytosolic localization, apoplastic localization, and transmembrane anchorage were found in all BrSWEET genes (Supplementary Figure S1), indicating that BrSWEET genes are composited with membrane spanning, intracellular and extracellular regions, and responsible for sugar transport. Most of BrSWEETs had 2 conservative MtN3/saliva domains with 7 TM helices (Supplementary Figures S1, S2), the typical domain of SWEET in eukaryote. However, genes (BrSWEET3b, 7b, and 15c) with 3 or 4 TM helices were found to have only one complete MtN3/saliva domain.
To investigate the structural diversity further, all BrSWEET genes were submitted to MEME program for the conserved motifs structure analysis. As the results, 10 conserved motifs were identified, among which 6 motifs (motifs 1–6) were annotated as MtN3/saliva domains of the SWEET genes (Supplementary Figure S3). All genes contained motif 1, 2, 5, and 6 in the C terminal of BrSWEETs However, the order of motif arranged in the N terminal was different. Motif 1-4/5-6-7 was found in clade I, II, and IV, but motif 7-2-3-5-6 in clade III. Additionally, loss of some motifs was observed in a few genes, including motif 1-2-5 in the C terminal of BrSWEET3b and BrSWEET7b, and motif 3-5-6 in the N terminal of BrSWEET15c. Gene families in clade I and II contained a specific motif 4 except for 3 genes in clade II. Motifs 8 and 10 were specific to clade III. The variation of the structural motifs among BrSWEET family suggested functional diversity of the SWEET genes.
Two conservative structures of MtN3/saliva domain with TM1 (motif1/2/3), TM2 (motif4/5) and TM3 (motif6), and TM5 (motif1), TM6 (motif2/5) and TM7 (motif6), respectively, were present in all genes except for BrSWEET3b, BrSWEET77b, and BrSWEET15c. These 2 conservative structure domains were consisted of about 85 amino acids, and were located in the similar position (Supplementary Table S1 and Supplementary Figure S3). TM4 is structured with motif 7 or motif 8, and it plays the role of contact between two MtN3/saliva domains.
Tissue Specific Expression of BrSWEET Genes in B. rapa
To investigate expression patterns of BrSWEET genes in B. rapa, semi-quantitative RT-PCR analysis was carried out in leaf, hypocotyl and root tissues of uninfected plants of CS-NIL. The semi qRT-PCR data revealed that the transcripts were detected for the majority of BrSWEET genes among all tissues (Figure 5). Half of the genes were expressed in all tissues. Transcript of four genes, including three duplicated genes (BrSWEET3b, -5a and -5b) and one single copy genes (BrSWEET8) were undetectable in any given tissues tested. High transcript abundance of six genes (BrSWEET7b, -10, -14a, -14b, -15a, and -15c) were expressed in the roots and hypocotyls, and two genes (BrSWEET3a and BrSWEET7a) were predominantly expressed in the roots and leaves. Several genes were expressed in only one kind of tissue, including BrSWEET4b in leaves, BrSWEET5c and BrSWEET9 in hypocotyls, and BrSWEET16b in roots. The expression profiling of BrSWEET genes suggests their possible involvements in broad biological functions during vegetative growth and development of B. rapa.
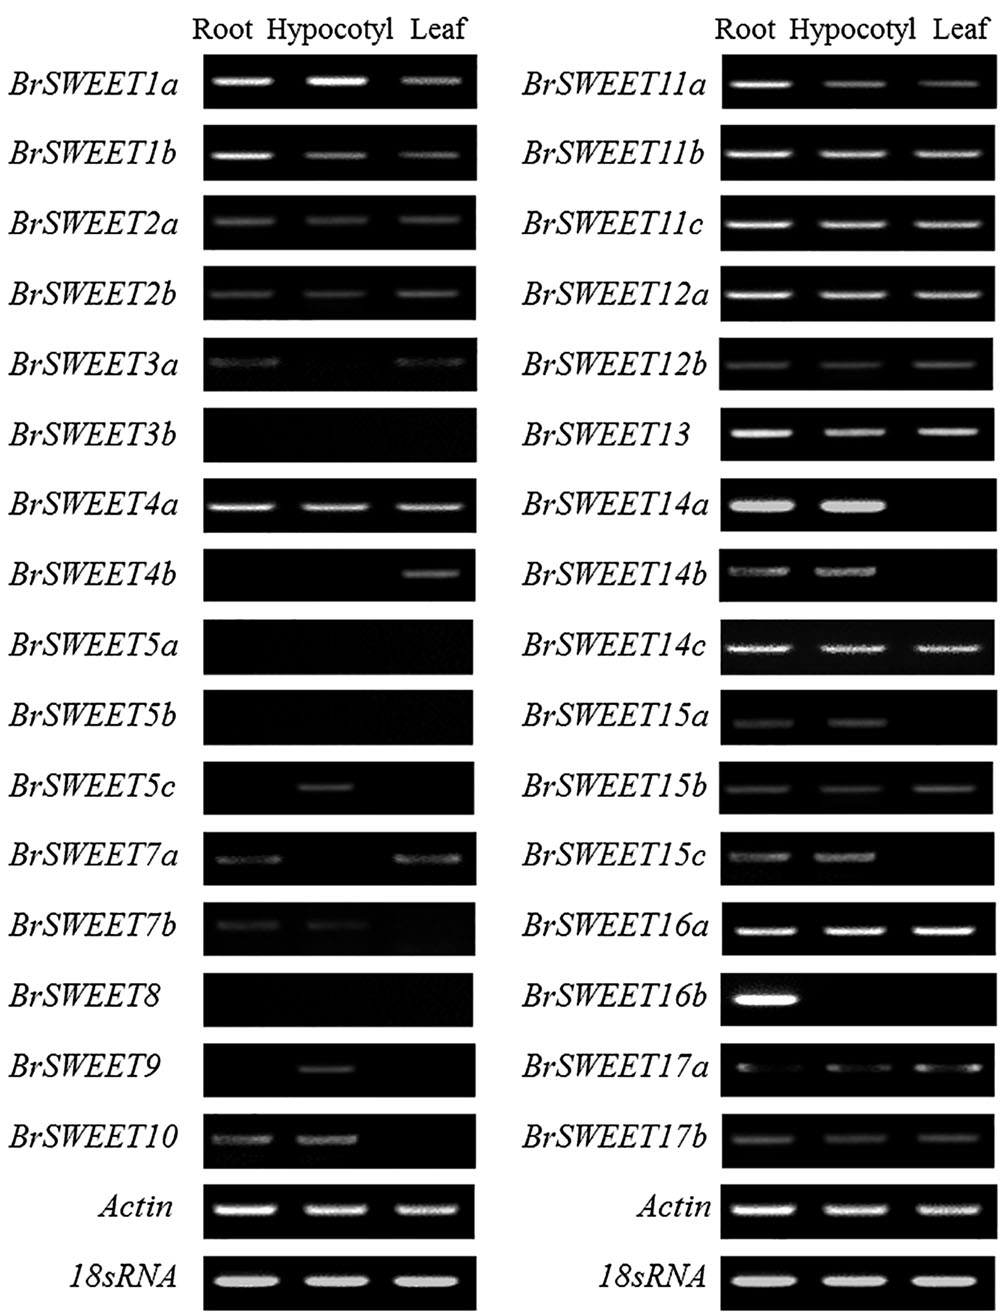
FIGURE 5. Expression patterns of the SWEET genes in different tissues of Chinese cabbage. Tissue specific expressions of BrSWEET genes in B. rapa (CS–NIL) were analyzed by semi-quantitative reverse transcription polymerase chain reaction (RT-PCR). Actin and 18srRNA genes were used as the internal control.
Expression Profiling of BrSWEET Genes in Response to P. brassicae Infection
To study the expressions of BrSWEET gene responsive to the P. brassicae infection, the expression patterns were determined among 3 different tissues (leaf, hypocotyl, and root) at different time points post P. brassicae inoculation by qRT-PCR. The heatmap results revealed that the expression patterns among BrSWEET genes were variable depending on the tissues and treatments (Figures 6, 7 and Supplementary Figure S4).
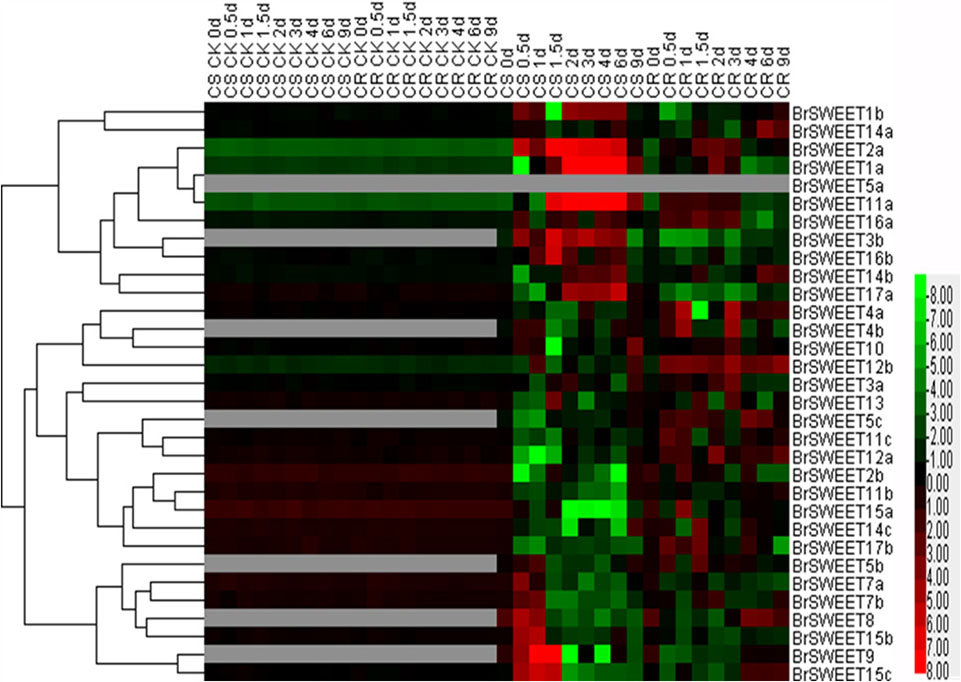
FIGURE 6. Plasmodiophora brassicae-dependent SWEET gene expressions in the root of Chinese cabbage. Hierarchical clustering and heatmap representation show time course responses of SWEET gene expressions in the root of Chinese cabbage after P. brassicae infection. The expression levels of genes are presented using fold-change values transformed to Log2 format. The data obtained by quantitative RT-PCR correspond to the levels of SWEETs in total RNA samples extracted from roots before and after infection of P. brassicae. The data indicate the relative expression levels normalized to that of the internal control Actin or 18srRNA. Gray color means no signal detected,while red and green colors correspond to up- and down-regulations of the SWEET gene expressions, respectively.
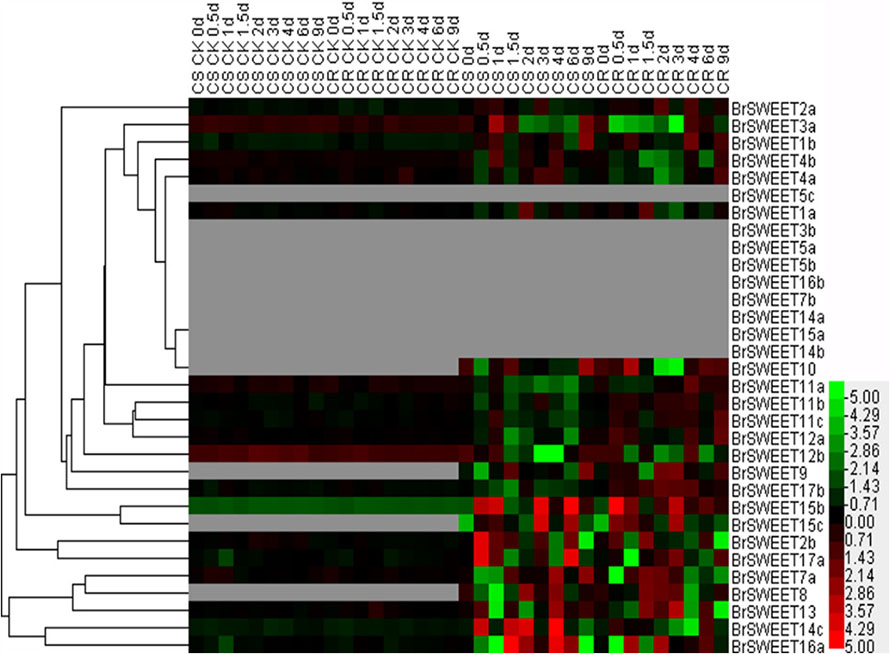
FIGURE 7. Expression patterns of the SWEET genes in the leaves of Chinese cabbage after infection of P. brassicae. Hierarchical clustering and heatmap representation show time course responses of SWEET gene expressions in the leaves of Chinese cabbage after P. brassicae infection. The expression levels of genes are presented using fold-change values transformed to Log2 format. The data obtained by quantitative RT-PCR correspond to the levels of SWEETs in total RNA samples extracted from leaves before and after infection of P. Brassicae. The data indicate the relative expression levels normalized to that of the internal control Actin or 18srRNA. Gray color means no signal detected, while red and green colors correspond to up- and down-regulation of the SWEET gene expressions, respectively.
BrSWEETs expressed differentially in the roots of CS and CR NILs after infection of P. brassicae (Figure 6). In comparison with un-inoculated plants, among all BrSWEET genes 14 (BrSWEET1a, -1b, -2a, -3b, -7a, -7b, -11a, -14a, -14b, -15b, -15c, -16a, -16b, and -17a) and 15 (BrSWEET1a, -2a, -3a, -4a, -10, -11a, -11c, -12a, -12b, -14a, -14b, -14c, -15c, -16a, and -17b) were up-regulated in CS-NIL and CR-NIL respectively. Transcripts of other genes were undetectable or down-regulated during P. brassicae infection. BrSWEET3b, -4b, -5b, -5c, -8, and -9 were not expressed in un-inoculated plants, but were induced expression in the P. brassicae-infected roots of both CS and CR NILs. Among them, BrSWEET3b, -8 and -9 were strongly induced in CS-NIL and BrSWEET4b, -5b, and -5c were significantly up-regulated in CR-NIL. By comparing between CS and CR NILs after P. brassicae infection, expression levels of 15 genes (BrSWEET1a, -1b, -2a, -3b, -7a, -7b, -8, -9, -11a, -14b, -15b, -15c, -16a, -16b, and -17a) were higher in the CS-NIL, but expression levels of other 16 genes were relatively higher in the CR-NIL. Most notably, the expression of BrSWEET1a, -2a, -9, -11a, and -15c was strongly up-regulated (over 1000-folds) in the roots of CS-NIL, and the expression of BrSWEET4a, -5c, -12a, and -12b was significantly up-regulated in the roots of CR-NIL (Figure 6). Clustering and heatmap analysis further revealed that among up-regulated BrSWEET genes in CS-NIL, several genes (BrSWEET7a, -7b -8, -9, -15b, and -15c) showed transiently induced expression at the early infection time points (0.5–1.5 dpi), whereas induced expressions of other genes (BrSWEET1a, -1b, -2a, -3b, -11a, -16b, and -17a) maintained up to the late infection time points at 6–9 dpi (Figure 6).
In the hypocotyls, expressions of BrSWEET3a, -3b, -4b, -5b, -7a, -8, and -16b were strikingly induced on both CR and CS-NILs by the infection of P. brassicae. Eleven genes (BrSWEET4a, -5b, -8, -10, -11a, -11b, -12b, -14c, -15a, -17a, and -17b) exhibited down-regulation, and other 20 genes were up-regulated in the hypocotyls of CS and CR NILs after infection of P. brassicae. Remarkably, 2 SWEET genes (BrSWEET9 and -16a) were found to be significantly up-regulated specifically in hypocotyls of CS-NIL after infection of P. brassicae (Supplementary Figure S4).
In leaf tissues, 9 BrSWEET genes (BrSWEET3b, -5a, -5b, -5c, -7b, -14a, -14b, -15a, and -16b) showed undetectable levels of expression on both CR and CS NILs before or after P. brassicae infection, while 4 genes (BrSWEET8, -9, -10, and -15c) showed enhanced expressions on both CR and CS NILs upon P. brassicae infection. Among these four P. brassicae-induced genes, BrSWEET9 had higher expression levels in CR-NILs than CS-NILs, whereas BrSWEET8, BrSWEET10 and BrSWEET15c showed similar expression patterns between CR and CS NILs. Most of the expressed genes either in CR or CS NILs showed differential regulations at different infection time points. Six SWEET genes (BrSWEET2b, -14c, -15b, -15c, -16a, and -17a) were found to be the most significantly up-regulated in the leaves of CS-NIL (Figure 7).
Pathogenicity Assays on Arabidopsis AtSWEET Mutant
AtSWEET11 in Arabidopsis mediates sucrose efflux in phloem parenchyma cells, promoting sucrose loading into the phloem by SUC2 for long distance transport (Chen et al., 2012). Our results revealed that P. brassicae-infected plants showed reduced sucrose contents in the leaves and roots, while increased glucose and fructose contents in the roots of B. rapa. Moreover, increased expression of BrSWEET11a gene occurred in root tissues upon P. brassicae infection. These results suggest that SWEET11 gene might be involved in host sugar transport into diseased clubroot tissues. To investigate possible involvement of SWEET11 during P. brassicae pathogenesis, Arabidopsis sweet11 mutant (sweet11) and its corresponding wild type Col-0 line were inoculated with P. brassicae. Disease development and gall formation were examined at 3, 4, and 5 weeks post inoculation (wpi) with P. brassicae resting spores. At 3 and 4 wpi, sweet11 mutants showed significantly lower disease incidence than that of the wild-type plants (Figure 8). After 5 wpi, all plants including mutant and the wild-type produced disease symptoms with various levels of disease severities. The disease index (DI) value of sweet11 mutants was significantly lower than that of the wild-type at all time points post inoculation (Figure 8C and Supplementary Table S3). Furthermore, we detected the relative pathogen DNA quantities of both wild type and sweet11 mutants after inoculation. The results showed that the P. brassicae content was continuously increased in both sweet11 mutants and Col-0 of Arabidopsis from 3 to 5 wpi (Figure 8D). Meanwhile, the DNA content of P. brassicae in the sweet11 mutants was significantly lower than wild type Col-0 at each time point (Figure 8D and Supplementary Table S3). All the results indicated that the progression of clubroot development in the sweet11 mutant was significantly delayed when compared to that of the wild-type plants. Thus, Arabidopsis SWEET11 gene is suggested to be responsive to the P. brassicae infection, and contributes to host susceptibility to the disease.
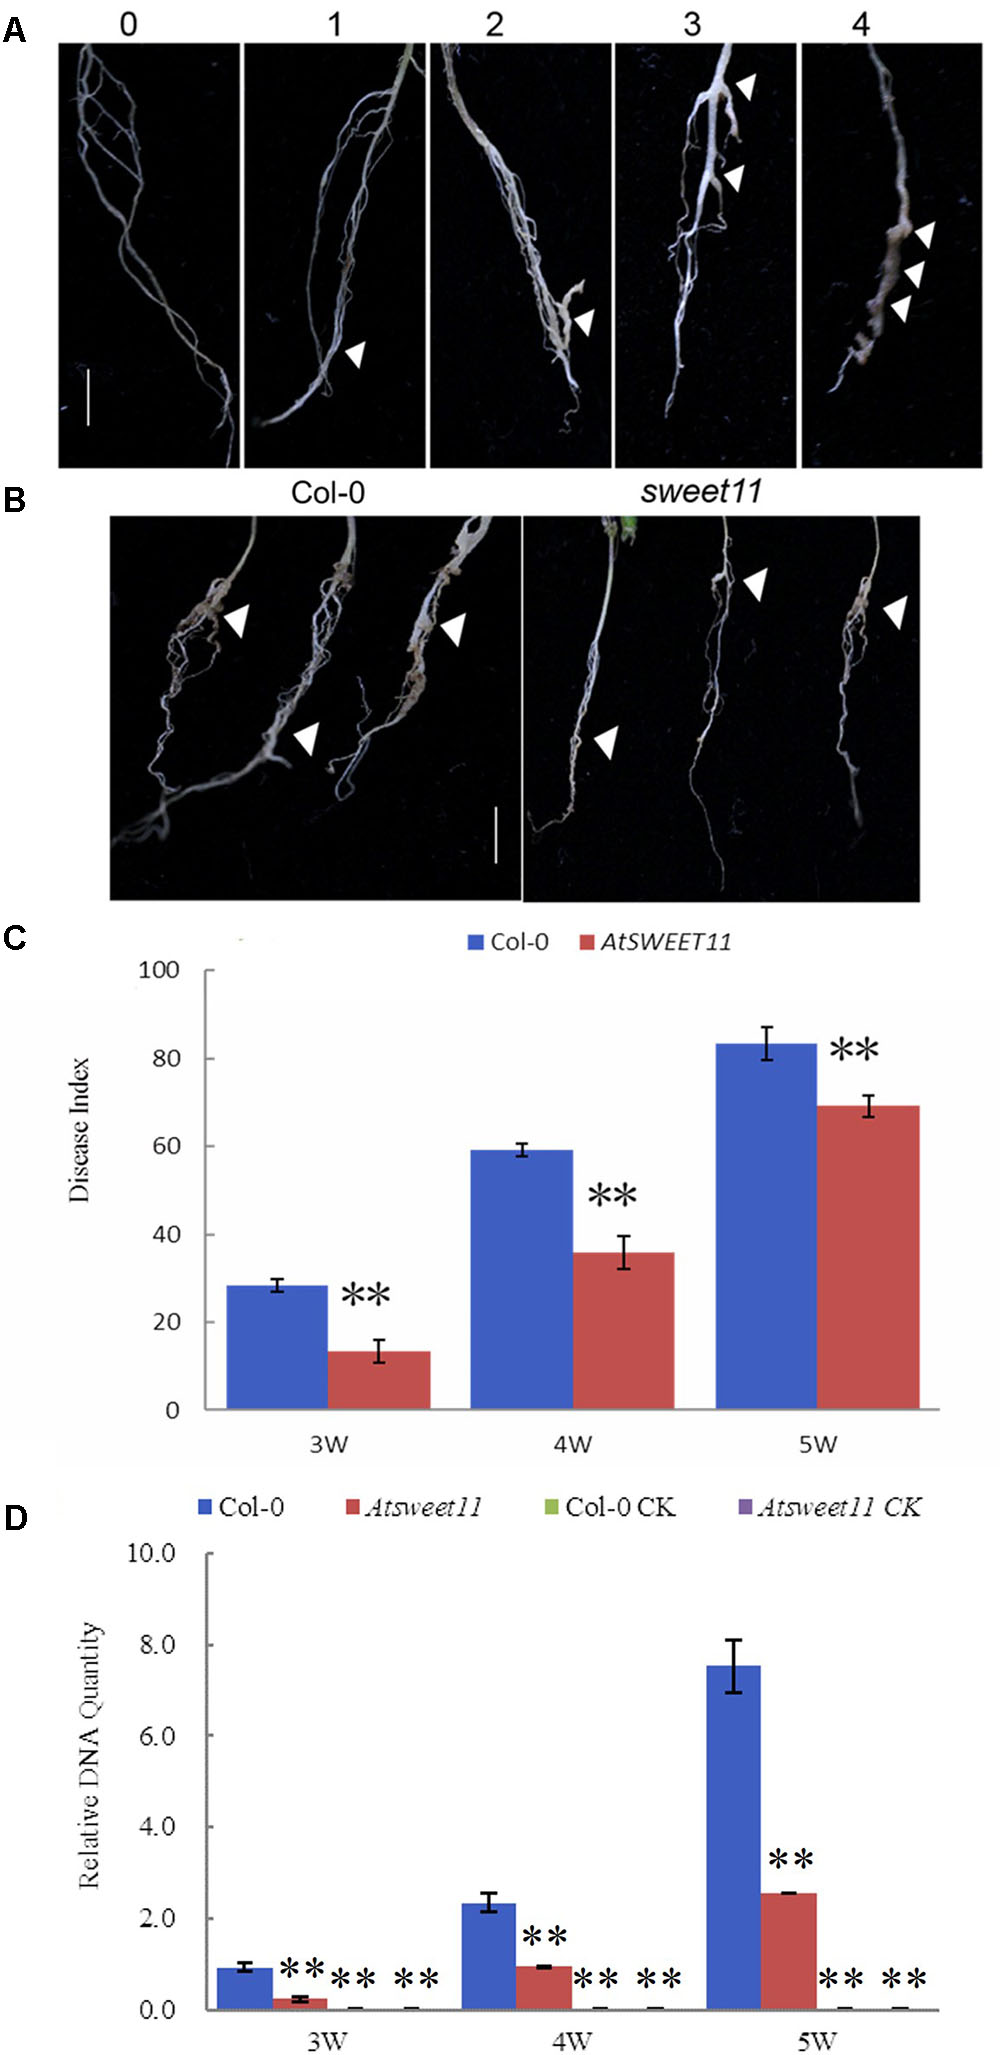
FIGURE 8. The disease index (DI) of clubroot development in A. thaliana after inoculation with P. brassicae. (A) Disease symptoms were scored as the follows: 0, no symptoms; 1, a few small clubs on the lateral roots; 2, larger clubs on the lateral roots; 3, swelling of the main roots; 4, severe galling of tissues of both lateral and main roots. (B) The root morphology of the sweet11 mutant (sweet11) and the corresponding wild-type plants (Col-0) after infection of P. brassicae. Arrows point to the position of gall formation. (C) The disease index (DI) was calculated according to the formula DI = [nw] × 100/4T, where n is the number of plants in each class, w is disease symptoms (0–4), and T is the total number of plants tested. Data were collected during an infection time course at 3, 4, and 5 weeks post inoculation. Significant differences between the wild-type (Col-0) and the sweet11 mutant are indicated by asterisks (P < 0.01). (D) The relative pathogen DNA content of the sweet11 mutant (sweet11) and the corresponding wild-type plants (Col-0) after infection of P. brassicae. Horizontal axis is time point after P. brassicae inoculation. Vertical axis is the relative DNA quantities. Col-0 CK and Atsweet11 CK represent the relative DNA quantities of Arabidopsis wild type and mutant without P. brassicae infection as control.
Discussion
The plant pathogens have a tendency to change the sugar transport and distribution in host tissues which has been reported in wheat and rice (Sutton et al., 1999; Yuan and Wang, 2013), despite different types of sugars involved. It was proposed that enhanced sugar efflux from host cells could lead to sucrose and hexose accumulation in the apoplast, which are subsequently taken up by the sugar transporters of the fungal pathogens (Doidy et al., 2012). In this study, we observed that the contents of glucose and fructose were significantly increased in the clubroot tissues of CS–NIL than that of CR-NIL, but decreased in the leaves after infection with P. brassicae. The similar results were also observed in P. brassicae-infected A. thaliana, in which glucose and fructose accumulated highly in galls and decreased in the leaves (Brodmann et al., 2002). Translocation of 14C-labeled photosynthates from the leaves to the galls/roots of infected B. rapa plants was also reported (Evans and Scholes, 1995). All these studies indicate that altered sugar transport and redistributions from aboveground leaves to infected roots underlies the clubroot disease development.
The SWEET genes are prevalent and evolutionally conserved gene families in higher eukaryotes. In plants, SWEET genes not only play key roles for the sugar transport from the source to the sink organs during plant growth and development (Chen et al., 2012; Patil et al., 2015), but also are involved in the sugar and energy translocation during plant–microbe interactions. In this study, a total of 32 BrSWEET genes corresponding to 16 AtSWEET family genes were identified in the B. rapa genome. Expression profiling indicated that many of these SWEET genes were differentially expressed in the roots and leaves of B. rapa plants upon P. brassicae infection. Furthermore, the distinct soluble sugar contents occurred in the roots and leaves between the clubroot resistant and susceptible genotypes after P. brassicae infection. These results suggest that some of the BrSWEET genes are likely involved in the B. rapa–P. brassicae interaction.
Structure and Evolution of the BrSWEET Genes
The number of SWEET genes is largely variable among green plant species. For example, unicellular and green algae have only 1–3 copies of SWEET genes, but 18–23 genes in monocots, and 15–68 genes in dicots (Chong et al., 2014; Patil et al., 2015; Jian et al., 2016). Arabidopsis, the closely related species to Brassica genus, contains 17 SWEET genes (Kühn et al., 2010). In consistence with the genome triplication of Brassica species since its divergence from Arabidopsis (Wang et al., 2011), much higher numbers of SWEET genes were identified in B. rapa. These suggest that there may be functional redundancy or divarication between the respective SWEET members. However, the occurrence of gene loss during polyploid speciation was also found in the B. rapa genome corresponding to 5 Arabidopsis AtSWEET genes, i.e., the AtSWETT6 homolog was absent in B. rapa genome and AtSWETT8, AtSWETT9, AtSWETT10, as well as AtSWETT13 have only one respective orthologous gene in the B. rapa genome. The expansion or loss of some SWEET genes was also found in potato (Manck-Götzenberger and Requena, 2016), tomato (Feng et al., 2015), rice (Yuan and Wang, 2013) and B. napus (Jian et al., 2016). The expansion of some SWEET family genes of the Brassica genome suggests their possible functional differentiations in response to the environmental conditions.
In order to better understand the role of SWEET gene family during colonization of B. rapa by P. brassicae, we firstly performed a gene identification in genomic level. The phylogenetic study revealed that the BrSWEET family genes were classified into 4 clades, an agreed feature defined in other higher plants as well (Kühn et al., 2010; Patil et al., 2015). Proteins from clade III were highly conserved among Arabidopsis and Brassica species, as shown by the strong support of branches separating the three protein groups, whereas in the other clades the identification of orthologous genes between species was more difficult. In this research, 32 BrSWEET genes, most of the closely related genes in family exhibit similar motif compositions, and these motifs were arranged in the same order in the C terminal of all BrSWEETs. It suggested that there are functional similarities in the SWEET family genes. However, the order of motif arranged in the N terminal was different. Motif 1-4/5-6-7 was found in clade I, II, and IV, but motif 7-2-3-5-6 in clade III. Previous studies of sugar transport properties showed that the SWEET genes in Clade I, II, and IV were monosaccharide (glucose, fructose, galactose, and so on) transporters, the Clade III SWEET genes were sucrose (disaccharide) transporter (Chen et al., 2010, 2012; Lin et al., 2014). So, we speculated that the different motifs of N terminal MtN3 domain between Clade I, II, IV, and Clade III result in the specificity of the SWEET genes in transporting different sugars. In other word, the variation of the structural motifs among BrSWEET family suggested functional diversity of the SWEET genes.
Most of the characterized or predicted SWEET genes encoded membrane proteins with 7 TM helices harboring 2 MtN3/saliva domains (Chen et al., 2010). In consistency with this, the majority of SWEET genes identified in B. rapa contained 7 TM helices. In spite of the variation of structural motifs, the two MtN3/saliva domains structured with TM1-3 and TM5-7 are conserved among BrSWEETs. However, protein sequences of SWEET genes with 4 (BrSWEET7b) or 6 (BrSWEET2b, -4b, -8, -14c, and -17b) TM helices distributed in the 2 MtN3/saliva domains were found. Interestingly, protein sequences of BrSWEET3b and BrSWEET15c with respective 3 and 4 TM helices were also found, which were previously only reported in bacteria and archaea (Wang et al., 2014). Expression profiling revealed that BrSWEET genes containing less than 7 TM helices were expressed in various tissues, indicating that they are possible functional genes although their substrate molecules and specific functions remains to be further studied.
Expression Patterns of the Paralogous BrSWEET Genes in B. rapa
In this study, a total of 28 paralogous BrSWEET genes corresponding to 15 AtSWEETs were found in B. rapa. Expression profiling revealed that the paralogous genes of 6 BrSWEET (BrSWEET1, -2, -11, -12, -13, -17) gene families transcribed in all tested three tissues: roots, hypocotyls, and leaves, implying their functional redundancy and important role in vegetative growth stages. All clade III members of SWEETs were highly expressed in flowers, leaves and seeds, but not in roots in B. napus (Jian et al., 2016). In our result, all clade III BrSWEETs were transcribed in roots except BrSWEET9. Additionally, four genes (BrSWEET4a, -14c, -15b, and -16a) were also constantly expressed in all tissues, whereas their corresponding paralogs showed different expression patterns, indicating a possible gene function divergence which is commonly found in Brassica species (Chen et al., 2012; Jian et al., 2016). The remaining paralogous genes were either expressed in a tissue-specific manner or not expressed. For example, among 3 paralogous genes of BrSWEET5, BrSWEET5a and 5b were not expressed in all tested tissues, except BrSWEET5c expressed in the hypocotyls. However, the induction of BrSWEET5b and BrSWEET5c were observed in the roots and hypocotyls of both CR and CS NILs after P. brassicae infection. Similarly, ortholog of SWEET5b in potato was also induced in response to fungal infection, but not expressed in control tissues (Manck-Götzenberger and Requena, 2016). BrSWEET3b, -4b, -7a, -15c, and -16b were also P. brassicae-inducible, while showed different expression profiling to their paralogs. Coincident with BrSWEET3b and -7a, induction for SWEET3b and SWEET7a orthologs in rice and potato was also observed in response to mycorrhiza colonizations (Fiorilli et al., 2015; Manck-Götzenberger and Requena, 2016). These findings further suggested that the different orthoglous BrSWEET genes may play the similar roles for sugar transport in response to the biotic interactions during plant evolutionary process.
Involvement of the BrSWEET Genes in Clubroot Susceptibility
Several studies revealed that pathogens competed for sugars with infected host cells by hijacking host sugar efflux systems for disease development, being accompanied by highly induced expression of sugar transporter genes (Siemens et al., 2006; Doidy et al., 2012; Lemoine et al., 2013). P. brassicae also needs sugars from hosts for completing its life cycle, thereby inducing gall formation as an additional sink. Thus, regulation of those sugar transporters might determine the consequence of the plant-pathogen interactions.
To investigate the sugar redistribution during the B. rapa–P. brassicae interaction, we firstly detected the content of three soluble sugars in both leaves and roots of CS and CR NILs. In higher plants, sucrose is the main form of long distance transportation of carbohydrates from the source to the sink. In A. thaliana, it was found that sucrose was accumulated in uninfected leaves, but not in the leaves of P. brassicae-infected plants (Evans and Scholes, 1995), that is consisted with our results. Additionally, we also detected a decrease of sucrose together with an increase of glucose and fructose in clubroot galls in accordance with previous metabolic analysis in galls of both A. thaliana and Brassica species during development of clubroot disease (Brodmann et al., 2002; Mitchell and Rice, 2010), as well, contents of glucose and fructose in leaves of CS-NILs dramatically decreased. All these suggested that sucrose produced in P. brassicae-infected plants was exported from the leaves, probably rapidly metabolized, and further transferred into the clubroot pathogens.
Some SWEET genes showed no expression in normal growth/developmental conditions, but were transcriptionally induced by P. brassicae infection, including six genes (BrSWEET3b, -4b, -5b, -5c, -8, and -9) in the roots, seven genes (BrSWEET3a, -3b, -4b, -5b, -7a, -8, and -16b) in the hypocotyls, and three genes (BrSWEET8, -9, and -15c) in the leaves. Furthermore, inducted expression of several BrSWEET genes was at much higher levels in the CS-NIL than that of CR-NIL upon P. brassicae infection either in leaves (BrSWEET2b, -14c, -15b, -15c, -16a, -17a), hypocotyls (BrSWEET9, -16a) or roots (BrSWEET1a, -2a, -9, -11a, -15c). It is expected that these genes are responsible for transporting sugars from the leaf to the sink root tissues associated with P. brassicae colonization. Some other studies have demonstrated that increasing of SWEET expressions is to facilitate sugar transports to the non-plant sinks created by the phytopathogen infection or sugar secretions into the soil as carbon supply for pathogen growth (Patrick, 1989; Chen et al., 2010). Most of those genes belong to Clade III SWEETs which function as sucrose transporters responsible for long distance sugar transportation (Chen et al., 2010, 2012). Several studies have reported the involvement of Clade III members in various plant pathogenic systems, special SWEET11 orthologous genes in canola (B. napus) (Jian et al., 2016) and rice (Chen et al., 2010; Cernadas et al., 2014; Chandran, 2015). In our study, Arabidopsis sweet 11 mutants showed significantly lower disease index value and the P. brassicae DNA content compared to that of wild-type plants after P. brassicae inoculation, revealing that the BrSWEET11 played a crucial role during clubroot disease development. Hence, the enhanced sucrose transport from the leaf source tissues to the clubroot galls might be the main carbon transfer pathway in clubroot disease establishment, and the Clade III SWEETs play important roles in this progress. Whereas, notably some other BrSWEET genes were highly expressed in CR-NIL. Whether enhanced expressions of these genes contribute to host defense responses or are required to maintain carbon supplies for plant growth and development remains to be further investigated.
Competition for sugars at the plant–microbe interface could be controlled by the SWEET family transporters, and modulation of these transporter activities may determine the consequence (susceptibility or resistance) of the interaction (Toyofuku et al., 2000). However, this study did not examine the possible involvement of SWEET genes as potential susceptibility factors to the P. brassicae pathotypes. Presumably, SWEET genes of P. brassicae may also participate in competing for sugars in a manner of coevolving between host varieties and pathogen specializations (pathotypes), which is worthy of further study.
Conclusion
We showed here that the infection caused by the virulence P. brassicae triggered the induction of Chinese cabbage SWEET transporters that could enhance sugar transport and modulate redistribution of sugar contents in host tissues during disease development. Pathogen-triggered alterations of sugar transport and redistributions would facilitate sugar acquisition by the pathogen from infected plant cells. Taken together, the susceptible P. brassicae infection triggered induction of specific BrSWEET members and increased cellular glucose and fructose contents specifically in the roots of the CS-NIL, implying that successful P. brassicae may manipulate long distance translocation of host sugars from the site where the sugars are synthesized to the site where the clubroot pathogen colonizes and reproduces, probably through regulating a specific set of the host BrSWEET genes. However, sugar transports in higher plants are very complex. Other sugar transporters are not only required for plant growth, development and reproduction, but also involved in plant–pathogen interactions (Chu et al., 2006; Yuan et al., 2011; Chandran, 2015; Liu et al., 2016). Whether the homologs of these sugar transporters play roles during the interactions between Chinese cabbage and P. brassicae remains to be further investigated.
Author Contributions
HL performed the experiments, analyzed the data, and drafted the manuscript. XL participated in the data analysis and wrote the manuscript. YX and JJ helped to draft the manuscript. YW contributed analysis tools and helped to draft the manuscript. ZP conceived the study, participated in its coordination, and helped to draft the manuscript. All authors have read and approved the final manuscript.
Funding
This work was supported by the National Natural Science Foundation of China (Grant Nos. 31772326 and 31471882), National Key Research and Development Program of China (Grant Nos. 2017YFD0101802 and 2016YFD0100202-19), and the earmarked fund for China Agriculture Research System (CARS-12).
Conflict of Interest Statement
The authors declare that the research was conducted in the absence of any commercial or financial relationships that could be construed as a potential conflict of interest.
Supplementary Material
The Supplementary Material for this article can be found online at: https://www.frontiersin.org/articles/10.3389/fpls.2018.00207/full#supplementary-material
FIGURE S1 | Predicted domain structures of the 32 BrSWEETs. Blue lines indicate regions with cytosolic locations, pink lines indicate regions with apoplastic localization, and red boxes indicate putative transmembrane domains.
FIGURE S2 | Amino acid sequence alignment of 32 BrSWEET proteins. Multiple sequence alignment for 32 BrSWEET protein sequences was conducted using the ClustalX program. Amino acid (AA) sequences with black color indicate their 100% identity among the homologous proteins, AA sequences with blue color indicate their homology between 75 and 100%, and AA sequences with pink color indicate their homology between 50 and 75%.
FIGURE S3 | Distribution of conserved motifs of BrSWEETs. The phylogenetic tree was built using the unrooted tree that was generated in MEGA5 using the neighbor-joining (NJ) method. Motif analysis was performed using MEME 4.0 software as described in the methods. The phylogenetic tree was shown in left panel, and motif sizes are indicated at the bottom of the figure. Different motifs are indicated by different colors numbered from 1 to 10. The same number in different proteins refers to the same motif.
FIGURE S4 | Expression patterns of the SWEET genes in the hypocotyl of Chinese cabbage after infection of P. brassicae. Hierarchical clustering and heatmap representation show time course responses of SWEET gene expressions in the hypocotyl of Chinese cabbage after P. brassicae infection. The expression levels of genes are presented using fold-change values transformed to Log2 format. The data obtained by quantitative RT-PCR correspond to the levels of SWEETs in total RNA samples extracted from roots before and after infection of P. brassicae. The data indicate the relative expression levels normalized to that of the internal control Actin or 18srRNA. Gray color means no signal detected, while red and green colors correspond to up- and down-regulations of the SWEET genes, respectively.
TABLE S1 | Information of B. rapa SWEET genes.
TABLE S2 | qRT-PCR primer sequences.
TABLE S3 | Raw data of disease index (DI) value and relative pathogen DNA quantities detected between Arabidopsis wild type and sweet11 mutants.
Footnotes
- ^http://brassicadb.org
- ^http://www.expasy.org/tools/
- ^http://gsds.cbi.pku.edu.cn
- ^http://www.cbs.dtu.dk/services/TMHMM-2.0/
References
Antony, G., Zhou, J. H., Huang, S., Li, T., Liu, B., White, F., et al. (2010). Rice xa13 recessive resistance to bacterial blight is defeated by induction of the disease susceptibility gene Os-11N3. Plant Cell 22, 3864–3876. doi: 10.1105/tpc.110.078964
Artero, R. D., Terol-Alcayde, J., Paricio, N., Ring, J., Bargues, M., Torres, A., et al. (1998). Saliva, a new drosophila gene expressed in the embryonic salivary glands with homologues in plants and vertebrates. Mech. Dev. 75, 159–162. doi: 10.1016/S0925-4773(98)00087-2
Brodmann, D., Schuller, A., Ludwig-Müller, J., Aeschbacher, R. A., Wiemken, A., Boller, T., et al. (2002). Induction of trehalase in Arabidopsis plants infected with the trehalose-producing pathogen Plasmodiophora brassicae. Mol. Plant Microbe Interact. 15, 693–700. doi: 10.1094/MPMI.2002.15.7.693
Cernadas, R. A., Doyle, E. L., Niño-Liu, D. O., Wilkins, K. E., Bancroft, T., Wang, L., et al. (2014). Code-assisted discovery of TAL effector targets in bacterial leaf streak of rice reveals contrast with bacterial blight and a novel susceptibility gene. PLoS Pathog. 10:e1003972. doi: 10.1371/journal.ppat.1004126
Chandran, D. (2015). Co-option of developmentally regulated plant SWEET transporters for pathogen nutrition and abiotic stress tolerance. IUBMB Life 67, 461–471. doi: 10.1002/iub.1394
Chaube, H. S., and Singh, U. S. (1991). Plant Disease Management: Principles and Practices. Boca Raton, FL: CRC Press.
Chen, J., Pang, W., Chen, B., Zhang, C., and Piao, Z. (2016). Transcriptome analysis of Brassica rapa near-isogenic lines carrying clubroot-resistant and -susceptible alleles in response to Plasmodiophora brassicae during early infection. Front. Plant Sci. 6:1183. doi: 10.3389/fpls.2015.01183
Chen, L. Q., Hou, B. H., Lalonde, S., Takanaga, H., Hartung, M. L., Qu, X. Q., et al. (2010). Sugar transporters for intercellular exchange and nutrition of pathogens. Nature 468, 527–532. doi: 10.1038/nature09606
Chen, L. Q., Qu, X. Q., Hou, B. H., Sosso, D., Osorio, S., Fernie, A. R., et al. (2012). Sucrose efflux mediated by SWEET proteins as a key step for phloem transport. Science 335, 207–211. doi: 10.1126/science.1213351
Chong, J., Piron, M. C., Meyer, S., Merdinoglu, D., Bertsch, C., and Mestre, P. (2014). The SWEET family of sugar transporters in grapevine: VvSWEET4 is involved in the interaction with Botrytis cinerea. J. Exp. Bot. 65, 6589–6601. doi: 10.1093/jxb/eru375
Chu, Z., Yuan, M., Yao, L., Ge, X., Yuan, B., Xu, C., et al. (2006). Promoter mutations of an essential gene for pollen development result in disease resistance in rice. Genes Dev. 20, 1250–1255. doi: 10.1101/gad.1416306
Dixon, G. R. (2009). The occurrence and economic impact of Plasmodiophora brassicae and clubroot disease. J. Plant Growth Regul. 28, 194–202. doi: 10.1007/s00344-009-9090-y
Doidy, J., Grace, E., Kühn, C., Simonplas, F., Casieri, L., and Wipf, D. (2012). Sugar transporters in plants and in their interactions with fungi. Trends Plant Sci. 17, 413–422. doi: 10.1016/j.tplants.2012.03.009
Evans, J. L., and Scholes, J. D. (1995). How does clubroot alter the regulation of carbon metabolism in its host? Aspects Appl. Biol. 42, 125–132.
Faggian, R., Bulman, S. R., Lawrie, A. C., and Porter, I. J. (1999). Specific polymerase chain reaction primers for the detection of Plasmodiophora brassicae in soil and water. Phytopathology 89, 392–397. doi: 10.1094/PHYTO.1999.89.5.392
Feng, C. Y., Han, J. X., Han, X. X., and Jiang, J. (2015). Genome-wide identification, phylogeny, and expression analysis of the SWEET gene family in tomato. Gene 573, 261–272. doi: 10.1016/j.gene.2015.07.055
Ferrari, S., Galletti, R., Denoux, C., Lorenzo, G. D., Ausubel, F. M., and Dewdney, J. (1994). Resistance to Botrytis cinerea induced in Arabidopsis by elicitors is independent of salicylic acid, ethylene, or jasmonate signaling but requires Phytoalexin Deficent3. Plant Physiol. 144, 367–379. doi: 10.1104/pp.107.095596
Fiorilli, V., Vallino, M., Biselli, C., Faccio, A., Bagnaresi, P., and Bonfante, P. (2015). Host and non-host roots in rice: cellular and molecular approaches reveal differential responses to arbuscular mycorrhizal fungi. Front. Plant Sci. 6:636. doi: 10.3389/fpls.2015.00636
Gamas, P., Niebel, F. C., Lescure, N., and Cullimore, J. (1996). Use of a subtractive hybridization approach to identify new Medicago truncatula genes induced during root nodule development. Mol. Plant Microbe Interact. 9, 233–242. doi: 10.1094/MPMI-9-0233
Ge, Y. X., Angenent, G. C., Wittich, P. E., Peters, J., Franken, J., Busscher, M., et al. (2000). Nec1, a novel gene, highly expressed in nectary tissue of petunia hybrida. Plant J. 24, 725–734. doi: 10.1046/j.1365-313x.2000.00926.x
Guan, Y. F., Huang, X. Y., Zhu, J., Gao, J. F., Zhang, H. X., and Yang, Z. N. (2008). RUPTURED POLLEN GRAIN1, a member of the MtN3/saliva gene family, is crucial for exine pattern formation and cell integrity of microspore in Arabidopsis. Plant Physiol. 147, 852–863. doi: 10.1104/pp.108.118026
Guo, X. H. (2001). Biological Characteristics and Pathogenesis of Plasmodiophora brassicae. Chongqing: Southwest Agriculture University.
Irani, S., Trost, B., Waldner, M., Nayidu, N., Tu, J., Kusalik, A. J., et al. (2018). Transcriptome analysis of response to Plasmodiophora brassicae infection in the Arabidopsis shoot and root. BMC Genomics 19:23. doi: 10.1186/s12864-017-4426-7
Jain, M., Kaur, N., Tyagi, A. K., and Khurana, J. P. (2006). The auxin-responsive GH3 gene family in rice (Oryza sativa). Funct. Integr. Genomics 6, 36–46. doi: 10.1007/s10142-005-0142-5
Jian, H., Lu, K., Yang, B., Wang, T., Zhang, L., Zhang, A., et al. (2016). Genome-wide analysis and expression profiling of the SUC and SWEET gene families of sucrose transporters in oilseed rape (Brassica napus l.). Front. Plant Sci. 7:1464. doi: 10.3389/fpls.2016.01464
Karling, J. S. (1968). The plasmodiophorales: including a complete host index, bibliography, and a description of diseases caused by species of this order. Mol. Biol. Evol. 22, 582–588.
Keen, N. T., and Williams, P. H. (1969). Translocation of sugars into infected cabbage tissues during clubroot development. Plant Physiol. 44, 748–754. doi: 10.1104/pp.44.5.748
Kühn, C., Grof, C. P. L., Sonnewald, U., and Frommer, W. B. (2010). Sucrose transporters of higher plants. Curr. Opin. Plant Biol. 13, 287–298. doi: 10.1016/j.pbi.2010.02.001
Lemarie, S., Robert-Seilaniantz, A., Lariagon, C., Lemoine, J., Marnet, N., Levrel, A., et al. (2015). Camalexin contributes to the partial resistance of Arabidopsis thaliana to the biotrophic soilborne protist Plasmodiophora brassicae. Front. Plant Sci. 6:539. doi: 10.3389/fpls.2015.00539
Lemoine, R., Camera, S. L., Atanassova, R., Dédaldéchamp, F., Allario, T., Pourtau, N., et al. (2013). Source-to-sink transport of sugar and regulation by environmental factors. Front. Plant Sci. 4:272. doi: 10.3389/fpls.2013.00272
Lin, I. W., Sosso, D., Chen, L. Q., Gase, K., Kim, S. G., Kessler, D., et al. (2014). Nectar secretion requires sucrose phosphate synthases and the sugar transporter SWEET9. Nature 508, 546–549. doi: 10.1038/nature13082
Liu, Q., Yuan, M., Zhou, Y., Li, X., Xiao, J., and Wang, S. (2011). A paralog of the MtN3/saliva family recessively confers race-specific resistance to Xanthomonas oryzae in rice. Plant Cell Environ. 34, 1958–1969. doi: 10.1111/j.1365-3040.2011.02391.x
Liu, X., Zhang, Y., Yang, C., Tian, Z., and Li, J. (2016). AtSWEET4, a hexose facilitator, mediates sugar transport to axial sinks and affects plant development. Sci. Rep. 6:24563. doi: 10.1038/srep24563
Malinowski, R., Smith, J. A., Fleming, A. J., Scholes, J. D., and Rolfe, S. A. (2012). Gall formation in clubroot-infected Arabidopsis results from an increase in existing meristematic activities of the host but is not essential for the completion of the pathogen life cycle. Plant J. 71, 226–238. doi: 10.1111/j.1365-313X.2012.04983.x
Manck-Götzenberger, J., and Requena, N. (2016). Arbuscular mycorrhiza symbiosis induces a major transcriptional reprogramming of the potato SWEET sugar transporter family. Front. Plant Sci. 7:487. doi: 10.3389/fpls.2016.00487
Mitchell, D., and Rice, K. (2010). Translocation of 14C-labelled assimilates in cabbage during club root development. Ann. Appl. Biol. 92, 143–152. doi: 10.1111/j.1744-7348.1979.tb02967.x
Patil, G., Valliyodan, B., Deshmukh, R., Prince, S., Nicander, B., Zhao, M., et al. (2015). Soybean (Glycine max) SWEET gene family: insights through comparative genomics, transcriptome profiling and whole genome re-sequence analysis. BMC Genomics 16:520. doi: 10.1186/s12864-015-1730-y
Patrick, J. W. (1989). Solute Efflux from the host at plant-microorganism interfaces. Funct. Plant Biol. 16, 53–67. doi: 10.1071/PP9890053
Piao, Z. Y., Deng, Y. Q., Choi, S. R., Park, Y. J., and Lim, Y. P. (2004). SCAR and CAPS mapping of CRb, a gene conferring resistance to Plasmodiophora brassicae in Chinese cabbage (Brassica rapa ssp. pekinensis. Theor. Appl. Genet. 108, 1458–1465. doi: 10.1007/s00122-003-1577-5
Quirino, B. F., Normanly, J., and Amasino, R. M. (1999). Diverse range of gene activity during Arabidopsis thaliana leaf senescence includes pathogen-independent induction of defense-related genes. Plant Mol. Biol. 40, 267–278. doi: 10.1023/A:1006199932265
Reinders, A., Sivitz, A. B., Starker, C. G., Gantt, J., Stephen, W., and John, M. (2008). Functional analysis of LjSUT4, a vacuolar sucrose transporter from Lotus japonicus. Plant Mol. Biol. 68, 289–299. doi: 10.1007/s11103-008-9370-0
Reinders, A., Sivitz, A. B., and Ward, J. M. (2011). Evolution of plant sucrose uptake transporters. Front. Plant Sci. 3:22. doi: 10.3389/fpls.2012.00022
Roman, R. V., and Rathjen, J. P. (2017). Apoplastic sugar extraction and quantification from wheat leaves infected with biotrophic fungi. Methods Mol. Biol. 1659, 125–134. doi: 10.1007/978-1-4939-7249-4-11
Schuller, A., and Ludwig-Müller, J. (2016). Histological methods to detect the clubroot pathogen Plasmodiophora brassicae during its complex life cycle. Plant Pathol. 65, 1223–1237. doi: 10.1111/ppa.12520
Schwelm, A., Fogelqvist, J., Knaust, A., Julke, S., Lilja, T., Bonilla-Rosso, G., et al. (2015). The Plasmodiophora brassicae genome reveals insights in its life cycle and ancestry of chitin synthases. Sci. Rep. 5:11153. doi: 10.1038/srep11153
Seo, P. J., Park, J. M., Kang, S. K., Kim, S. G., and Park, C. M. (2011). An Arabidopsis senescence-associated SAG29 regulates cell viability under high salinity. Planta 233, 189–200. doi: 10.1007/s00425-010-1293-8
Siemens, J., Keller, I., Sarx, J., Kunz, S., Schuller, A., Nagel, W., et al. (2006). Transcriptome analysis of Arabidopsis clubroots indicate a key role for cytokinins in disease development. Mol. Plant Microbe Interact. 19, 480–494. doi: 10.1094/MPMI-19-0480
Siemens, J., Nagel, M., Ludwig-Müller, J., and Sacristán, M. D. (2010). The Interaction of Plasmodiophora brassicae and Arabidopsis thaliana: parameters for disease quantification and screening of mutant lines. J. Phytopathol. 150, 592–605. doi: 10.1046/j.1439-0434.2002.00818.x
Sutton, P. N., Henry, M. J., and Hall, J. L. (1999). Glucose, and not sucrose, is transported from wheat to wheat powdery mildew. Planta 208, 426–430. doi: 10.1007/s004250050578
Toyofuku, K., Kasahara, M., and Yamaguchi, J. (2000). Characterization and expression of monosaccharide transporters (OsMSTs) in rice. Plant Cell Physiol. 41, 940–947. doi: 10.1093/pcp/pcd016
Wang, J., Yan, C., Li, Y., Hirata, K., Yamamoto, M., Yan, N., et al. (2014). Crystal structure of a bacterial homologue of SWEET transporters. Cell Res. 24, 1486–1489. doi: 10.1038/cr.2014.144
Wang, X., Wang, X., Cheng, F., Li, Y., Du, Y., Liao, Y., et al. (2011). The genome of the mesopolyploid crop species Brassica rapa. Nat. Genet. 43, 1035–1039. doi: 10.1038/ng.919
Williams, P. H., Keen, N. T., Strandberg, J. O., and McNabola, S. S. (1968). Metabolic synthesis and degradation during clubroot development in cabbage hypocotyls. Phytopathology 58, 921–928.
Yang, B., Sugio, A., and White, F. F. (2006). Os8N3 is a host disease-susceptibility gene for bacterial blight of rice. Proc. Natl. Acad. Sci. U.S.A. 103, 10503–10508. doi: 10.1073/pnas.0604088103
Yuan, M., and Wang, S. (2013). Rice MtN3/saliva/SWEET family genes and their homologues in cellular organisms. Mol. Plant 6, 665–674. doi: 10.1093/mp/sst035
Yuan, T., Li, X., Xiao, J., and Wang, S. (2011). Characterization of Xanthomonas oryzae-responsive cis-acting element in the promoter of rice race-specific susceptibility gene Xa13. Mol. Plant 4, 300–309. doi: 10.1093/mp/ssq076
Zhang, T., Wu, D., Zhao, Z., Wang, Z., and Piao, Z. Y. (2012). Development of near isogenic lines for clubroot resistance in Chinese cabbage and their assessment. Mol. Plant Breed. 10, 722–730.
Keywords: Brassica rapa, SWEETs, sugar translocation, Plasmodiophora brassicae, clubroot
Citation: Li H, Li X, Xuan Y, Jiang J, Wei Y and Piao Z (2018) Genome Wide Identification and Expression Profiling of SWEET Genes Family Reveals Its Role During Plasmodiophora brassicae-Induced Formation of Clubroot in Brassica rapa. Front. Plant Sci. 9:207. doi: 10.3389/fpls.2018.00207
Received: 13 October 2017; Accepted: 02 February 2018;
Published: 28 February 2018.
Edited by:
Mahmut Tör, University of Worcester, United KingdomReviewed by:
Hossein Borhan, Agriculture and Agri-Food Canada (AAFC), CanadaVolkan Cevik, University of Bath, United Kingdom
Copyright © 2018 Li, Li, Xuan, Jiang, Wei and Piao. This is an open-access article distributed under the terms of the Creative Commons Attribution License (CC BY). The use, distribution or reproduction in other forums is permitted, provided the original author(s) and the copyright owner are credited and that the original publication in this journal is cited, in accordance with accepted academic practice. No use, distribution or reproduction is permitted which does not comply with these terms.
*Correspondence: Zhongyun Piao, zypiaosau@163.com
†These authors have contributed equally to this work.