 Heng Wang1Xiangjie Qian2Lan Zhang2Sailong Xu3Haifeng Li1*Xiaojian Xia2*Liankui Dai3Liang Xu1Jingquan Yu2Xu Liu1
- 1State Key Laboratory of Modern Optical Instrumentation, Zhejiang University, Hangzhou, China
- 2Department of Horticulture, Zhejiang University, Hangzhou, China
- 3College of Control Science and Engineering, Zhejiang University, Hangzhou, China
We present a high throughput crop physiology condition monitoring system and corresponding monitoring method. The monitoring system can perform large-area chlorophyll fluorescence imaging and multispectral imaging. The monitoring method can determine the crop current condition continuously and non-destructively. We choose chlorophyll fluorescence parameters and relative reflectance of multispectral as the indicators of crop physiological status. Using tomato as experiment subject, the typical crop physiological stress, such as drought, nutrition deficiency and plant disease can be distinguished by the monitoring method. Furthermore, we have studied the correlation between the physiological indicators and the degree of stress. Besides realizing the continuous monitoring of crop physiology, the monitoring system and method provide the possibility of machine automatic diagnosis of the plant physiology.
Highlights: A newly designed high throughput crop physiology monitoring system and the corresponding monitoring method are described in this study. Different types of stress can induce distinct fluorescence and spectral characteristics, which can be used to evaluate the physiological status of plants.
Introduction
Improvement of agricultural production capacity is extremely important to human beings in face of the expanding population in the 21st century (Alston et al., 2009; Godfray et al., 2010). To achieve this goal, we need modernization of agriculture which relies on breakthrough in aspects such as dynamic monitoring, intelligent control, and automatic implementation (Klukas et al., 2014; Sankaran et al., 2015). For nursery of high quality seedlings, monitoring the crop growing status continuously and non-destructively is the first step to make decisions as to change the environment conditions, and adjust the inputs of water and nutrients (White et al., 2012; Andrade-Sanchez et al., 2014). It is also necessary to obtain the growth status information to guide the control of plant diseases in greenhouse and field (Stafford, 2000; Diacono et al., 2013). However, it is challenging to monitor the physiology of a population of crops in a large scale and continuously over a period of time. Automatic approach is required for detection of large quantities of plants. Meanwhile, the information about the crop growth status should be visualized and quantified in order to offer a more intuitive and standardized reference for management of the environment (Berger et al., 2010; Virlet et al., 2014).
To detect the physiological status of plants, a range of technologies and/or their combinations have been applied (Chaerle et al., 2007a), such as chlorophyll fluorescence imaging (Barbagallo et al., 2003; Baker and Rosenqvist, 2004), multispectral imaging (Lenk et al., 2007; Zarco-Tejada et al., 2009), thermal imaging (Kaukoranta et al., 2005; Chaerle et al., 2007b) and terahertz technique (Born et al., 2014). However, the extension of these approaches for large-scale use is not straightforward. The data volume acquired is not large enough when the techniques mentioned above are applied in greenhouse, field and other places of large area. Importantly, the small amount of data cannot fully reflect the overall physiological status of crop population.
Among different methods for detecting plant physiology, chlorophyll fluorescence is used as an accurate probe of photosynthesis. In the process of photosynthesis, the light energy absorbed by chlorophyll converts to photochemical energy stored as ATP and NADPH through a series of reactions (Baker, 2008). Most of the light energy is used for photosynthesis, and parts of the light energy are dissipated as heat or reemitted as fluorescence. Changes in photosynthesis and heat dissipation resulted in fluctuation of the chlorophyll fluorescence. Measurement of chlorophyll fluorescence can be divided into non-modulated and modulated modes (Govindje, 1995; Stirbet and Govindjee, 2011). With the development of light emitting diodes (LED) and saturating pulse technique, the modulated chlorophyll fluorescence measurement has been more widely used. For commercial use, instruments used in different situation have been produced by manufacturers such as Walz1, Photon Systems Instruments2, Hanstech Instruments3 and so on. There are also some research institutes have developed setups of chlorophyll fluorescence measurement (Oxborough and Baker, 1997; Lichtenthaler and Babani, 2000; Nedbal et al., 2000; Porcarcastell et al., 2008; Kalaji et al., 2012). The typical technical parameters such as even illumination, saturating pulse intensity and detection area are the main concerns of researchers (Murchie and Lawson, 2013).
Multispectral imaging of plant is applied from microscopic scale to remote sensing (Dammer et al., 2011; Laliberte et al., 2011; Huang et al., 2015). The reflectance of different wavelengths is associated with the chemical composition of leaves, e.g., the content of chlorophyll and nutrient elements (Yendrek et al., 2017). Analysis based on reflectance curve or reflectance image has been applied in related research (Chaerle et al., 2007c; Bauriegel et al., 2011). Imaging has the inherent advantage of showing the distribution and variation of signals over a sample. To achieve imaging under different wavelengths, CCD cameras combined with different filters are usually used.
In this study, we developed a system for high throughput monitoring the crop physiology states in a greenhouse. The system employs the monitoring method integrating chlorophyll fluorescence imaging with multispectral imaging. Using a greenhouse crop tomato as the research object, we set up typical environmental stresses including drought, nutrition deficiency and plant disease to study the application of our system in the monitoring of greenhouse crop physiology. The method combining chlorophyll fluorescence imaging with multispectral imaging can help us comprehensively judge different crop stresses. Through selecting appropriate parameters of chlorophyll fluorescence and relative reflectance of multispectral as the indicators of crop physiological status, the type of stress suffered by crops can be distinguished. In addition, we attempted to set up calibration of the indicators of crop physiological status, which can be used as reference to estimate the general stress degree of plants. Furthermore, automatic diagnosis of the plant physiology by the system can be implemented based on the method.
Materials and Methods
Plant Material
Seedlings of tomato (Solanum lycopersicum L. cv. Hezuo 903) were used. Seeds were germinated in a growth medium filled with a mixture of peat and vermiculite (3:1, v/v) in trays in a growth chamber. Seedlings (except those for nutrition experiments) at two-leaf stage were transplanted into plastic pots (15 cm diameter and 15 cm depth, one seedling per pot) containing peat and vermiculite (3:1, v/v). The two-leaf stage seedlings for nutrition experiments were transplanted into plastic pots containing vermiculite and perlite (3:1, v/v). All seedlings were watered and fertilized with Hoagland’s solution (Hoagland, 1950) every 2 days. The growth conditions were as follows: 12-h photoperiod, temperature of 25°C/20°C (day/night), and photosynthetic photon flux density of 600 μmol m-2 s-1.
Drought Treatment
When tomato seedlings were at four-leaf stage, drought experiment was performed. The day when we started withdrawing water was set as day 1. Soil relative water content was determined by using a soil moisture meter (Takeme, GREYWELL, CHN).
Nutrition Deficiency Treatment
When tomato seedlings were at four-leaf stage, nitrogen deficiency experiment was performed. The treatment group was watered with nitrogen deficient nutrient solution. The Hoagland’s nutrient solution contained 354 mg/L Ca(NO3)2⋅4H2O, 505.5 mg/L KNO3, 115 mg/L NH4H2PO4 and 246.5 mg/L MgSO4⋅7H2O, and nitrogen deficient nutrient solution contained 166.5 mg/L CaCl2, 348.5 mg/L K2SO4, 136 mg/L KH2PO4, and 246.5 mg/L MgSO4⋅7H2O. The day when the nutrient solution was replaced was set as day 1.
Disease Treatment
When tomato seedlings were at five- to six-leaf stage, the plants were inoculated with Botrytis cinerea (BO5-10 strain) suspensions at a density of 2 × 10⁵ spores per mL (Zhang et al., 2015). The day when the seedlings were inoculated with B. cinerea was set as day 1.
Different Nitrogen Strength Treatment
When tomato seedlings were at four-leaf stage, they were separated into three groups. Plants of the three groups were, respectively, watered with nitrogen deficiency, full strength and double strength (708 mg/L Ca(NO3)2⋅4H2O, 1011 mg/L KNO3, 230 mg/L NH4H2PO4, and 246.5 mg/L MgSO4⋅7H2O) Hoagland’s solution. The day beginning different nitrogen strength treatment was set as day 1. From day 1 to day 7, tomato leaves were sampled for chlorophyll fluorescence measurement and total nitrogen determination.
Monitoring System
The monitoring of plant physiology is carried out by the system integrating chlorophyll fluorescence imaging module and multispectral imaging module (Figure 1). The chlorophyll fluorescence imaging module consists of lighting part, CCD (PCO 1300, PCO, GER) imaging part and circuit control part. The lighting part contains 16 × 100 W LEDs to provide actinic light for activating the photosynthesis, saturating light pulse for inhibiting photosynthesis and excitation light pulse for measuring the fluorescence signal. The central wavelength of the LED is 460 nm. Square light pipe is used to even LED lighting spot. LED lighting spots focus on the same region to form 0.45 m × 0.34 m uniform illumination area. The CCD camera with a cut-off high-pass filter to detect fluorescence above 650 nm is surrounded by the 16 lighting tubes. The fluorescence images are captured by the signal pulse generated by the control circuit. For multispectral imaging, CCD (PCO 1300, PCO, GER) is placed behind band-pass filters. The band-pass filters are set on a rotating plate. With the rotating of the plate, CCD captures images under different wavelengths. Incandescent lamps are used to provide visible wavelengths lighting condition.
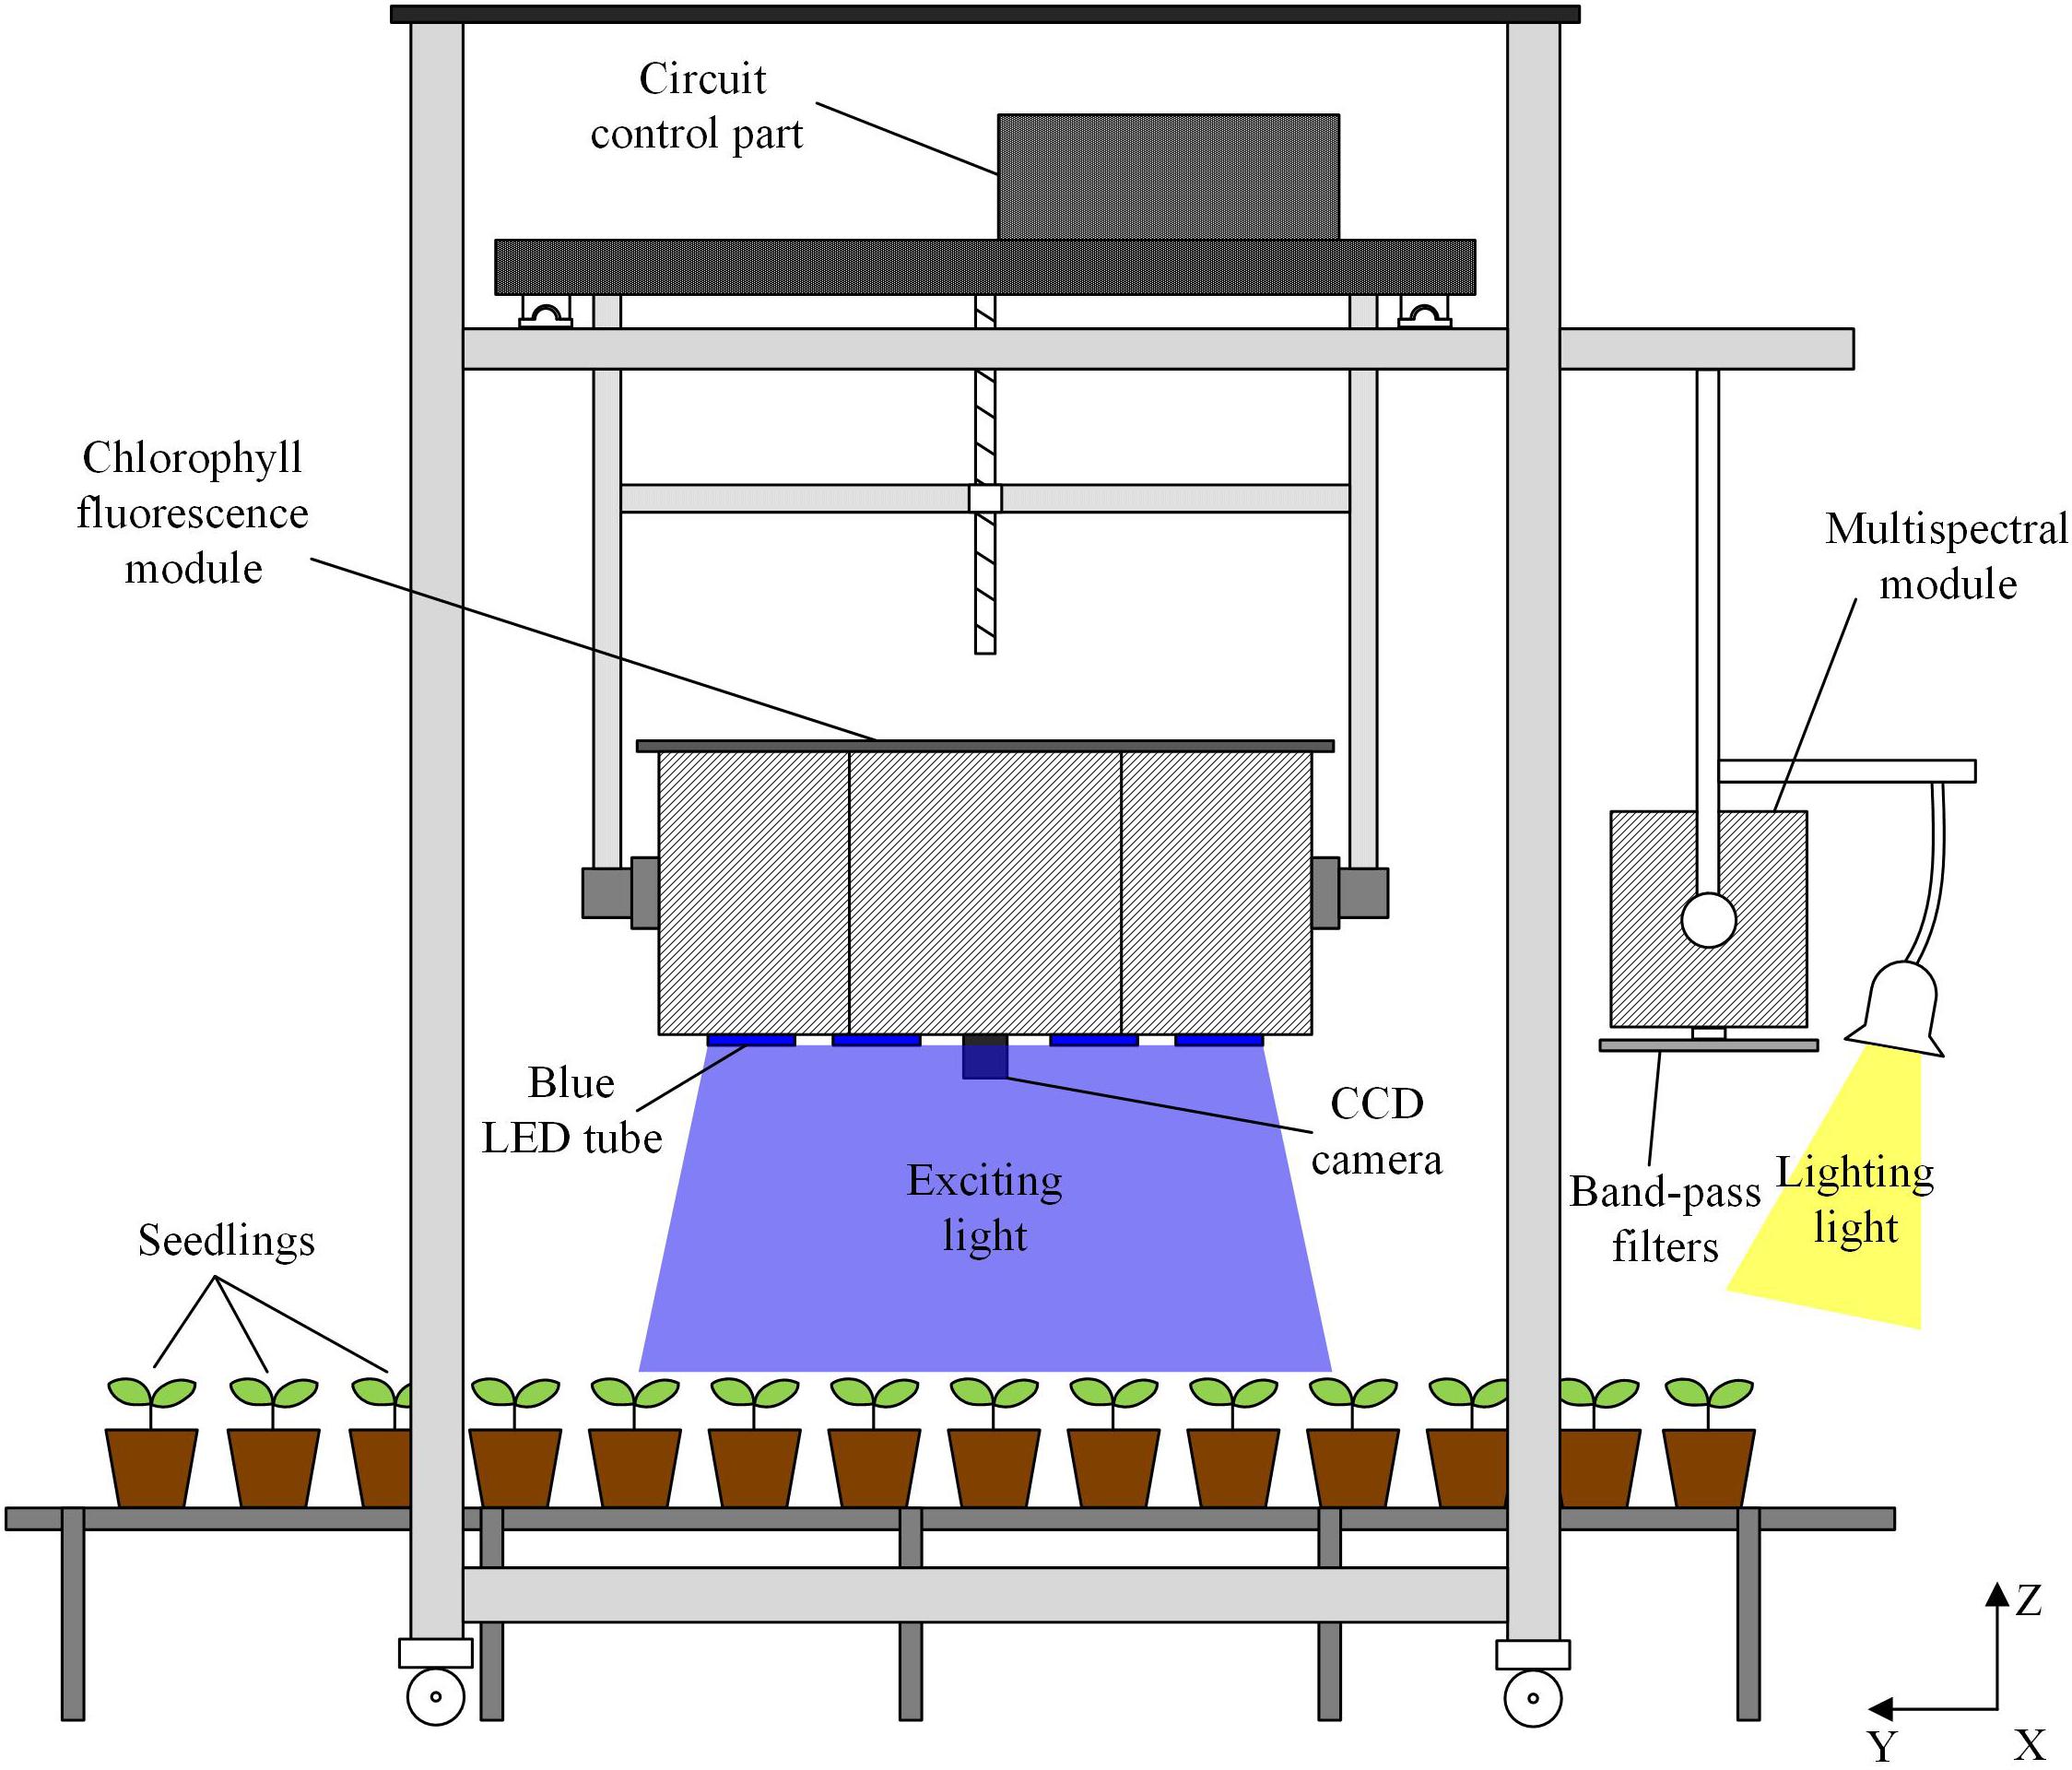
FIGURE 1. Schematic diagram of crop physiology monitoring system (see Supplementary Figure S1 for the system photo in working state). Chlorophyll fluorescence module provides uniform illumination within the field of view of the fluorescence camera. Imaging acquisition, including the control of the camera and the light source by the circuit part as well as data analysis is carried out by the software developed on the computer. Through scanning along with x, y, z axes, the monitoring of all the plants on the seedling bed can be accomplished by the system.
Monitoring Method and Data Analysis
A software supporting modulated chlorophyll fluorescence measurement is developed based on Visual Studio 2010 (Microsoft, United States). In order to avoid the interference of ambient light, plants were dark adapted for at least half an hour at night before chlorophyll fluorescence measurement. First, the minimal level of fluorescence Fo was obtained after the measuring light (0.1 μmol photons m-2 s-1) was opened. Next, the maximal level of fluorescence Fm was obtained when the photosynthesis was temporarily inhibited by a saturating light pulse (>6000 μmol photons m-2 s-1). Then, the actinic light (200 μmol photons m-2 s-1) was opened to simulate the ambient light condition, under which the photosynthesis of the plant leaves was activated. When the photosynthesis was stable, the steady-state fluorescence F was obtained, meanwhile a saturating light pulse was applied to elicit the maximal level of fluorescence Fm′ under light condition.
After chlorophyll fluorescence measurement of all plants on the locations of the seedling bed, the monitoring system went back to the initial position and acquired multispectral images of the same locations. Through two-dimensional scanning on the field, the monitoring system can achieve measurement in a larger scale.
In order to distinguish the fluorescence and spectral characteristic induced by drought, nitrogen deficiency, and plant disease (gray leaf mold), we choose three parameters to reflect the physiological status of plants. Fv/Fm, the maximum quantum efficiency of photosystem II (PSII), represents the potential maximum capacity of PSII reaction center transforming the photon energy absorbed by PSII to photochemical energy. ΦPSII represents the operating quantum efficiency of PSII. 550/510, the ratio of 550 nm spectral reflectance to 510 nm spectral reflectance, represents the degree of greening of the leaves.
Image processing and data analysis is carried out using Matlab 2017b (Mathworks, United States). Resolution of images acquired is 696 × 520 and plant area should be segmented from the images. For chlorophyll fluorescence parameter images, the parameter of the non-plant area is very small as the non-fluorescing of non-plant area. So, we set threshold to segment the plant area. For multispectral images, we implemented an algorithm based on K-means clustering (Macqueen, 1965; Lucchese and Mitra, 2001), in which image can be grouped into two classes representing the plant and the background, respectively. Based on the four chlorophyll fluorescence images Fo, Fm, F, Fm′, we can calculate the maximum quantum efficiency of PSII Fv/Fm = (Fm–Fo)/Fm and operating quantum efficiency of PSII ΦPSII = (Fm′–F)/Fm′. Based on the spectral images of 550 nm and 510 nm, we can calculate the relative reflectance 550/510.
Determination of Water Potential
Leaf water potential (Begg and Turner, 1970) of drought-stressed plants was measured with a water potential meter (WP4C, Decagon Devices, United States). Canopy leaves of plants under different drought condition were cut and placed inside the sample cup. The water potential was determined by the dew point method.
Determination of Total Nitrogen
The total nitrogen is determined spectrophotometrically using the Nessle’s reagent. The first procedure is the digestion of the sample. Fresh plant leaves were dried to constant weight and ground to a fine power with mortar and pestle. Sample powder (0.1 g) was placed in a boiling tube. H2SO4 (5 mL) was added to the boiling tube and then the tube was placed overnight. All boiling tubes with the samples were heated in graphite digestion apparatus and the temperature was raised from 150 to 200°C until the appearance of white smoke. Ten drops of 30% H2O2 was added when the solution became dark brown and mixed the solution constantly. Then the solution was heated for 5 min. The H2O2 treatment and heating was repeated 3–5 times till the remained H2O2 was removed and the solution was clear and transparent. Then the solution was diluted to 50 mL with double distilled water (ddH2O).
After pretreatment procedure, 1 mL sample solution was mixed with 2 mL 25% sodium potassium tartrate, 2 mL Nessler’s reagent (HgI2, KI, and NaOH) and 45 mL non-ammonia water. The absorbance of the resulting solution at 480 nm (OD480) was measured by spectrophotometer (TU-1900, PERSEE, CHN). For standard solution, 10 mg/L (NH4)2SO4 was prepared. Calibration curve was obtained with OD480 of 0, 2, 4, 6, 8, and 10 mL standard solution. By comparison with the calibration curve, the total nitrogen of the sample was determined.
Results
The Fluorescence and Spectral Characteristics of Tomato Plants Under Drought Stress
The soil relative water content decreased dramatically from day 1 to day 5 after withdraw water (Figure 2). In the later stage of experiment, the soil relative water content was relatively stable but at a low level. Pseudo-color images of ΦPSII, Fv/Fm and 550/510 parameters (Figure 3) visualize how drought stress affected the physiological status of tomato plants (see Supplementary Figures S2, S3 for more images). As soil relative water content decreased, mean ΦPSII declined steadily from above 0.4 on day 1 to about 0.3 on day 5 (Figure 4A). When plants suffered from severe drought stress (day 7 – day 9), tomato leaves wilted and the ΦPSII did not decrease further, remaining about 0.25. Until this time, both Fv/Fm and 550/510 showed significant declines. Therefore, ΦPSII is a sensitive indicator to show changes in plant physiology during the initial stage of drought stress when the plant morphology didn’t change obviously. For plants in the well-watered control group, ΦPSII and Fv/Fm remained stable around 0.4 and 0.8, respectively. Meanwhile, the value of 550/510 showed a slight rising trend (Figure 4B).
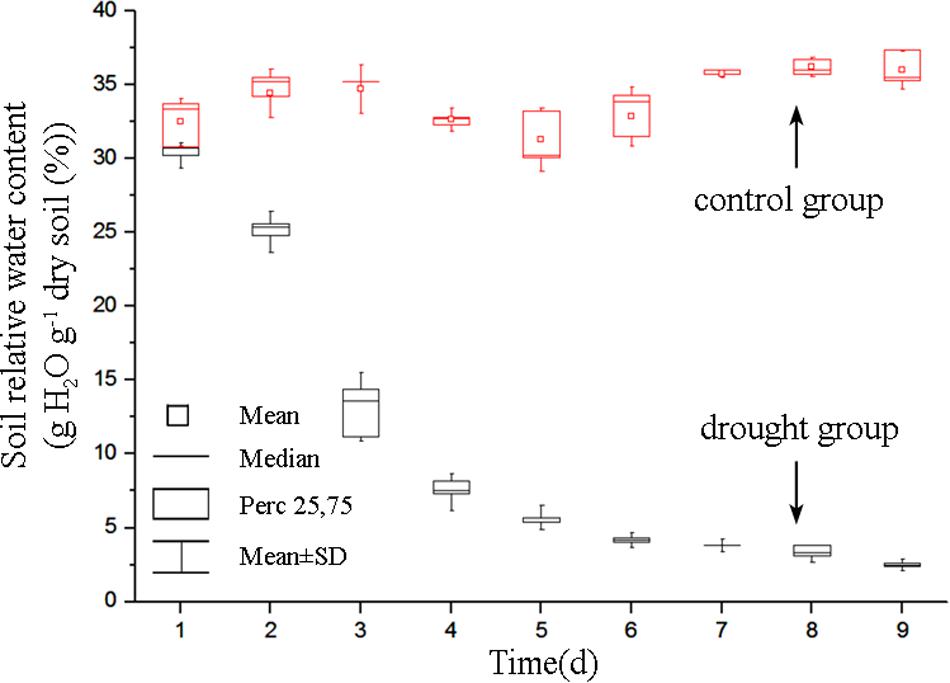
FIGURE 2. Dynamics of soil relative water content of the drought group and the control group. For each line, n = 5.
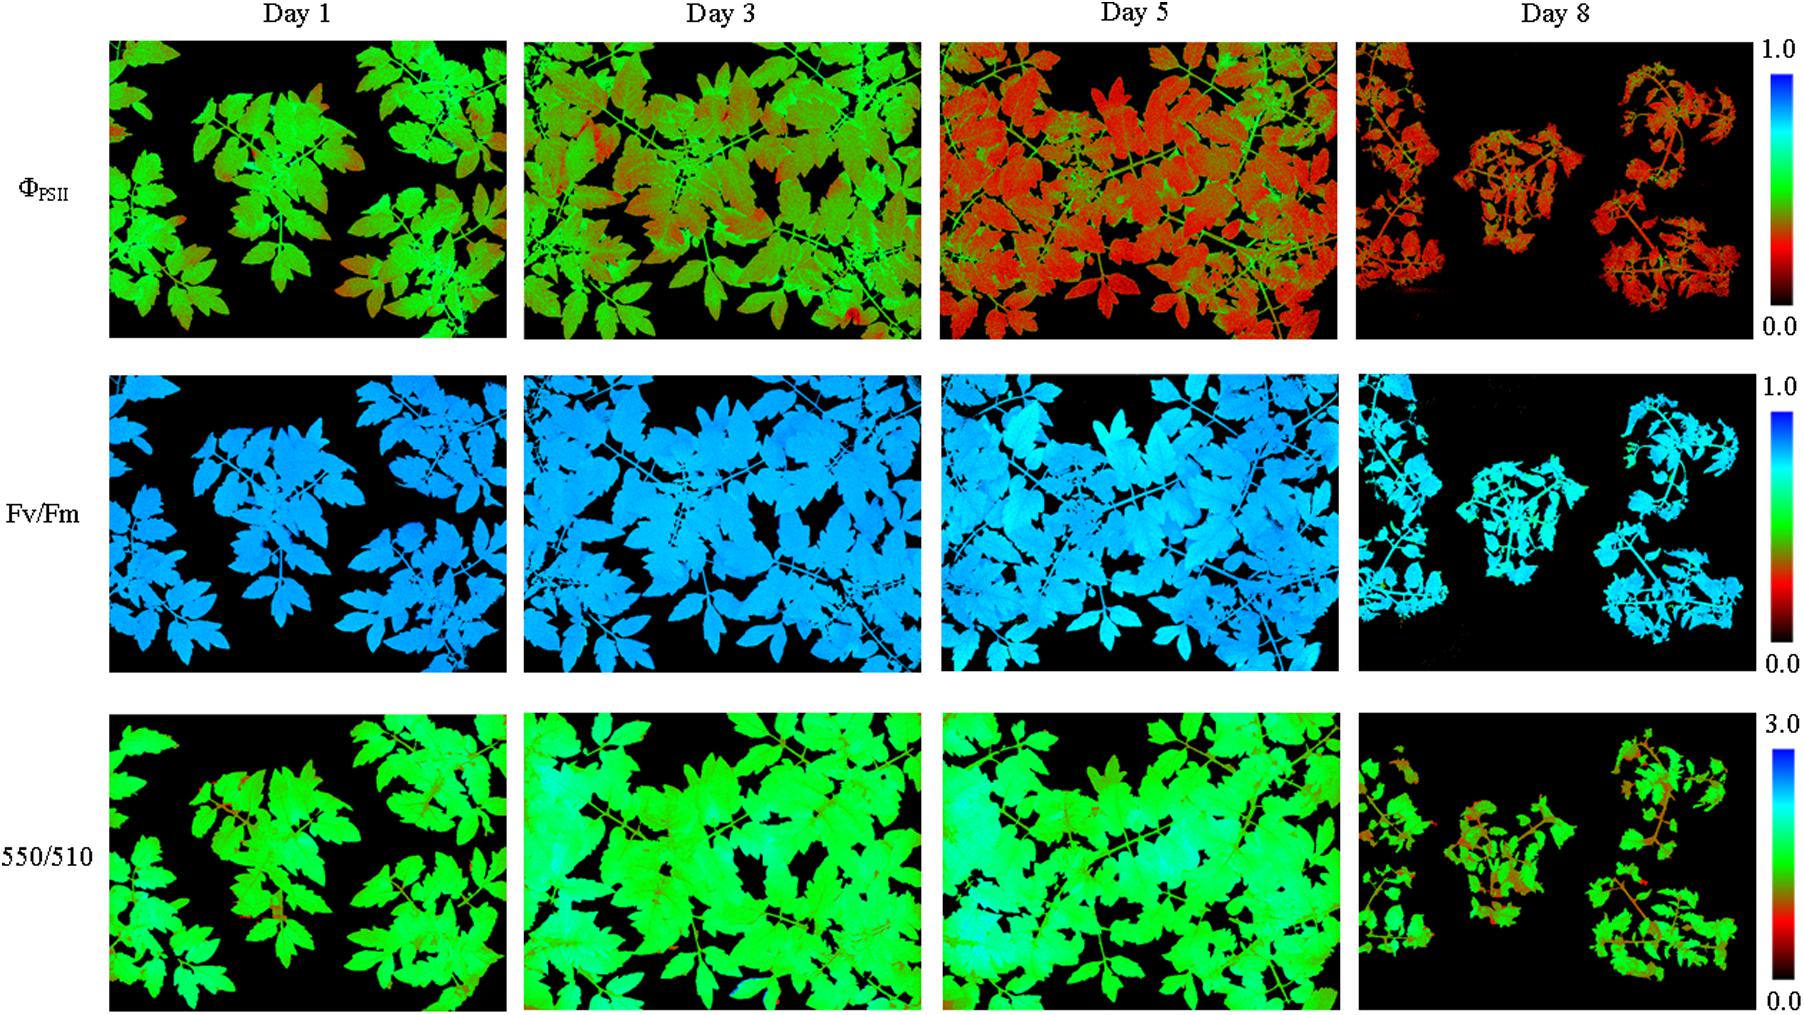
FIGURE 3. Pseudo-color images of ΦPSII, Fv/Fm,and 550/510 parameters of tomatoes under drought stress (see Supplementary Figure S2 for more images). From day 1 to day 5 plant morphology didn’t change notably, and ΦPSII of all the plant leaves decreased notably. As the drought degree deepened, plant leaves wilted and Fv/Fm and 550/510 decreased obviously.
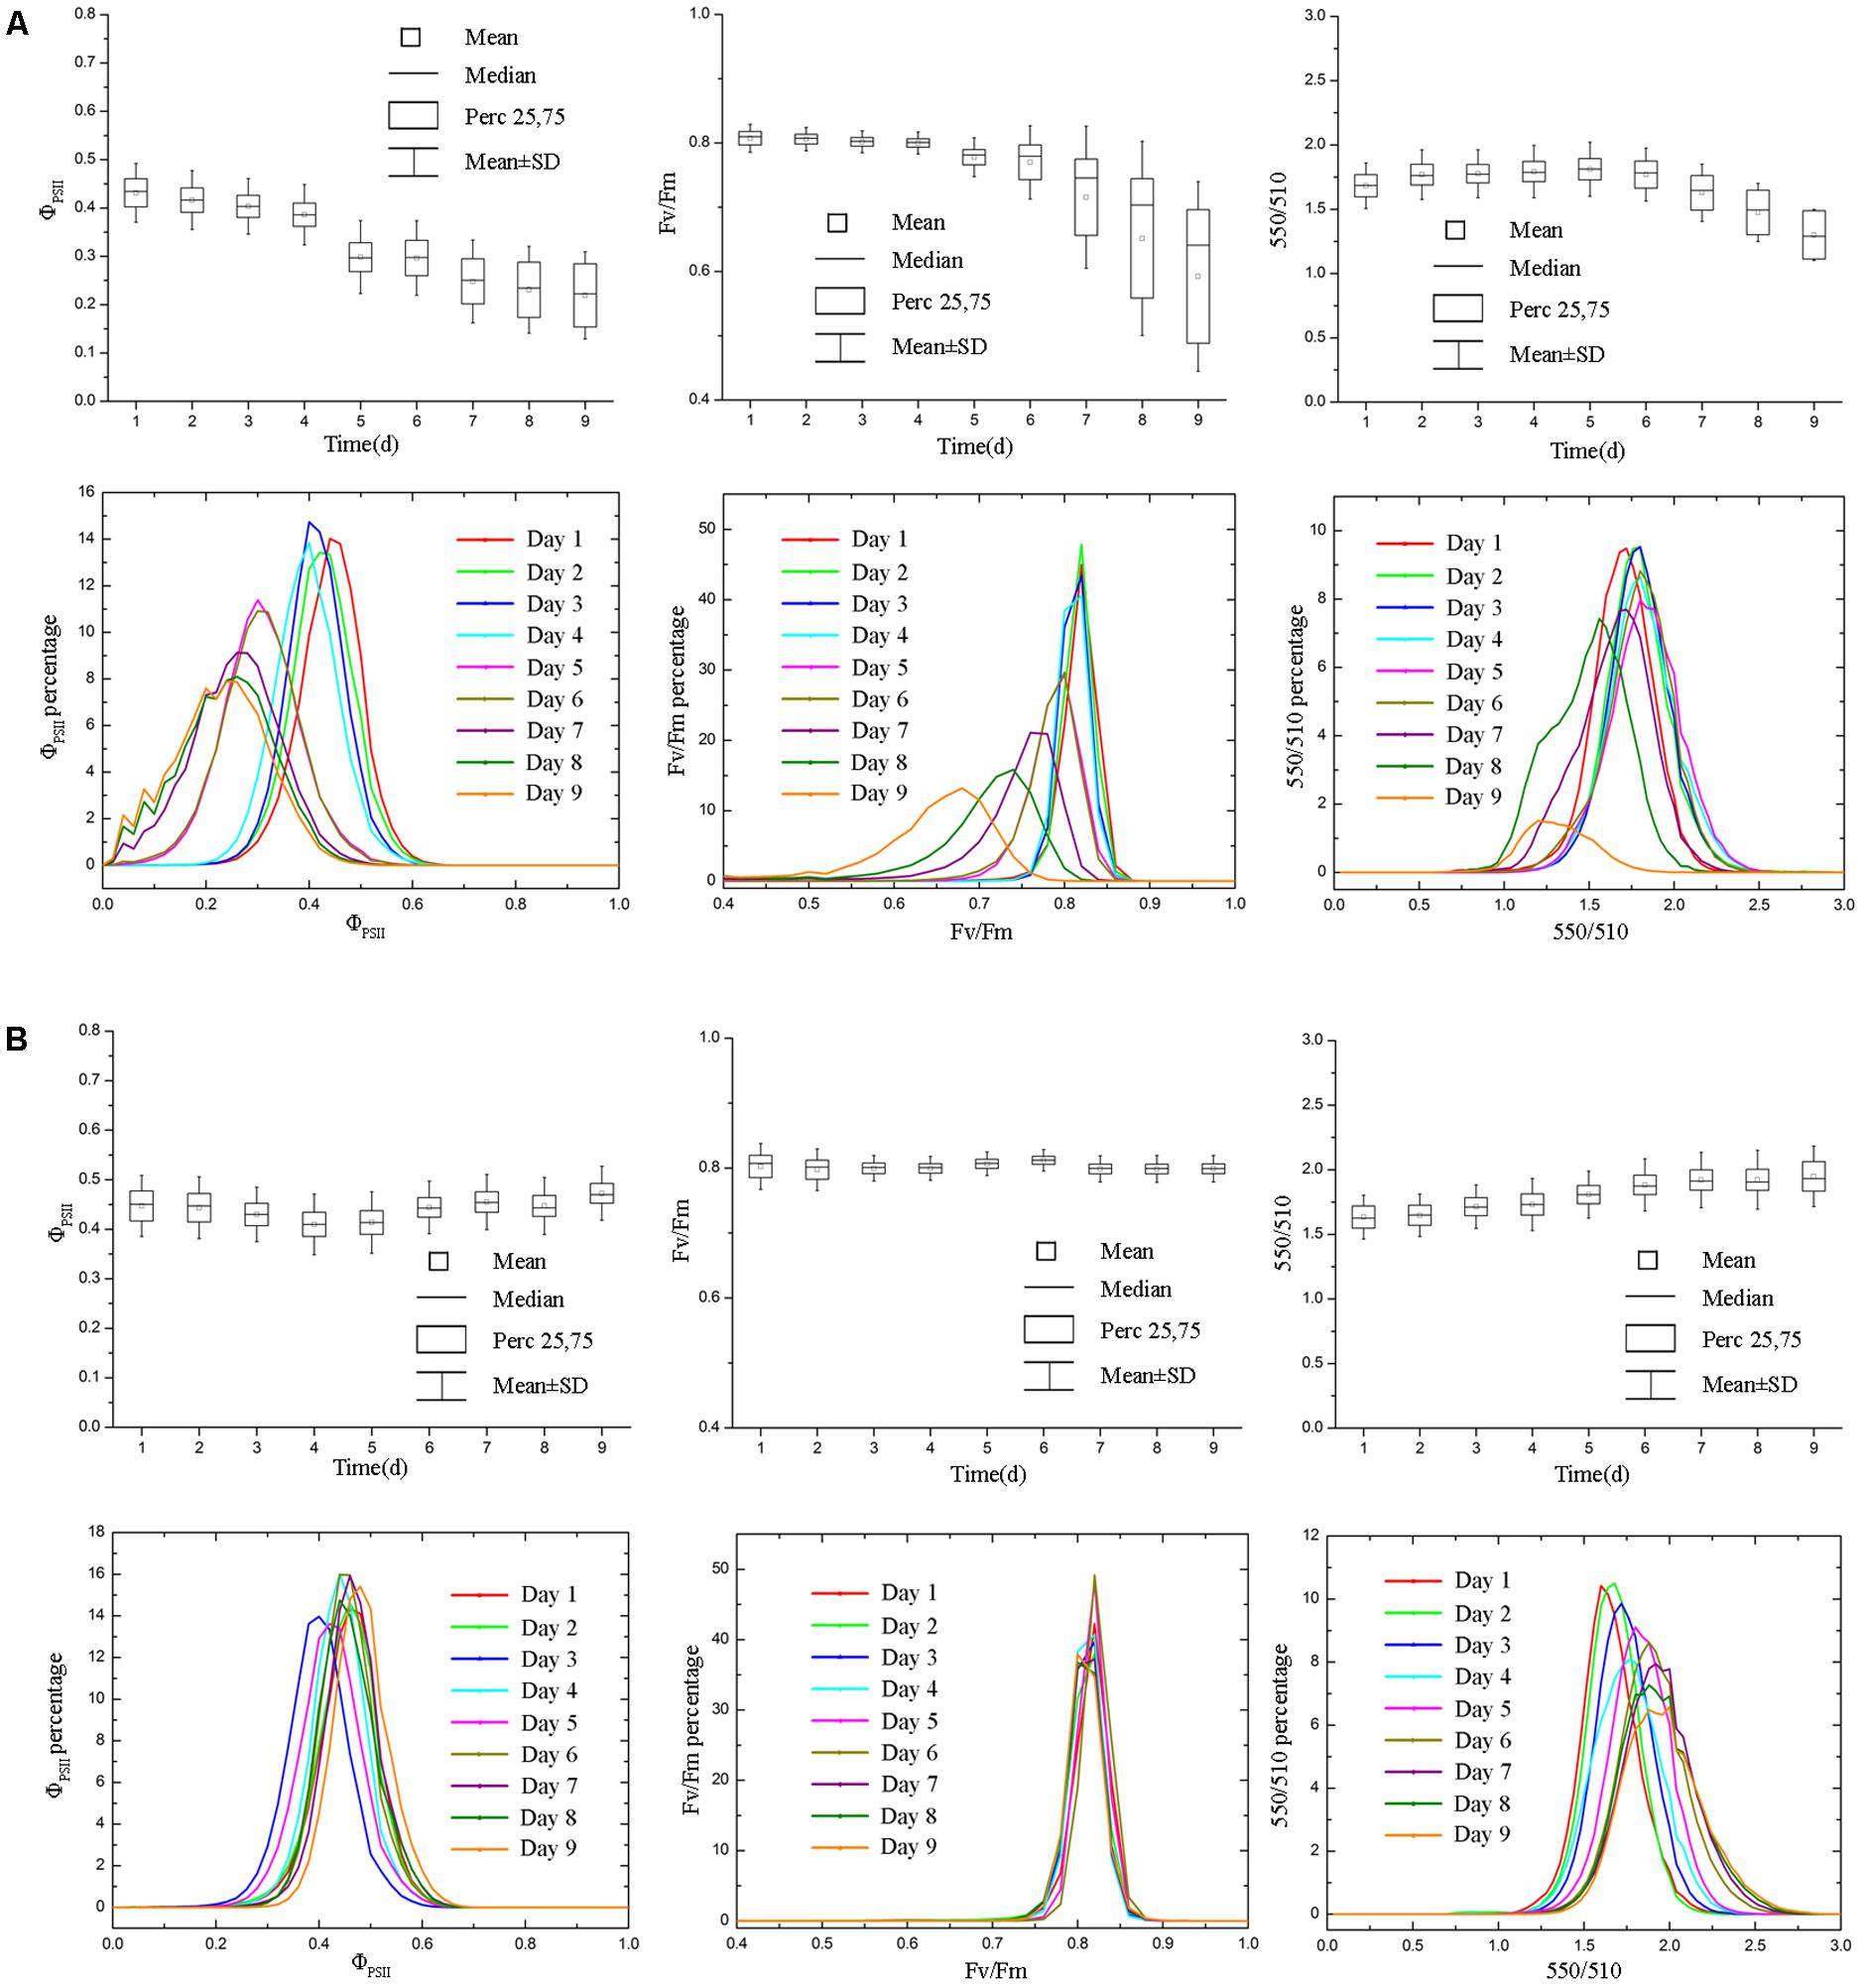
FIGURE 4. Boxplot and distribution of ΦPSII, Fv/Fm and 550/510 parameters of tomatoes under drought stress. Panel (A) and (B) represent data of drought stress and control group, respectively. ΦPSII responded more rapidly to drought stress (A), whereas Fv/Fm and 550/510 parameters showed declines in the later stage of experiment (day 7 – day 9), when the soil relative water content was quite low. For tomato plants in control group (B), ΦPSII, Fv/Fm, and 550/510 remained stable (ΦPSII and Fv/Fm) or showed the rising trend (550/510).
The Fluorescence and Spectral Characteristics of Tomato Plants Under Nutrition Deficiency Stress
From pseudo-color images of ΦPSII, Fv/Fm, and 550/510 parameters (Figure 5), we can see how nitrogen deficiency affected physiology of tomato plants (see Supplementary Figures S4, S5 for more images). As the degree of nitrogen deficiency increased, ΦPSII, Fv/Fm, and 550/510 all showed declining trend (Figure 6A). The decreases of parameters first appeared in old leaves and then spread to new leaves. This resulted in an increase in parameter standard deviation, especially for Fv/Fm. For tomato plants in the control group, ΦPSII and Fv/Fm remained around 0.4 and 0.8, respectively, and 550/510 showed a rising trend above 1.5 (Figure 6B).
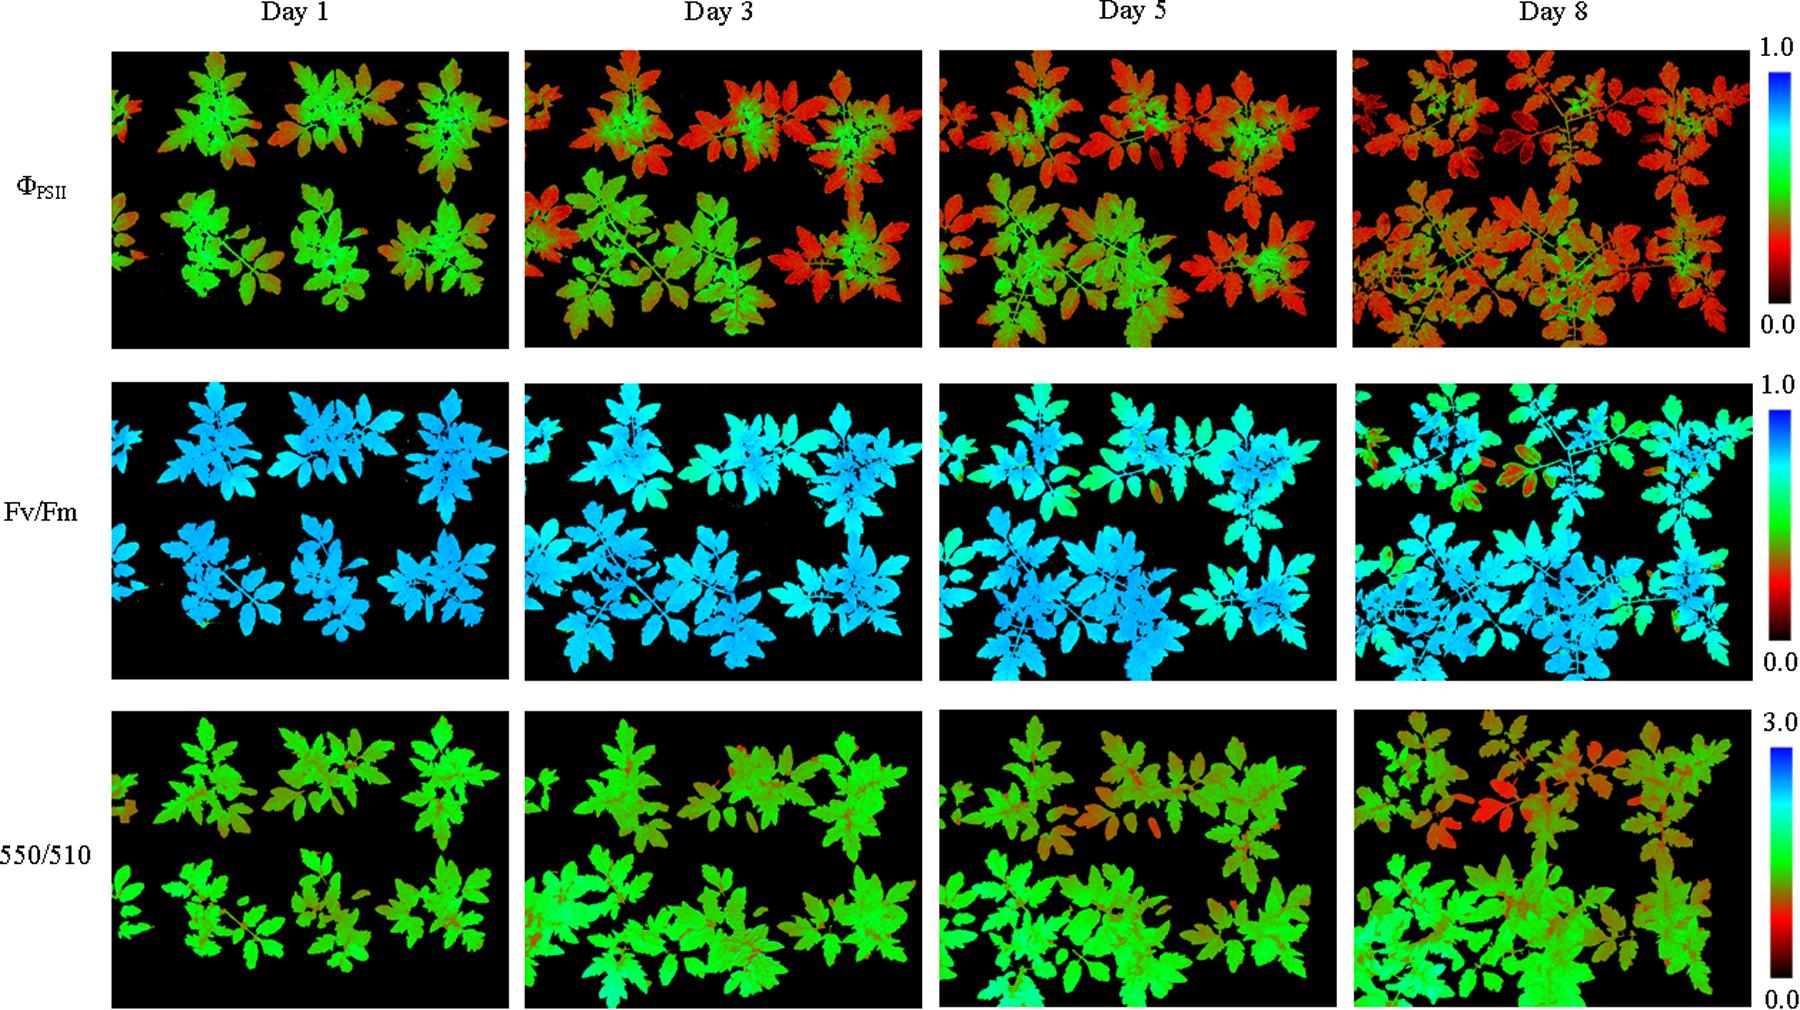
FIGURE 5. Pseudo-color images of ΦPSII, Fv/Fm and 550/510 parameters of tomato plants under nitrogen deficiency stress (see Supplementary Figure S4 for more images). Nitrogen deficiency at first caused declines of ΦPSII, Fv/Fm, and 550/510 parameters in the old leaves. As the degree of stress increased, declines of parameters showed in the new leaves.
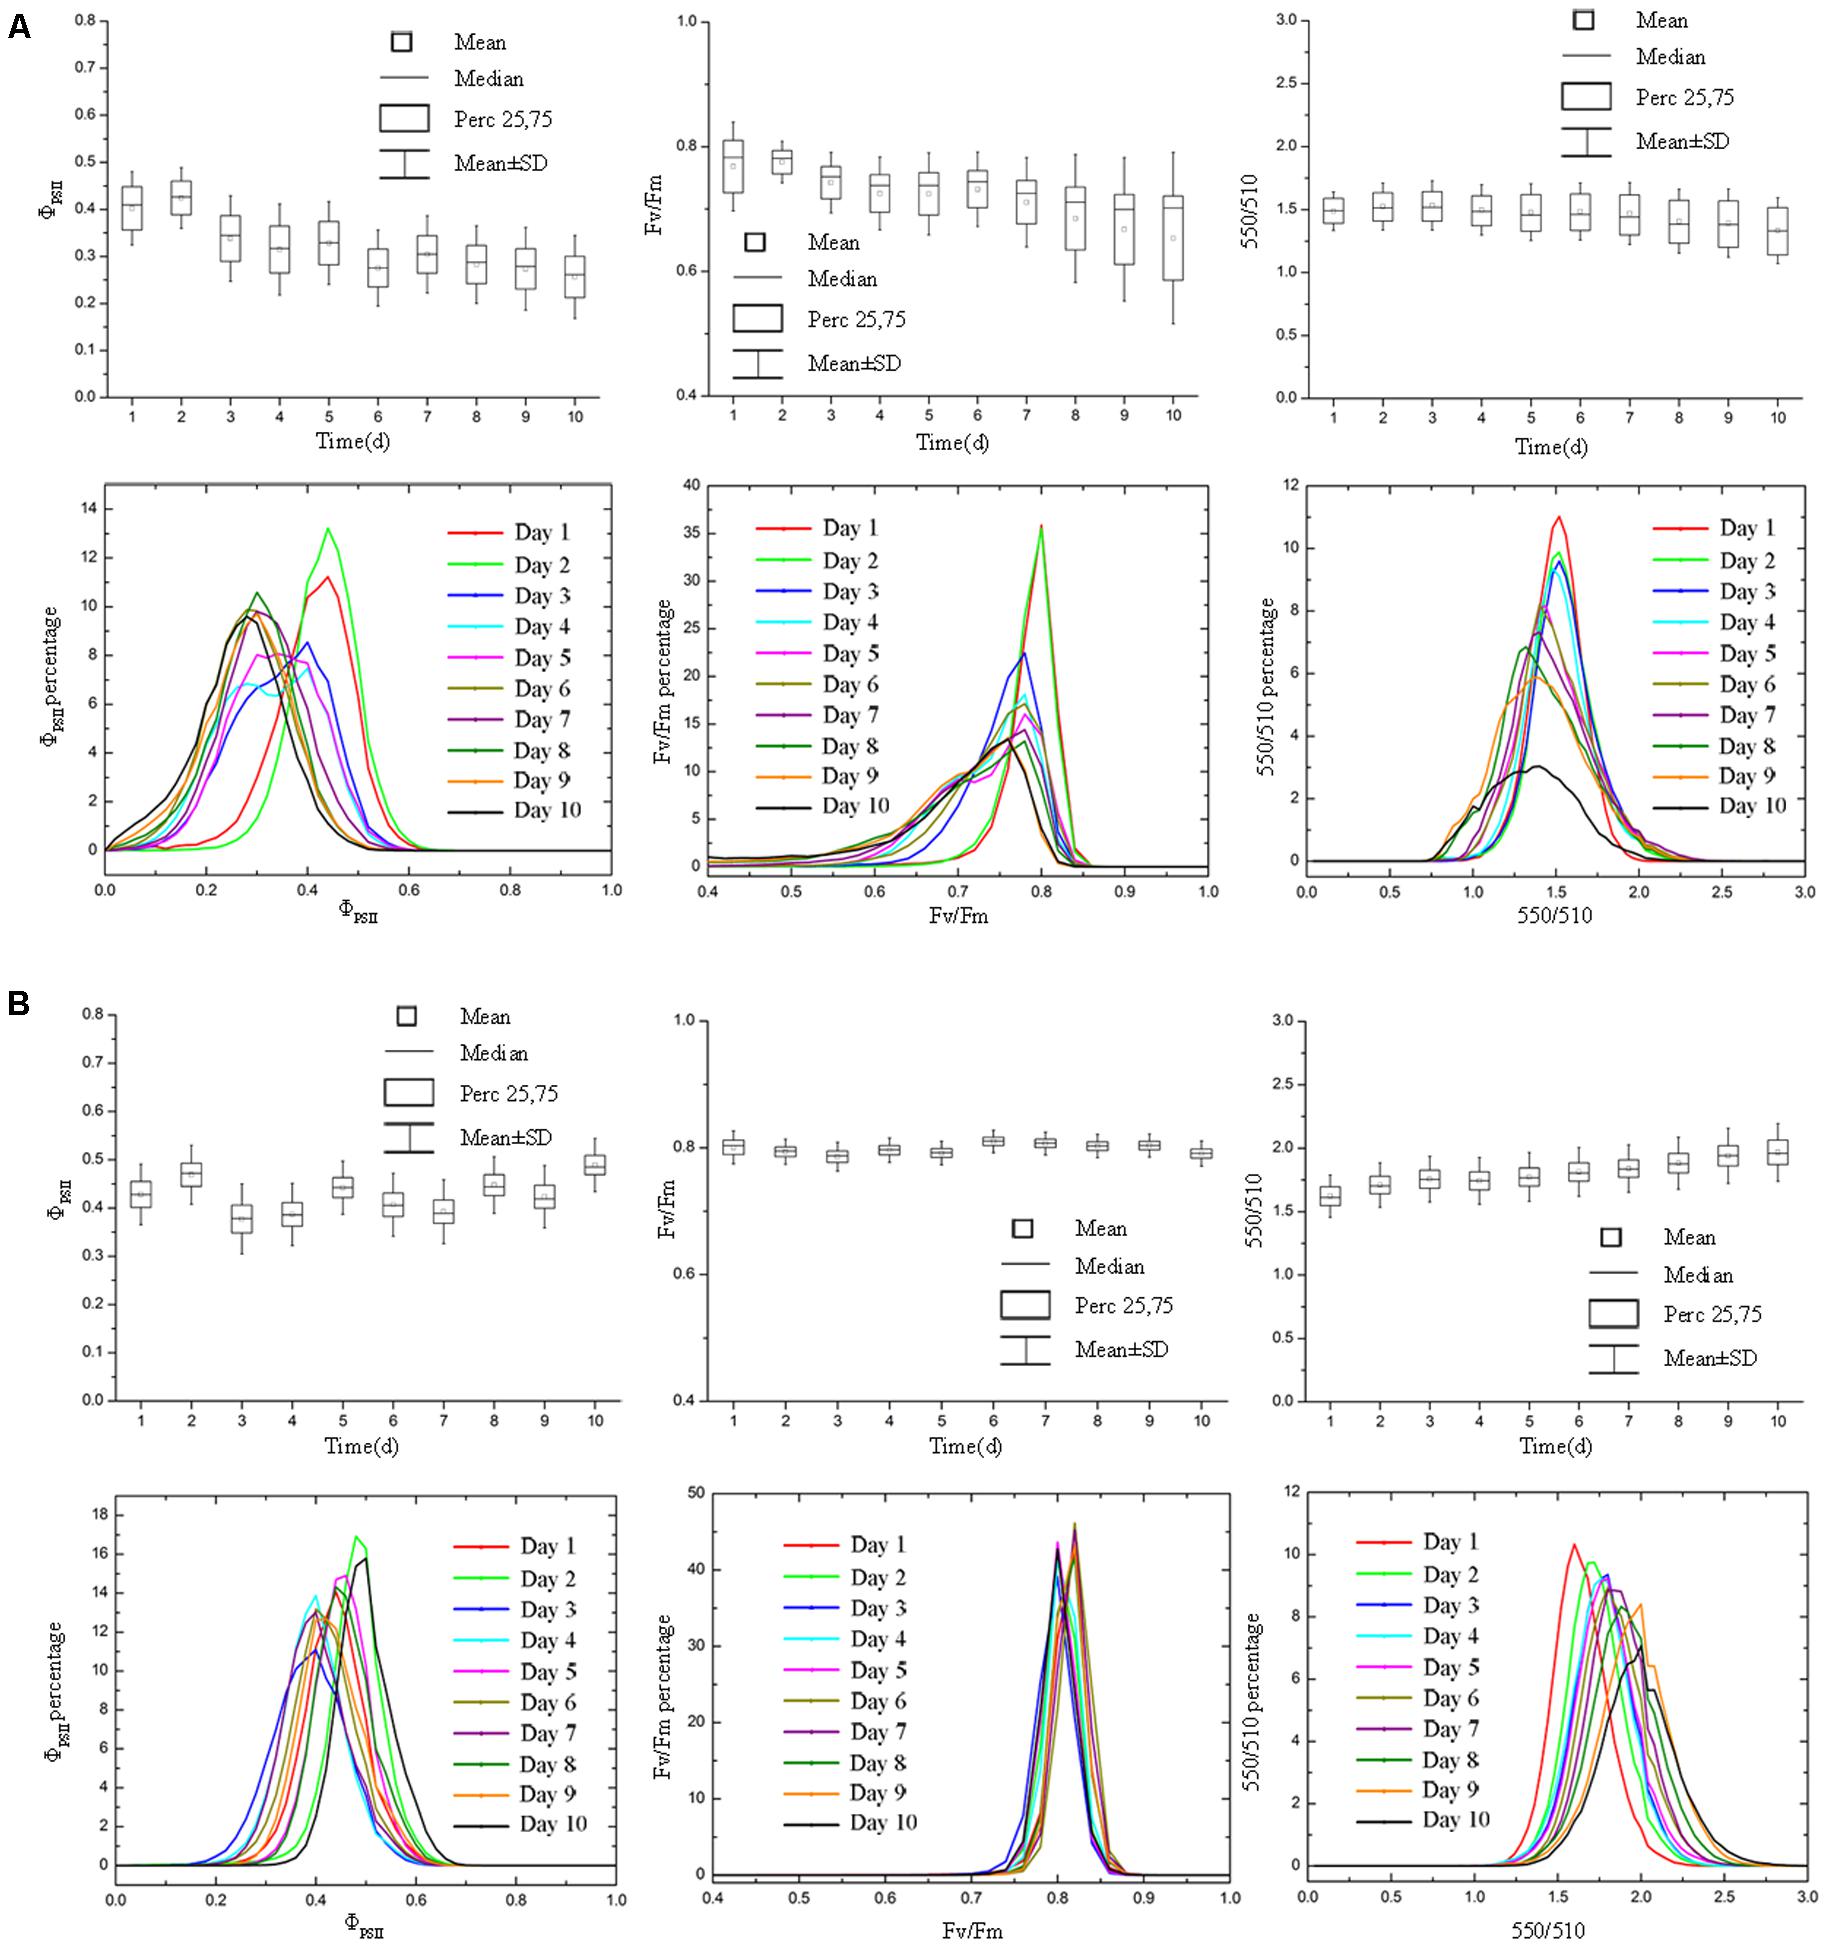
FIGURE 6. Boxplot and distribution of ΦPSII, Fv/Fm, and 550/510 parameters of tomato plants under nitrogen deficiency stress. Panel (A) and (B) represent data of nitrogen deficiency stress and control group, respectively. For tomato plants under nitrogen deficiency stress (A), ΦPSII, Fv/Fm, and 550/510 declined as the degree of nitrogen deficiency increased. The ΦPSII, Fv/Fm, and 550/510 of old and new leaves responded differentially to the nitrogen deficiency stress, leading to an increase in the parameter standard deviation, especially for Fv/Fm. For tomato plants in control group (B), ΦPSII, Fv/Fm and 550/510 remained stable (ΦPSII and Fv/Fm) or showed the rising trend (550/510).
The Fluorescence and Spectral Characteristics of Tomato Plants Under Disease Stress
From pseudo-color images of ΦPSII, Fv/Fm, and 550/510 parameters (Figure 7), we can see how B. cinerea infection affected tomato plants (see Supplementary Figure S6 for more images). As the disease symptom aggravated, ΦPSII, Fv/Fm, and 550/510 all showed significant decline (Figure 8). The decline rate is faster than that of nitrogen deficiency. The plant morphology changed a lot, as shown by the curled downward infected leaves.
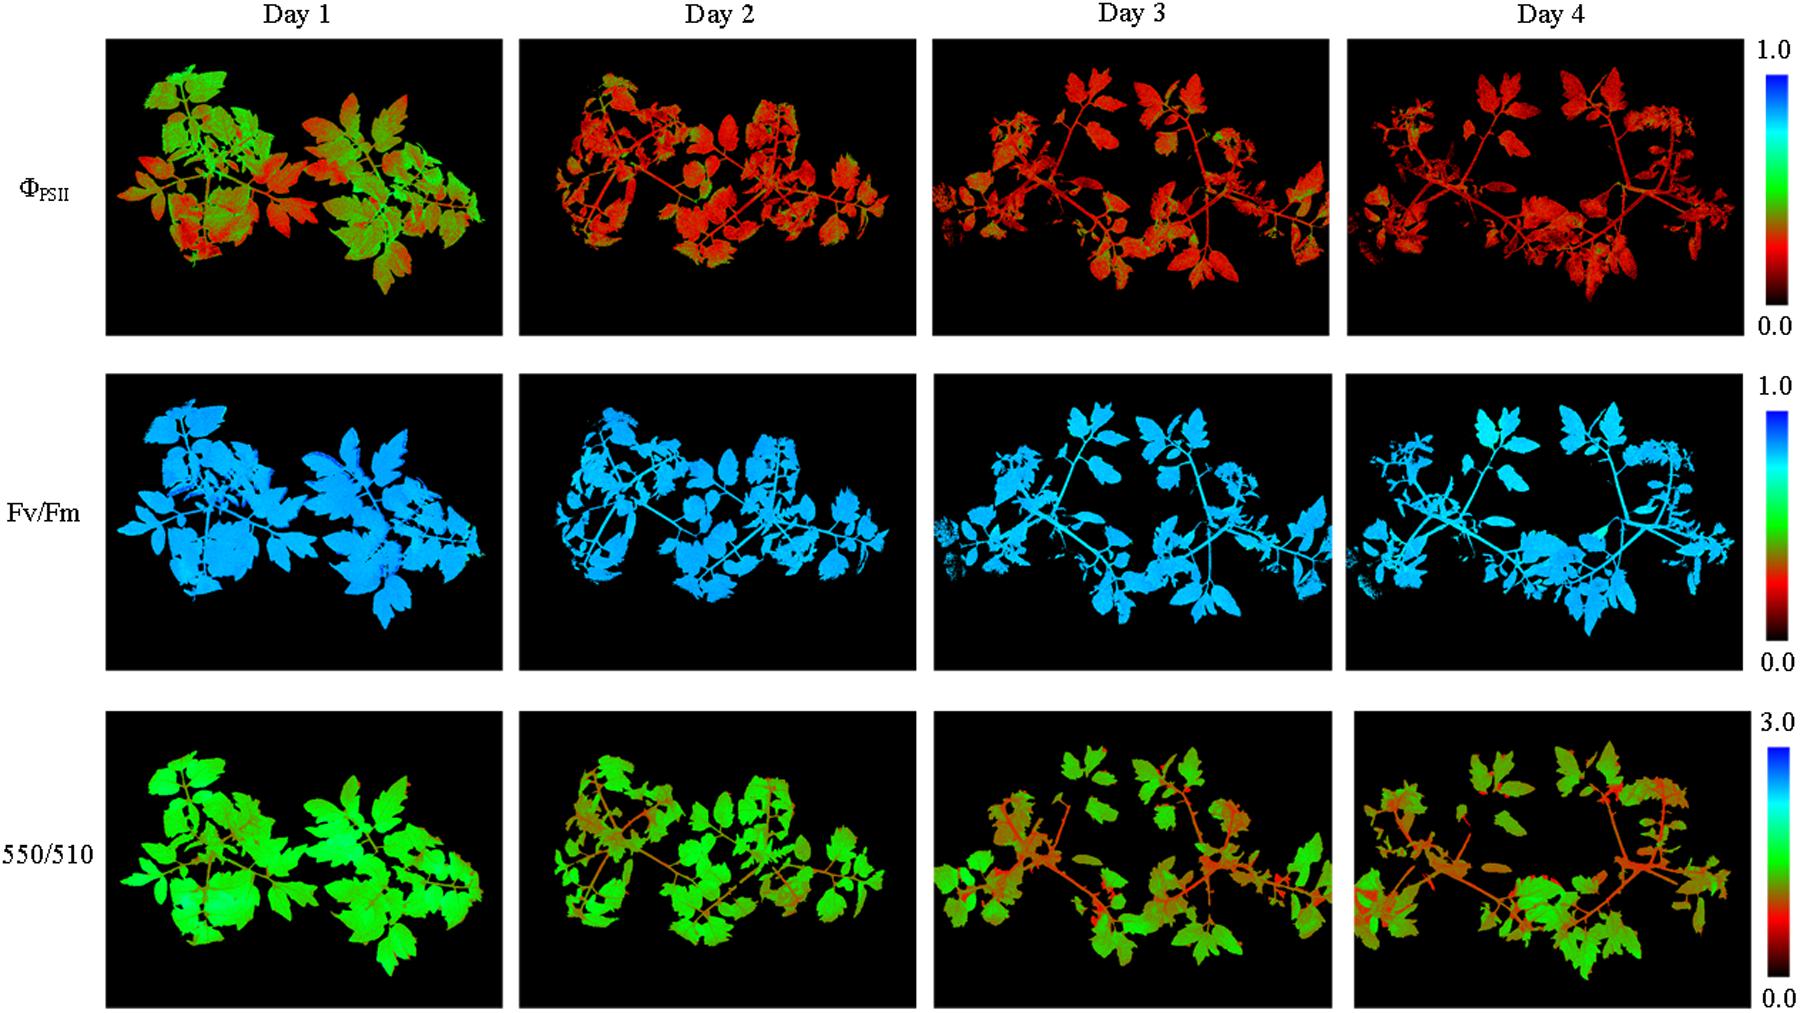
FIGURE 7. Pseudo-color images of ΦPSII, Fv/Fm, and 550/510 parameters of tomato plants infected with Botrytis cinerea. As the infection deepened, plant leaves curled downward and ΦPSII decreased most obviously.
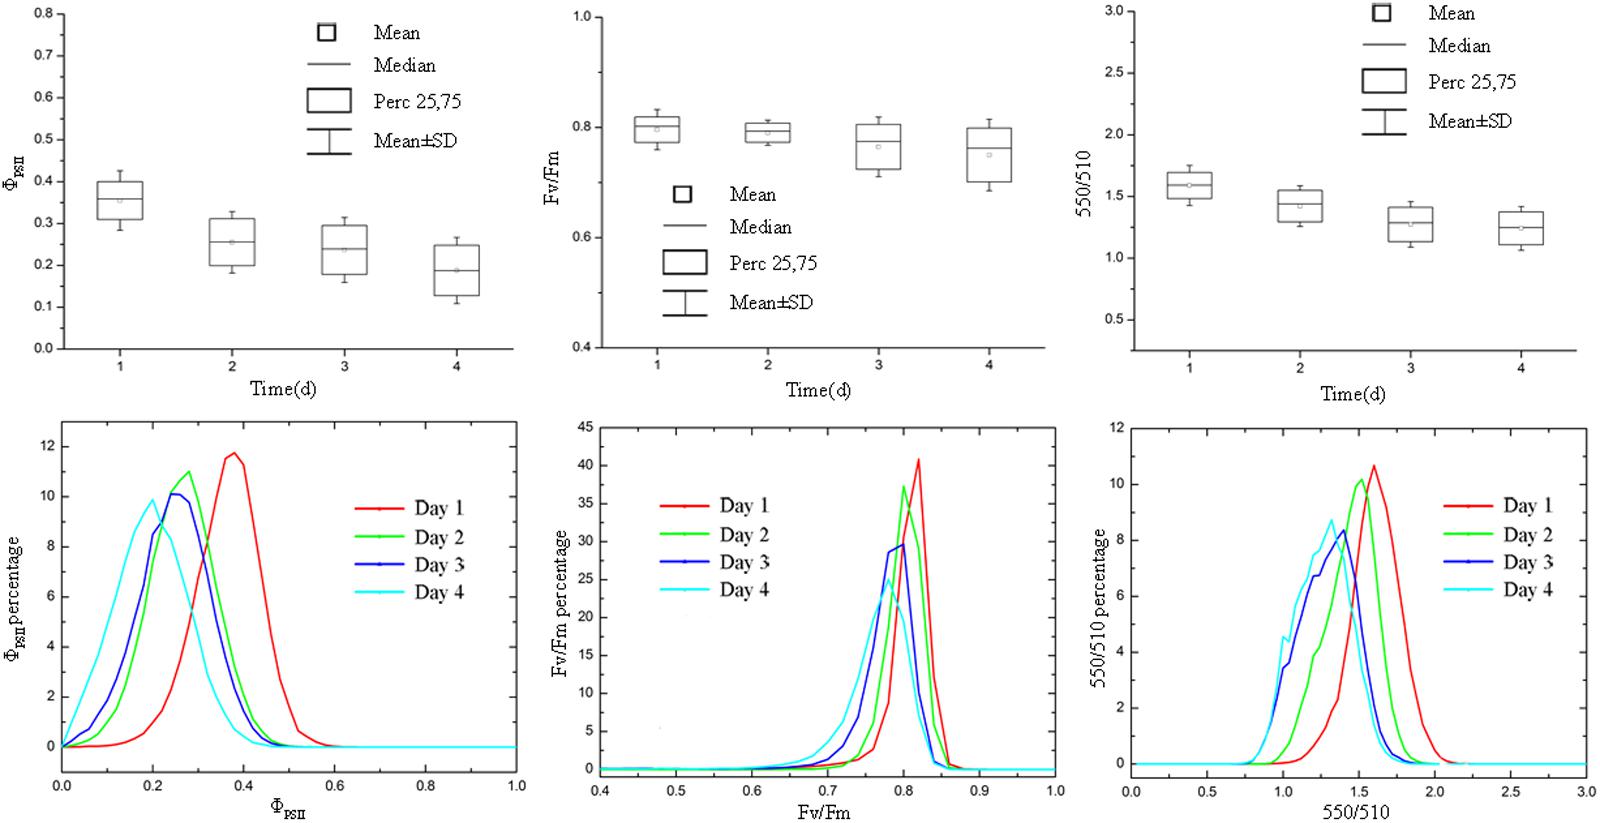
FIGURE 8. Boxplot and distribution of ΦPSII, Fv/Fm, and 550/510 parameters of tomato plants infected with B. cinerea. ΦPSII, Fv/Fm, and 550/510 declined as the disease symptom aggravated.
Correlation Between ΦPSII and Water Potential
For drought stress, both soil relative water content and ΦPSII declined steadily during the first few days. Therefore, by sampling tomato leaves in different drought degree, we studied the correlation between water potential and ΦPSII of tomato leaves (Figure 9). We can see the non-linear relationship between ΦPSII and the water potential. When the drought is not severe, ΦPSII is sensitive to the changes in water potential. ΦPSII varies from 0.43 to 0.28, when water potential is in the range of -0.5∼-1.0 MPa. Plants experiencing a threshold levels of water deficiency (water potential <-1.0 MPa) displays considerable decrease in ΦPSII. However, for leaves which have water potential -1.0 to -2.5 MPa, ΦPSII only declines from 0.28 to 0.21. This correlation between ΦPSII and water potential suggests that rapid decline of ΦPSII is a sensitive indicator of initial drought stress. As a non-invasive means of identifying the degree of drought stress, ΦPSII can be potentially used to monitor the plant growth status, especially for water saving irrigation.
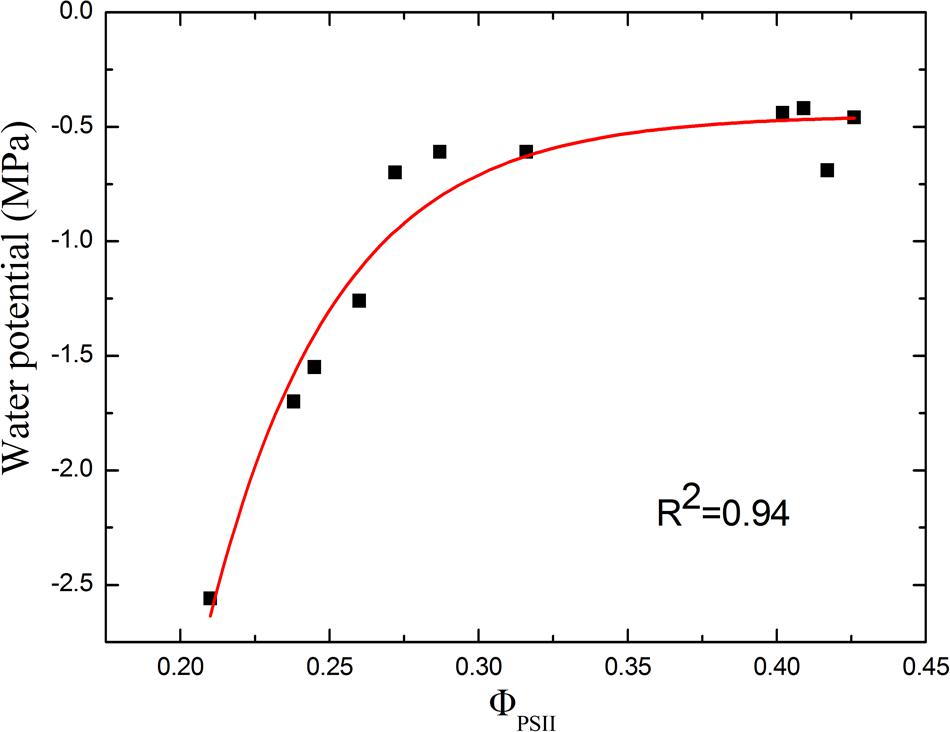
FIGURE 9. Correlation between ΦPSII and water potential of tomato leaves in response to drought stress. As the correlation curve shows, ΦPSII correlates well with the water potential in the early stage of drought stress. However, under severer drought condition, ΦPSII changes little as the water potential declines.
Correlation Between Fv/Fm and Total Nitrogen Content
When the plants suffer nutrient deficiency, both ΦPSII and Fv/Fm decline with the progression of the stress (Lu and Zhang, 2000; Damatta et al., 2002). In contrast to the early stage of drought stress, the decline of Fv/Fm is more significant in response to nutrient deficiency. The increase in standard deviation of Fv/Fm (Figure 6A) also shows Fv/Fm is representative. So, by sampling tomato leaves with different nitrogen strength treatment, we studied the correlation between Fv/Fm and total nitrogen content of tomato leaves. As shown in Figure 10, the correlation between Fv/Fm and total nitrogen content is high with a coefficient of determination of 0.85. In other words, Fv/Fm can linearly reflect the nitrogen content.
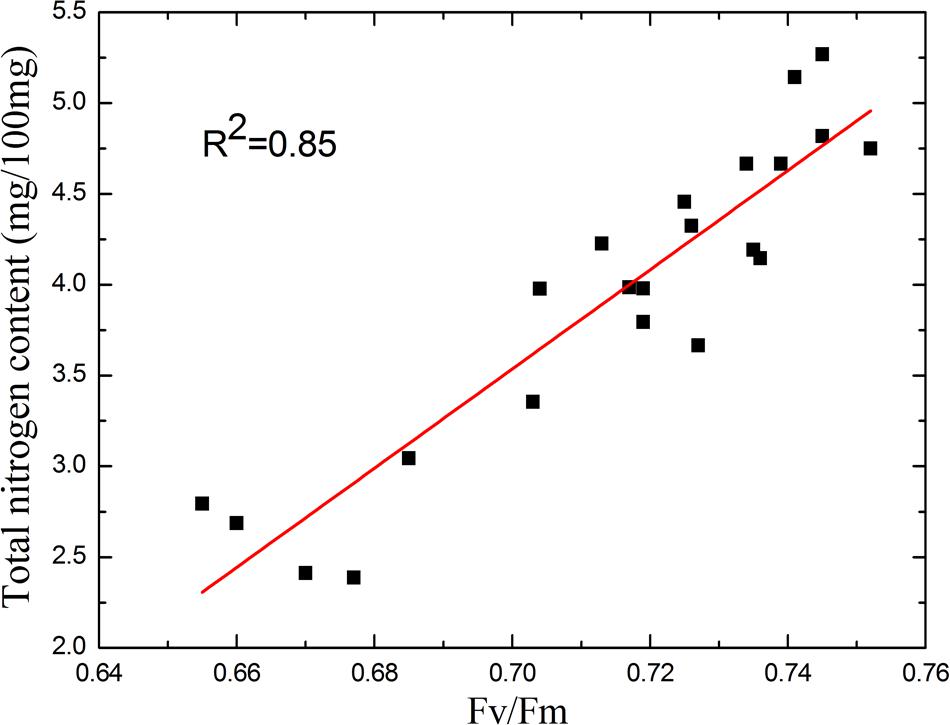
FIGURE 10. Correlation between Fv/Fm and total nitrogen content. As the correlation curve shows, Fv/Fm linearly reflects the nitrogen content. The sensitivity of Fv/Fm to the nitrogen deficiency remains as the total nitrogen content substantially decreased.
Discussion
In this paper, we introduce a newly developed crop physiology detection system and monitoring method. The main goal of our study is to provide a sensitive and non-destructive tool to continuously monitor crop physiology status in a large scale, providing the basis for selection of stress-tolerant germplasm and for related management work.
Indicators of Crop Physiology
Plant physiology diagnosis based on imaging has advantage of high visibility and large data volume. We try to analyze the images with simple point of view, and further to prepare for the machine automatic diagnosis. We choose chlorophyll fluorescence and multispectral parameters as the indicators to monitor the crop physiology status.
Drought, nitrogen deficiency and disease are the three types of crop stress frequently occur in agriculture. At least three indicators are required to characterize the stresses. Chlorophyll fluorescence parameters ΦPSII and Fv/Fm are sensitive to the plant physiology and are widely used. We choose them as two indicators, and we choose the third indicator from multispectral images. In traditional measurement of multispectral parameters, absolute reflectivity is often used and the calibration board is necessary. However, the use of calibration board is not convenient for the system structure and large area measurement. Thus, relative reflectance between different wavelengths has been used in this study. The ratio change of different spectral composition can reflect the change of leaf chroma caused by the composition of the leaves. Meanwhile, the use of relative reflectance decreases the requirement of the light source for spatial domain uniformity.
By comparing with the control groups, we can identify the threshold of stressful conditions. ΦPSII is sensitive to plant physiological conditions, and has fluctuation even in the control group. Under lighting condition of 200 μmol m-2 s-1 photosynthetic photon flux density, the normal range of ΦPSII should be around 0.4. When ΦPSII decreases close to 0.3, the plants may be in some stressed conditions. The fluctuation of Fv/Fm is relative small and the normal range of Fv/Fm should be around 0.8. When Fv/Fm decreases below 0.75, PSII reaction center has been affected. For 550/510, it increases with the accumulation of chlorophyll. The normal range of 550/510 should be above 1.5.
Distinct Fluorescence and Spectral Characteristics Induced by Different Stresses
We found that different types of stresses can induce distinct changes of chlorophyll fluorescence and multispectral signals, which can be used as indicators of plant physiology. For the drought stress, stomatal closure results in the decline of photosynthetic rate and the decrease in ΦPSII. ΦPSII is proportional to the carbon assimilation rate. In general, ΦPSII decreases in response to different stresses (Baker, 2008). Drought stress does not affect Fv/Fm sharply when the plants are not in extreme drought condition (Giardi et al., 1996; Woo et al., 2008). A long-term drought stress will cause a decrease in Fv/Fm, potentially due to a secondary nutrient stress. Therefore, ΦPSII can show the early warning of drought, and we use ΦPSII to evaluate the degree of drought stress.
Fv/Fm was commonly used for assessing plant performance under stress (Bresson et al., 2015; Awlia et al., 2016). Nitrogen deficiency affects PSII photochemistry and decreases the quantum yield of PSII electron transport. The decline of Fv/Fm is mainly due to the decrease of the maximal fluorescence Fm (Lu and Zhang, 2000). The photoinhibition caused by nitrogen deficiency is associated with the inactivation of PSII reaction centers. In addition, nitrogen deficiency induced a significant decrease in CO2 assimilation capacity. CO2 assimilation acts as a major sink for the reducing equivalents (ATP and NADPH) generated by the primary photochemical reactions.
Relative reflectance is also an index reflecting different stresses. Several indices have been used for estimating chlorophyll or nitrogen content (Yendrek et al., 2017). For plants exposed to nitrogen deficiency, the synthesis of chlorophyll is hindered, resulting in the change of leaf spectral distribution (Kuckenberg et al., 2009; Bürling et al., 2011). We use relative reflectance 550/510 to represent the change of leaf chroma. As nitrogen content decreases, the inhibition of chlorophyll synthesis will cause decline of relative reflectance 550/510 (Figures 5, 6A). However, during the early stage of drought stress, the inhibition of chlorophyll synthesis will not be obvious and the relative reflectance 550/510 will not decline (Figure 4A). The different changing pattern of 550/510 values under nitrogen deficiency as compared to other stresses can be used to identify the occurrence of nitrogen deficiency.
Pathogens acquire nutrient through interfering the plant metabolism, resulting in similar changes in chlorophyll fluorescence and multispectral signals as the nitrogen deficiency (Rolfe and Scholes, 2010; Ivanov and Bernards, 2016). However, the development rate of pathogen infection is fast, and plant leaves will curl downwards. To distinguish these two stresses, the analysis based on images should not be ignored (Garciaruiz et al., 2013; Wetterich et al., 2016).
Attention About the Monitoring Method
Statistics analysis about the indicator images can be carried out for drought and nitrogen deficiency stress. However, plant disease has the characteristic of sudden incidence and heterogeneity of infection area. Statistics may cover the disease/healthy area. Thus, analysis based on images should not be ignored. On the other hand, overall growth condition of the crop is more important in practical agricultural production. If the infection area is small and local, that means the disease doesn’t affect the crop broadly yet. Before the disease is spreading out, effective management should be taken.
There are also some other possibilities that affect the plant photosynthesis. In the process of agriculture production, apart from the ΦPSII decrease caused by drought stress, another common stress is temperature fluctuation. This will cause interference to the judgment of plant physiology. However, in practice the temperature factor can be excluded by temperature recording.
Conclusion
We built a high throughput crop physiology monitoring method based on chlorophyll fluorescence and multispectral imaging in this study. This system can distinguish typical crop stresses such as drought, nutrition deficiency and plant disease in a simple way. Meanwhile we have studied the correlation between the physiological indicators and the stresses, which makes the degree of stress can be estimated. This method can provide basis for crop management, and furthermore provide possibility of automatic machine diagnosis.
Author Contributions
HL, XX, LD, JY, and XL contrived the study. HW, SX, and LX built the monitoring system. HW, XQ, LZ, and SX performed the experiments. HW and SX analyzed the data. HW, LZ, and XX interpreted the results. HW and LZ wrote the manuscript. HL and XX made revisions.
Funding
This work was supported by the National High Technology Research, Development Program of China (863 Program) (Grant No. 2012AA10A503).
Conflict of Interest Statement
The authors declare that the research was conducted in the absence of any commercial or financial relationships that could be construed as a potential conflict of interest.
Supplementary Material
The Supplementary Material for this article can be found online at: https://www.frontiersin.org/articles/10.3389/fpls.2018.00407/full#supplementary-material
FIGURE S1 | The physiology monitoring system with chlorophyll fluorescence module and multispectral module (A,B) and the scene when the system is working (C).
FIGURE S2 | ΦPSII, Fv/Fm, and 550/510 pseudo color images and photos of tomatoes under drought stress.
FIGURE S3 | ΦPSII, Fv/Fm, and 550/510 pseudo color images and photos of tomatoes in drought stress control group.
FIGURE S4 | ΦPSII, Fv/Fm, and 550/510 pseudo color images and photos of tomatoes under nitrogen deficiency stress.
FIGURE S5 | ΦPSII, Fv/Fm, and 550/510 pseudo color images and photos of tomatoes in nitrogen deficiency stress control group.
FIGURE S6 | ΦPSII, Fv/Fm, and 550/510 pseudo color images and photos of tomatoes infected with Botrytis cinerea.
Footnotes
References
Alston, J. M., Beddow, J. M., and Pardey, P. G. (2009). Agricultural research, productivity, and food prices in the long run. Science 325, 1209–1210. doi: 10.1126/science.1170451
Andrade-Sanchez, P., Gore, M. A., Heun, J. T., Thorp, K. R., Carmo-Silva, A. E., French, A. N., et al. (2014). Development and evaluation of a field-based high-throughput phenotyping platform. Funct. Plant Biol. 41, 68–79. doi: 10.1071/FP13126
Awlia, M., Nigro, A., Fajkus, J., Schmoeckel, S. M., Negrão, S., Santelia, D., et al. (2016). High-throughput non-destructive phenotyping of traits that contribute to salinity tolerance in Arabidopsis thaliana. Front. Plant Sci. 7:1414. doi: 10.3389/fpls.2016.01414
Baker, N. R. (2008). Chlorophyll fluorescence: a probe of photosynthesis in vivo. Annu. Rev. Plant Biol. 59, 89–113. doi: 10.1146/annurev.arplant.59.032607.092759
Baker, N. R., and Rosenqvist, E. (2004). Applications of chlorophyll fluorescence can improve crop production strategies: an examination of future possibilities. J. Exp. Bot. 55, 1607–1621. doi: 10.1093/jxb/erh196
Barbagallo, R. P., Oxborough, K., Pallett, K. E., and Baker, N. R. (2003). Rapid, noninvasive screening for perturbations of metabolism and plant growth using chlorophyll fluorescence imaging. Plant Physiol. 132, 485–493. doi: 10.1104/pp.102.018093
Bauriegel, E., Giebel, A., Geyer, M., Schmidt, U., and Herppich, W. B. (2011). Early detection of fusarium, infection in wheat using hyper-spectral imaging. Comput. Electr. Agric. 75, 304–312. doi: 10.1016/j.compag.2010.12.006
Begg, J. E., and Turner, N. C. (1970). Water potential gradient in field tobacco. Plant Physiol. 46, 343–346. doi: 10.1104/pp.46.2.343
Berger, B., Parent, B., and Tester, M. (2010). High-throughput shoot imaging to study drought responses. J. Exp. Bot. 61, 3519–3528. doi: 10.1093/jxb/erq201
Born, N., Behringer, D., Liepelt, S., Beyer, S., Schwerdtfeger, M., Ziegenhagen, B., et al. (2014). Monitoring plant drought stress response using terahertz time-domain spectroscopy. Plant Physiol. 164, 1571–1577. doi: 10.1104/pp.113.233601
Bresson, J., Vasseur, F., Dauzat, M., Koch, G., Granier, C., and Vile, D. (2015). Quantifying spatial heterogeneity of chlorophyll fluorescence during plant growth and in response to water stress. Plant Methods 11:23. doi: 10.1186/s13007-015-0067-5
Bürling, K., Hunsche, M., and Noga, G. (2011). Use of blue-green and chlorophyll fluorescence measurements for differentiation between nitrogen deficiency and pathogen infection in winter wheat. J. Plant Physiol. 168, 1641–1648. doi: 10.1016/j.jplph.2011.03.016
Chaerle, L., Hagenbeek, D., Vanrobaeys, X., and van der Straeten, D. (2007a). Early detection of nutrient and biotic stress in Phaseolus vulgaris. Int. J. Remote Sens. 28, 3479–3492. doi: 10.1080/01431160601024259
Chaerle, L., Leinonen, I., Jones, H. G., and van der Straeten, D. (2007b). Monitoring and screening plant populations with combined thermal and chlorophyll fluorescence imaging. J. Exp. Bot. 58, 773–784.
Chaerle, L., Lenk, S., and Hagenbeek, D. (2007c). Multicolor fluorescence imaging for early detection of the hypersensitive reaction to tobacco mosaic virus. J. Plant Physiol. 164, 253–262.
Damatta, F. M., Loos, R. A., Silva, E. A., and Loureiro, M. E. (2002). Limitations to photosynthesis inas a result of nitrogen and water availability. J. Plant Physiol. 159, 975–981. doi: 10.1078/0176-1617-00807
Dammer, K. H., Möller, B., Rodemann, B., and Heppner, D. (2011). Detection of head blight (Fusarium, ssp.) in winter wheat by color and multispectral image analyses. Crop Prot. 30, 420–428. doi: 10.1016/j.cropro.2010.12.015
Diacono, M., Rubino, P., and Montemurro, F. (2013). Precision nitrogen management of wheat. A review. Agron. Sustain. Dev. 33, 219–241. doi: 10.1007/s13593-012-0111-z
Garciaruiz, F., Sankaran, S., Maja, J. M., Lee, W. S., Rasmussen, J., and Ehsani, R. (2013). Comparison of two aerial imaging platforms for identification of huanglongbing-infected citrus trees. Comput. Electron. Agric. 91, 106–115. doi: 10.1016/j.compag.2012.12.002
Giardi, M. T., Cona, A., Geiken, B., Kučera, T., Masojídek, J., and Mattoo, A. K. (1996). Long-term drought stress induces structural and functional reorganization of photosystem II. Planta 199, 118–125. doi: 10.1007/BF00196888
Godfray, H. C., Beddington, J. R., Crute, I. R., Haddad, L., Lawrence, D., Muir, J. F., et al. (2010). Food security: the challenge of feeding 9 billion people. Science 327, 812–818. doi: 10.1126/science.1185383
Govindje, E. (1995). Sixty-three years since kautsky: chlorophyll a fluorescence. Funct. Plant Biol. 22, 131–160.
Hoagland, D. R. (1950). The water-culture method for growing plants without soil. Calif. Agric. Exp. Stn. Circ. 347, 357–359.
Huang, W., Li, J., Wang, Q., and Chen, L. (2015). Development of a multispectral imaging system for online detection of bruises on apples. J. Food Eng. 146, 62–71. doi: 10.1016/j.jfoodeng.2014.09.002
Ivanov, D. A., and Bernards, M. A. (2016). Chlorophyll fluorescence imaging as a tool to monitor the progress of a root pathogen in a perennial plant. Planta 243, 263–279. doi: 10.1007/s00425-015-2427-9
Kalaji, H. M., Goltsev, V., Bosa, K., Allakhverdiev, S. I., Strasser, R. J., and Govindjee. (2012). Experimental in vivo measurements of light emission in plants: a perspective dedicated to David Walker. Photosynth. Res. 114, 69–96. doi: 10.1007/s11120-012-9780-3
Kaukoranta, T., Murto, J., Takala, J., and Tahvonen, R. (2005). Detection of water deficiency in greenhouse cucumber by infrared thermography and reference surfaces. Sci. Hortic. 106, 447–463. doi: 10.1016/j.scienta.2005.02.026
Klukas, C., Chen, D., and Pape, J. M. (2014). Integrated analysis platform: an open-source information system for high-throughput plant phenotyping. Plant Physiol. 165, 506–518. doi: 10.1104/pp.113.233932
Kuckenberg, J., Tartachnyk, I., and Noga, G. (2009). Detection and differentiation of nitrogen-deficiency, powdery mildew and leaf rust at wheat leaf and canopy level by laser-induced chlorophyll fluorescence. Biosyst. Eng. 103, 121–128. doi: 10.1016/j.biosystemseng.2008.09.018
Laliberte, A. S., Goforth, M. A., Steele, C. M., and Rango, A. (2011). Multispectral remote sensing from unmanned aircraft: image processing workflows and applications for rangeland environments. Remote Sens. 3, 2529–2551. doi: 10.3390/rs3112529
Lenk, S., Chaerle, L., Pfündel, E. E., Langsdorf, G., Hagenbeek, D., Lichtenthaler, H. K., et al. (2007). Multispectral fluorescence and reflectance imaging at the leaf level and its possible applications. J. Exp. Bot. 58, 807–814. doi: 10.1093/jxb/erl207
Lichtenthaler, H. K., and Babani, F. (2000). Detection of photosynthetic activity and water stress by imaging the red chlorophyll fluorescence. Plant Physiol. Biochem. 38, 889–895. doi: 10.1016/S0981-9428(00)01199-2
Lu, C., and Zhang, J. (2000). Photosynthetic co(2) assimilation, chlorophyll fluorescence and photoinhibition as affected by nitrogen deficiency in maize plants. Plant Sci. 151, 135–143. doi: 10.1016/S0168-9452(99)00207-1
Lucchese, L., and Mitra, S. K. (2001). Color image segmentation: a state-of-the-art survey. Eng. Comput. 12, 1–15.
Macqueen, J. (1965). “Some methods for classification and analysis of multivariate observations,” in Proceedings of Berkeley Symposium on Mathematical Statistics and Probability, Vol. 1, (Berkeley: University of California Press), 281–297.
Murchie, E. H., and Lawson, T. (2013). Chlorophyll fluorescence analysis: a guide to good practice and understanding some new applications. J. Exp. Bot. 64, 3983–3998. doi: 10.1093/jxb/ert208
Nedbal, L., Soukupová, J., Kaftan, D., Whitmarsh, J., and Trtílek, M. (2000). Kinetic imaging of chlorophyll fluorescence using modulated light. Photosynth. Res. 66, 3–12. doi: 10.1023/A:1010729821876
Oxborough, K., and Baker, N. R. (1997). An instrument capable of imaging chlorophyll a fluorescence from intact leaves at very low irradiance and at cellular and subcellular levels of organization. Plant Cell Environ. 20, 1473–1483. doi: 10.1046/j.1365-3040.1997.d01-42.x
Porcarcastell, A., Pfündel, E., Korhonen, J. F., and Juurola, E. (2008). A new monitoring pam fluorometer (moni-pam) to study the short- and long-term acclimation of photosystem ii in field conditions. Photosynth. Res. 96, 173–179. doi: 10.1007/s11120-008-9292-3
Rolfe, S. A., and Scholes, J. D. (2010). Chlorophyll fluorescence imaging of plant–pathogen interactions. Protoplasma 247, 163–175. doi: 10.1007/s00709-010-0203-z
Sankaran, S., Khot, L. R., Espinoza, C. Z., Jarolmasjed, S., Sathuvalli, V. R., Vandemark, G. J., et al. (2015). Low-altitude, high-resolution aerial imaging systems for row and field crop phenotyping: a review. Eur. J. Agron. 70, 112–123. doi: 10.1016/j.eja.2015.07.004
Stafford, J. V. (2000). Implementing precision agriculture in the 21st century. J. Agric. Eng. Res. 76, 267–275. doi: 10.1006/jaer.2000.0577
Stirbet, A., and Govindjee. (2011). On the relation between the Kautsky effect (chlorophyll a fluorescence induction) and photosystem II: basics and applications of the OJIP fluorescence transient. J. Photochem. Photobiol. B Biol. 104, 236–257. doi: 10.1016/j.jphotobiol.2010.12.010
Virlet, N., Lebourgeois, V., Martinez, S., Costes, E., Labbé, S., and Regnard, J. L. (2014). Stress indicators based on airborne thermal imagery for field phenotyping a heterogeneous tree population for response to water constraints. J. Exp. Bot. 65, 5429–5442. doi: 10.1093/jxb/eru309
Wetterich, C. B., Felipe de Oliveira Neves, R., Belasque, J., and Marcassa, L. G. (2016). Detection of citrus canker and huanglongbing using fluorescence imaging spectroscopy and support vector machine technique. Appl. Opt. 55, 400–407. doi: 10.1364/AO.55.000400
White, J. W., Andrade-sanchez, P., Gore, M. A., Bronson, K. F., Coffelt, T. A., Matthew, M., et al. (2012). Field-based phenomics for plant genetics research. Field Crops Res. 133, 101–112. doi: 10.1016/j.fcr.2012.04.003
Woo, N. S., Badger, M. R., and Pogson, B. J. (2008). A rapid, non-invasive procedure for quantitative assessment of drought survival using chlorophyll fluorescence. Plant Methods 4:27. doi: 10.1186/1746-4811-4-27
Yendrek, C. R., Tomaz, T., Montes, C. M., Cao, Y., Morse, A. M., Brown, P. J., et al. (2017). High-throughput phenotyping of maize leaf physiological and biochemical traits using hyperspectral reflectance. Plant Physiol. 173, 614–626. doi: 10.1104/pp.16.01447
Zarco-Tejada, P. J., Berni, J. A. J., Suárez, L., Sepulcre-Cantó, G., Morales, F., and Miller, J. R. (2009). Imaging chlorophyll fluorescence with an airborne narrow-band multispectral camera for vegetation stress detection. Remote Sens. Environ. 113, 1262–1275. doi: 10.1016/j.rse.2009.02.016
Keywords: chlorophyll fluorescence imaging, multispectral imaging, high throughput, crop physiology, drought, nutrition deficiency, plant disease, monitoring system
Citation: Wang H, Qian X, Zhang L, Xu S, Li H, Xia X, Dai L, Xu L, Yu J and Liu X (2018) A Method of High Throughput Monitoring Crop Physiology Using Chlorophyll Fluorescence and Multispectral Imaging. Front. Plant Sci. 9:407. doi: 10.3389/fpls.2018.00407
Received: 31 August 2017; Accepted: 14 March 2018;
Published: 28 March 2018.
Edited by:
Chunjiang Zhao, Beijing Academy of Agricultural and Forestry Sciences, ChinaReviewed by:
Maribela Pestana, University of the Algarve, PortugalAntonio Ferrante, Università degli Studi di Milano, Italy
Copyright © 2018 Wang, Qian, Zhang, Xu, Li, Xia, Dai, Xu, Yu and Liu. This is an open-access article distributed under the terms of the Creative Commons Attribution License (CC BY). The use, distribution or reproduction in other forums is permitted, provided the original author(s) and the copyright owner are credited and that the original publication in this journal is cited, in accordance with accepted academic practice. No use, distribution or reproduction is permitted which does not comply with these terms.
*Correspondence: Haifeng Li, bGloYWlmZW5nQHpqdS5lZHUuY24= Xiaojian Xia, eGlhb2ppYW54aWFAemp1LmVkdS5jbg==