
95% of researchers rate our articles as excellent or good
Learn more about the work of our research integrity team to safeguard the quality of each article we publish.
Find out more
ORIGINAL RESEARCH article
Front. Plant Sci. , 06 April 2018
Sec. Plant Breeding
Volume 9 - 2018 | https://doi.org/10.3389/fpls.2018.00450
 Runhong Gao1,2,3Guimei Guo1,2Chunyan Fang1,2Saihua Huang1,2Jianmin Chen3Ruiju Lu1,2Jianhua Huang1,2Xiaorong Fan4*Chenghong Liu1,2*
In vitro mutagenesis via isolated microspore culture provides an efficient way to produce numerous double haploid (DH) lines with mutation introduction and homozygosity stabilization, which can be used for screening directly. In this study, 356 DH lines were produced from the malt barley (Hordeum vulgare L.) cultivar Hua-30 via microspore mutagenic treatment with ethyl methane sulfonate or pingyangmycin during in vitro culture. The lines were subjected to field screening under high nitrogen (HN) and low nitrogen (LN) conditions, and the number of productive tillers was used as the main screening index. Five mutant lines (A1-28, A1-84, A1-226, A16-11, and A9-29) with high numbers of productive tillers were obtained over three consecutive years of screening. In the fifth year, components related to N-use efficiency (NUE), including N accumulation, utilization, and translocation, were characterized for these lines based on N uptake efficiency (NUpE), N utilization efficiency (NUtE), and N translocation efficiency (NTE). The results show that the NUpE of four mutant lines (A1-84, A1-226, A9-29, and A16-11) improved significantly under HN, whereas that of two lines (A1-84 and A9-29) improved under LN. As a result, their NUE improved greatly. No improvement in NUtE was observed in any of the five mutant lines. A1-84 and A9-29 were selected as an enhanced genotype in N uptake, and A1-28 showed improved NTE at the grain-filling stage. Our results imply that high-NUpE mutants can be produced through microspore mutagenesis and field screening, and that improvement of NUE in barley depends on enhancement of N uptake.
Nitrogen (N) is an essential macronutrient for crop growth and development, which is usually required to achieve maximum yields in modern agriculture (Wu et al., 2011). Over the past four decades, the global production of agricultural food has doubled with a sevenfold increase input of N fertilizers (Hirel et al., 2007). However, only 30–40% of applied N fertilizers are absorbed by plants during crop production (Raun and Johnson, 1999; Kindu et al., 2014). Excessive use of N fertilizers has caused severe environmental problems, resulting in enrichment of the atmosphere, soil, and agricultural water runoff with reactive N (Ju et al., 2009). As China is the largest producer and consumer of N fertilizers, and the management of N pollution including N-related greenhouse gas emissions was more urgent and essential to global efforts (Zhang et al., 2013). Improved crop varieties with high N-use efficiency (NUE) are considered the best economic strategy for agricultural sustainability (Quan et al., 2016). Previous studies have shown that genetic improvement of NUE in crops is feasible (Ding et al., 2005; Namai et al., 2009; Quan et al., 2016). However, the narrow genetic base of barley has limited genetic improvement of NUE.
In recent years, the haploid system has been used to induce genetic variation through mutagenesis (Jambhulkar, 2007). Microspores are immature precursors to pollen grains, which retain the potential to form haploid embryos under specific conditions that eventually develop into whole plants. The unique developmental pathway is referred to as microspore embryogenesis (Touraev et al., 1997), which is widely exploited for plant breeding and served as an efficient tool to produce DH plants (Soriano et al., 2013). Microspore is an ideal target for mutation induction and selection. it provides several advantages over the traditional seed mutagenesis method. Microspore is far more sensitive to mutagenic treatments than seeds, and it is easy to handle in a tube or dish with large number of microspores at lower dose. The key factor is the ability of fixing mutation in a complete homozygous state via doubled haploidy (Szarejko and Forster, 2007), which facilitates the screening of both recessive and dominant mutants as early as M1 generation, avoiding chimerism and shortening the breeding time (Germanà, 2011). As an attractive approach, microspore mutagenesis has been successfully applied in several cruciferous plants (Barro et al., 2001; Beaith et al., 2005; Ferrie et al., 2008; Liu et al., 2010; Huang et al., 2016). The physical treatments often applied to microspores were gamma rays and UV radiation, and the most common chemical mutagen was EMS (Szarejko and Forster, 2007). In addition, the antibiotic PYM was reported as a safe and efficient mutagen in crop development (Zeng et al., 2010; Zhao et al., 2013; Sui et al., 2015). In this study, the chemical mutagens EMS and PYM were selected to treat the isolated microspores prior to in vitro culture.
However, the application of microspore mutagenesis has been limited by the efficiency of isolated microspore culture system. In our previous work, an efficient protocol of isolated microspore culture has been established for an elite barley variety Hua-30, which was cultivated in the area of Yangtze River Delta of China for malt barley production (Lu et al., 2008, 2016). In this study, a M1 generation with homozygous DH lines was rapidly obtained from barley cv. Hua-30 by microspore mutagenesis and in vitro screening culture in low N medium, and the lines were subjected to further identification in fields under HN and LN conditions. The N absorption, translocation, and utilization of Hua-30 and of five selected mutant lines were studied and two outstanding mutant lines with improved NUpE were identified under both HN and LN conditions. Our results reveal that microspore mutagenesis combined with field screening is an efficient approach to generate homozygous mutant lines for genetic improvement of NUE.
The barley cultivar Hua-30 was used as the WT for all experiments. Isolated microspores were treated with EMS or PYM and then cultured in LN medium to generate plants. Homozygous DH lines were obtained by natural chromosome doubling and reproduction in Kunming (Yunnan Province) between April 2010 and October 2011. The seeds of the M0 generation were harvested from each single plant separately, and the derived DH lines (M1 generation) were screened under two levels of N in a field (Qingpu District, Shanghai) from 2011 to 2015. The barley was cultivated in crop rotation with rice as a preceding crop. The soil type was clayey soil with the following properties: pH 6.3, 2.23 g kg-1 total N, 2.29% organic matter, 3.02 mg kg-1 available P and 70.42 mg kg-1 available K. Data were collected in 2014–2015.
The isolated microspore culture procedures were conducted as described by Lu et al. (2008), except for the microspore mutagenesis. Briefly, spikes were collected and pretreated at 4°C for 15 days. The isolated microspores were treated with chemical mutagens EMS (8.0, 24.0, and 40.0 mM) and PYM (2.0 and 3.0 μM) independently in extraction buffer at 25°C for 48 h in dark. The buffer was comprised of 330 mM mannitol, 10 mM calcium chloride (CaCl2), and 5 mM MES hydrate (Sigma–Aldrich, United States). The tested concentration range of chemical mutagens was determined according to the previous reports (Barro et al., 2001; Zeng et al., 2010). The treated microspores were washed with the induction medium and adjusted to a density of 5.0 × 10⁵ microspores⋅mL-1 for further culture. The sample was divided into four Petri dishes. The yield of embryogenic callus was defined as the wet weight of the callus (aspirated all medium out) formed in each Petri dish after 21 days of culture. The yield of green plants was defined as the number of green plants produced by 100 mg callus. N6 medium was used as the basic medium with some modifications for callus induction and supplemented with 2.3 μM KT, 4.5 μM 2, 4-D and 260 mM maltose. The differentiation medium was based on 9.5 mM agar-solidified MS and supplemented with 2.2 μM 6-BA, 7.0 μM KT, 0.3 μM NAA, and 88 mM maltose. The LN medium was 1/2 inorganic N and 1/4 organic N of the normal induced medium. The extraction buffer and induction medium were sterilized by filtration and the differentiation medium was sterilized in an autoclave (0.11 Mpa, 121°C for 15 min).
The M1 generation was grown in a field (Qingpu District, Shanghai) to screen for mutants with high NUE. In the first round, two N levels (defined as N-fertilized and N-unfertilized) were used in the field experiments in 2011–2012 and 2012–2013. The level of N-fertilized was 160 kg hm-2 of pure N, which was divided into two parts: base fertilizer (compound fertilizer, 15% N concentration) and topdressing (urea, 46.7% N concentration). The base fertilizer accounted for 28% of the total N fertilizer, and was applied before sowing; the topdressing accounted for 72% of the total fertilizer and was applied at the tillering stage in twice. There was no N fertilizer input for the treatment of N-unfertilized level. In the second round, two N levels (HN and LN) were used in the field tests over 2 years (2013–2014 and 2014–2015). High N (HN) comprised 160 kg hm-2 of pure N, composed of base fertilizer (45 kg hm-2) and topdressing (115 kg hm-2), and low N (LN) comprised 45 kg hm-2 of pure N, with only base fertilizer applied. According to Baethgen et al. (1995), approximately 30 kg hm-2 of pure N was necessary for barley to ensure adequate crop establishment and initial tiller development. In order to get sufficient grain production for investigation we set 45 kg hm-2 of pure N as LN treatment. For the HN, we set 160 kg hm-2 of pure N, which was higher than the highest level of N fertilizers (120 kg hm-2 of pure N) reported by Baethgen et al. (1995), and it did not cause lodging to affect the yield in our field experiments. The fields with different N regime were separated by guard rows and ridges. The same N level was used within one field. The field was divided into small zones in the same size using strings to receive N fertilizers evenly during the application of base fertilizer and topdressing. For each treatment, four to five replicate blocks in a randomized block design were used. Plants were grown in 2.5-m-long rows, and there was a 16-cm gap between rows. In the first year (2011–2012), plant height, PTNs per plant, and grain yield per plant were investigated at harvest. In the following 2 years, only plant height and PTNs per plant were investigated at harvest. In the last year, the plant height, PTNs per plant, spike length, grain number per spike, seed setting rate, and grain yield per plant were investigated at harvest.
Fresh Hua-30 plants and five DH line plants were harvested with four replicates at 10:00 AM under two N levels. Each replicate had two plants and each plant had five tillers. Then, the ten tillers were divided into five parts including spikes, flag leaves, second leaves, other leaves, stems, and sheaths. All of the tissues were heated to 105°C for 30 min and dried at 75°C for 3 days. The dried plant tissue was ground and digested for total N determination using the Kjeldahl method (Li et al., 2008). A 5-mL aliquot from a total of 100-mL per digested sample was analyzed using a continuous-flow autoanalyzer (FlowSys, Systea, Anagni, Italy). The biomass values of plant part were calculated as dry weights per tiller multiplied by the number of tillers per plant. The biomass value of the whole plant above ground was the sum of the biomass values of all of the plant parts. Total N was estimated as the sum of the N contents of all of the plant parts. These indicators were investigated, including the DMA, DMM, SDMA, SDMM, total N accumulation at anthesis (TNAA), total N accumulation at maturity (TNAM), spike N accumulation at anthesis (SNAA), and spike N accumulation at maturity (SNAM) under the two N conditions. The NUE was calculated by the method of Moll et al. (1982), where NUE (g/g) is defined as the grain production per unit of supplied N, N-uptake efficiency (NUpE, g/g) was calculated as the total amount of N in the above-ground plant at harvest per unit of supplied N, and N-utilization efficiency (NUtE, g/g) was calculated as the grain yield per total amount of N in the aboveground plant at harvest. The dry matter and N translocation and translocation efficiency were calculated as in Chen et al. (2016) with minor modifications. Dry matter translocation (DMT, g/plant) was calculated as (dry matter at anthesis – spike dry matter at anthesis) – (dry matter at maturity – spike dry matter at maturity); DMT efficiency (DMTE, %) was calculated as ((DMT/(dry matter at anthesis – spike dry matter at anthesis)) × 100%; N translocation (NT, mg/plant) was calculated as (total N accumulation at anthesis – spike N accumulation at anthesis) – (total N accumulation at maturity – spike N accumulation at maturity); N translocation efficiency (NTE, %) was calculated as (NT/(total N accumulation at anthesis – spike N accumulation at anthesis)) × 100%.
All of the data were analyzed by one-way analysis of variance and LSD tests using SPSS software version 21. Different letters after the mean values indicate statistically significant differences between the Hua-30 and mutant lines at P < 0.05.
To produce a large population of mutagenized lines from barley cv. Hua-30, isolated microspores of Hua-30 were treated with the two types of chemical mutagens (EMS and PYM) at low concentrations. Embryogenic callus was successfully induced from the treated microspores in a LN medium (Supplementary Figure S1). Eventually, regenerated plants were obtained from each treatment (Table 1). In total, 356 plants survived and set seeds after being transferred to the field. With the increase of mutagen concentration, the yield of embryogenic callus had a slight decrease. In order to obtain sufficient plants for screening, we did not test other concentrations. It should have the room to be improved in future. Comparing the effects of the two chemical mutagens on the isolated microspore culture, it was observed that higher yields of both embryogenic callus and green plants were achieved using EMS treatment. The results show that PYM was more detrimental to microspore embryogenesis than was the use of EMS. The possible reason may be related to the strong mutagenic effect of PYM on the alteration of chromosomal fragments, while EMS typically produces point mutations.
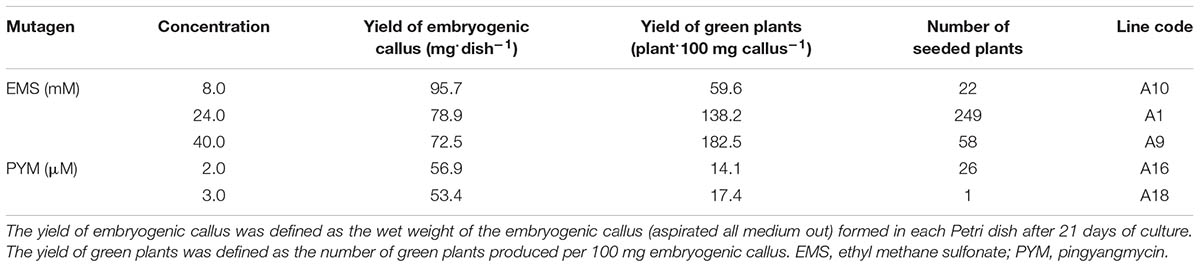
TABLE 1. Yield of embryogenic callus and green plants regenerated from Hua-30 via microspore mutagenesis.
In the first round of screening, in total 229 mutagenized lines were investigated in a field experiment between 2011 and 2012. The results show a wide range of variation among these lines (Supplementary Table S1). In this population, three important agronomic traits (plant height, PTNs, and grain yield per plant) varied widely among lines, and the calculated coefficients of variation (CVs) ranged from 6.06 to 38.25%. Comparing the two levels of N-fertilizer, the CVs of the three agronomic traits among lines were slightly larger for the N-unfertilized treatment than for the N-fertilized treatment. Comparing the three agronomic traits, the CV of plant height (<10%) was smaller than the values of the other two traits, regardless of the level of N-fertilizer, which implies that plant height is relatively stable in response to N. The CV of PTN, and particularly that of grain yield per plant, showed larger variation, indicating that these two traits have strong selection potential in a population. Among the 229 lines tested, it was observed that the distribution of all three agronomic trait values did not conform to a normal distribution under either the N-fertilized or N-unfertilized condition, and values diverged more heavily under the N-unfertilized condition (Supplementary Figure S2). To determine a key index for screening mutant lines with improved NUE, three agronomic traits related to yield were selected for correlation analysis. The correlation coefficients of PTN and grain yield per plant were 0.83 and 0.85, in the condition of N-fertilized and N-unfertilized, which were much higher values than those of plant height and PTN (0.36 and 0.6) and the correlation coefficients of plant height and grain yield per plant (0.43 and 0.63). Therefore, PTN was selected as the main screening index in the field experiments in 2012–2015. In the experiment of 2013–2014, only three lines grew in HN field due to limited space available at the time of seeding, and the raining season during sowing may influence the performance of tested lines. The PTN of 16 mutagenic lines were significant higher than that of WT. The results of the 4-year experiment were shown in Supplementary Table S2. PTNs varied widely, not only among the screened lines but also among the experiments in different years. Combined with their excellent field performance, five lines (A1-28, A1-84, A1-226, A9-29, and A16-11) with PTNs that were significantly higher than the WT (Hua-30), at least in one year of field experiments, were selected for further analysis.
The five mutant lines and the WT under HN and LN in the field experiment in 2014–2015 were subjected to a comprehensive evaluation of agronomic traits (Table 2). The plant heights of the five lines showed no significant differences compared to the WT, except for that of A16-11, which was significantly shorter than the WT under HN. In addition, A16-11 was significantly shorter than the other three lines (A1-84, A1-226, and A9-29) under HN and was shorter than A9-29 under LN. The PTN per plant of A16-11 was significantly higher than that of the WT, but spike length and grain number per spike decreased significantly under HN. Seed-setting rates were significantly higher in the mutant lines than in the WT under HN, and those of three of the five lines (A1-226, A9-29, and A16-11) were significantly higher than the WT under LN. The grain yields per plant of A1-84 and A1-226 were significantly higher than that of the WT under HN, and only that of A1-84 was significantly higher than that of the WT under LN. Although A1-226 had poor PTN values, it had the longest spikes and largest grain numbers per spike under HN, which were the main reasons for it achieving the highest grain yield. Under LN, although A9-29 had the longest spike, A1-226 had the largest grain numbers per spike and A16-11 had the highest PTN values. A1-84 achieved the highest grain yield per plant, which was significantly higher than the WT. This implies that improvement of one of these yield-related traits was not sufficient to improve grain yield per plant under LN. A1-226 had longer spikes, higher grain numbers per spike, and a higher seed-setting rate than the WT under both high and low N conditions, which is noteworthy for further studies of NUE genetic improvement.
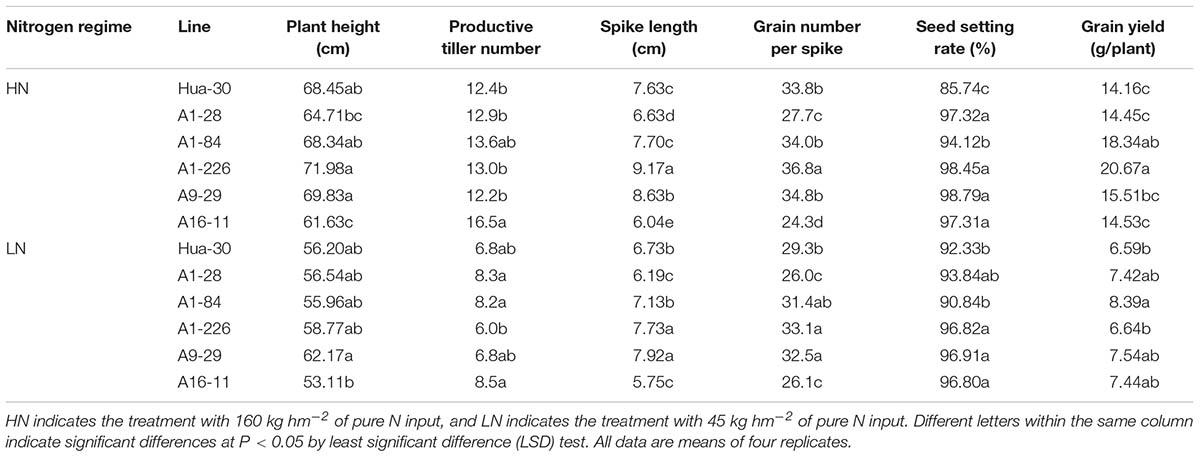
TABLE 2. Comparison of agronomic traits between Hua-30 and mutant lines (2014-2015).
To analyze N allocation at the stages of anthesis and maturity, which are important for grain yields, the dry matter and N concentrations of the five mutant lines and the WT were quantified under LN and HN in the field in 2014–2015 (Table 3). Comparing the five mutant lines to the WT, the spikes and whole plants aboveground showed similar trends regarding differences in dry matter and N accumulation at the two stages. Under HN, four of the five lines (A1-84, A1-226, A9-29, and A16-11) produced significantly more dry matter and had higher N accumulation in spikes and in the whole plant aboveground at maturity. The values of DMM, SDMM, TNAM, and SNAM increased by approximately 15–36%, 16–41%, 30–49%, and 40–53%, respectively, compared to the WT. Under LN, four of the five lines (A1-28, A1-84, A9-29, and A16-11) produced significantly more dry matter and had higher N accumulation in spikes and in the whole plant aboveground at anthesis. The values of DMA, SDMA, TNAA, and SNAA increased by approximately 24–41%, 55–62%, 35–185%, and 80–223%, respectively, compared to the WT. The trend in the difference shifted from maturity to anthesis when the N regime changed from HN to LN. In addition to these differences, A1-226 had significantly higher TNAA than the WT under HN. Under LN, the SDMM, TNAM, and SNAM values of A1-84 were significantly higher than those of the WT. The DMM, SDMM, and TNAM values of A9-29 were significantly higher than those of the WT. In general, A1-226 and A9-29 produced more dry matter and accumulated more N than the other lines under HN, either in the whole plant aboveground or in spikes. Under LN, A1-84 and A9-29 produced more dry matter and accumulated more N than the other lines, either in the whole plant aboveground or in spikes.
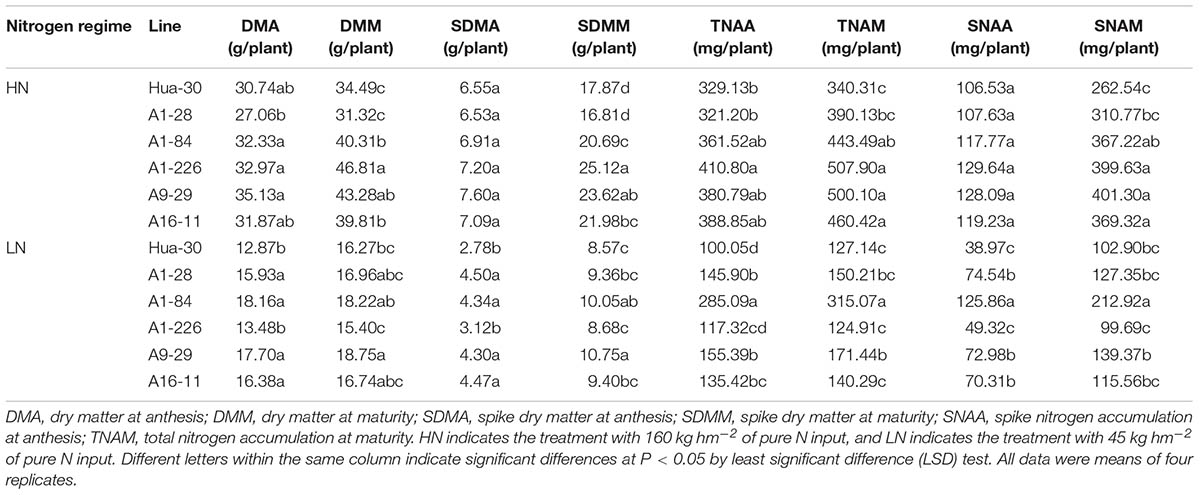
TABLE 3. Comparison of dry matter accumulation and N content between Hua-30 and mutant lines (2014-2015).
To illustrate N allocation in the architecture of plants at anthesis and maturity, the percentages of N accumulated in each organ (leaf blades, sheath, stem, and spike) were showed in Figures 1, 2. From anthesis to maturity, the spike was the sink to store N (∼30% at anthesis under HN, ∼50% at anthesis under LN, and ∼80% at maturity under both high and low N), and other organs served as the sources to transport N to the sink. Under HN, there was a ∼50% N increase in the sink of the spike, which came from the source organs in the following order: stem (∼17%), sheath (∼12%), second leaf (∼8%), flag leaf (∼5%), third leaf (∼5%), and other leaves (∼2%). Under LN, there was a ∼40% N increase in the sink of the spike, which came from the source organs in the following order: stem (∼17%), sheath (∼11%), second leaf (∼4%), flag leaf (∼2%), third leaf (∼2%), and other leaves (∼0.7%). When the N supply changed from HN to LN, the stem served as the main source organ of N transportation and maintained very similar percentages of N in the whole plant allocation at both anthesis and maturity. This implies that the stem is the most important organ in plant architecture from anthesis to maturity. The percentages of N in the flag leaf, second leaf, and third leaf decreased in terms of whole-plant allocation at both anthesis and maturity. It is likely that these source organs are heavily affected by a limited N supply. To analyze differences in the responses of organs under HN and LN, the N percentage of each organ was compared among the five mutant lines and the WT at anthesis and maturity. As can be seen in Figure 1, there was a sharp decrease (of almost 50%) in the third leaf (significant difference only presented for A1-28, A1-84, and A16-11 when comparing to the WT) and other leaves (significant difference only presented for A1-28, A9-29, and A16-11 when comparing to the WT) at anthesis under LN. Meanwhile, there was a slight increase in the N percentage in the spike of the mutants (significant difference only presented for A1-226 when comparing to the WT) at anthesis under LN. This suggests that the N percentage in leaves below the second leaf was reduced as a result of transfer to spikes, to adapt to N stress. In addition, there were small decreases in N allocation to the sheath and the third leaf at both anthesis and maturity under LN in A1-28 and A16-11 (Figures 1, 2). These two lines showed significant N decreases in the sheath and third leaf at anthesis compared to the WT, while only A1-28 showed a significant decrease in the sheath and third leaf at maturity compared to the WT.
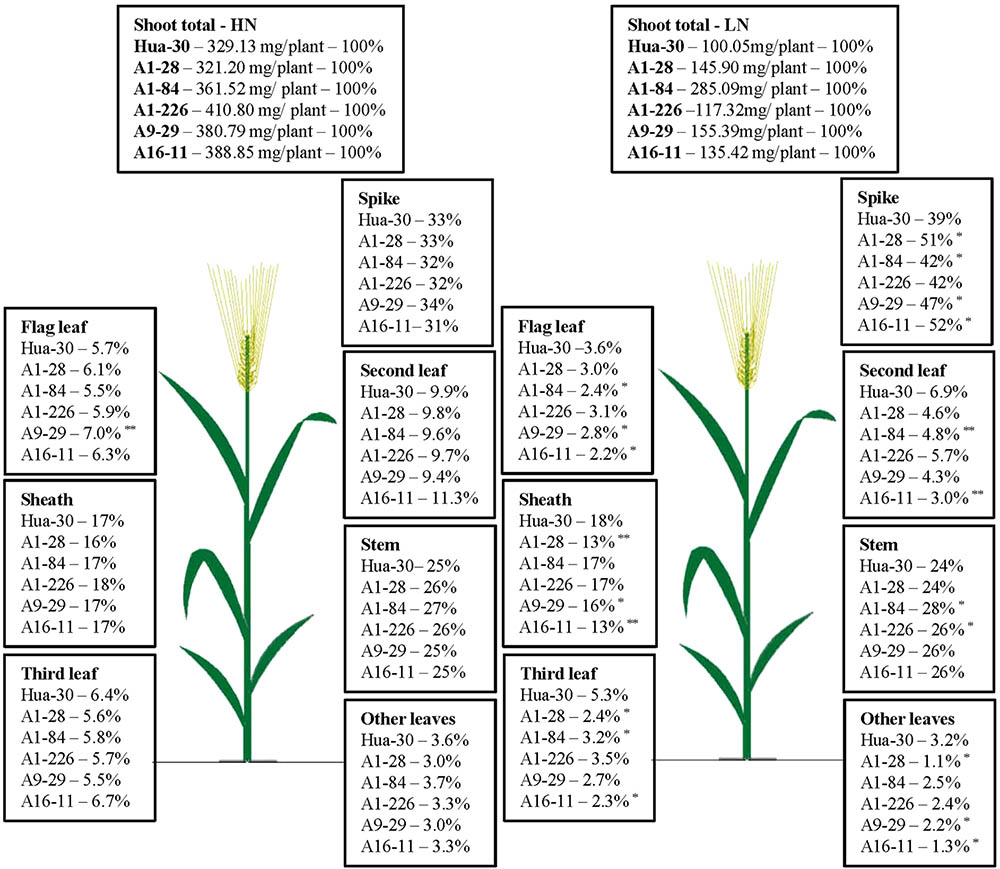
FIGURE 1. Nitrogen content percentage (%) of each tissue in Hua-30 and mutant lines under HN or LN at anthesis. ∗ and ∗∗ indicate significant differences at the 0.05 level and 0.01 level, respectively, compared to Hua-30 by the t-test. HN indicates the treatment with 160 kg hm-2 of pure N input, and LN indicates the treatment with 45 kg hm-2 of pure N input. All of the data are means of four replicates.
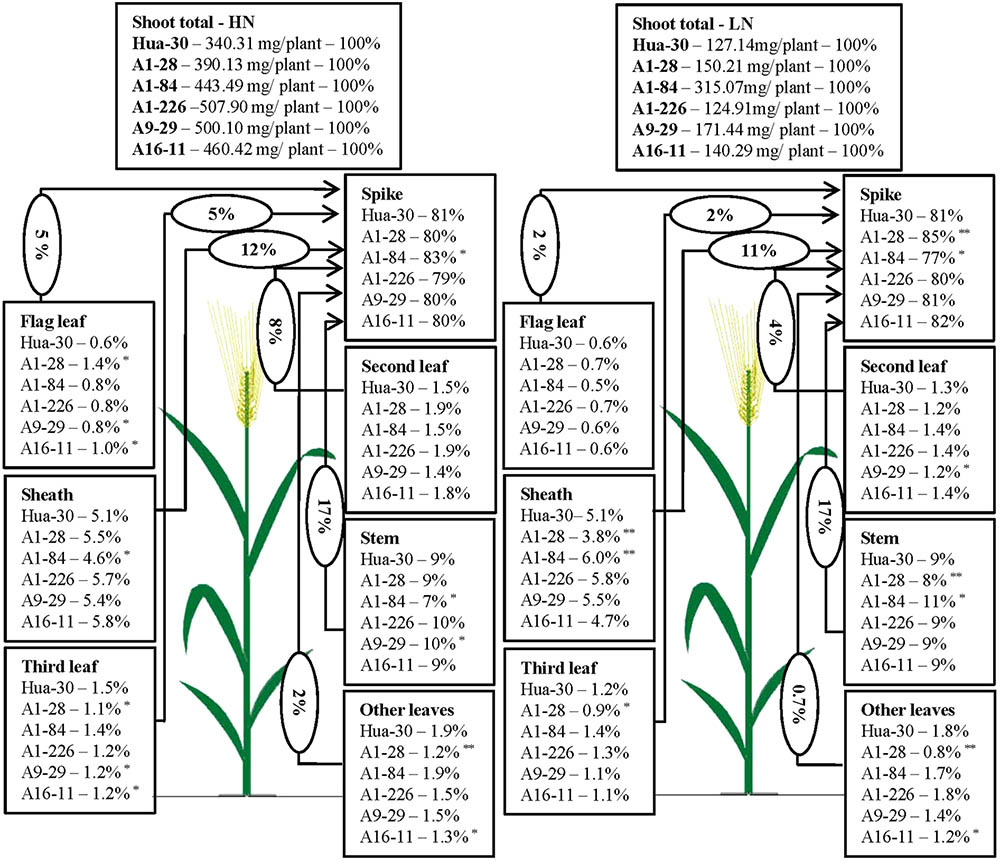
FIGURE 2. Nitrogen content percentage (%) of each tissue in Hua-30 and mutant lines under HN or LN at maturity. Arrow indicates the direction of different sources (leaves, stem, and sheath) to sink (spike). The percentage in the ellipse is the percentage of nitrogen transport from the different sources to the sink after anthesis. ∗ and ∗∗ indicate significant differences at the 0.05 level and 0.01 level, respectively, compared to Hua-30 by the t-test. HN indicates the treatment with 160 kg hm-2 of pure N input, and LN indicates the treatment with 45 kg hm-2 of pure N input. All of the data are means of four replicates.
The NUE values of the five mutant lines were assessed and are shown in Table 4. Four of the five lines (A1-84, A1-226, A9-29, and A16-11) had significant NUE improvement, with increases of 16–41% compared to the WT under HN, and two of the five lines (A1-84 and A9-29) had significant NUE improvement, with increases of 17–25% under LN. In assessing the NUE of each mutant line, two components (NUpE and NUtE) were used to define N uptake and utilization ability separately. The NUpE values of all of the mutant lines with improved NUE compared to the WT (mentioned above) were significantly higher than that of the WT; NUtE values did not improve significantly in any of them, neither with HN nor LN. By contrast, A1-28 had a notable decrease under HN, and A1-84 had a remarkable drop under LN, indicating that NUtE values did not improve in the five mutant lines. The NUtE value was significantly lower in A1-84 than in the WT and the other four lines under LN, whereas the NUpE value was significantly higher than in all of them. These findings indicate that A1-84 is a typical mutant with a strong ability to take up N. Two lines (A1-226 and A16-11) had improved NUE values only under HN, indicating that enhancement of N uptake in these mutants was dependent on the N level supplied. The other two lines (A1-84 and A9-29) had higher NUE values under both HN and LN, indicating that the enhanced N uptake of the two mutants was independent of the level of N supplied.
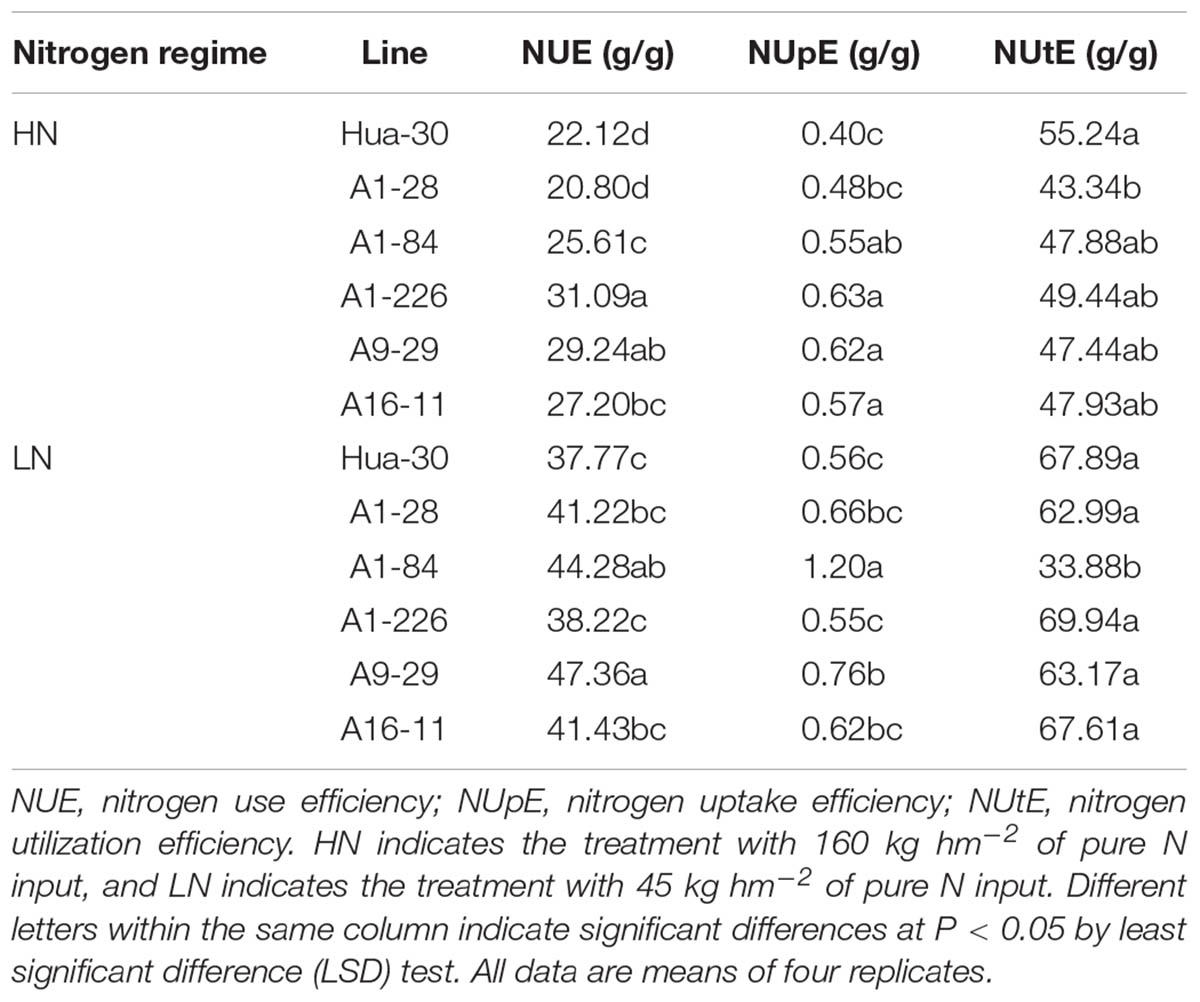
TABLE 4. Comparison of NUE, NUpE and NUtE between Hua-30 and mutant lines (2014–2015).
To assess the dry matter and N translocation of the five mutant lines from anthesis to maturity, DMT, NT, DMTE, and NTE values were analyzed separately and are listed in Table 5. Under HN, there were no significant increases in DMT, NT, DMTE, or NTE in any of the mutant lines compared to the WT. Conversely, the NTE values of A1-28, A1-226, and A9-29 were significantly lower than those of the WT, with decreases of 12–17%. Under LN, there was a significant increase in the DMT and DMTE values of three lines (A1-84, A9-29, and A16-11) compared to the WT, with increases of 90–142% and 62–75%, respectively. In addition, A1-84 had a significantly higher NT value with an increase of 204% and A1-28 had a significantly higher NTE value with an increase of 12% compared to the WT. However, the other lines did not show significant increases in NT or NTE values compared to the WT.
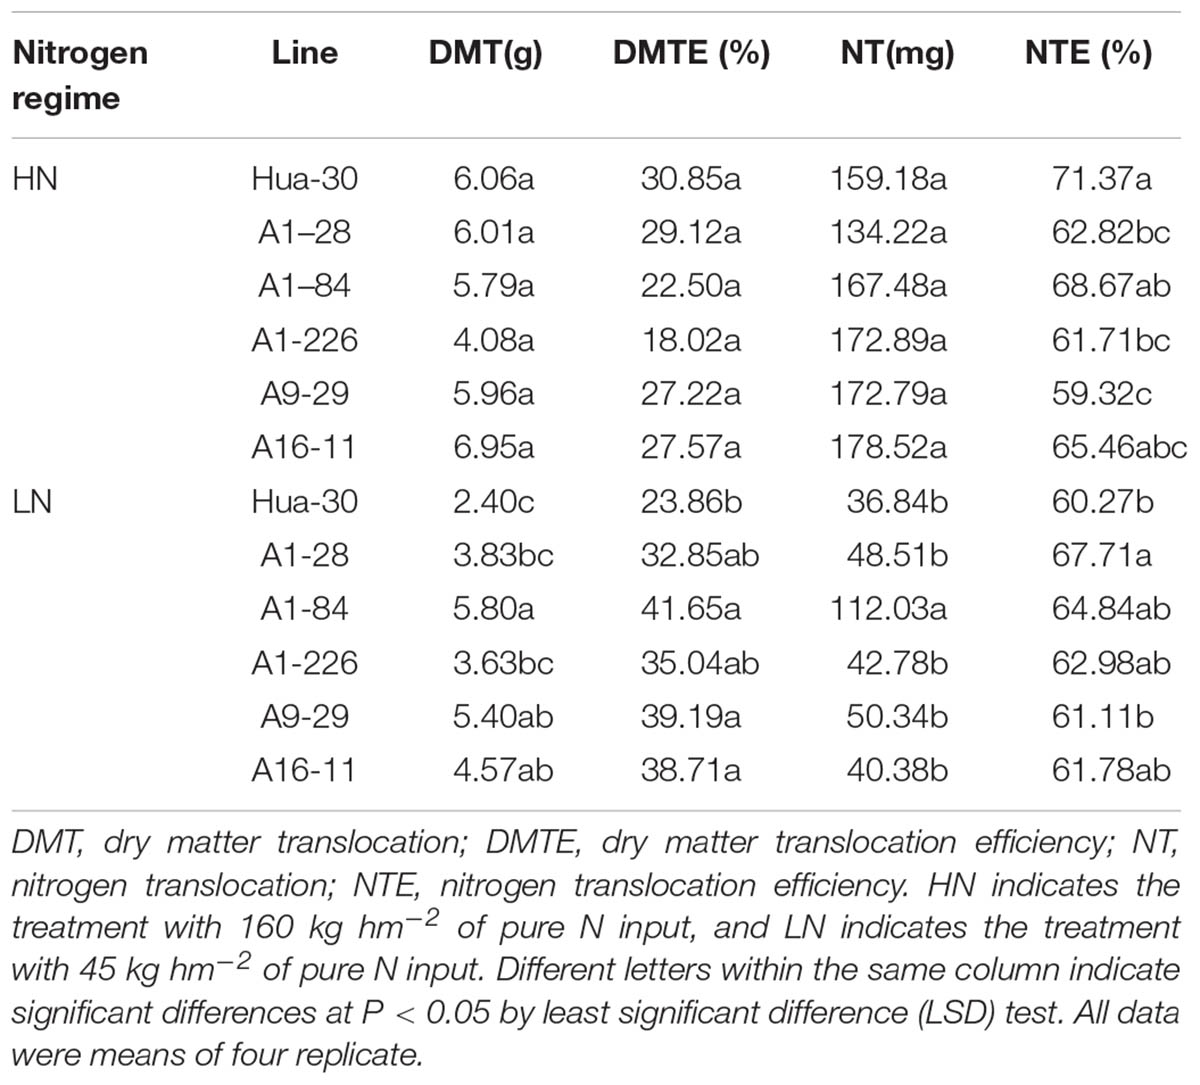
TABLE 5. Comparison of dry matter and nitrogen translocation in Hua-30 and mutant lines.
The microspore is a haploid gamete that contains a single copy of each chromosome from diploids. It is totipotent and can divide to form a multicellular structure in vitro and then regenerate a fertile plant (Eudes et al., 2014). Therefore, the microspore is an ideal target for mutagenic treatment, which can rapidly generate homozygous mutants (Szarejko and Forster, 2007). In addition, microspores without the anther wall layer that are directly in contact with the mutagen can lead to a high mutation percentage. An early successful case reported in oilseed rape Canola produced five DH mutant lines with tolerance to the herbicide imidazolinone by microspore mutagenesis using ethyl nitrosourea (Swanson et al., 1989). In another successful reported case, in Brassica carinata, nine mutant lines with changes in erucic acid concentration were obtained from nearly 400 DH lines produced by microspore mutagenesis using sodium azide (Barro et al., 2001). In barley, 61 mutant lines with morphological and developmental changes were obtained from 564 DH lines produced by microspore mutagenesis using sodium azide (Castillo et al., 2001). Recently, a study in Chinese cabbage produced six stable inheriting mutants from 1304 regenerated plants by microspore mutagenesis using EMS (Huang et al., 2016). In addition to chemical mutagenesis, microspore mutagenesis using radiation has also been successful in B. napus (Beaith et al., 2005) and Chinese cabbage (Huang et al., 2014).
In our study, three mutant lines (A1-84, A1-226, and A9-29) with improved NUE under HN were obtained from 329 DH lines produced by microspore mutagenesis using EMS, and one mutant line (A16-11) with improved NUE under HN was obtained from 27 DH lines produced by microspore mutagenesis using PYM, as well as two mutant lines (A1-84 and A9-29) with improved NUE under LN. The rate of generation of mutant lines with high NUE is encouraging. The integration of mutation and mutant stabilization in one step by microspore mutagenesis provides a powerful tool to produce mutant lines that are ready for direct screening. Limited-N treatment in microspore embryogenesis seemed to improve the screening of high NUE plants in our experiment, the mechanism of which is worthy of further investigations.
NUE is a complex genetic trait implicated in N uptake, translocation, assimilation, and remobilization (Xu et al., 2012). According to Moll et al. (1982), NUE can be divided into NUpE and NUtE. It is difficult to describe or define a mutant with improved NUE based on the visual characteristics of the crop in field experiments. However, NUE under different regimes can be analyzed. For barley and other cereal crops, the grain-filling stage is very important for the establishment of yield. Therefore, the periods of anthesis and maturity were chosen for the NUE analysis in this study. The parameters related to NUE, including NUpE, NUtE, and NTE, are useful to characterize mutants in terms of N uptake, utilization, and transportation. After analyzing five mutant lines using these parameters, no line showed improved NUtE, but four lines (A1-84, A1-226, A9-29, and A16-11) showed enhanced N accumulation under HN, and two lines (A1-84 and A9-29) showed a greater ability to accumulate N under LN. Meanwhile, our data show that A1-84 had enhanced N accumulation due to having the highest NUpE and lowest NUtE values. Although A1-28 was not outstanding in assessment, it showed remarkable NTE under LN conditions. The difference of those physiological characters between mutant lines under different N levels implies that there are some changes on the limiting factors in plant metabolism related to NUE. It awaits further investigation on the genetic control.
An effective screening strategy was developed and optimized to determine which mutant lines had improved NUE. In the first round of field screening of 356 completely homogenous DH lines, the PTN of single plants was determined as an index for further screening, based on its high positive correlation with the grain yield of single plants under both HN and LN. In the second round of field screening, 16 mutant lines were selected based on their high PTN values over four consecutive years under LN conditions. Finally, five mutant lines were comprehensively assessed to elucidate the characteristics related to NUE. In this study, we quantified dry matter and N in plant tissues to analyze NUE. When comparing the accumulation of dry matter and N among five mutant lines and the WT, the differences showed a similar trend in most cases (for either HN or LN). Both dry matter and N accumulation improved significantly under HN in four of the five lines (not A1-28) and both dry matter and N accumulation improved significantly under LN in four lines (not A1-226), which implies that accumulation of dry matter may serve as a primary index of N use in barley.
N remobilization during the reproductive stage is an important process that determines grain yield (Hirel et al., 2007; Chen et al., 2016). A few studies have shown that it is more effective to select genotypes under LN than HN (Presterl et al., 2003; Hirel et al., 2007). Therefore, it was more important to assess N remobilization from anthesis to maturity under LN. In our study, N remobilization parameters such as DMT, DMTE, NT, and NTE showed greater variation under LN than under HN compared to the WT. This confirmed that LN treatment is a more reasonable selective pressure than HN treatment for barley NUE. A1-84 had the highest accumulation of N in spikes (more than twofold that of the WT) under LN at both anthesis and maturity, which indicates that the quantity of N transferred from vegetative organs (source) to the spike (sink) was higher than in other lines at the filling stage. The reason that the NUtE values of A1-84 under LN were significantly lower than those of the WT can be attributed to the large amounts of N accumulated in shoots (nearly threefold that of the WT) at anthesis. Although the NUtE value of A1-84 was very low (33.88 g/g) under LN, the amount of N in the spike at maturity was still the highest of all lines. It also explained that the grain yields per plant of A1-84 and A1-226 were significantly higher than those of the WT under HN, and only A1-84 showed a significant increase under LN.
In this study, four of the five mutant lines (A1-84, A1-226, A9-29, and A16-11) showed significant NUpE improvement under HN and two mutant lines (A1-84 and A9-29) showed significant NUpE improvement under LN, compared to the WT. However, none of the five mutant lines showed any significant improvement in NUtE compared to the WT. It appears that the improvement of NUE relies on better N capture more than N conversion based on the review of UK winter wheat over last 30 years (Sylvester-Bradley and Kindred, 2009), which was consistent with our results. The assessment of NUE for five mutant lines in barley suggested that the improvement of NUE depends on enhancement of N uptake.
Beatty et al. (2010) reported that NUtE plays a predominant role in barley high NUE genotypes under LN, while under HN, NUpE and NUtE played mixed roles in the high NUE genotypes. Similar results have also been obtained in maize (Moll et al., 1982; Moose and Below, 2009). In this study, the role of NUpE was predominant in the mutant lines with improved NUE under both LN and HN. We did not find higher NUtE lines in the mutants under HN. One possible reason is that we did not set up more N treatment levels and another reason may be due to the mutant background used in this study. It would be worth studying more barley genotypes to examine potential high NUtE screening. We anticipate microspore mutation to be an applicable and effective method for screening high NUE plants in other crops.
CL, XF, JH, and RL conceived and designed the experiment. RL and GG conducted the microspore culture and generation-adding. RG, CF, and SH performed the agronomic trait investigation, biomass and nitrogen content measurement.RG and JC analyzed the data. RG and CL wrote the manuscript. All authors helped with drafting the manuscript and approved the final manuscript.
This work was supported by Shanghai Agriculture Applied Technology Development Program, China (Grant Nos. Z20160101 and Z201207), Natural Science Foundation of Shanghai, China (Grant 17ZR1425300), China Agriculture Research System (Grant CARS-05-01A-02), and Jiangsu Science Fund for Distinguished Young Scholars (Grant BK20160030).
The authors declare that the research was conducted in the absence of any commercial or financial relationships that could be construed as a potential conflict of interest.
The Supplementary Material for this article can be found online at: https://www.frontiersin.org/articles/10.3389/fpls.2018.00450/full#supplementary-material
2, 4-D, 2, 4-dichlorophenoxyacetic acid; 6-BA, 6-benzyladenine; CV, coefficient of variation; DH, double haploid; DMA, dry matter at anthesis; DMM, dry matter at maturity; DMT, dry matter translocation; DMTE, dry matter translocation efficiency; EMS, Ethyl methane sulfonate; HN, high nitrogen; KT, kinetin; LN, low nitrogen, LSD, least significant difference; N, nitrogen; NAA, naphthaleneacetic acid; NT, nitrogen translocation; NTE, nitrogen translocation efficiency; NUE, nitrogen use efficiency; NUpE, nitrogen uptake efficiency; NUtE, nitrogen utilization efficiency; PTNs, productive tiller numbers; PYM, pingyangmycin; SDMA, spike dry matter at anthesis; SDMM, spike dry matter at maturity; SNAA, spike nitrogen accumulation at anthesis; SNAM, spike nitrogen accumulation at maturity; TNAA, total nitrogen accumulation at anthesis; TNAM, total nitrogen accumulation at maturity; WT, wild type.
Baethgen, W. E., Christianson, C. B., and Lamothe, A. G. (1995). Nitrogen fertilizer effects on growth, grain yield, and yield components of malting barley. Field Crops Res. 43, 87–99. doi: 10.1016/0378-4290(95)00034-N
Barro, F., Fernández-Escobar, J., De La Vega, M., and Martín, A. (2001). Doubled haploid lines of Brassica carinata with modified erucic acid content through mutagenesis by EMS treatment of isolated microspores. Plant Breeding 120, 262–264. doi: 10.1046/j.1439-0523.2001.00602.x
Beaith, M. E., Fletcher, R. S., and Kott, L. S. (2005). Reduction of saturated fats by mutagenesis and heat selection in Brassica napus L. Euphytica 144, 1–9. doi: 10.1007/s10681-005-4559-7
Beatty, P. H., Anbessa, Y., Juskiw, P., Carroll, R. T., Wang, J., and Good, A. G. (2010). Nitrogen use efficiencies of spring barley grown under varying nitrogen conditions in the field and growth chamber. Ann. Bot. 105, 1171–1182. doi: 10.1093/aob/mcq025
Castillo, A. M., Cistué, L., Vallés, M. P., Sanz, J. M., Romagosa, I., and Molina-Cano, J. L. (2001). Efficient production of androgenic doubled-haploid mutants in barley by the application of sodium azide to anther and microspore cultures. Plant Cell Rep. 20, 105–111. doi: 10.1007/s002990000289
Chen, J., Zhang, Y., Tan, Y., Zhang, M., Zhu, L., Xu, G., et al. (2016). Agronomic nitrogen-use efficiency of rice can be increased by driving OsNRT2.1 expression with the OsNAR2.1 promoter. Plant Biotechnol. J. 14, 1705–1715. doi: 10.1111/pbi.12531
Ding, L., Wang, K. J., Jiang, G. M., Biswas, D. K., Xu, H., Li, L. F., et al. (2005). Effects of nitrogen deficiency on photosynthetic traits of maize hybrids released in different years. Ann. Bot. 96, 925–930. doi: 10.1093/aob/mci244
Eudes, F., Shim, Y.-S., and Jiang, F. (2014). Engineering the haploid genome of microspores. Biocatal. Agric. Biotechnol. 3, 20–23. doi: 10.1016/j.bcab.2013.11.002
Ferrie, A. M. R., Taylor, D. C., MacKenzie, S. L., Rakow, G., Raney, J. P., and Keller, W. A. (2008). Microspore mutagenesis of Brassica species for fatty acid modifications: a preliminary evaluation. Plant Breed. 127, 501–506. doi: 10.1111/j.1439-0523.2008.01502.x
Germanà, M. A. (2011). Gametic embryogenesis and haploid technology as valuable support to plant breeding. Plant Cell Rep. 30, 839–857. doi: 10.1007/s00299-011-1061-7
Hirel, B., Le Gouis, J., Ney, B., and Gallais, A. (2007). The challenge of improving nitrogen use efficiency in crop plants: towards a more central role for genetic variability and quantitative genetics within integrated approaches. J. Exp. Bot. 58, 2369–2387. doi: 10.1093/jxb/erm097
Huang, S., Liu, Z., Li, D., Yao, R., and Feng, H. (2016). A new method for generation and screening of Chinese cabbage mutants using isolated microspore culturing and EMS mutagenesis. Euphytica 207, 23–33. doi: 10.1007/s10681-015-1473-5
Huang, S., Liu, Z., Li, D., Yao, R., Meng, Q., and Feng, H. (2014). Screening of Chinese cabbage mutants produced by 60Co γ-ray mutagenesis of isolated microspore cultures. Plant Breed. 133, 480–488. doi: 10.1111/pbr.12166
Jambhulkar, S. J. (2007). “Mutagenesis: generation and evaluation of induced mutations,” in Advances in Botanical Research, ed. S. K. Gupta (New York, NY: Academic Press), 417–434.
Ju, X. T., Xing, G. X., Chen, X. P., Zhang, S. L., Zhang, L. J., Liu, X. J., et al. (2009). Reducing environmental risk by improving N management in intensive Chinese agricultural systems. Proc. Natl. Acad. Sci. U.S.A. 106, 3041–3046. doi: 10.1073/pnas.0813417106
Kindu, G. A., Tang, J., Yin, X., and Struik, P. C. (2014). Quantitative trait locus analysis of nitrogen use efficiency in barley (Hordeum vulgare L.). Euphytica 199, 207–221. doi: 10.1007/s10681-014-1138-9
Li, Y. L., Fan, X. R., and Shen, Q. R. (2008). The relationship between rhizosphere nitrification and nitrogen-use efficiency in rice plants. Plant Cell Environ. 31, 73–85. doi: 10.1111/j.1365-3040.2007.01737.x
Liu, C., Wang, J., Huang, T., Wang, F., Yuan, F., Cheng, X., et al. (2010). A missense mutation in the VHYNP motif of a DELLA protein causes a semi-dwarf mutant phenotype in Brassica napus. Theor. Appl. Genet. 121, 249–258. doi: 10.1007/s00122-010-1306-9
Lu, R., Chen, Z., Gao, R., He, T., Wang, Y., Xu, H., et al. (2016). Genotypes-independent optimization of nitrogen supply for isolated microspore cultures in barley. Biomed. Res. Int. 2016:1801546. doi: 10.1155/2016/1801646
Lu, R., Wang, Y., Sun, Y., Shan, L., Chen, P., and Huang, J. (2008). Improvement of isolated microspore culture of barley (Hordeum vulgare L.): the effect of floret co-culture. Plant Cell Tiss. Org. 93, 21–27. doi: 10.1007/s11240-008-9338-4
Moll, R. H., Kamprath, E. J., and Jackson, W. A. (1982). Analysis and interpretation of factors which contribute to efficiency of nitrogen utilization1. Agron. J. 74, 562–564. doi: 10.2134/agronj1982.00021962007400030037x
Moose, S., and Below, F. E. (2009). “Biotechnology approaches to improving maize nitrogen use efficiency,” in Molecular Genetic Approaches to Maize Improvement, eds A. L. Kriz and B. A. Larkins (Berlin: Springer), 65–77.
Namai, S., Toriyama, K., and Fukuta, Y. (2009). Genetic variations in dry matter production and physiological nitrogen use efficiency in rice (Oryza sativa L.) varieties. Breed. Sci. 59, 269–276. doi: 10.1270/jsbbs.59.269
Presterl, T., Seitz, G., Landbeck, M., Thiemt, E. M., Schmidt, W., and Geiger, H. H. (2003). Improving nitrogen-use efficiency in European maize: estimation of quantitative parameters. Crop Sci. 43, 1259–1265. doi: 10.2135/cropsci2003.1259
Quan, X., Qian, Q., Ye, Z., Zeng, J., Han, Z., and Zhang, G. (2016). Metabolic analysis of two contrasting wild barley genotypes grown hydroponically reveals adaptive strategies in response to low nitrogen stress. J. Plant Physiol. 206(Suppl. C), 59–67. doi: 10.1016/j.jplph.2016.07.020
Raun, W. R., and Johnson, G. V. (1999). Improving nitrogen use efficiency for cereal production. Agron. J. 91, 357–363. doi: 10.2134/agronj1999.00021962009100030001x
Soriano, M., Li, H., and Boutilier, K. (2013). Microspore embryogenesis: establishment of embryo identity and pattern in culture. Plant Reprod. 26, 181–196. doi: 10.1007/s00497-013-0226-7
Sui, J., Wang, Y., Wang, P., Qiao, L., Sun, S., Hu, X., et al. (2015). Generation of peanut drought tolerant plants by pingyangmycin-mediated in vitro mutagenesis and hydroxyproline-resistance screening. PLoS One 10:e0119240. doi: 10.1371/journal.pone.0119240
Swanson, E. B., Herrgesell, M. J., Arnoldo, M., Sippell, D. W., and Wong, R. S. C. (1989). Microspore mutagenesis and selection: canola plants with field tolerance to the imidazolinones. Theor. Appl. Genet. 78, 525–530. doi: 10.1007/bf00290837
Sylvester-Bradley, R., and Kindred, D. R. (2009). Analysing nitrogen responses of cereals to prioritize routes to the improvement of nitrogen use efficiency. J. Exp. Bot. 60, 1939–1951. doi: 10.1093/jxb/erp116
Szarejko, I., and Forster, B. P. (2007). Doubled haploidy and induced mutation. Euphytica 158, 359–370. doi: 10.1007/s10681-006-9241-1
Touraev, A., Vicente, O., and Heberle-Bors, E. (1997). Initiation of microspore embryogenesis by stress. Trends Plant Sci. 2, 297–302. doi: 10.1016/S1360-1385(97)89951-7
Wu, Y., Liu, W., Li, X., Li, M., Zhang, D., Hao, Z., et al. (2011). Low-nitrogen stress tolerance and nitrogen agronomic efficiency among maize inbreds: comparison of multiple indices and evaluation of genetic variation. Euphytica 180, 281–290. doi: 10.1007/s10681-011-0409-y
Xu, G., Fan, X., and Miller, A. J. (2012). Plant nitrogen assimilation and use efficiency. Annu. Rev. Plant Biol. 63, 153–182. doi: 10.1146/annurev-arplant-042811-105532
Zeng, X., Wen, J., Wan, Z., Yi, B., Shen, J., Ma, C., et al. (2010). Effects of Bleomycin on microspore embryogenesis in Brassica napus and detection of somaclonal variation using AFLP molecular markers. Plant Cell Tissue Organ Cult. 101, 23–29. doi: 10.1007/s11240-009-9658-z
Zhang, W. F., Dou, Z. X., He, P., Ju, X. T., Powlson, D., Chadwick, D., et al. (2013). New technologies reduce greenhouse gas emissions from nitrogenous fertilizer in China. Proc. Natl. Acad. Sci. U.S.A. 110, 8375–8380. doi: 10.1073/pnas.1210447110
Keywords: microspores, mutation, nitrogen use efficiency, nitrogen uptake efficiency, nitrogen utilization efficiency, mutant screening, barley (Hordeum vulgare L.)
Citation: Gao R, Guo G, Fang C, Huang S, Chen J, Lu R, Huang J, Fan X and Liu C (2018) Rapid Generation of Barley Mutant Lines With High Nitrogen Uptake Efficiency by Microspore Mutagenesis and Field Screening. Front. Plant Sci. 9:450. doi: 10.3389/fpls.2018.00450
Received: 11 December 2017; Accepted: 22 March 2018;
Published: 06 April 2018.
Edited by:
Chengdao Li, Murdoch University, AustraliaReviewed by:
Hongjun Liu, Shandong Agricultural University, ChinaCopyright © 2018 Gao, Guo, Fang, Huang, Chen, Lu, Huang, Fan and Liu. This is an open-access article distributed under the terms of the Creative Commons Attribution License (CC BY). The use, distribution or reproduction in other forums is permitted, provided the original author(s) and the copyright owner are credited and that the original publication in this journal is cited, in accordance with accepted academic practice. No use, distribution or reproduction is permitted which does not comply with these terms.
*Correspondence: Xiaorong Fan, xiaorongfan@njau.edu.cn Chenghong Liu, liuchenghong@saas.sh.cn
Disclaimer: All claims expressed in this article are solely those of the authors and do not necessarily represent those of their affiliated organizations, or those of the publisher, the editors and the reviewers. Any product that may be evaluated in this article or claim that may be made by its manufacturer is not guaranteed or endorsed by the publisher.
Research integrity at Frontiers
Learn more about the work of our research integrity team to safeguard the quality of each article we publish.