 Andrea Visioni1*
 Sanjaya Gyawali1,2
 Rajan Selvakumar3Om P. Gangwar3
 Pradeep S. Shekhawat4
 Subhash C. Bhardwaj3
 Ayed M. Al-Abdallat1,5
 Zakaria Kehel1
 Ramesh P. S. Verma1
- 1Biodiversity and Integrated Gene Management, International Center for Agricultural Research in the Dry Areas, Rabat, Morocco
- 2Department of Plant Science, University of Manitoba, Winnipeg, MB, Canada
- 3Indian Institute of Wheat and Barley Research, Indian Council of Agricultural Research, Karnal, India
- 4Rajasthan Agricultural Research Institute, Durgapura, Jaipur, India
- 5Department of Horticulture and Crop Science, Faculty of Agriculture, The University of Jordan, Amman, Jordan
Barley stripe rust is caused by Puccinia striiformis f.sp. hordei, (Psh), occurs worldwide, and is a major disease in South Asia. The aim of this work was to identify and estimate effects of loci underlying quantitative resistance to rust at seedling and adult plant stages. HI-AM panel of 261 barley genotypes consisting of released cultivars from North and South America, Europe, Australia, advanced breeding lines, and local landraces from ICARDA barley program were screened at seedling and adult plant stages for resistance to Psh. Seedling resistance was evaluated with the five prevalent Psh races in India. Screening for the adult plant stage resistance was also performed in two different locations by inoculating with a mixture of the five races used for seedling screeing. The panel was genotyped using DaRT-Seq high-throughput genotyping platform. The genome-wide association mapping (GWAM) showed a total of 45 QTL located across the seven barley chromosomes for seedling resistance to the five races and 18 QTL for adult plant stage resistance. Common QTL for different races at seedling stage were found on all chromosomes except on chromosome 1H. Four common QTL associated with seedling and adult plant stage resistance were found on chromosomes 2, 5, and 6H. Moreover, one of the QTL located on the long arm of chromosome 5H showed stable effects across environments for adult plant stage resistance. Several QTL identified in this study were also reported before in bi-parental and association mapping populations studies validating current GWAM. However 15 new QTL were found at adult plant stage on all chromosomes except the 4H, explaining up to 36.79% of the variance. The promising QTL detected at both stages, once validated, can be used for MAS in Psh resistance breeding program globally.
Introduction
Barley (Hordeum vulgare L.) is one of the most important cereal crops in the word and especially in the dry areas where often is the only crop that can be grown under extreme drought conditions (Ceccarelli, 1994; Li et al., 2006). On the other hand, barley managed by irrigation and high rainfall is common in South Asia and East Africa as well as other regions where rusts and foliar blights are important production constraints. The stripe rust caused by Puccinia striiformis f. sp. hordei, (Psh) is the major constraint in South Asia, East Africa, and Central and North America affecting both quantity and quality of barley produced (Luthra and Chopra, 1990; Roelfs and Huerta-Espino, 1994). Though, Psh can be effectively managed with fungicides, but the use of resistant varieties is considered the most sustainable option for both environmental and economic reasons. Incorporation of qualitative and quantitative resistance is important to obtain cultivars with durable resistance to stripe rust (St. Clair, 2010). Quantitative rust resistance is mediated by quantitative trait loci (QTL) conferring partial/non race specific resistance or “slow rusting” type of resistance. Many QTL reduce the disease severity by increasing rust incubation or latent periods (Mundt, 2014). Usually slow rusting genes have small or intermediate effects when present alone but a higher degree of durable resistance can be achieved by combining 4 or 5 such genes (Singh et al., 2000; Herrera-Foessel, 2011). Quantitative resistance is usually considered race-non-specific but as reported by Poland et al. (2009), the biological mechanisms underlying it is poorly understood and a wide variation of mechanisms is expected. Rust pathogens have intrinsic characteristic like wind-aided migration, ability to easily increase population size and to mutate and acquire new virulence to resistance genes. Due to these characteristics quantitative resistance is preferable to qualitative resistance for long lasting cultivation of new resistant cultivars. Furthermore, with more than 70 Psh races identified (Hovmøller, 2002) a better understanding of the genetic control of quantitative resistance is of crucial importance and breeding would be more effective if based on extensive knowledge of the resistance genes/QTL (Gutiérrez et al., 2015). A previuous study performed by Verma et al. (2018), using the same germplasm, identified accessions carrying already know resistance genes and Psh resistant genotypes to all the five races that may possess novel resistance genes. The current study was undertaken to identify QTL effective against Psh individual races at seedling stage and QTL for quantitative resistance in field globally and especially for South Asia where annual recurrence of stripe rust from the Himalayas is a big challenge.
Materials and Methods
Plant Material and Yellow Rust Races
Two hundred sixty-one spring barley genotypes (172 two-row and 89 six-row types), including released cultivars, advanced breeding lines, and landraces were used in this study. The set is named as HI-AM (High Input Association Mapping) panel as mostly barley genotypes were from ICARDA breeding program targeted toward optimum management conditions. Out of the 261 genotypes, 124 were from ICARDA's barley breeding program (50 two-row and 74 six-row type), 32 from Europe (28 two-row and 4 six-row type), 34 North America (28 two-row and 6 six-row type), 67 from South America (62 two-row and 5 six-row type) and 4 from Australia (only two-row type). The seedling resistance test (SRT) for HI-AM was done against five prevalent Psh races in India, namely, Q (5S0), 24 (0S0-1), 57 (0S0), M (1S0), and G (4S0) under glasshouse at Regional Station, Indian Institute of Wheat and Barley Research (IIWBR), Shimla, India. Among these races, 57, 24, and G were old races while Q and M were identified and characterized more recently (Nayar et al., 1997; Prashar et al., 2007). The barley geneotypes were also screened at their Adult-plant stage (APS) at two locations using mixture of the five races received from Regional Station, IIWBR, Shimla, India.
Screening for Seedling Resistance to Five Races of Psh
Seeds (5 seeds per hole per genotype) were sown in aluminum trays filled with a mixture of fine loam soil and farmyard manure. A total of 18 genotypes and a susceptible check “Bilara-2” were planted in each tray. Seedlings were inoculated 1 week when primary leaves were fully expanded. Inoculation was done using a glass atomizer with 100 mg of rust spores of each race suspended in 10 ml light grade mineral oil, Soltrol 170, (Chevron Phillips Chemicals Asia Pvt. Ltd., Singapore). Inoculated seedlings were misted with sterile water and placed for 48 h in dew chambers at 16 ± 2°C with >90% relative humidity and 12 h day/night cycle. Seedlings were then transferred to glasshouse and incubated at 16 ± 2°C with >70% relative humidity, illuminated at about 15,000 lux for 12 h. Leaves were treated with fine elemental sulfur to prevent powdery mildew infection, without affecting rust infections. Infection types (ITs), were recorded 16–18 days after inoculation following the modified methods of Nayar et al. (1997) and Stakman et al. (1962). Infection types 0 to 2 were considered resistant and 3 to 33+ as susceptible (Table 1A). Genotypes with resiant recation were tested again against the same races to confirm their reaction. The experiment was repeated once with resistant genotypes only to ascertain the consistency of the ITs.
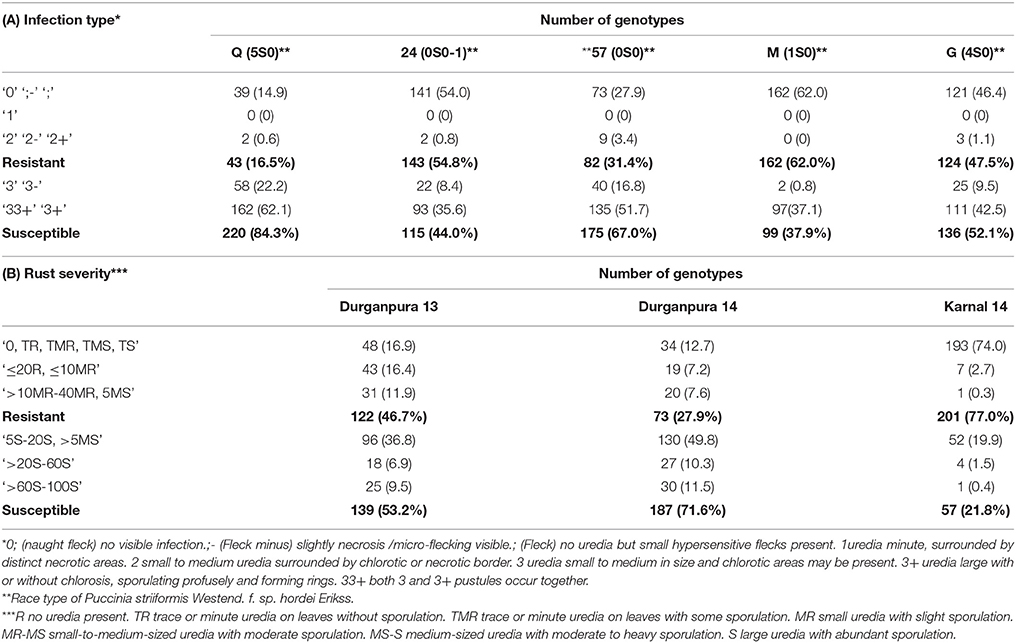
Table 1. Summary of Psh reaction types at seedling stage and adult plant stage.
Screening for Adult-Plant Stage Resistance
All genotypes used in the seedling stage resistance screening were also evalauted for APS under artificial inoculation conditions at RARI, Durgapura (75° 47′ E, 26° 51′ N), Rajasthan, in crop seasons 2012–13 and 2013–14 and at ICAR-IIWBR, Karnal (76° 98′ E, 29° 69′ N),Haryana during 2013–2014, in India. The experiment was laid out in augmented design with yellow rust susceptible check, “Bilara-2,” after every 20 test genotypes in both locations and all seasons. Seeds were sown in 1-m rows with 25 cm row to row distance for each genotype in the first fortnight of November each year at Durgapura and Karnal. The infector rows of Bilara-2 were also sown perpendicular to the test material rows all around the blocks. In order to multiply the initial inoculum six rows of Bilara-2 (about 50 M long) were sown close in the same field about 15 days before the sowing of experimental materials. The five races Q (5S0), 24 (0S0-1), 57 (0S0), M (1S0), and G (4S0) received from Regional Station, IIWBR, Shimla were multiplied on this large plot of Bilara 2.
The infector rows were syringe inoculated at seedling stages (Zadoks GS 20) with the mixed inoculum of stripe rust races taken from early sown Bilara 2 plot, followed by repeated sprays of inoculum collected from infector rows as well as from early sown Bilara 2 plot on the test material. The field was given extra irrigations (sprinkler) to maintain an appropriate humid microclimate for better disease devlopment. Stripe rust severity was recorded at the early to late flowering stages (Zadoks GS 60-69) when maximum disease severity reached on the susceptible check rows, sown after every 20 rows of test material.
The modified Cobb's scale (Peterson et al., 1948) was used for classifying geneotypes to different reaction groups (Table 1B). Genotypes were classified as moderately resistant (up to 10 MR); moderately susceptible (5S to 20 MS); susceptible (>20MS-60S) and highly susceptible (>60S) based on stripe rust severity over two seasons and two locations.
Genotyping With DaRT-Seq
Total genomic DNA extraction was performed on a single plant from each genotype from the HI-AM panel using a Biosprint 96 DNA Plant Kit (Qiagen, Hilden, Germany). DNA sample were processed for DaRT-Seq (Diversity Array Technology Pty Ltd, DaRT P/L) by a series of digestion/ligation reactions (Cruz et al., 2013; Ames et al., 2015). The system combines complexity reduction methods with next-generation sequencing platforms, targeting primarily genic regions (Carling et al., 2015). It produces two types of markers, SilicoDaRT markers characterized by presence/absence variation (PAVs) and classical SNPs present in the sequenced fragments (http://www.diversityarrays.com/dartapplication-dartseq-data-types). The PAV/SNP markers were subsequently aligned by using sequence information available at ftp://ftpmips.helmholtz-muenchen.de/plants/barley/public_data/anchoring. The Thresholds for minimum base id of 90% and E-value of 5−10 were imposed to declare positive matches against the available datasets of the physical map (ftp://ftpmips.helmholtz-muenchen.de/plants/barley/public_data/). Markers quality control of the initial dataset was conducted by removing heterozygous and monomorphic markers and markers with minor allele frequencies (MAF) < 5% and markers with missing data > 10%.
Population Structure and Linkage Disequilibrium
The genetic structure of the 261 genotypes of the HI-AM panel was investigated using 105 and 101 unlinked markers from the PAV set and from the SNP set, respectively, distributed across the 7 barley chromosomes. Markers subsets used for population structure assessment were obtained by selecting one marker every 10 cM within both PAVs and SNPs sets, in order to avoid to enclose linked markers in the subsets. Population structure was firstly determined using STRUCTURE version 2.3.4 (Pritchard et al., 2000). The admixture model option was run using a burn-in length of 1010 cycles, in order to minimize the effect of starting configuration, and a simulation of 106 cycles was applied. Cluster values (k) from 2 to 10 were chosen and 5 independent runs for each k were chosen to obtain consistent results. Additionally, the adegenet package for R statistical software (The R Development core team) was used to confirm the number of sub-populations by the Bayesian Information Criterion (BIC). Finally, on the base of PCA results, genotypes were assigned to subgroups or considered admixed on the base of 80% membership criterion. A principal component analysis was also used to determine population structure and used as covariate in the subsequent GWAM study. Linkage disequilibrium (LD) was estimated with Tassel software V 5.2.32 (Bradbury et al., 2007) using a subset of 1,577 polymorphic markers with known position selected from the original SNP marker-set. Linkage disequilibrium was calculated, using the SNPs marker set, separately for locus pairs within the same chromosomes and between chromosomes. LD was estimated as the squared allele frequency correlations (R2) with only p-values ≤ 0.01 for each pair of loci considered as significant. The nlstools package for R Statistical Software (The R Development core team) was used to estimate the extent of LD by non-linear regression analysis on the basis of intrachromosomial r2 values (Hill and Weir, 1988; Remington et al., 2001).
Genome Wide Association Mapping
Disease severity scores at seedling and adult plant stages and the genotypic data were used to perform GWAM using Tassel V 5.2.32. GWAM was performed using both General Linear Model (GLM) and Mixed Linear Model (MLM) methods. The general equations for GLM and MLM are the followings: y = Xa + e and y = Xa + Qb + Ku + e, respectively. X denotes at the marker while Q is the Q-matrix obtained by STRUCTURE software and K is the kinship matrix (Q+K). The vector for phenotypes is indicated as y while a is the effect of marker fixed effects and b represent the vector of fixed effects, while u is an unknown vector of random additive genetic effects. Association analysis using the GLM model was performed incorporating as covariate population structure derived from PCA analysis (GLM+PCA model) or the Q-matrix (GLM+Q model) in order to avoid type I errors. The MLM model consider the familiar relatedness (the K model) and takes into consideration both population structure and familiar relatedness (Q+K and PCA+K models). The kinship matrix (K) was estimated using Tassel V 5.2.32 from the whole set of DaRT markers with unique position. For comparison we also conducted GWAM without any correction for population substructure. For all scans threshold of (−log10 p ≥ 3) was set for identifying significant marker-trait associations. Significant markers mapping within 5 cM of each other were considered as being linked to the same QTL and the marker with the highest p-value was chosen as representing the QTL. We firstly determined the critical p-value for the significance of marker-trait association using the false discovery rate (FDR). Since the FDR was found to be highly stringent and considering the stringency of the model used for accounting for population structure, in which most of the false positives were inherently controlled. Markers were declared significant at the p = 0.0001 [−log(p) = 3] with the selected models according to a liberal approach (Chan et al., 2010).
QTL Alignment and Candidate Genes
To align detected QTL with those previously reported in different barley germplasm, we checked for the presence of common markers and/or positions in the barleymap database (http://floresta.eead.csic.es/barleymap/; Cantalapiedra et al., 2015), that allows to search the position of barley genetic markers on the Barley Physical Map (IBSC, 2012). The position of the marker representative of the QTL was compared with those of markers at QTL peaks reported in previous studies. Candidate genes search was done using the PGSB database1 that provides access to the barley gene annotation described by the IBSC (2012). The markers at the QTL peaks, were used to search, in the genomic region encompassing the QTL, for functional domains or genes functionally related with disease resistance mechanisms.
Results
Seedling and Adult Plant Resistance
The statistical analysis of the phenotypic data collected has been already reported by Verma et al. (2018), while the reaction type of barley genotypes at SRT and APS are summarized in Table 1. The results showed that the genotypes of HI-AM panel were resistant to races 24 (54.8%) and M (62 %), followed by race G (47.5%), while for the races 57 (31.4%), and Q (16.5%). Races Q and 57 were the most virulent races where over 84 and 68% of genotypes were susceptible (Table 1A).
In the APS screening, 46.7 and 27.9% genotypes were resistant at Durgapura during 2013 and 2014, respectively and 77% resistant at Karnal during 2014 (Table 1B). Durgapura represents an optimal site for Psh due to climatic conditions (temperature and humidity) that favors Psh development while Karnal is characterized by the occurrence of severe winters that may limit the development and sporulation of the rust for the secondary spread. However, Karnal also represents the location in Haryana, which is also prone to stripe rust losses in the wider region. We observed a variation in the range of field reactions between Dg13 and Dg14, as well as between Durgapura and Karnal reactions. As expected data collected in Durgapura indicated a wide range of reaction types when compared with data collected in Karnal. In both locations the susceptible check showed the maximum level of susceptibility (100S) indicating that the variations observed in reactions of the test genotypes are due to climatic factors and not because of escape or inoculum load.
Marker Statistics, Population Structure, and Linkage Disequilibrium
Markers selected after filtering steps have been subsequently used to estimate population structure, linkage disequilibrium (LD) and to perform GWAM for both SRT and APS. The final sets of markers comprise 13.182 PAV and 6.311 SNPs. Population structure analysis performed with Structure (Pritchard et al., 2000) showed three subpopulations (k = 3) on the base of the Δk parameter and according to Evanno et al. (2005), the same number of k was also confirmed by the BIC estimation perfomed with R Statistical Software (The R Development core team). The population structure is shown in Figures 1A,B. The first subpopulation (Q1) is mainly composed by ICARDA germplasm (70%). The second group (Q2), located alone in the left side of the PCA chart (Figure 1A) shows the higher degree of diversity and the highest number of entries from South America (37%), followed by ICARDA germplasm (22%), North America (21%), Europe (13%), and Australia (3%). Q3 was again mainly composed by ICARDA germplasm (70%). The 6-row genotypes are spread across the three subgroups representing the 53% (Q1), 26% (Q2), and 45% (Q3) of the total number of genotypes for ech subpopulation, respectively. There were 153872 (24.4%) inter-chromosomal pairs of loci showing significant LD (P < 0.01), 3847 (2.5%) of which had R2 > 0.2. Of the intra-chromosomal locus pairs, 34227 (31.5%) had a significant LD of which 3022 (8.89%) had R2 > 0.2 Intra-chromosomal locus pairs have a higher mean R2 value (0.10) than inter-chromosomal locus pairs (0.02). The scatter plots of LD (R2) as a function of the inter-marker distance (cM) within the same chromosome for all genotypes indicated a clear LD decay at 4 cM (R2 = 0.18) with genetic distance (Figure 2).
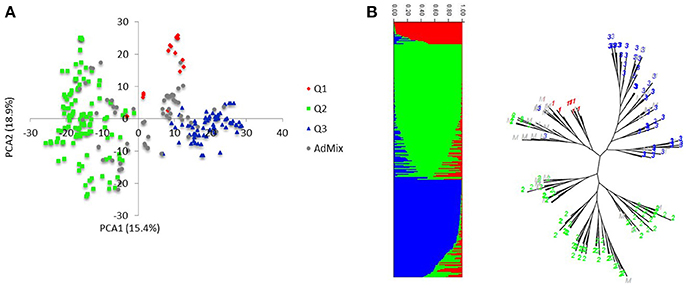
Figure 1. Population structure and linkage disequilibrium. (A) Principal component analysis of the HI-AM panel. (B) The proportion of the genome of each individual originating from each inferred sub-population, a total of 3 and, each color represent a single sub-population.
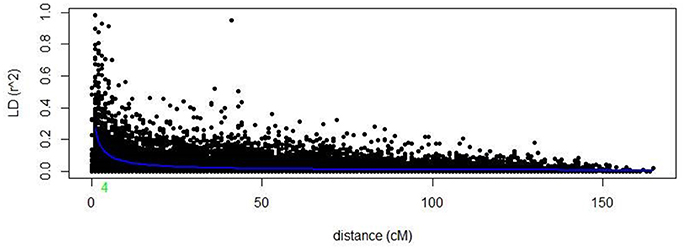
Figure 2. LD decay of the whole barley genome.
Genome Wide Association Mapping
Using the PAVs marker set, the best model fitting was the MLM using Q+K model when analyzing SRT data; while PCA+K was the more suitable for APS data analyses. Using the SNP dataset the best fitting model for SRT and APS was the GLM model using PCA for accounting population structure and relatedness. The QQ plots for GWAM are available as Supplementary Materials (Figures S1–S4). The GWAM analyses at SRT identified 45 QTL located across the seven barley chromosomes (Table 2). The marker R2 ranged from 4.25% to 6.56% Table 2). The race specific QTL detected for SRT explained together the 41.77 % (Race Q), 50.1% (Race 24), 36.42% (Race 57), 53.0% (Race G), and 49.84% (Race M) of phenotypic variance, respectively. GWAM for APS showed 18 QTL using phenotypic data from two locations and during two seasons (Table 3). The marker R2 ranged from 4.54 to 8.11% for APS (Table 3). A QTL located on chromosome 5H was found consistantly stable across seasons and environments. Phenotypic variance explained by QTL detected in case of APS was 15.35% for Dg13, 36.79% for Dg14 and 45.82% for Kr14. Among the QTL detected, 8 QTL were significant for two races (Table 4A). The QTL on chromosome 5H (cM 137.08), overlaps with a QTL for resistance at SRT for the race M. Furthermore, other 2 QTL detected for APS are located on chromosome 2H at the same position of QTL detected for resistance at SRT for race G (Table 4B). Similarly another QTL for APS located on chromosiome 6H overlaps with OTL for SRT for race Q.
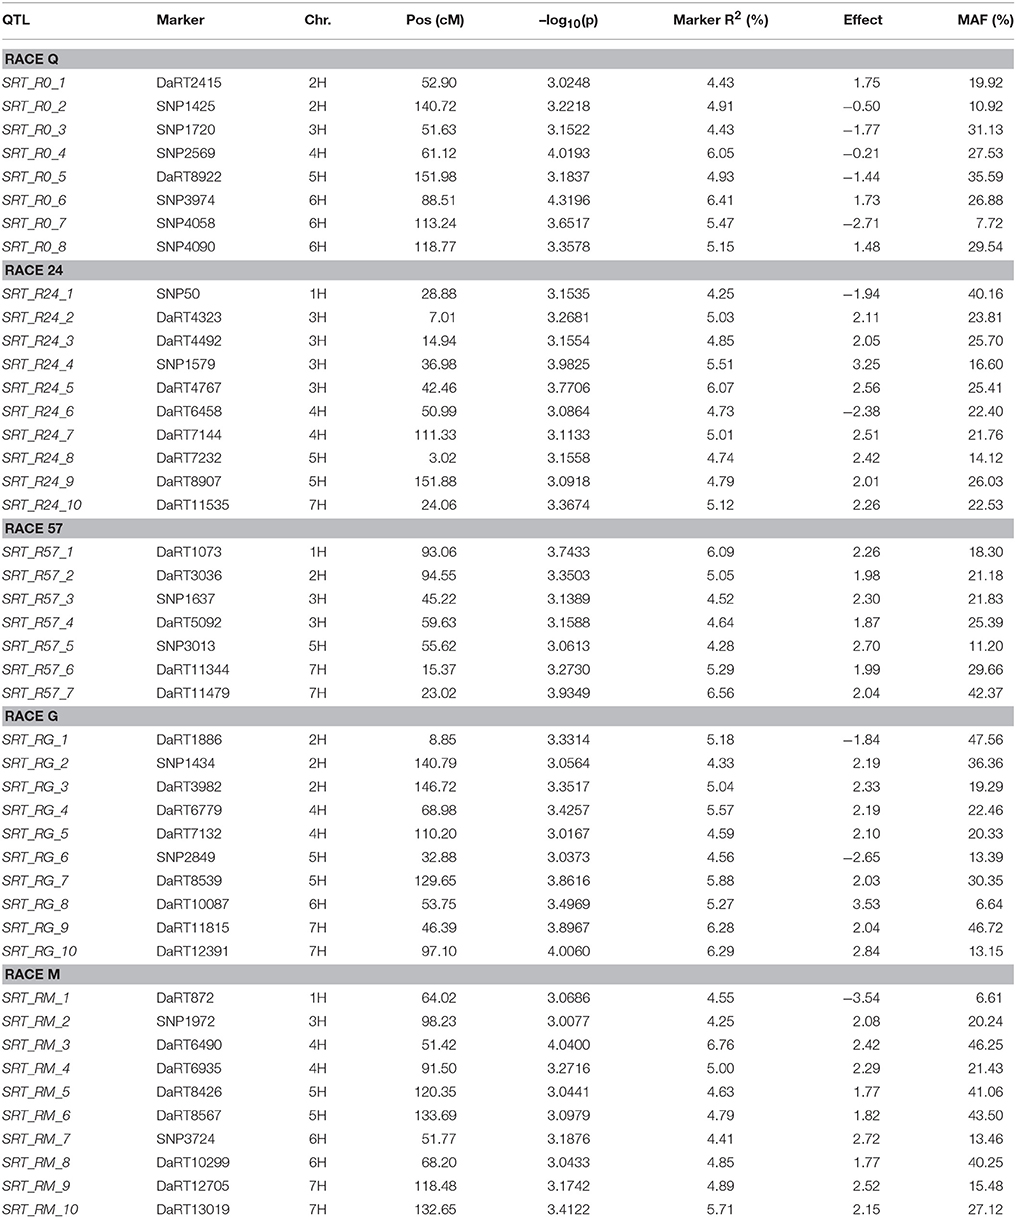
Table 2. GWAM results for seedling resistance test to individual races.
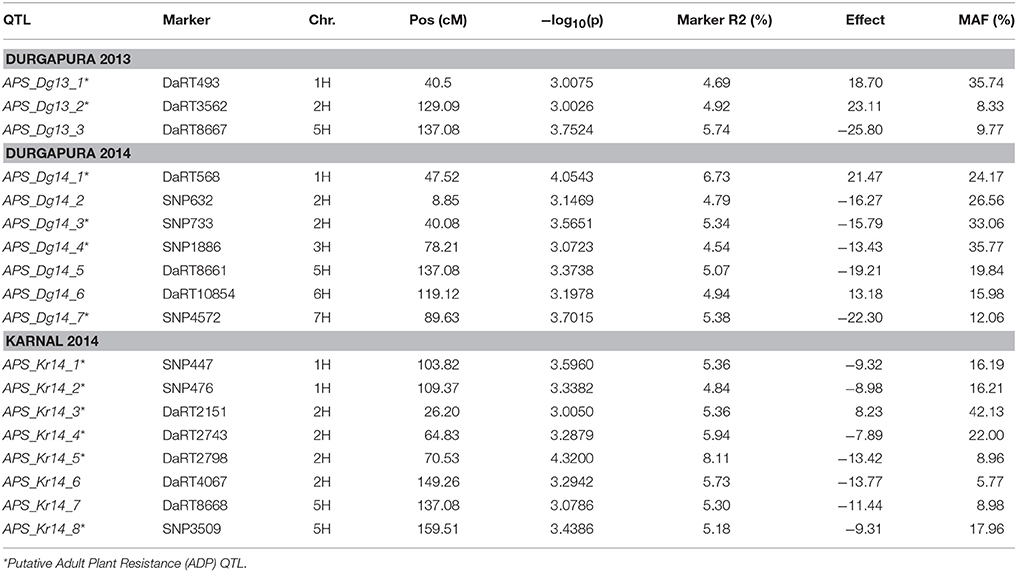
Table 3. GWAM results for Psh resistance at adult plant stage.
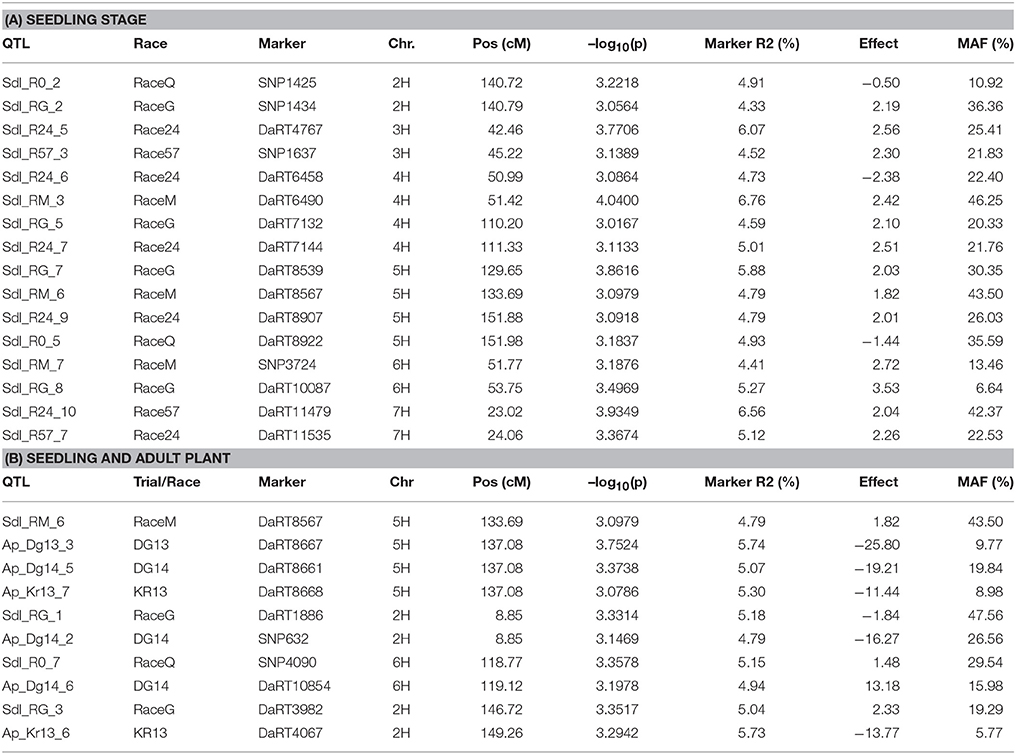
Table 4. Summary of co-located QTL at seedling adult plant stages.
Candidate Genes for Resistance to Psh
Out of the 45 QTL identified for resistance at SRT, 15 were coincident with prior reports Those QTL were reported from different barley germplasm and different Psh races (Thomas et al., 1995; Toojinda et al., 2000; Vales et al., 2005; Rao et al., 2007; Verhoeven et al., 2011; Gutiérrez et al., 2015; Dracatos et al., 2016; Esvelt Klos et al., 2016; Belcher et al., 2018). For Psh resistance at the APS stage using different germplasm and races, only 3 out of the 18 QTL detected, shown in Table 5, are coincident with previous reports (Vales et al., 2005; Rao et al., 2007; Verhoeven et al., 2011; Gutiérrez et al., 2015; Dracatos et al., 2016; Belcher et al., 2018).
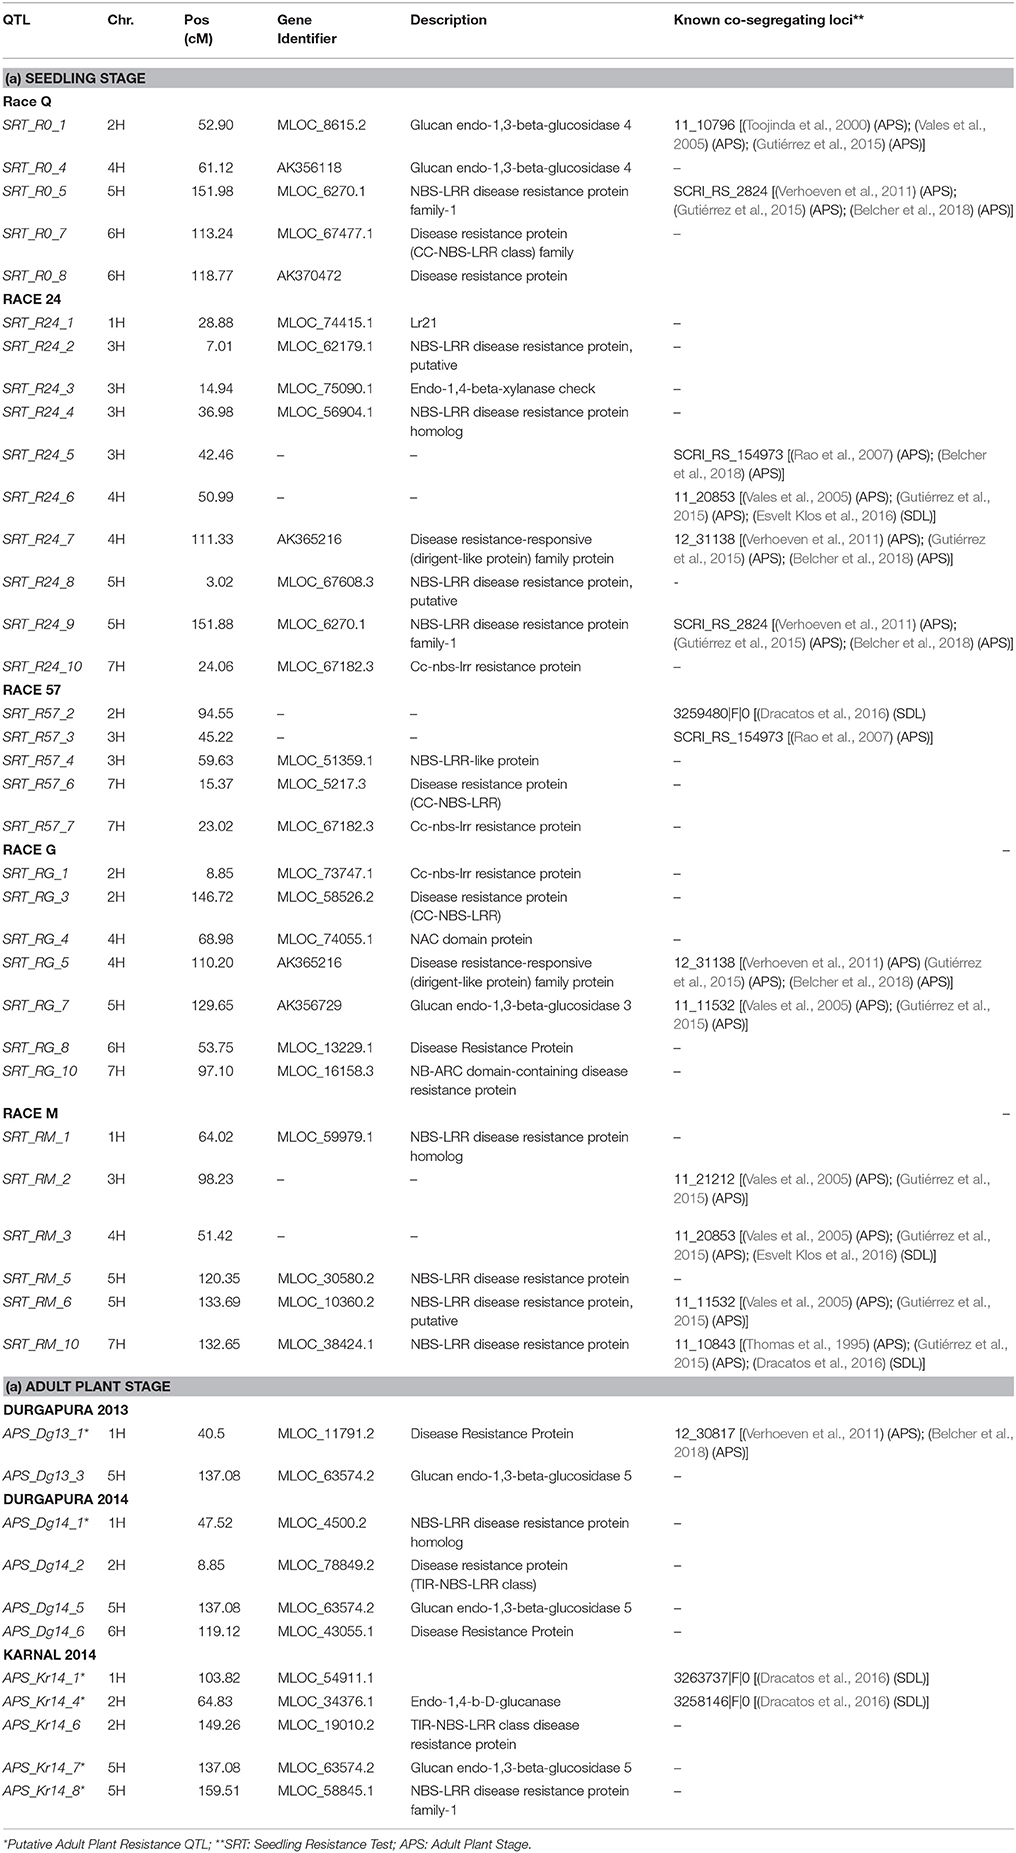
Table 5. QTL aligned and candidate genes identified for seedling and adult plant stages.
Candidate genes (CG) were found for both QTL at the SRT and APS (Table 5). QTL detected at both SRT and APS are located in genomic regions enriched in genes or functional domains that according to their annotations can be considered indicative of common R gene products like: nucleotide binding site (NBS), leucine rich repeat (LLR) and disease resistance protein, genes involved in b-glucan biosynthesis. We identified 27 (CG) for Psh resistance at SRT and 10 for APS. As expected most of the CGs belongs to the NBS-LLR disease resistance protein family, others are classified as generic disease resistance proteins and also as genes involved in β-glucans biosynthesis. We also find NAC protein overlapping with the QTL SRT _RG_4 on chromosome 4H and Lr21 for the QTL SRT _R24_1 located on the chromosome 1H.
Discussion
Barley stripe rust specialization and race structure are poorly defined as compared with wheat rusts and only few studies on the genetic control of the resistance are available in barley. The lack of barley genetic stocks for resistance represent one of the main limiting factors in the identification of genetic determinats of Psh resistance (Dracatos et al., 2016). In order to identify genomic regions controlling resistance to five prevalent races of Psh in India at both SRT and APS stages, the study was taken up on the barley genotypes from much diverse sources. The SRT under artificial inoculation for the five races of the HI-AM panel showed that the most virulent races were Q and 57, respectively. For APS resistance, we observed variation in rust severity in the two seasons in Durgapura (Dg13 vs. Dg14), however, the range of field reaction was higher at Durgapura as compared to Karnal (Kr14). Durgapura is an optimal location for rust screening due to relatively less severe winter favoring faster stripe rust development (Verma et al., 2018), while, Karnal station with severe winters sometimes experience delayed strip rust development with less secondary spread. However, the susceptible check Bilara-2 showed high severy with susceptible reaction at both locations indicating that there is no escape and it was possible to select resistant genotypes at both locations. Beside climate variation, others factors also contribute to the unmanageable variation in infection response in field trials. Inoculum composition, sequential infection, and plant phenology are others main factors that can modify plant response to Psh and others pathogens (Hickey et al., 2011; Gutiérrez et al., 2015). Therefore testing genotypes in different environments is important to confirm the resistance of barley genotypes to Psh.
As mentioned before the HI-AM comprises 261 spring genotypes from different breeding programs in different continents and landraces from germplasm collections. Ear type and origin of germplasm are often the main determinants of population subgrouping but in our case seems that both traits do not have any effect on population structure. The absence of subgrouping based on ear type may be due to the fact that the genotypes from breeding programs represent outcome of 2 × 6-row hybridization being frequently used for germplasm improvement. Furthermore out of 89 six-row genotypes present in the panel, 73 were bred and selected at ICARDA, where crosses between 2 and 6-row genotypes are routinary. In the case of germplasm origin, the absence of subgrouping is most probably due to the extensive germplasm exchange between ICARDA and breeders in North and South American. The distribution of genotypes across the three different subgroups seems to be due to the breeding history of individuals, and further analysis based on pedigrees might be helpful to understand relationship of genotypes belonging to different groups.
Normally seedling resistance is considered qualitative and based on gene for gene interaction between host and pathogen while quantitative resistance has been defined as a non-race specific resistance expressed only in adult plants (Milus and Line, 1986; Richardson et al., 2006). APR is generally best expressed at adult phase and usually involve additive and/or epistatic effects of multiple genes that confers a durable partial resistance (Hickey et al., 2011). Those QTL may represent an interesting source of quantitative resistance and, if validated they can be introgressesed in breeding materials, through MAS, to combine both qualitative and quantitative resistance. Qualitative resistance mechanisms have been extensively studied in terms of genomic location and specificity (Giese et al., 1993; Thomas et al., 1995; Graner and Tekauz, 1996) while mechanisms underlying quantitative resistance still to be clarified. As reviewed by Richardson et al. (2006) quantitative resistance may be controlled by uncharacterized classes of R genes or by alternative alleles at qualitative loci. For instance, Castro et al. (2002) reported two QTL located on chromosomes 4 and 5H conferring resistance to three Psh isolates (Psh-1, Psh-13, and Psh-14) both at SRT and APS, in the Shyri × Galena double haploid population. Those QTL are located in the same genomic regions where several authors reported multiple qualitative and quantitative resistance genes conferring resistance to different pathogens (von Wettstein-Knowles, 1992; Thomas et al., 1995; Qi et al., 1998; Hayes et al., 2000). We detected several race specific QTL at SRT stage that were already reported as QTL for resistance at both SRT and APS in prior reports. The fact that most of them were detected at APS and using different races support the hypothesis that both qualitative and quantitative resistance genes may be located at the same loci.
Interestingly the phenotypic variance explained by the QTL detected for the two most virulent races at SRT stage was the lowest (41.77% for race Q and 36.42% for race 57, respectively) when comparated with less virulent races. We detected 18 QTL for APS using a mixture of the five races, out of which only 3 were reported before. APS_Dg14_1 detected at APS (Verhoeven et al., 2011), while APS_Kr14_1 and APS_Kr_14_4 were detected by Dracatos et al. (2016) at SRT. Furthermore, we found that eight of the QTL detected for SRT were significant for two different races, furthermore QTL SRT _R0_2/SRT _RG_2, SRT _R24_6/SRT _RM_3 and SRT _R24_9/SRT _R0_5 shows opposite effects within races. We also found that 13 out of 18 QTL detected at APS were not coincident with those detected at SRT, therefore they can be considered QTL for Adult Plant Resistance (APR). Among the QTL detected the most interesting are located on the long arm of chromosome 5H at cM 137.08 (APS_Dg13_3, APS_Dg14_5, and APS_Kr_7), near the telomeric region, it was significant across environments and represents the best candidate for validation detected at APS stage. Commons QTL for SRT and APS resistance are located on chromosomes 2HS, 2HL, 5H, and 6HL respectively. It is noteworthy to mention that the QTL for APS on chromosome 5H at 137.08 cM is overlapping with QTL SRT_RM_6. The QTL SRT_RM_6 is located 3.39 cM (133.69 cM) from the QTL for APS and is position is coincident with another QTL previously reported for APS by Vales et al. (2005) and by Gutiérrez et al. (2015) located at 129.44 cM in the IBSC 20122 barley genetic map.
Again this could be explained by presence of clusters of R genes where qualitative genes may regulate the response in SRT, while quantitative genes control the non-race specific response at APS. In case of the overlapping race specific QTL, the opposite effects detected between different races may be due to different race specific resistance genes at the same loci or to the same resistance QTL/gene that responds in a race specific way. Since, as reported by Park (2008) the use of both SRT and APR is desirable for increasing durability of rust resistance in cereals those QTL also represent a valuable source of resistance to Psh. Furthermore, is noteworthy that the most part of QTL detected at APS stage shows negative effect on rust pathogenesis and if validated, they can be used in MAS in stripe rust resistance breeding in barley, especially in India and South Asia.
For several of QTL detected at both SRT and APS we were able to identify CGs; preference was given to genes predicted to be members of the most common family of R genes and other genes predicted to be relevant to stripe rust pathogenesis. QTL genomic region encompass genes annotated for functions or for domains related to disease resistance thus these genes can be considered putative candidate genes for the corresponding QTL. Those genes are part of most represented resistance gene family that encodes cytoplasmatic proteins with nucleotide-binding sites and several leucine rich repeats (Halterman et al., 2001). Furthermore we also found several candidate genes annotated as part of the in β-glucans biosynthesis pathway. β-glucans are component of cell wall and glucanases have a role in early plant response to fungal pathogens. In fact glucanases are secreted by cell walls that are directed toward degradation of fungal walls (Thomma, 2003; Veronese et al., 2003; Vorwerk et al., 2004). The CG associated with race specific QTL SRT_RG_4 was a protein with a NAC domain; proteins encoded by NAC gene family constitute a large family of specific transcription factors, involved in both abiotic and biotic stress response (Al Abdallat et al., 2014; McGrann et al., 2015). For instance, the wheat transcription factor TaNAC4 expression is induced in leaves by the infection of stripe rust (Xia et al., 2010). Many other genes implicated in plant defense response process may be co-located in the same regions. For instance Esvelt Klos et al. (2016) reported several CGs related with cellular reactive oxygen species that are known to play an important role in plant defense mechanisms. Different hypothesis, based on experimental evidences, have been postulated on the mechanisms underlying the quantitative disease resistance and further studies are required to decipher how this mechanisms confers resistance to disease like Psh.
Conclusion
Expanding the catalog of mapped QTL for stripe rust resistance and its validation represent an important step toward the application of MAS for the introgression and pyramiding of resistance genes in new barley cultivars. In this work, novel QTL for Psh resistance at SRT and adult plant stages were identified which could be helpful in dissection the resistance mechanism to this pathogen. New QTL need to be validated for their diversity, effectiveness in different genetic background and with more races of Psh existing in other regions of the world to ensure their use for introgression in barley germplasm or for MAS globally.
Author Contributions
RV, SG, and AV: conceived and coordinated the study; AV, SG, AA-A, and ZK: performed statistical and bioinformatic analysis; RS, OG, PS, and SB: collected the phenotypic data; AV, RV, SG, and AA-A: reviewed and contributed to draft the manuscript.
Funding
This research was funded by CGIAR research program (CRP) on Dryland Systems.
Conflict of Interest Statement
The authors declare that the research was conducted in the absence of any commercial or financial relationships that could be construed as a potential conflict of interest.
Supplementary Material
The Supplementary Material for this article can be found online at: https://www.frontiersin.org/articles/10.3389/fpls.2018.00520/full#supplementary-material
Footnotes
1. ^ Plant Genome System Biology (PGSB). Available online at: http://pgsb.helmholtz-muenchen.de/plant/index.jsp
2. ^ International Barley Genome Sequencing Consortium (IBSC, 2012) Available online at: http://barleygenome.org
References
Al Abdallat, A. M., Ayad, J. Y., Elenein, J. A., Al Ajlouni, Z., and Harwood, W. A. (2014). Overexpression of the transcription factor HvSNAC1 improves drought tolerance in barley (Hordeum vulgare L.). Mol. Breed. 33, 401–414. doi: 10.1007/s11032-013-9958-1
Ames, N., Dreiseitl, A., Steffenson, B. J., and Muehlbauer, G. J. (2015). Mining wild barley for powdery mildew resistance. Plant Pathol. 64, 1396–1406. doi: 10.1111/ppa.12384
Belcher, A. R., Cuesta-Marcos, A., Smith, K. P., Mundt, C. C., Chen, X., and Hayes, P. M. (2018). TCAP FAC-WIN6 elite barley GWAS panel, Q. T. L. I. Barley Stripe Rust Resistance QTL in Facultative and Winter Six-Rowed Malt Barley Breeding Programs Identified via GWAS. Crop Sci. 58, 103–119. doi: 10.2135/cropsci2017.03.0206
Bradbury, P. J., Zhang, Z., Kroon, D. E., Casstevens, T. M., Ramdoss, Y., and Buckler, E. S. (2007). TASSEL: software for association mapping of complex traits in diverse samples. Bioinformatics 23, 2633–2635. doi: 10.1093/bioinformatics/btm308
Cantalapiedra, C. P., Boudiar, R., Casas, A. M., Igartua, E., and Contreras-Moreira, B. (2015). BARLEYMAP: physical and genetic mapping of nucleotide sequences and annotation of surrounding loci in barley. Mol. Breed. 35:13. doi: 10.1007/s11032-015-0253-1
Carling, J., Heller-Uszynska, K., Jaccoud, D., Machado, A., Hopper, C., Xia, L., et al. (2015). “DArTTM and DArTseqTM genome profiling for breeding, pre-breeding and population genetics applications,” in Contribution P0052, XXIII Plant and Animal Genome (San Diego, CA).
Castro, A. J., Chen, X., Hayes, P. M., Knapp, S., Line, R. F., Toojinda, T., et al. (2002). Coincident QTL which determine seedling and adult plant resistance to strip rust in barley. Crop Sci. 42, 1701–1708. doi: 10.2135/cropsci2002.1701
Ceccarelli, S. (1994). Specific adaptation and breeding for marginal conditions. Euphytica 77, 205–219. doi: 10.1007/BF02262633
Chan, E. K., Rowe, H. C., and Kliebenstein, D. J. (2010). Understanding the evolution of defense metabolites in Arabidopsis thaliana using genome-wide association mapping. Genetics 185, 991–1007. doi: 10.1534/genetics.109.108522
Cruz, V. M., Kilian, A., and Dierig, D. A. (2013). Development of DArT marker platforms and genetic diversity assessment of the U.S. collection of the new oilseed crop lesquerella and related species. PLoS ONE 8:e64062. doi: 10.1371/journal.pone.0064062
Dracatos, P. M., Khatkar, M. S., Singh, D., Stefanato, F., Park, R. F., and Boyd, L. A. (2016). Resistance in Australian barley (Hordeum vulgare) germplasm to the exotic pathogen Puccinia striiformis f. sp. hordei, causal agent of stripe rust. Plant Pathol. 65, 734–743. doi: 10.1111/ppa.12448
Esvelt Klos, E., Gordon, T., Bregitzer, P., Hayes, P., Chen, X. M., Del Blanco, I. A., et al. (2016). Barley stripe rust resistance QTL: development and validation of SNP markers for resistance to Puccinia striiformis f. sp. hordei. Phytopathology 106, 1344–1351. doi: 10.1094/PHYTO-09-15-0225-R
Evanno, G., Regnaut, S., and Goudet, J. (2005). Detecting the number of clusters of individuals using the software STRUCTURE: a simulation study. Mol. Ecol. 14, 2611–2620. doi: 10.1111/j.1365-294X.2005.02553.x
Giese, H., Holm-Jensen, A. G., Jensen, H, E., and Jensen, J. (1993). Localization of the Laevigatum powdery mildew resistance gene to barley chromosome 2 by the use of RFLP markers. Theor Appl. Genet. 85, 897–900.
Graner, A., and Tekauz, A. (1996). RFLP mapping in barley of a dominant gene conferring resistance to scald (Rhynchosporium secalis). Theor. Appl. Genet. 93, 421–425. doi: 10.1007/BF00223185
Gutiérrez, L., Germán, S., Pereyra, S., Hayes, P. M., Pérez C. A., Capettini, F., et al. (2015). Multi-environment multi-QTL association mapping identifies disease resistance QTl in barley germplasm from Latin America. Theor. Appl. Genet. 128:501. doi: 10.1007/s00122-014-2448-y
Halterman, D., Zhou, F., Wei, F., Wise, R. P., and Schulze-Lefert, P. (2001). The MLA6 coiled-coil, NBS-LRR protein confers AvrMla6-dependent resistance specificity to Blumeria graminis f. sp. hordei in barley and wheat. Plant J. 25, 335–348. doi: 10.1046/j.1365-313x.2001.00982.x
Hayes, P. M., Castro, A., Corey, A., Marquez-Cedillo, L., Jones, B., Mather, D., et al. (2000). A Summary of Published Barley QTL Reports. Available online at: http://www.css.orst.edu/barley/nabgmp/qtlsum.htm
Herrera-Foessel, S. A., Lagudah, E. S., Huerta-Espino, J. Hayden, M. J., Harbans, S. B., Sing, D. (2011) New slow-rusting leaf rust and stripe rust resistance genes Lr67 and Yr46 in wheat are pleiotropic or closely linked. Theor. Appl. Genet. 122:239. doi: 10.1007/s00122-010-1439-x
Hickey, L. T., Lawson, W., Platz, G. J., Dieters, M., Arief, V. N., Germán, S., et al. (2011). Mapping Rph20: a gene conferring adult plant resistance to Puccinia hordei in barley. Theor. Appl. Genet. 123, 55–68. doi: 10.1007/s00122-011-1566-z
Hill, W. G., and Weir, B. S. (1988). Variances, and covariances of squared linkage disequilibria in finite populations. Theor. Popul Biol. 33, 54–78. doi: 10.1016/0040-5809(88)90004-4
Hovmøller, M. S., Justesen, A. F., and Brown, J. K. M. (2002), Clonality long-distance migration of Puccinia striiformis f.sp. tritici in north-west Europe. Plant Pathol. 51, 24–32. doi: 10.1046/j.1365-3059.2002.00652.x
Li, R. H., Guo, P. G., Baum, M., Grando, S., and Salvatore, C. (2006). Evaluation of chlorophyll content and fluorescence parameters as indicators of drought tolerance in barley. Agric. Sci. China 5, 751–757. doi: 10.1016/S1671-2927(06)60120-X
Luthra, J. K., and Chopra, V. L. (1990). Genetics of stripe rust resistance in barley. Ind. J. Genet. 50, 390–395.
McGrann, G. R., Steed, A., Burt, C., Goddard, R., Lachaux, C., Bansal, A., et al. (2015). Contribution of the drought tolerance-related Stress-responsive NAC1 transcription factor to resistance of barley to Ramularia leaf spot. Mol. Plant Pathol. 16, 201–209. doi: 10.1111/mpp.12173
Milus, E. A., and Line, R. F. (1986). Number of genes controlling high-temperature, adult-plant resistance to stripe rust in wheat. Phytopathology 76, 93–96. doi: 10.1094/Phyto-76-93
Mundt, C. C. (2014). Durable resistance: a key to sustainable management of pathogens and pests. Infect. Genet. Evol. 27, 446–455. doi: 10.1016/j.meegid.2014.01.011
Nayar, S. K., Prashar, M., and Bhardwaj, S. C. (1997). Manual of Current Techniques in Wheat Rust. Research Bulletin 2. Regional Station, Directorate of Wheat Research, Flowerdale, Shimla. 1–32.
Park, R. F. (2008). Breeding cereals for rust resistance in Australia. Plant Pathol. 57, 591–602. doi: 10.1111/j.1365-3059.2008.01836.x
Peterson, R. F., Campbell, A. B., and Hannah, A. E. (1948). A diagrammatic scale for estimating rust intensity on leaves and stems of cereals. Can. J. Res. 26, 496–500. doi: 10.1139/cjr48c-033
Poland, J. A., Balint-Kurti, P. J., Wisser, R. J., Pratt, R. C., and Nelson, R. J. (2009). Shades of gray: the world of quantitative disease resistance. Trends Plant Sci. 14, 21–29. doi: 10.1016/j.tplants.2008.10.006
Prashar, M., Bhardwaj, S. C., Jain, S. K., and Datta, D. (2007). Pathotypicevolution in Puccinia striiformis in India during 1995-2004. Aust. J. Agric. Res. 58, 602–604. doi: 10.1071/AR07126
Pritchard, J. K., Stephens, M., and Donnelly, P. (2000). Inference of population structure using multilocus genotype data. Genetics 155, 945–959. Available online at: http://www.genetics.org/content/155/2/945
Qi, X., Niks, R. E., Stam, P., and Lindhout, P. (1998). Identification of QTL for partial resistance to leaf rust (Puccinia hordei) in barley. Theor. Appl. Genet. 96, 1205–1215. doi: 10.1007/s001220050858
Rao, H. S., Basha, O. P., Singh, N. K., Sato, K., and Dhaliwal, H. S. (2007). Frequency distributions and composite interval mapping for QTL analysis in ‘Steptoe' x ‘Morex' barley mapping population. Barley Genet. Newsl. 37, 5–20.
Remington, D. L, Thornsberry, J. M., Matsuoka, Y., Wilson, L. M., Whitt, S. R, Doeblay, J. (2001) Structure of linkage disequilibrium and phenotypic associations in the maize genome. Proc. Natl. Acad. Sci. U.S.A. 98, 11479–11484. doi: 10.1073/pnas.201394398
Richardson, K. L., Vales, M. I., and Kling, J. G. Mundt C. C., and Hayes P. M. (2006) Pyramiding and dissecting disease resistance QTL to barley stripe rust. Theor. Appl. Genet. 113:485. doi: 10.1007/s00122-006-0314-2
Roelfs, A. P., and Huerta-Espino, J. (1994). Seedling resistance in Hordeum to barley stripe rust from Texas. Plant Dis. 78, 1046–1049. doi: 10.1094/PD-78-1046
Singh, R. P., Nelson, C. J., and Sorrels, M. E. (2000). Mapping Yr28 and other genes for resistance to stripe rust in wheat. Crop Sci. 40, 1148–1155. doi: 10.2135/cropsci2000.4041148x
St. Clair, D. A. (2010). Quantitative disease resistance and quantitative resistance loci in breeding. Annu. Rev. Phytopathol. 48, 247–268. doi: 10.1146/annurev-phyto-080508-081904
Stakman, E. C., Stewart, D. M., and Loegering, W. Q. (1962). Identification of physiologic races of Puccinia graminis var. tritici. US Dept. Agriculture. Reserve. Service E-617. Available online at: https://naldc.nal.usda.gov/download/CAT10243018/PDF
Thomas, W. T. B., Powell, W., Waugh, R., Chalmers, K. J., Barua, U. M., Jack, P., et al. (1995). Detection of quantitative trait loci for agronomic, yield, grain and disease characters in spring barley (Hordeum vulgare L.). Theor. Appl. Genet. 91, 1037–1104. doi: 10.1007/BF00223917
Thomma, B. P. (2003). Alternaria spp.: from general saprophyte to specific parasite. Mol. Plant Pathol. 4, 225–236. doi: 10.1046/j.1364-3703.2003.00173.x
Toojinda, T., Broers, L., Chen, X., Hayes, P. M., Kleinhofs, A., Korte, J., et al. (2000). Mapping quantitative and qualitative disease resistance genes in doubled haploid population of barely (Hordeum vulgare). Theor. Appl. Genet. 101:580. doi: 10.1007/s001220051519
Vales, M. I., Schön, C. C., Capettini, F., Chen, X. M., Corey, A. E., Mather, D. E., et al. (2005). Effect of population size on the estimation of QTL: a test using resistance to barley stripe rust. Theor. Appl. Genet. 111, 1260–1270. doi: 10.1007/s00122-524005-0043-y
Verhoeven, E. C., Bonman, J. M., Bregitzer, P., Brunick, B., Cooper, B., Corey, A. E., et al. (2011). Registration of the BISON Genetic stocks in L. J. Plant Registr. 5, 135–140. doi: 10.3198/jpr2010.05.0269crgs
Verma, R. P. S., Selvakumar, R., Gangwar, O. P., Shekhawat, P. S., Bhardwaj, S. C., Rehman, S., et al. (2018). Identification of additional sources of resistance to Puccinia striiformis f. sp. hordei (PSH) in a collection of barley genotypes adapted to the high input condition. J. Phytopathol. 2018, 1–10. doi: 10.1111/jph.12693
Veronese, P., Ruiz, M. T., Coca, M. A., Hernandez-Lopez, A., Lee, H., Ibeas, J. I., et al. (2003). In defense against pathogens. Both plant sentinels and foot soldiers need to know the enemy. Plant Physiol. 131, 1580–1590. doi: 10.1104/pp.102.013417
von Wettstein-Knowles, P. (1992). “Cloned and mapped genes: current status,” in Barley: Genetics, Biochemistry, Molecular Biology and Biotechnology, ed P. R. Shewry. (Wallingford: CAB Int), 73–98.
Vorwerk, S., Somerville, S., and Somerville, C. (2004). The role of plant cell wall polysaccharide composition in disease resistance. Trends Plant Sci. 9, 203–209. doi: 10.1016/j.tplants.2004.02.005
Keywords: Puccinia striiformis f. sp. hordei, GWAM, seedling stage, barley (Hordeum vulgare L.), adult plant resistance (APR), QTL
Citation: Visioni A, Gyawali S, Selvakumar R, Gangwar OP, Shekhawat PS, Bhardwaj SC, Al-Abdallat AM, Kehel Z and Verma RPS (2018) Genome Wide Association Mapping of Seedling and Adult Plant Resistance to Barley Stripe Rust (Puccinia striiformis f. sp. hordei) in India. Front. Plant Sci. 9:520. doi: 10.3389/fpls.2018.00520
Received: 16 November 2017; Accepted: 04 April 2018;
Published: 24 April 2018.
Edited by:
Giampiero Valè, Cereal Research Centre, CRA-CER, ItalyReviewed by:
Elisabetta Mazzucotelli, Consiglio per la Ricerca in Agricoltura e L'analisi dell'Economia Agraria (CREA), ItalyMarco Maccaferri, University of Bologna, Italy
Copyright © 2018 Visioni, Gyawali, Selvakumar, Gangwar, Shekhawat, Bhardwaj, Al-Abdallat, Kehel and Verma. This is an open-access article distributed under the terms of the Creative Commons Attribution License (CC BY). The use, distribution or reproduction in other forums is permitted, provided the original author(s) and the copyright owner are credited and that the original publication in this journal is cited, in accordance with accepted academic practice. No use, distribution or reproduction is permitted which does not comply with these terms.
*Correspondence: Andrea Visioni, a.visioni@cgiar.org