 Andreas M. Savvides
 Vasileios Fotopoulos
- Department of Agricultural Sciences, Biotechnology and Food Science, Cyprus University of Technology, Limassol, Cyprus
The development of technology, like the widely-used off-the-shelf portable photosynthesis systems, for the quantification of leaf gas exchange rates and chlorophyll fluorescence offered photosynthesis research a massive boost. Gas exchange parameters in such photosynthesis systems are calculated as gas exchange rates per unit leaf area. In small chambers (<10 cm2), the leaf area used by the system for these calculations is actually the internal gasket area (AG), provided that the leaf covers the entire AG. In this study, we present two inexpensive and non-destructive techniques that can be used to easily quantify the enclosed leaf area (AL) of plant species with leaves of surface area much smaller than the AG, such as that of cereal crops. The AL of the cereal crop species studied has been measured using a standard image-based approach (iAL) and estimated using a leaf width-based approach (wAL). iAL and wAL did not show any significant differences between them in maize, barley, hard and soft wheat. Similar results were obtained when the wAL was tested in comparison with iAL in different positions along the leaf in all species studied. The quantification of AL and the subsequent correction of leaf gas exchange parameters for AL provided a precise quantification of net photosynthesis and stomatal conductance especially with decreasing AL. This study provides two practical, inexpensive and non-destructive solutions to researchers dealing with photosynthesis measurements on small-leaf plant species. The image-based technique can be widely used for quantifying AL in many plant species despite their leaf shape. The leaf width-based technique can be securely used for quantifying AL in cereal crop species such as maize, wheat and barley along the leaf. Both techniques can be used for a wide range of gasket shapes and sizes with minor technique-specific adjustments.
Introduction
The process of photosynthesis is the key source of energy for life on earth (Zhu et al., 2008; Niinemets et al., 2017). The rapid global climate change and the arising pressure for food security (Tilman et al., 2011) are synergistically raising two important challenges to the photosynthesis research community.The first challenge is to understand the mechanisms, vulnerabilities and potentials for the improvement of the photosynthetic process and the second to develop better techniques for monitoring, modeling and rapid screening of photosynthesis (Niinemets et al., 2017).
The development of technology for the quantification of leaf gas exchange rates (Long et al., 1996) and chlorophyll fluorescence (Maxwell and Johnson, 2000) have offered photosynthesis research a massive boost (Long and Bernacchi, 2003). Focusing on gas exchange measurements, an increasing number of scientific publications have made use of portable photosynthesis systems over the last decades (Figure 1A). For instance, the LI-6400 portable photosynthesis system (LI-COR Biosciences, Lincoln, NE, USA) has been used in a large proportion of these studies (Figure 1A) for a wide range of applications, e.g., for the in vivo quantification of planar leaf photosynthetic parameters in different plant species with different leaf shapes (Savvides et al., 2012; Velez-Ramirez et al., 2014; Kaiser et al., 2016; Zait et al., 2017) grown/adapted in different environments (Velez-Ramirez et al., 2014; Kaiser et al., 2016; Rabert et al., 2017), or even for gas exchange of different plant structures (Apple et al., 2000; Savvides et al., 2013, 2014).
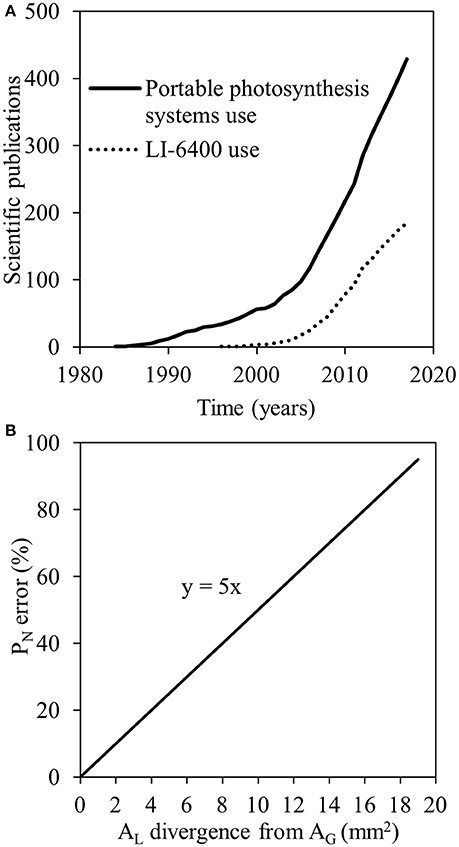
Figure 1. Numbers of scientific publications using portable photosynthesis systems (solid line) and LI-6400 (dashed line) based on searches performed in the Scopus database on January 08, 2018 (A); the error in net photosynthesis (PN) calculation when the actual area of the leaf enclosed in the leaf chamber (measured leaf area; AL) is deviating from internal gasket area (AG) but AL is by default considered equal to AG (20 mm2; B).
Over the last years, potential pitfalls of these off-the-shelf systems and ways to avoid them were displayed in literature to support a more precise quantification of photosynthetic parameters (e.g., Long and Bernacchi, 2003), for instance, the diffusional leakages of CO2 and H2O through the clamp-on leaf chambers (Flexas et al., 2007; Rodeghiero et al., 2007; Kitao et al., 2017), the air pressure changes in the leaf chamber (Jahnke and Pieruschka, 2006), the chamber response time (Weiss et al., 2009) and the overestimation of dark respiration rates because of the leaf chamber gasket shade effect (Pons and Welschen, 2002) were found to be contributing to errors when not considered in the estimation of leaf gas exchange parameters.
Gas exchange parameters (e.g., net photosynthetic rate [PN] and stomatal conductance [gs]) in such photosynthesis systems are calculated as gas exchange rates per unit leaf area (e.g., LI-COR Inc., 2015). In small chambers (<10 cm2), the leaf area used by the system (as a default value) for these calculations is actually the internal gasket area (AG) provided that the leaf covers the entire AG (Long et al., 1996). Therefore, small chambers are suitable for plant species with planar leaves of surface area larger or equal to the AG. Completely filling the AG with a leaf eliminates the error associated with leaf area determination (Long et al., 1996). There are, however, plant species with leaves of surface area smaller than the AG of the smallest widely-used chambers available. For example, small-leaf monocotyledonous species (e.g., wheat) or dicotyledonous species (e.g., Arabidopsis) are hard to be measured even in such small leaf chambers. Even though narrow leaf chambers have been developed, measuring errors have been found when the latter are used because of the edge effects degrading the light field and air flow (Long et al., 1996). Due to the large errors that can derive when neglecting the correction for leaf area in small leaf gas exchange measurements (Figure 1B; Long et al., 1996), there is a great necessity for the precise quantification of the leaf area enclosed in the leaf chamber and thus measured for photosynthesis (measured leaf area; AL).
Different techniques were suggested in the past to measure AL but they were either destructive and time-consuming (LI-COR Inc., 2015), or they are applicable only for rectangular chambers (Long et al., 1996). Gas exchange chambers are available in a variety of shapes, dimensions and functional capacity. Leaf chamber fluorometer 6400-40 (LI-COR Biosciences, Lincoln, NE) is a circular chamber that is widely-used since it is the only available one to simultaneously measure gas exchange and chlorophyll fluorescence using LI-6400. Consequently, in this report we present two inexpensive and non-destructive techniques that can be used to quantify smaller-than-gasket leaf area for leaf gas exchange measurements in circular chambers (or in chambers of other shapes after adjustments).
Methods
Plant Material and Growth Conditions
Seeds of maize (Zea mays L. inbred line B73), barley (Hordeum vulgare L. cultivar “Morfo”), hard wheat (Triticum turgidum L. subsp. durum cultivar “Ourania”) and soft wheat (Triticum aestivum L. cultivar “Gavdos”) plants were sown in plastic pots (0.52 l volume) with potting soil (Plantaflor® potting soil, DE) and 20 germinated seedlings (one per pot) per species were grown in a climate room at 24/22°C day/night air temperature, 55–65% relative humidity and ~400 μmol mol−1 ambient CO2 concentration. During growth, plants were illuminated by fluorescent tubes at a photosynthetic photon flux density of ~100 μmol PAR m−2 s−1 during 16 h photoperiod. All the measurements were performed on the first true leaf 2 weeks after germination.
Photosynthetic Measurements
The measurements of leaf gas exchange, gs and PN, and operating efficiency of photosystem II (ΦPSII; Baker, 2008) were performed using a portable gas exchange system LI-6400XT (LI-COR Biosciences, Lincoln, NE, USA) combined with a leaf chamber fluorometer 6400-40 (LI-COR Biosciences, Lincoln, NE). Intrinsic water use efficiency (iWUE) was then calculated as the ratio between PN and gs. Microclimatic conditions were adjusted in the leaf chamber to be similar with those of the growth environment. Light intensity in the leaf chamber was set at 100 μmol m−2 s−1 in all cases, while spectral quality was set at 90/10% red/blue light mixture. Leaf chamber temperature was stable at 24°C and the CO2 reference concentration was 400 μmol mol−1. Relative air humidity was controlled at ~60%. All measurements were carried out inside the growth rooms. In total, ten plants were used for gas exchange measurements per plant species. The midrib of the part of the middle leaf blade measured was placed in the center of the leaf chamber (Figure 2a) to allow the precise forthcoming quantification of AL. The above measurements were repeated in the same environment on dead (dried) leaves of every species to identify and correct for possible effects of AL on CO2 diffusional leakage.
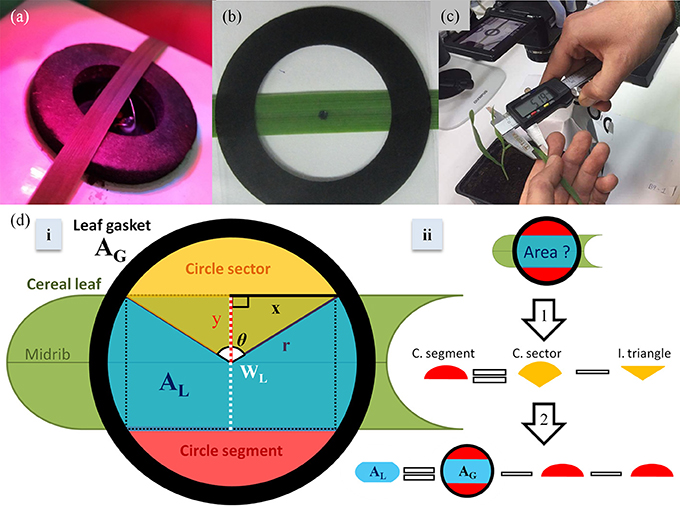
Figure 2. A wheat leaf smaller than the leaf gasket internal area (a); The impression of the leaf chamber used to image and quantify measured leaf area (iAL; b); measurement of leaf width in wheat plants using an electronic caliper (c); a scheme of the concept based on which the equation for calculating measured leaf area (wAL) based on leaf width (WL) was built (d). Under the assumption that the empty space created by the enclosure of a cereal leaf with leaf width (WL) smaller than the internal gasket diameter (2r) in the middle of the chamber is creating two equal circle segments (ii), the wAL will be equal to the internal gasket area (AG) minus the two empty circle segments (ii). Considering that AG is known and that the circle segment is a part of a circle sector that is comprised of a circle segment and an isosceles triangle (i), the circle segment area can then be calculated by the subtraction of the isosceles triangle from the circle sector (ii: arrow 1). The circle sector area and the isosceles triangle area can be calculated based on known dimensions (y = WL/2, r and x) and the angle θ (i).
Leaf Area Measurements
AL was quantified using (i) imaging in combination with an image processing program (image-based AL; iAL) and (ii) estimated based on a single leaf width (WL) measurement and geometry (width-based AL; wAL).
Image-Based Technique
Exact impressions of the chamber gasket (Figure 2a) were designed in Microsoft® Powerpoint™ and printed on transparent film (Figure 2b). Outside the impression, a black bar of known distance (1 cm) was printed to later allow the scale setting in the software used. Following leaf gas exchange measurements, the leaf was taken out of the leaf chamber and horizontally but gently placed below the impression and above a white paper sheet to allow contrast for the image processing. Caution was taken to firstly leave the plant and the measured leaf undamaged and secondly position the part of the leaf measured in LI-6400XT at the exact same place under the impression (Figure 2b). The measured part of the leaf blade including the gasket impression were imaged (Figure 2b) and the image was processed using ImageJ (open access software, version 1.50b) as described below.
Image processing steps: (1) A selected image is opened in ImageJ, (2) the “straight line” tool is selected and then a straight line is drawn along the black scale bar of the image, (3) a scale is set by selecting “analyze” and then “set scale,” (4) in the newly opened window the value 1 (cm) is typed as a “known distance,” (5) after clicking “ok,” the “freehand selections” tool is selected and a freehand line is drawn forming a shape that is carefully and tightly enclosing only the part of the leaf area included in the black circle formed by the impression of the leaf gasket (Figure 2b), (6) iAL is quantified by selecting “analyze” and then “measure,” (7) the value (in cm2) then appears in a new window.
Leaf Width-Based Technique
wAL estimation was based on the AG, the leaf surface geometry and WL. It was assumed that the two margins of a monocot leaf surface are parallel straight lines with equal distance from the main leaf midrib (y; Figure 2d). Based on this assumption, a monocot leaf inserted and positioned in the center of the circular leaf chamber, that has a Wleaf smaller than the internal diameter of the chamber, will cover only a part of AG shaping in that way two equal unfilled (by the leaf) circle segments (Figure 2d). wAL can therefore be easily quantified by subtracting the two unfilled circle segments from AG. AG is known (e.g., for 6400-40 Leaf Chamber Fluorometer is 2 cm2). The area of the circle segment can be quantified when the latter is considered a part of a circle sector (Figure 2d). The circle sector is comprised of the circle segment and an isosceles triangle created by the two equal straight lines (i.e., radius) connecting the two angles of the circle segment with the center of the circle. The area of the circle sector can be quantified using the equation:
Where r is the radius of the circle, θ is the central angle of the sector and π is the mathematical constant (π = 3.14159).
r can be calculated using the equation:
θ, the central angle of the circle sector can be calculated using the following reasoning: y is the straight line connecting the center of the circle with the middle of the straight line shaping the circle segment (i.e., leaf margin; Figure 2d) and therefore, y is a known (measurable) distance as it is the half of WL. Additionally, y is the adjacent (to θ/2 angle) side of the two identical right-angled triangles shaped by r (i.e., hypotenuse), y, and x which is the opposite (to θ/2 angle) and the half of the length of the enclosed leaf margin (Figure 2d). θ/2, the angle produced by y and r, is actually the half of the central angle of the circle sector, can then, be calculated based on y and r using the following equation:
Therefore, θ is calculated using the following equation:
This isosceles triangle is comprised of two identical right angled triangles of known dimensions. Therefore, the area of the triangle can be calculated using the following equation:
After calculating the circle sector area using r and θ (Equation 1), circle segment area can be calculated by subtracting the area of the isosceles triangle from the total circle sector area (Equation 6; Figure 2d).
wAL can then be calculated by subtracting the two identical unfilled circle segments from AG (Figure 2d). Substituting r and θ with their equation equivalents (see Equation 2 and Equation 4 respectively) and y with WL/2 to have only known parameters in a final wAL equation (e.g., in this study, AG equals 2 cm2), wAL can be calculated when measuring only WL by the following equation:
WL was quantified at the middle of the segment of the enclosed leaf blade (Figure 2d) using an electronic caliper (31C628, TOPEX, PL; measurement accuracy 0.01mm; Figure 2c). The relation between WL and wAL is curvilinear (Figure 3F).
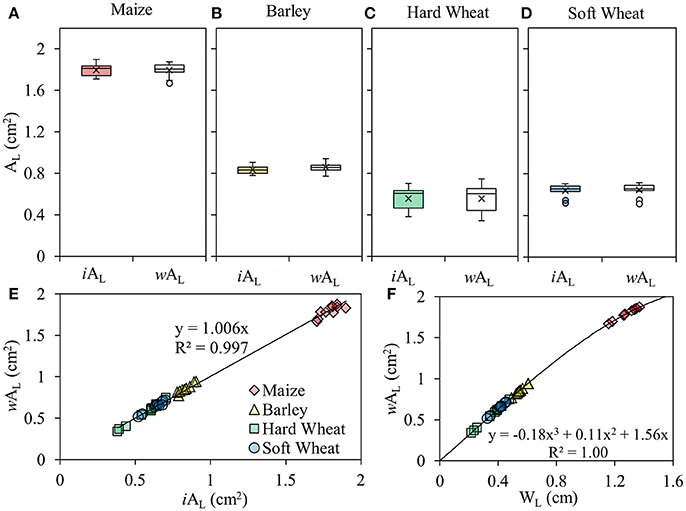
Figure 3. Box plots of the leaf area included in the leaf gasket during photosynthesis measurements (AL) measured using an image-based approach (iAL) and estimated using a leaf width–based approach (wAL) of maize (A), barley (B), hard wheat (C) and soft wheat leaves (D) (P < 0.05; n = 10). The lower and upper part of the boxes give the estimated 25 and 75th percentile, the horizontal line through the box indicates the median value, the x markers indicate the mean of the sample, the top of upper whisker indicates the maximum value of the sample and the bottom of the lower whisker indicates the minimum of the sample; the linear relation between the wAL and iAL (E); the curvilinear relation between the WL and wAL (F).
Despite the measurements on the middle blade that were related to the photosynthetic parameters measured in this study, AL quantification using both the techniques was performed in different positions along the leaf blade to investigate whether wAL can be successfully used not only on the middle leaf blade but along the leaf regardless the changes in leaf shape.
Statistics
The data were analyzed using the statistical analysis software package IBM SPSS Statistics 20 (IBM Corporation, US). A paired t-test was used to compare the iAL and wAL (P < 0.05). The samples compared were tested for normality using Shapiro-Wilk test (P < 0.05). Two-way analysis of variance (ANOVA) and post hoc Tukey's honestly significant difference (HSD) multiple comparison tests (P < 0.05) were used to evaluate statistically significant effects (P < 0.05) of (1) the factors “plant species” and “position on the leaf” and their interaction on the divergence between wAL and iAL and (2) the factor “plant species” and the covariate “iAL” and their interaction on ΦPSII. One-way analysis of variance (ANOVA) and post hoc Tukey's honestly significant difference (HSD) multiple comparison tests (P < 0.05) were used to evaluate statistically significant differences on the PN, gs, ΦPSII and iWUE between the species studied.
Results
Measured Leaf Area
The AL of the monocotyledonous species studied has been measured using a standard image-based approach (iAL) and estimated using a leaf width-based approach (wAL; Equation 7). iAL and wAL did not show any significant differences between them in maize (Figure 3A), barley (Figure 3B), hard wheat (Figure 3C) and soft wheat (Figure 3D). Based on these results, a strong linear relation (Y = 1.006X, R2 = 0.997) was developed between iAL and wAL when the data points from all the species used in this study were included (Figure 3E).
Similar results were obtained when the wAL was tested in comparison with iAL along the monocotyledonous leaf in all species studied (Figure 4). The divergence of wAL from iAL did not exceed ±5% and was not significantly influenced by the plant species (P = 0.265) or the position of the measurement on the leaf (P = 0.244), while no interaction was found between the factors “species” and “position on the leaf” (P = 0.480; Figure 4A). Based on these results, a strong linear relation (Y = X, R2 = 1) was developed between iAL and wAL when the data points from all the species and the positions on the leaf were incorporated (Figure 4B).
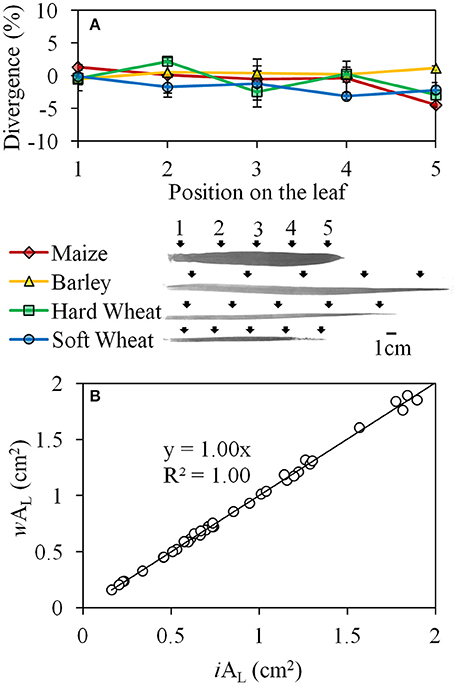
Figure 4. The divergence (%) of wAL from iAL when AL was quantified on five different positions (black arrows) along the leaves of maize, barley, hard and soft wheat (A); the linear relation between iAL and wAL when the data points from all the species and the positions on the leaf were incorporated (B). Error bars indicate the standard error.
Photosynthetic Parameters
The photosynthetic parameters have been corrected for AL using the iAL and not both iAL and wAL due to the similar results obtained when using either the image- or the leaf width-based technique. As expected, the level of misestimation of leaf gas exchange parameters when iAL was not considered in their calculation was larger (Figures 5A,B) the smaller the iAL (Figures 3A–D). The difference observed between the iAL-corrected and not iAL-corrected values of PN (Figure 5A) and gs (Figure 5B) was larger for the small-leaf species (i.e., soft wheat>hard wheat>barley) and the smallest for maize. The actual (i.e., iAL-corrected) PN was significantly lower in barley when compared with other species (Figure 5A), while the actual gs was significantly the highest in soft wheat, lower in hard wheat and barley and the lowest in maize (Figure 5B). The iWUE was significantly higher in maize in comparison with all other plant species examined (Figure 5C). The ΦPSII was significantly lower in maize (0.67) in comparison with all other plant species examined (0.71; Figure 5D). No significant effects of iAL were observed on ΦPSII (P = 0.083).
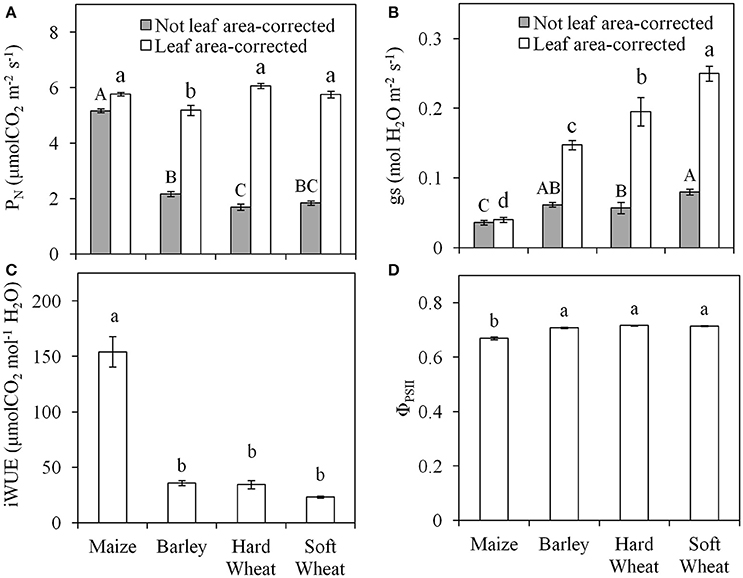
Figure 5. The values of net photosynthetic rate (PN; A) and stomatal conductance (gs; B) when not-corrected for the leaf area measured (gray bars) and when corrected for leaf area measured (white bars); intrinsic water use efficiency (iWUE= PN/gs; C) and operating efficiency of photosystem II (ΦPSII; D) of the first true leaf of maize, barley, hard, and soft wheat. Different letters indicate significant differences (P < 0.05; n = 10). Error bars indicate the standard error.
The level of the CO2 diffusional leaks observed when CO2 exchange was quantified without including a leaf in the leaf chamber (i.e., empty chamber) was not significantly different from the levels measured when dried leaves from each of the plant species studied were inserted in the leaf chamber (P = 0.22; Figure S1a). Additionally, CO2 diffusional leaks were not significantly correlated with AL across the species (P = 0.12; Figure S1b).
Discussion
Image-Based Technique
Imaging techniques have a key role in plant phenotyping (Li et al., 2014). In this study, a simple and standard (in terms of image processing) imaged-based technique has been used to assist accurate leaf gas exchange measurements of narrow leaves in important cereal crop species using the portable photosynthesis system LI-6400XT. Even though the leaf chamber fluorometer 6400-40 was used here, the technique can be adjusted for measurements using different leaf chambers and photosynthesis systems by just adjusting the gasket impression respectively. The use of a gasket impression enabled a non-destructive approach that can securely replace destructive methods (e.g., LI-COR Inc., 2015). The use of a freeware, like ImageJ, for image processing and area quantification reflects a low-budget technique. Last but not least, this technique can be used to quantify AL on leaves of various shapes and sizes. Consequently, the image-based technique allows the quantification of leaf gas exchange parameters on every edge of a leaf.
Leaf Width-Based Technique
The shape of the leaves of cereal plants is simple and thoroughly described in literature (Arber, 1923). Grass leaves consist of a sheath, a ligule and a blade. Blades, representing the main photosynthetically active leaf part, are long and narrow and they are usually linear to lanceolate (Sylvester et al., 2001). The leaf shape, even though not largely influenced by the growth conditions, is highly dependent on the genotype and ontogeny (Sylvester et al., 2001; Dornbusch et al., 2011).
The leaf width-based technique developed in this study is applicable along the leaf and for all the genotypes tested despite the longitudinal and species-related differences in leaf shape (Dornbusch et al., 2011). Supported by these results, the single WL measurement through the center of the circular leaf gasket was adequate for the precise wAL quantification based on the equation developed (Equation 7).
A similar approach was suggested in the past (Long et al., 1996), but it is possibly effective only when measuring with a rectangular leaf chamber. According to Long et al. (1996), if the leaf shape allows the user to assume that the enclosed tissue forms a trapezium, then the area enclosed may be determined simply by measuring the leaf widths (i.e., trapezium bases) at each end (Long et al., 1996). However, in the case of a circular gasket, the enclosed tissue does not form a simple trapezium but a compound shape that it is more like a combination of a rectangle or trapezium with its two bases attached to circle segments. Therefore, adopting the leaf width-based technique instead of the “single trapezium” theory for circular gaskets would result in avoiding an underestimation of AL.
For the equation development, it was assumed that the two margins of a monocot leaf surface are parallel straight lines with equal distance from the main leaf midrib. In reality, the two margins of the leaf blades of the cereals tested are not straight lines and definitely not parallel (Dornbusch et al., 2011). However, the equation developed based on WL can be successfully applied in both the cases (i.e., parallel or not) and the reason is simply that WL represents the median (i.e., the parallel line segment half-way between the two bases) for both a rectangle and a trapezium. Considering the latter statement, the area of a rectangle and that of a trapezium depends only on their median and height (i.e., the distance between the two bases). The area of a rectangle and that of a trapezium with equal median and height will be equivalent. Consequently, at a constant WL, width changes at the two edges of the enclosed leaf tissue will not be influential for AL. This seems to be the reasoning behind the successful application of the leaf width-based technique along the leaf blade and across grass species.
Correction for Leaf Area in Photosynthetic Parameters
The quantification of AL and the subsequent correction of leaf gas exchange parameters for AL provided a precise quantification of PN and gs especially with decreasing AL. Under the conditions studied, maize showed the highest PN, the lowest gs and therefore the highest iWUE in agreement with the statement that C4 plants, like maize, have a higher iWUE than C3 plants, like wheat and barley (Taylor et al., 2010). The higher iWUE may be either due to lower gs only (Taylor et al., 2010) or due to both higher PN and lower gs in C4 species compared to C3 species (Kocacinar, 2015) something that was also observed in this study. ΦPSII was significantly lower in maize than in the other species studied. ΦPSII at a given photosynthetic photon flux density provides an estimate of the quantum yield of linear electron flux through photosystem II (Baker, 2008) and can be different between C3 and C4 species depending on the growth conditions (Oberhuber et al., 1993; Wang et al., 2015). Additionally, no effects of AL on ΦPSII were detected suggesting that chlorophyll fluorescence parameters are not influenced when the leaf gasket is not completely covered by the leaf.
Changes in AL and the plant species did not have any significant effects on the diffusional CO2 leakages through the leaf chamber under the conditions used in this study. This may be due to the fact that the CO2 gradient between the chamber and the surrounding air was rather small because the measurements took place under controlled - similar to the growth room - conditions. It is known that major diffusional leakages are significant at large CO2 gradients and that they are species-dependent (Flexas et al., 2007).
Conclusions and Future Perspectives
This study provides a practical, inexpensive and non-destructive solution to researchers dealing with photosynthesis measurements on small-leaf plant species. The image-based technique can be widely used for quantifying AL in many plant species despite their leaf shape. Additionally, the technique can be easily adjusted for measurements using leaf chambers of other shapes (e.g., rectangular) by just adjusting the gasket impression respectively. Image analysis for leaf area determination is being widely and frequently used in studies (e.g., Bylesjö et al., 2008; Maloof et al., 2013). We have here used a very easy but time-consuming way to extract AL from image analysis using ImageJ. Future studies may accelerate AL determination by adopting image analysis tools (or their principles), especially developed for leaf size determination (e.g., Bylesjö et al., 2008; Maloof et al., 2013). The leaf width-based technique can be securely used for AL quantification in cereal crop species such as maize, wheat and barley along the leaf, when the latter is enclosed in circular chambers. The latter can be considered as a faster and easier-to-apply (it is based on a single leaf width measurement) than the image-based technique. However, its application is restricted to leaves with shape similar to that of the cereals tested. Regarding potential diffusional leaks, future studies aiming to quantify, for example, the response of net photosynthesis to leaf internal CO2 (i.e., A-Ci curves) or gas exchange responses to vapor pressure deficit should consider quantifying possible effects of AL and leaf structure on CO2 and H2O leakages from and to the leaf chamber (e.g., Flexas et al., 2007; Kitao et al., 2017).
Author Contributions
AS designed and performed the experiments, did the statistics and wrote the manuscript. VF read and commented on the manuscript. AS and VF revised the manuscript.
Conflict of Interest Statement
The authors declare that the research was conducted in the absence of any commercial or financial relationships that could be construed as a potential conflict of interest.
Acknowledgments
We are grateful to Dr. Angelos Kyratzis and the Agricultural Research Institute of Cyprus for providing us with the wheat and barley seeds and to Chrystalla Antoniou and Jan Pavlou for their assistance during the experiments.
Supplementary Material
The Supplementary Material for this article can be found online at: https://www.frontiersin.org/articles/10.3389/fpls.2018.00548/full#supplementary-material
Abbreviations
AG, internal gasket area; AL, measured leaf area; gs, stomatal conductance; iAL, image-based measured leaf area; PN, net photosynthetic rate; wAL, leaf width-based measured leaf area; WL, leaf width; ΦPSII, operating efficiency of photosystem II.
References
Apple, M. E., Olszyk, D. M., Ormrod, D. P., Lewis, J., Southworth, D., and Tingey, D. T. (2000). Morphology and stomatal function of Douglas fir needles exposed to cimate change: elevated CO2 and temperature. Int. J. Plant Sci. 161, 127–132. doi: 10.1086/314237
Baker, N. R. (2008). Chlorophyll fluorescence: a probe of photosynthesis in vivo. Annu. Rev. Plant Biol. 59, 89–113. doi: 10.1146/annurev.arplant.59.032607.092759
Bylesjö, M., Segura, V., Soolanayakanahally, R. Y., Rae, A. M., Trygg, J., Gustafsson, P., et al. (2008). LAMINA: a tool for rapid quantification of leaf size and shape parameters. BMC Plant Biol. 8:82. doi: 10.1186/1471-2229-8-82
Dornbusch, T., Watt, J., Baccar, R., Fournier, C., and Andrieu, B. (2011). A comparative analysis of leaf shape of wheat, barley and maize using an empirical shape model. Ann. Bot. 107, 865–873. doi: 10.1093/aob/mcq181
Flexas, J., Díaz-Espejo, A., Berry, J. A., Cifre, J., Galmés, J., Kaldenhoff, R., et al. (2007). Analysis of leakage in IRGA's leaf chambers of open gas exchange systems: quantification and its effects in photosynthesis parameterization. J. Exp. Bot. 58, 1533–1543. doi: 10.1093/jxb/erm027
Jahnke, S., and Pieruschka, R. (2006). Air pressure in clamp-on leaf chambers: a neglected issue in gas exchange measurements. J. Exp. Bot. 57, 2553–2561. doi: 10.1093/jxb/erl003
Kaiser, E., Morales, A., Harbinson, J., Heuvelink, E., Prinzenberg, A. E., and Marcelis, L. F. (2016). Metabolic and diffusional limitations of photosynthesis in fluctuating irradiance in Arabidopsis thaliana. Sci. Rep. 6:31252. doi: 10.1038/srep31252
Kitao, M., Harayama, H., and Uemura, A. (2017). A practical approach to estimate diffusional leakages of leaf chamber of open gas exchange systems using intact leaves. Plant Cell Environ. 40, 2870–2874. doi: 10.1111/pce.13032
Kocacinar, F. (2015). Photosynthetic, hydraulic and biomass properties in closely related C3 and C4 species. Physiol. Plant. 153, 454–466. doi: 10.1111/ppl.12240
Li, L., Zhang, Q., and Huang, D. (2014). A review of imaging techniques for plant phenotyping. Sensors 14:20078. doi: 10.3390/s141120078
LI-COR Inc. (2015). Calculating Irregular Leaf Area With the LI-6400XT Portable Photosynthesis System. Lincoln, NE: LI-COR Inc.
Long, S. P., and Bernacchi, C. J. (2003). Gas exchange measurements, what can they tell us about the underlying limitations to photosynthesis? Procedures and sources of error. J. Exp. Bot. 54, 2393–2401. doi: 10.1093/jxb/erg262
Long, S. P., Farage, P. K., and Garcia, R. L. (1996). Measurement of leaf and canopy photosynthetic CO2 exchange in the field. J. Exp. Bot. 47, 1629–1642. doi: 10.1093/jxb/47.11.1629
Maloof, J. N., Nozue, K., Mumbach, M. R., and Palmer, C. M. (2013). LeafJ: an ImageJ Plugin for Semi-automated Leaf Shape Measurement. J. Vis. Exp. 71:50028. doi: 10.3791/50028
Maxwell, K., and Johnson, G. N. (2000). Chlorophyll fluorescence—a practical guide. J. Exp. Bot. 51, 659–668. doi: 10.1093/jexbot/51.345.659
Niinemets, Ü., Berry, J. A., Von Caemmerer, S., Ort, D. R., Parry, M. A., and Poorter, H. (2017). Photosynthesis: ancient, essential, complex, diverse … and in need of improvement in a changing world. New Phytol. 213, 43–47. doi: 10.1111/nph.14307
Oberhuber, W., Dai, Z.-Y., and Edwards, G. E. (1993). Light dependence of quantum yields of Photosystem II and CO2 fixation in C3 and C4 plants. Photosynth. Res. 35, 265-274. doi: 10.1007/BF00016557
Pons, T. L., and Welschen, R. A. M. (2002). Overestimation of respiration rates in commercially available clamp-on leaf chambers. Complications with measurement of net photosynthesis. Plant Cell Environ 25, 1367–1372. doi: 10.1046/j.1365-3040.2002.00911.x
Rabert, C., Reyes-Díaz, M., Corcuera, L. J., Bravo, L. A., and Alberdi, M. (2017). Contrasting nitrogen use efficiency of Antarctic vascular plants may explain their population expansion in Antarctica. Polar Biol. 40, 1569–1580. doi: 10.1007/s00300-017-2079-2
Rodeghiero, M., Niinemets, Ü., and Cescatti, A. (2007). Major diffusion leaks of clamp-on leaf cuvettes still unaccounted: how erroneous are the estimates of Farquhar et al. model parameters? Plant Cell Environ. 30, 1006–1022. doi: 10.1111/j.1365-3040.2007.001689.x
Savvides, A., Fanourakis, D., and Van Ieperen, W. (2012). Co-ordination of hydraulic and stomatal conductances across light qualities in cucumber leaves. J. Exp. Bot. 63, 1135–1143. doi: 10.1093/jxb/err348
Savvides, A., Ntagkas, N., Van Ieperen, W., Dieleman, J. A., and Marcelis, L. F. M. (2014). Impact of light on leaf initiation: a matter of photosynthate availability in the apical bud? Funct. Plant Biol. 41, 547–556. doi: 10.1071/FP13217
Savvides, A., Van Ieperen, W., Dieleman, J. A., and Marcelis, L. F. M. (2013). Meristem temperature substantially deviates from air temperature even in moderate environments: is the magnitude of this deviation species-specific? Plant Cell Environ. 36, 1950–1960. doi: 10.1111/pce.12101
Sylvester, A. W., Parker-Clark, V., and Murray, G. A. (2001). Leaf shape and anatomy as indicators of phase change in the grasses: comparison of maize, rice, and bluegrass. Am. J. Bot. 88, 2157–2167. doi: 10.2307/3558377
Taylor, S. H., Hulme, S. P., Rees, M., Ripley, B. S., Ian Woodward, F., and Osborne, C. P. (2010). Ecophysiological traits in C3 and C4 grasses: a phylogenetically controlled screening experiment. New Phytol. 185, 780–791. doi: 10.1111/j.1469-8137.2009.03102.x
Tilman, D., Balzer, C., Hill, J., and Befort, B. L. (2011). Global food demand and the sustainable intensification of agriculture. Proc. Natl. Acad. Sci. U.S.A. 108, 20260–20264. doi: 10.1073/pnas.1116437108
Velez-Ramirez, A. I., Van Ieperen, W., Vreugdenhil, D., Van Poppel, P. M. J. A., Heuvelink, E., and Millenaar, F. F. (2014). A single locus confers tolerance to continuous light and allows substantial yield increase in tomato. Nat. Commun. 5:4549. doi: 10.1038/ncomms5549
Wang, M., Xie, B., Fu, Y., Dong, C., Hui, L., Guanghui, L., et al. (2015). Effects of different elevated CO2 concentrations on chlorophyll contents, gas exchange, water use efficiency, and PSII activity on C3 and C4 cereal crops in a closed artificial ecosystem. Photosyn. Res. 126, 351–362. doi: 10.1007/s11120-015-0134-9
Weiss, I., Mizrahi, Y., and Raveh, E. (2009). Chamber response time: a neglected issue in gas exchange measurements. Photosynthetica 47, 121–124. doi: 10.1007/s11099-009-0018-3
Zait, Y., Shapira, O., and Schwartz, A. (2017). The effect of blue light on stomatal oscillations and leaf turgor pressure in banana leaves. Plant Cell Environ. 40, 1143–1152. doi: 10.1111/pce.12907
Keywords: cereals, gas exchange, LI-6400, monocotyledonous, photosynthesis, stomatal conductance
Citation: Savvides AM and Fotopoulos V (2018) Two Inexpensive and Non-destructive Techniques to Correct for Smaller-Than-Gasket Leaf Area in Gas Exchange Measurements. Front. Plant Sci. 9:548. doi: 10.3389/fpls.2018.00548
Received: 17 January 2018; Accepted: 09 April 2018;
Published: 24 April 2018.
Edited by:
John Hancock, University of the West of England, United KingdomReviewed by:
Alejandra Navarro, Consiglio per la Ricerca in Agricoltura e l'analisi Dell'economia Agraria (CREA), ItalyGerhard Buck-Sorlin, Agrocampus Ouest, France
Copyright © 2018 Savvides and Fotopoulos. This is an open-access article distributed under the terms of the Creative Commons Attribution License (CC BY). The use, distribution or reproduction in other forums is permitted, provided the original author(s) and the copyright owner are credited and that the original publication in this journal is cited, in accordance with accepted academic practice. No use, distribution or reproduction is permitted which does not comply with these terms.
*Correspondence: Andreas M. Savvides, andreas.m.savvides@cut.ac.cy
Vasileios Fotopoulos, vassilis.fotopoulos@cut.ac.cy