
- Department of Biomedical Engineering, Columbia University, New York, NY, USA
A common approach used to fuse simultaneously recorded EEG and fMRI is to correlate trial-by-trial variability in the EEG, or variability of components derived therefrom, with the blood oxygenation level dependent response. When this correlation is done using the conventional univariate approach, for example with the general linear model, there is the usual problem of correcting the statistics for multiple comparisons. Cluster thresholding is often used as the correction of choice, though in many cases it is utilized in an ad hoc way, for example by employing the same cluster thresholds for both traditional regressors (stimulus or behaviorally derived) and EEG-derived regressors. In this paper we describe a resampling procedure that takes into account the a priori statistics of the trial-to-trial variability of the EEG-derived regressors in a way that trades off cluster size and maximum voxel Z-score to properly correct for multiple comparisons. We show that this data adaptive procedure improves sensitivity for smaller clusters of activation, without sacrificing the specificity of the results. Our results suggest that extra care is needed in correcting statistics when the regressor model is derived from noisy and/or uncertain measurements, as is the case for regressors constructed from single-trial variations in the EEG.
Introduction
It is becoming increasingly common to use single-trial EEG-derived values to model simultaneously acquired fMRI data. The combination of these two complementary neuroimaging modalities enables the variability of neural activity to be related to the blood oxygenation level dependent (BOLD) response (e.g., Debener et al., 2005; Benar et al., 2007; Goldman et al., 2009). Particularly exciting is that this type of fusion of modalities exploits variability that is not observable via behavioral responses, and thus provides a window into latent states of the human brain.
Many efforts combining simultaneous EEG and fMRI in this way employ the general linear model (GLM; Worsley and Friston, 1995). The GLM is a univariate approach which, when applied to massive datasets such as fMRI, requires correcting the statistics for multiple comparisons in order to properly perform hypothesis testing. The issue of multiple comparison correction has been addressed extensively in the literature and there are a number of procedures that have been adopted, both for fMRI analysis alone (Genovese et al., 2002; Nichols and Hayasaka, 2003) and for simultaneous EEG/fMRI (Debener et al., 2005; Eichele et al., 2005; Benar et al., 2007; Esposito et al., 2009; Goldman et al., 2009; Mayhew et al., 2010; Mulert et al., 2010; Scheibe et al., 2010; Novitskiy et al., 2011).
One concern that is specific to using the variability of EEG-derived regressors is the added uncertainty in the “interpretation” of the resulting statistics within the context of statistical parametric maps. This can be easily seen if we consider the sources of uncertainty for different types of regressors. In conventional fMRI, regressors might be constructed based on the timing of the stimulus presented to the subject (see Figure 1A). We know the times exactly and we have reason to believe that these times are relevant to the activity in the brain. The amplitudes of the regressor events are constant so there is no uncertainty in terms of their magnitude – i.e., a constant scale would not change the GLM analysis. We could also construct regressors derived from behavioral measures, such as response time (RT), and though this may vary across trial and subject, we can measure RTs very accurately and thus measurement noise is low. However there is additional uncertainty in the interpretation of the amplitude variations. For example a long RT (e.g., high amplitude on a trial) might be caused by attentional lapses, natural alertness fluctuations, or additional neural processing for increasing decision confidence. Thus, compared to the case in Figure 1A, the behavioral regressor in Figure 1B could be seen as having greater uncertainty.
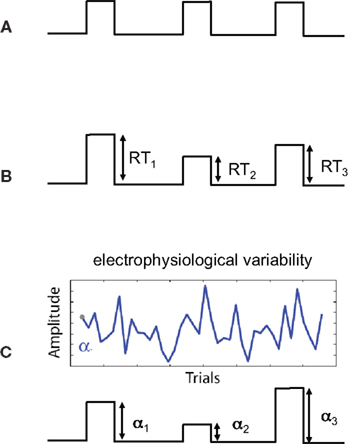
Figure 1. Sources of uncertainty in different regressor models. Shown are three regressor types (before convolution with the hemodynamic response function). (A) Regressor constructed from the onset times of the stimulus. The high certainty in this type of regressor is a result of stimulus times being set by the experiment and measured exactly. There is no uncertainty in the interpretation of amplitudes since they are constant. (B) Regressor constructed by modulating the stimulus onset times by response times (RTs). Measurement noise of RTs is low (i.e., RTs are high SNR measurements) however there is additional uncertainty (relative to case A) in terms of the interpretation of the trial-by-trial variations in response time. (C) Regressor constructed by modulating stimulus by activity derived from electrophysiological variability. Sources of uncertainty include both measurement noise, due to the low SNR of the signal, as well as the interpretation of the trial-to-trial electrophysiological variability.
When constructing regressors derived from EEG variability (Figure 1C), we must consider a number of factors affecting our uncertainty. One is related to the noise in the measurements – i.e., EEG has roughly a −20 dB signal to noise ratio (SNR; Parra et al., 2008). Thus we have measurement noise that is greater than for the cases seen in Figures 1A,B. Secondly, there is the interpretation of the meaning of the EEG-derived variability. We might hypothesize that the variability relates to attentional modulation, workload, perceived error strength, etc., but this too is a hypothesis with its own noise/uncertainty – similar to the issue for the RT derived regressor of Figure 1B.
In order to take the uncertainty in the prior into account, we could resample from the prior distribution to construct our null hypothesis (H0). There are many ways to resample or bootstrap (e.g., for a review of techniques in signal processing see (Zoubir and Iskander, 2007). One of the simplest is to draw samples from a distribution of the noise by permuting or randomizing the EEG-derived variability. In previous work we used a simple resampling procedure to compute cluster thresholds for correcting for multiple comparisons (Goldman et al., 2009). However this method for estimating a cluster size threshold was limited because it sacrificed sensitivity for overly conservative specificity. Here we expand this work to a more exhaustive search of the parameter spaces by developing a better representation of the relationship between characteristics of the data. This enables us to maintain both sensitivity and specificity over a range of cluster sizes.
We present these results for two such characteristics: cluster size and maximum z-score within a cluster. We use the relationship between them to correct for multiple comparisons by trading-off z-score for cluster size. Specifically, we propose a resampling technique, adapted to the noise distribution of the single-trial EEG-derived regressors, that enables increased sensitivity by identifying significance values that are a joint function of cluster size and maximum z-score – i.e., enables us to construct the null hypothesis H0 and set a joint threshold to test significance. This approach increases sensitivity by allowing smaller clusters having higher z-score, while maintaining specificity.
Materials and Methods
The data used in this study are taken from Goldman et al. (2009). Detailed methods of subjects, paradigm, data acquisition, and single-trial analysis are given there (Goldman et al., 2009). In brief, simultaneous EEG and fMRI data were acquired for 11 healthy normal subjects (six female, mean age 31, range 25–38) during an auditory oddball paradigm. Informed consent was obtained from all participants in accordance with the guidelines and approval of the Columbia University Institutional Review Board.
Subjects listened to standard (frequency 350 Hz, probability of occurrence 0.8) and oddball tones (frequency 500 Hz, probability of occurrence 0.2). Subjects were instructed to respond with a button press to the target oddball tone. There were a total of 50 target and 200 standard trials for each subject.
EEG was acquired simultaneously with fMRI using a custom-built MR-compatible system using 36 bipolar twisted pair electrodes sampled at 1 kHz (Goldman et al., 2005; Sajda et al., 2007) in a 1.5-T scanner (Philips Medical Systems, Bothell, WA, USA). Whole brain functional EPI data were acquired with 15 axial slices (TE = 50 ms; TR = 3000 ms; matrix = 64 × 64 voxels, 3.125 mm in-plane resolution, 8 mm thickness). EEG pre-processing included a 0.5-Hz high-pass filter, 60 and 120 Hz notch filters, and gradient artifact removal (mean subtraction as well as 10 ms median filter). BCG artifacts were removed by principal component analysis (PCA) by first estimating the principal components on data after high-pass filtering at 4 Hz and then applying these estimates to the original EEG. The EEG data was epoched into trials in two ways: stimulus-locked (SL, aligned to the onset of the tone) and response-locked (RL, for the target tones, they were aligned to the subject’s button press and for the standard tones they were randomly chosen from the RT distribution of the target tones). Individual subject single-trial analysis of EEG was then performed via logistic regression to discriminate between the EEG responses to two classes of stimuli (targets and standards) within consecutive 50 ms training windows. The output of this process is a discriminating component, y, specific to that trial and discriminating window, where y represents the distance to the discriminating hyperplane (Parra et al., 2002; 2005; Goldman et al., 2009). The amplitudes of the resulting discriminating components within the training window for each SL and RL window were then used to model the BOLD response on a single-trial basis. Figure 2 illustrates our approach, mapping from trial-to-trial variability in EEG components to fMRI regressors (in this case using time windows of 200 and 350 ms post-stimulus).
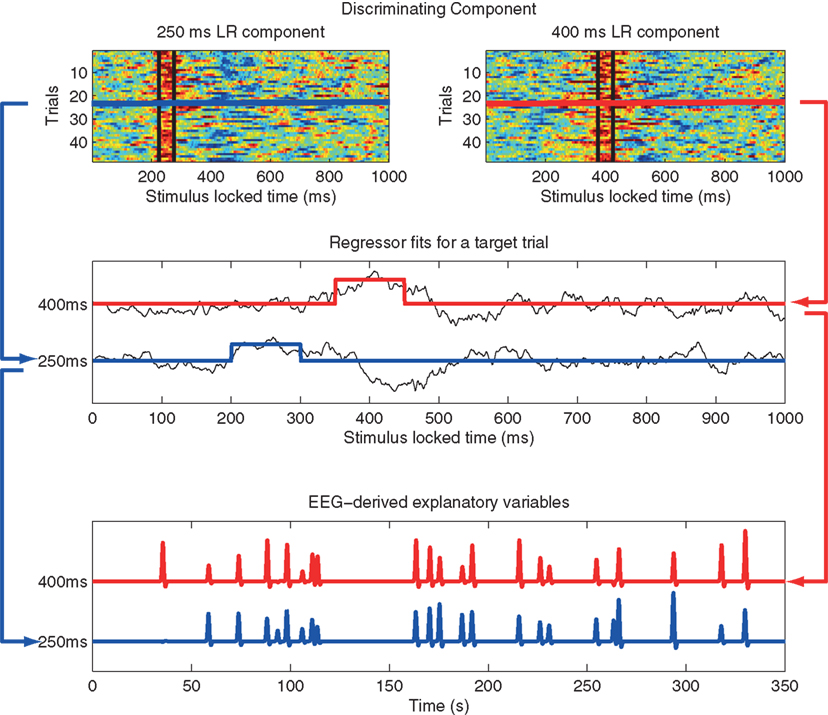
Figure 2. Method used to construct fMRI regressors from EEG component trial-to-trial variability. Top: y-values for all target trials of the single-trial EEG discriminator for two stimulus-locked windows. Data between black vertical bars indicates those y-values used in the analysis. In this example the window width is 50 ms, with one window centered at 200 ms and the other at 350 ms post stimulus-onset. Hot to cold color scale indicates high likelihood to low likelihood for a target. Middle: y-value for a single target trial for each of the two components (black curves), showing the fMRI event model amplitude as the average of the discriminator output within each 50 ms window, with one modulated event shown for 200 ms (blue) and 350 ms (red). Bottom: Single-trial fMRI regressor for target trials across the entire session for the 200 and 350 ms windows, shown after convolution with the hemodynamic response function. Note that the event timing for each of the two windows is the same, but the event amplitudes are different. A separate fMRI analysis is run for each window, using that window’s single-trial output to model single-trial variability. Figure from Goldman et al. (2009).
Resampling
Our goal in the resampling was to maintain the overall distributions of the EEG discriminating components (y-values) for target and standard trials while removing the specific trial-to-trial correlations in the individual experimental runs. To this end, we constructed two empirical distributions (one for “target y-values” and one for “standard y-values”) by pooling the y-values for each condition across all subjects and runs. To best demonstrate the contribution of the trial-to-trial variability, we constructed our empirical distributions using y-values from only behaviorally correct trials and computed from a time window (450 ms SL) which yielded both substantial discrimination in the EEG (across subject, average Az > 0.75; Figure 2 in Goldman et al., 2009) as well as significant correlation in the fMRI (p < 0.005 and cluster corrected for comparison of <73 voxels; Figure 2 in Goldman et al., 2009).
Given these empirical distributions, we constructed a “resampled run” by taking the ordered vector of targets and standard trials (250 trials per subject, with 50 targets and 200 standards intermixed) and drew randomly, without replacement, from the distribution corresponding to the label of that trial. Thus for a resampled run, all trials were drawn from the distribution with the correct “label” (target or standard) however the specific y-value was mixed between trials, runs and subjects. All subjects had the same resampled run y-values for a given iteration, though the resulting regressors for each subject were different given that the each had a random sequence of target and standard trials. This entire procedure was repeated 100 times, yielding 100 resamplings of the entire data set (run, subject, group). These procedures allowed us to construct the null hypothesis H0, and establish a joint threshold on cluster size and max z-score (see below).
fMRI Analysis
For each of the 100 resampled iterations, a full three-level analysis (run, subject, group) was performed. Standard fMRI pre-processing was performed: slice-timing correction, motion correction, spatial smoothing at 8 mm full-width at half-maximum, and high-pass filtering at 0.01 Hz. Our design matrix included 11 regressors, six of which related to the degrees of motion correction. Of the remaining five regressors (which were convolved with a double-gamma hemodynamic response function), two were a traditional event-related model of target and standard tones (onset at the time of stimulus presentation, duration 100 ms, amplitude of 1), one represented the RTs (with onset at the time of stimulus presentation, duration 100 ms, amplitude corresponding to RT), and the final two regressors modeled the amplitude variability of the single-trial discriminating component (onset time at window time, duration 100 ms, amplitude given by the single-trial EEG discriminator y-value) and were orthogonalized to the traditional target and standard regressors. These single-trial regressors allowed us to examine the BOLD signal related to the variation in the resampled single-trial EEG discriminating component values. Specifically, we looked at the cluster outputs from the resampled single-trial target and standard regressors.
One-Dimensional Thresholds
All clusters that exceeded minimal thresholds [cluster size of 2 and z-score of 2.57 (per voxel p = 0.005)] from all 100 iterations were assembled for both positive and negative correlations for the resampled single-trial targets. Two characteristics of the resampled data were obtained: cluster size (number of voxels) and z-score (maximum value in cluster). The resampled data were sorted and thresholds were established based on the top 5% and top 1%. Canonical thresholds were also used: 10 voxel cluster size and 2.57 z-score. The results from the analysis of single-trial simultaneous EEG/fMRI from Goldman et al. (2009) were overlaid to examine those clusters that exceeded each of these thresholds.
Constructing Joint Thresholds
We developed an approach for increasing the sensitivity for smaller cluster sizes by constructing a significance threshold based on the joint distribution of cluster size and maximum z-score. Our approach was to identify a joint distribution, based on these two measures, that showed a strong positive linear correlation which could be used to construct a one-dimensional projection for thresholding which was a function of both dimensions. We found that the log cluster size versus 1 − (maximum p-value in the cluster) resulted in a strong linear fit (Pearson’s correlation coefficient r = 0.88) for all resampled clusters that exceeded the minimal thresholds [cluster size of 2 and z-score of 2.57 (per voxel p = 0.005)]. The projections of the resampled activations along this linear regression were sorted to obtain the maximal 5 and 1%. Significance thresholds (p = 0.05 and 0.01) were defined by orthogonal projections from this linear fit of the resampled activations. The results from the analysis of single-trial simultaneous EEG/fMRI from Goldman et al. (2009) were overlaid to examine those clusters that exceeded both of these thresholds.
Results
Statistics
There were 655 clusters with a per-voxel p < 0.005 that survived the minimum cluster threshold of two voxels in the resampled analysis. The mean cluster size was 14 voxels with a standard deviation of 18. The mean z-score within these clusters was 2.8 and the standard deviation was 0.14. The clusters from the resampled analysis were overlaid onto a standard MNI template brain volume to ensure that clusters of activation from resampling came from regions throughout the brain and did not represent the same cluster (data not shown).
Cluster Size Threshold
We examined the distribution of cluster sizes (number of voxels) for the resampled data and used these data to establish adaptive thresholds. The largest 1% (n = 6 of 655) of the resampled data had a cluster size that exceeded 94 voxels. The largest 5% (n = 32 of 655) of the resampled data clusters had a cluster size that exceeded 50 voxels. These thresholds were then applied to the clusters observed in the original data, which represent regions where BOLD signal correlated with either SL or RL single-trial EEG variability. The relationship between the resampled and original data is depicted in Figure 3. This figure indicates that there were only three clusters from the original data that exceeded the p < 0.01 resampled significance threshold of 94 voxels. Further, these three clusters were the only ones that exceeded the p < 0.05 resampled significance threshold of 50 voxels. Two of those activations were seen in the right lateral occipital cortex (Table 1, clusters 1 and 2). One cluster was found in the left postcentral gyrus (Table 1, cluster 3). Twenty-six percent (22 of 85) of the original clusters exceeded a canonical 10 voxel threshold. Thirty-seven percent (244 of 655) of the resampled clusters exceeded that canonical 10 voxel threshold.
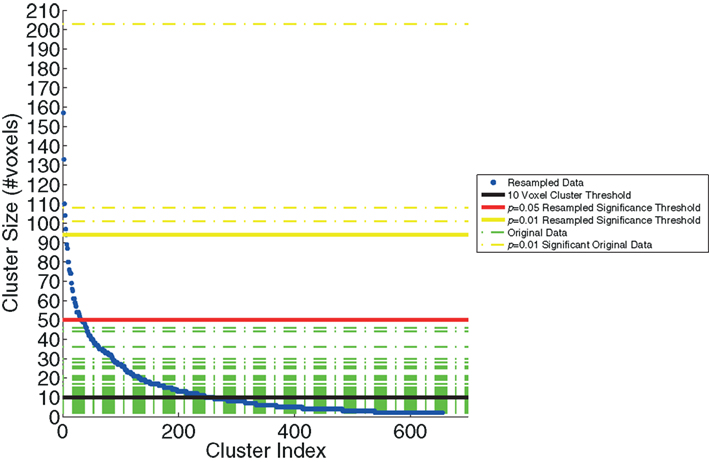
Figure 3. The resampling method, used to generate the threshold based on cluster size. The resampled data (blue) are sorted and plotted in increasing cluster size (number of voxels). Three significance thresholds are presented: 10 voxel canonical cluster threshold (black solid line), p = 0.05 resampled significance threshold (red solid line), and p = 0.01 resampled significance threshold (yellow solid line). Horizontal dashed lines show the cluster sizes of the original data from Goldman et al. (2009), both those below (green) and the three clusters that exceed (yellow) the resampled cluster size significance threshold (p < 0.01).
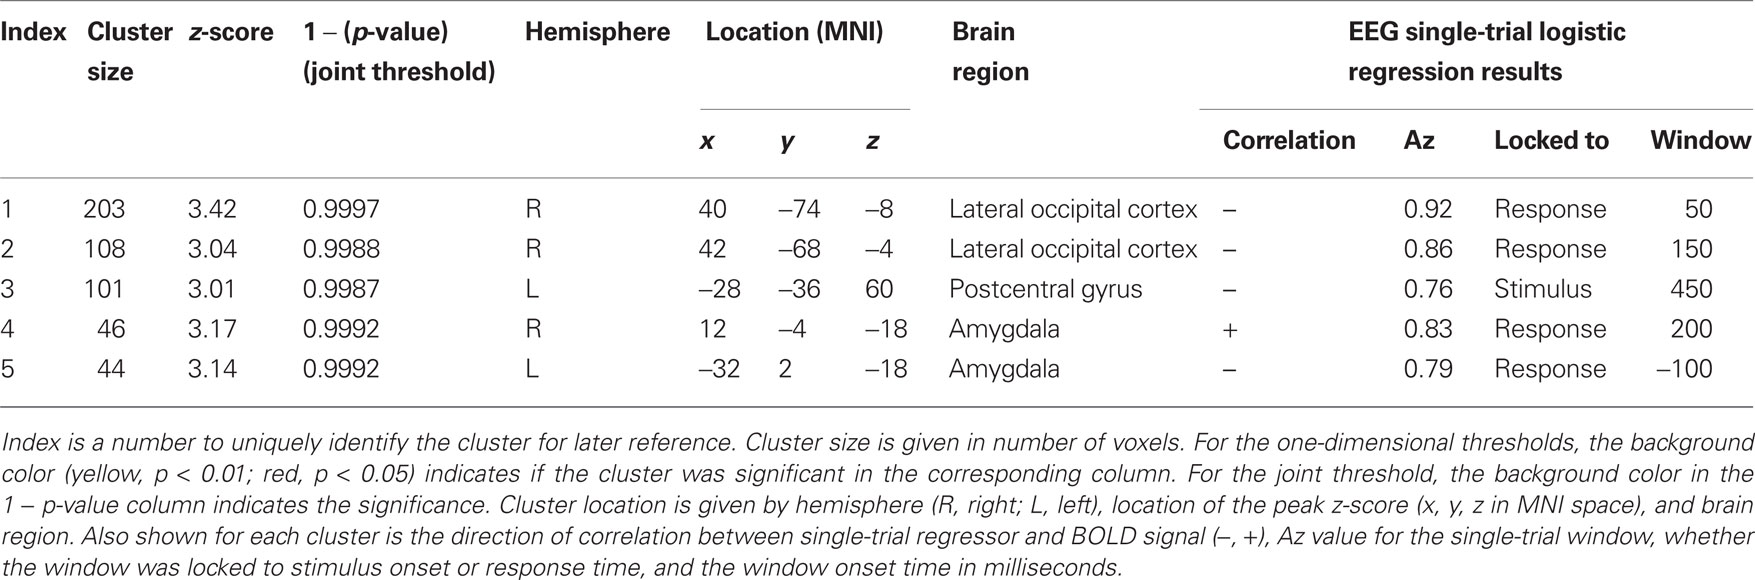
Table 1. Significant clusters of activation in the original data of Goldman et al. (2009).
Max Z-Score Threshold
We also plotted the distribution of maximum z-scores (the peak value within the clusters) for the resampled data and used these to establish adaptive thresholds. The upper 1% of the resampled data clusters had a z-score that exceeded 3.17, and the upper 5% had a z-score that exceeded 3.01. These thresholds were then applied to the z-scores from the original data. The relationship between the resampled and original data is depicted in Figure 4. This figure indicates one cluster that exceeds the p < 0.01 resampled significance threshold of z = 3.17. This cluster was located in the right lateral occipital cortex (Table 1, cluster 1). The figure also indicates three additional clusters that exceed the p < 0.05 resampled significance threshold z = 3.01. These clusters were located in the right lateral occipital cortex (Table 1, cluster 2), and bilaterally in the amygdala (Table 1, clusters 4 and 5).
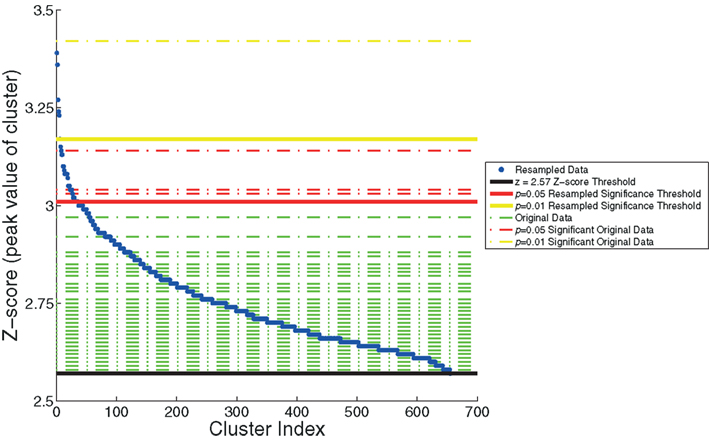
Figure 4. The resampling method, used to generate thresholds based on the maximum z-score within the cluster. The resampled data (in blue) are sorted and plotted in increasing z-score. Horizontal dashed lines of the z-scores of the original data are overlaid (in green). Three significance thresholds are shown: z = 2.57 threshold (black), p = 0.05 resampled significance threshold (red), and p = 0.01 resampled significance threshold (yellow). The dashed lines of the four clusters from the original data of Goldman et al. (2009), that exceed significance thresholds are colored accordingly: three for which p < 0.05 (red) and one for which p < 0.01 (yellow).
Joint Thresholds
The relationship between cluster size (log scale) and 1 − (p-value) for the resampled and original data is depicted in Figure 5. The linear regression visualizes the first principal component of the resampled data (n = 655). Significance values (p < 0.05 and <0.01) were determined by the projections to the regression line of the 32nd and 6th largest resampled data clusters along this first principal component. Significance thresholds, the orthogonal projections from regression line, intersected for p < 0.05 at a cluster size of 52 and a 1 − p-value of 0.998 [x05 = (52,0.998)] and for p < 0.01 at a cluster size of 88 and a 1 − p-value of 0.999 [x01 = (88,0.999)]. Two clusters from the original data exceeded p < 0.01 significance (clusters 1 and 2) and three additional clusters exceeded p < 0.05 significance (clusters 3, 4, and 5).
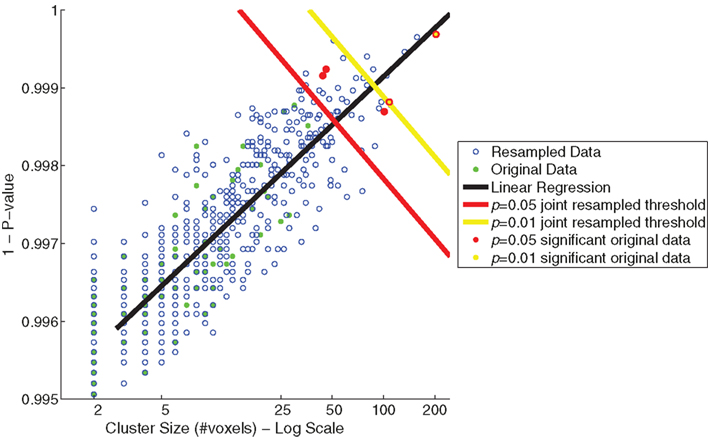
Figure 5. Joint thresholds of cluster size (log scale) versus p-value (maximum of cluster) from resampling methods. Shown are scatter plots of cluster size versus p-value of the resampled data (blue open circles) and the original data of Goldman et al. (2009; green filled circles). Two joint significance thresholds are shown: p = 0.05 resampled significance threshold (red), and p = 0.01 resampled significance threshold (yellow). Those clusters from the original data that exceed the joint significance thresholds are colored accordingly.
Discussion
Simultaneously acquired EEG and fMRI data offers the potential to investigate neural states with temporal and spatial precision that is not afforded by either method alone. However, while in traditional event-related fMRI the model is known with high certainty, explanatory variables defined by a measured quantity such as EEG introduce more uncertainty into the model. While it is becoming increasingly common to acquire multi-modal data, as yet there is no generally agreed upon method for analysis or interpretation of this data that takes the uncertainty of the model into account.
In this study, we used the data from Goldman et al. (2009), in which the single-trial variability derived from the EEG was used to construct BOLD fMRI regressors, to illustrate a resampling method for determining significance in single-trial EEG/fMRI data. With this method, we can correct for multiple comparisons by adaptively resampling the noise distribution of the EEG-derived regressors. This resampling method demonstrated an interaction between activated cluster size and local maximum z-score and showed that the joint distribution of the size of activation clusters and the maximum z-score found in the cluster can be used to establish significance thresholds that provide a proper trade-off of sensitivity and specificity. Principled methods for trading-off spatial extent and individual voxel statistical significance were originally proposed for use in neuroimaging by Poline et al. (1997).
Figure 6 graphically summarizes the results from Table 1 and also illustrates the improved sensitivity we obtained using the joint threshold method. Compared to the results in Goldman et al. (2009), these results show additional significant correlations in areas that overlap with the amygdala. Though this current paper is meant as a statistical methods paper and is not aimed at re-evaluating the specific findings of Goldman et al. (2009), it is worth noting that the responses in the amygdala have been observed, intracranially, for activity associated with P300 timing and polarity (Halgren et al., 1980).
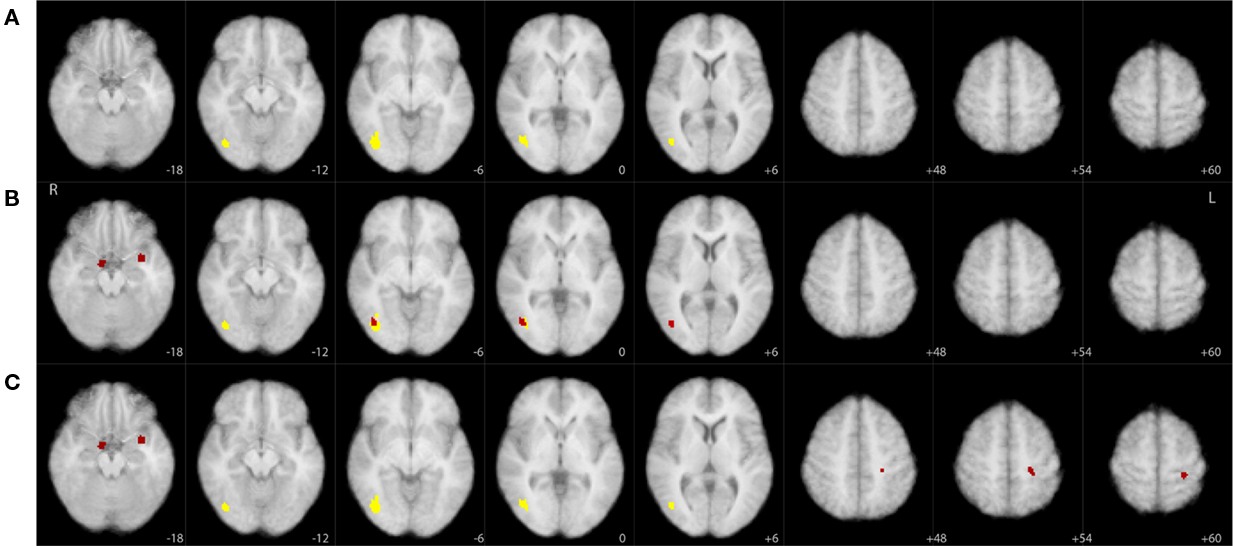
Figure 6. Significant clusters (yellow, p < 0. 01; red, p < 0.05) overlaid on axial slices of an MNI template brain image. Each row corresponds to a different thresholding technique derived from our resampling tests: (A) cluster size only based threshold, (B) maximum z-score based threshold, (C) joint threshold. Sampled slices not shown (slices sampled every 6 mm) had no significant clusters for any of the thresholding techniques. See Table 1 for additional information on these clusters.
Projection of the data onto the first principal component of this distribution allows us to simply compute a joint threshold for a one-sided significance level. One might ask “why not use the full distribution instead of the projection on the first principle component?” For example, one might imagine trying to empirically construct a one-sided multivariate test of significance by constructing contours of fixed probability mass about the mean and then utilize the contour cutoff so that an increase in single-voxel significance always yields a decrease in voxel size, and vice versa. Though such a procedure seems to be even more powerful than simply looking at the one-dimensional projection, it comes with the following disadvantages/costs. First it requires a parametric representation of the joint distribution so as to determine the shape of the contours and secondly it requires substantially more resampling to identify the contour/boundary and/or fit the parametric distributions if modeling the data. Since the distribution in Figure 5 does not appear to be well-modeled by a multivariate normal, we chose to illustrate our procedure with the simplest method which maintains the key points and findings of the approach.
Our focus has been on a data adaptive approach to correct for multiple comparisons in the joint space of single-voxel p-value and cluster size. Cluster size thresholding has been a popular method for correcting for multiple comparisons in EEG/fMRI, but often these thresholds are selected ad hoc and then propagate in the literature, used by others with little statistical justification (e.g., see Scheibe et al., 2010). There are of course other data adaptive approaches that can be used to correct for multiple comparisons and are not based on using cluster-size. One of the more recently adopted techniques controls the false-discovery rate (FDR; Genovese et al., 2002; Nichols and Hayasaka, 2003), namely the expected ratio of false positives to true positives. The FDR is data adaptive in that the thresholds are inherently linked to the signal to noise in the data. FDR correction methods are easily interpretable and are computationally efficient, compared to the resampling procedure we describe here. However, FDR usually does not take into account any prior model or certainty about the regressor model and requires some assumptions about the structure of the noise distribution. FDR correction methods are none-the-less an attractive approach for multiple comparison correction and more work is needed to understand how they can best be employed in EEG/fMRI data analysis.
Conclusion
In summary, our results suggest that additional care is required when using cluster-size to correct for multiple comparisons and determine significance in EEG/fMRI data. Some groups use conservative thresholds (Goldman et al., 2009) while others use cutoffs that are more lenient (Debener et al., 2005; Benar et al., 2007; Mayhew et al., 2010; Scheibe et al., 2010). Conservative cluster thresholds reduce false positives, but they also limit the sensitivity of single-trial analysis. The resampling method proposed here suggests that standard ad hoc cluster size thresholds, for example of 10 voxels, are too lenient (at least in this case) since more than a third of the resampled data clusters were found to have a larger size. For this data, a more conservative threshold of 50 voxels, as determined by the variability in the data itself, is a better estimate of the true data significance. This is less conservative than the threshold (of 73) presented in Goldman et al. (2009) that was derived from a less expansive bootstrapping method. In any case, our results suggest that establishing statistical significance using a threshold criteria that has been used in another EEG/fMRI study may not be adequate. Instead these corrections are better off left to be data adaptive, and though this can be computationally expensive, it improves interpretation of the results and properly establishes statistical significance.
Conflict of Interest Statement
The authors declare that the research was conducted in the absence of any commercial or financial relationships that could be construed as a potential conflict of interest.
Acknowledgments
This work was supported by National Institutes of Health grants R01-MH085092 and R33-EB004730.
References
Benar, C. G., Schon, D., Grimault, S., Nazarian, B., Burle, B., Roth, M., Badier, J. M., Marquis, P., Liegeois-Chauvel, C., and Anton, J. L. (2007). Single-trial analysis of oddball event-related potentials in simultaneous EEG–fMRI. Hum. Brain Mapp. 28, 602–613.
Debener, S., Ullsperger, M., Siegel, M., Fiehler, K., Von Cramon, D. Y., and Engel, A. K. (2005). Trial-by-trial coupling of concurrent electroencephalogram and functional magnetic resonance imaging identifies the dynamics of performance monitoring. J. Neurosci. 25, 11730–11737.
Eichele, T., Specht, K., Moosmann, M., Jongsma, M. L., Quiroga, R. Q., Nordby, H., and Hugdahl, K. (2005). Assessing the spatiotemporal evolution of neuronal activation with single-trial event-related potentials and functional MRI. Proc. Natl. Acad. Sci. U.S.A. 102, 17798–17803.
Esposito, F., Mulert, C., and Goebel, R. (2009). Combined distributed source and single-trial EEG–fMRI modeling: application to effortful decision making processes. Neuroimage 47, 112–121.
Genovese, C. R., Lazar, N. A., and Nichols, T. (2002). Thresholding of statistical maps in functional neuroimaging using the false discovery rate. Neuroimage 15, 870–878.
Goldman, R. I., Gerson, A. D., Cohen, M. S., Brown, T. R., and Sajda, P. (2005). “Simultaneous EEG and fMRI for event-related studies,” in Eleventh Annual Meeting of the Organization for Human Brain Mapping (Toronto, ON: Elsevier).
Goldman, R. I., Wei, C. Y., Philiastides, M. G., Gerson, A. D., Friedman, D., Brown, T. R., and Sajda, P. (2009). Single-trial discrimination for integrating simultaneous EEG and fMRI: identifying cortical areas contributing to trial-to-trial variability in the auditory oddball task. Neuroimage 47, 136–147.
Halgren, E., Squires, N. K., Wilson, C. L., Rohrbaugh, J. W., Babb, T. L., and Crandall, P. H. (1980). Endogenous potentials generated in the human hippocampal formation and amygdala by infrequent events. Science 210, 803–805.
Mayhew, S. D., Dirckx, S. G., Niazy, R. K., Iannetti, G. D., and Wise, R. G. (2010). EEG signatures of auditory activity correlate with simultaneously recorded fMRI responses in humans. Neuroimage 49, 849–864.
Mulert, C., Leicht, G., Hepp, P., Kirsch, V., Karch, S., Pogarell, O., Reiser, M., Hegerl, U., Jager, L., Moller, H. J., and Mccarley, R. W. (2010). Single-trial coupling of the gamma-band response and the corresponding BOLD signal. Neuroimage 49, 2238–2247.
Nichols, T., and Hayasaka, S. (2003). Controlling the familywise error rate in functional neuroimaging: a comparative review. Stat. Methods Med. Res. 12, 419–446.
Novitskiy, N., Ramautar, J. R., Vanderperren, K., De Vos, M., Mennes, M., Mijovic, B., Vanrumste, B., Stiers, P., Van Den Bergh, B., Lagae, L., Sunaert, S., Van Huffel, S., and Wagemans, J. (2011). The BOLD correlates of the visual P1 and N1 in single-trial analysis of simultaneous EEG–fMRI recordings during a spatial detection task. Neuroimage 54, 824–835.
Parra, L., Alvino, C., Tang, A., Pearlmutter, B., Yeung, N., Osman, A., and Sajda, P. (2002). Linear spatial integration for single-trial detection in encephalography. Neuroimage 17, 223–230.
Parra, L. C., Christoforou, C., Gerson, A. D., Dyrholm, M., An, L., Wagner, M., Philiastides, M. G., and Sajda, P. (2008). Spatiotemporal linear decoding of brain state. IEEE Signal Process. Mag. 25, 107–115.
Parra, L. C., Spence, C. D., Gerson, A. D., and Sajda, P. (2005). Recipes for the linear analysis of EEG. Neuroimage 28, 326–341.
Poline, J. B., Worsley, K. J., Evans, A. C., and Friston, K. J. (1997). Combining spatial extent and peak intensity to test for activations in functional imaging. Neuroimage 5, 83–96.
Sajda, P., Goldman, R. I., Philiastides, M. G., Gerson, A. D., and Brown, T. R. (2007). “A system for single-trial analysis of simultaneously acquired EEG and fMRI,” in Third International IEEE EMBS Conference on Neural Engineering, ed. M. Akay (Kohala Coast, HI: IEEE Press), 287–290.
Scheibe, C., Ullsperger, M., Sommer, W., and Heekeren, H. R. (2010). Effects of parametrical and trial-to-trial variation in prior probability processing revealed by simultaneous electroencephalogram/functional magnetic resonance imaging. J. Neurosci. 30, 16709–16717.
Keywords: single-trial, simultaneous EEG/fMRI, multiple comparisons, resampling, auditory oddball
Citation: deBettencourt M, Goldman R, Brown T and Sajda P (2011) Adaptive thresholding for improving sensitivity in single-trial simultaneous EEG/fMRI. Front. Psychology 2:91. doi: 10.3389/fpsyg.2011.00091
Received: 11 March 2011;
Accepted: 27 April 2011;
Published online: 20 May 2011.
Edited by:
Guillaume A. Rousselet, University of Glasgow, UKReviewed by:
Cyril R. Pernet, University of Edinburgh, UKStefan Debener, University of Oldenburg, Germany
Copyright: © 2011 deBettencourt, Goldman, Brown and Sajda. This is an open-access article subject to a non-exclusive license between the authors and Frontiers Media SA, which permits use, distribution and reproduction in other forums, provided the original authors and source are credited and other Frontiers conditions are complied with.
*Correspondence: Paul Sajda, Department of Biomedical Engineering, Columbia University, 404 CEPSR Building, 530 West 120th Street, New York, NY, USA. e-mail: ps629@columbia.edu