
- Departamento de Metodología, Facultad de Psicología, Universidad Complutense, Campus de Somosaguas, Madrid, Spain
Ulrich and Vorberg (2009) presented a method that fits distinct functions for each order of presentation of standard and test stimuli in a two-alternative forced-choice (2AFC) discrimination task, which removes the contaminating influence of order effects from estimates of the difference limen. The two functions are fitted simultaneously under the constraint that their average evaluates to 0.5 when test and standard have the same magnitude, which was regarded as a general property of 2AFC tasks. This constraint implies that physical identity produces indistinguishability, which is valid when test and standard are identical except for magnitude along the dimension of comparison. However, indistinguishability does not occur at physical identity when test and standard differ on dimensions other than that along which they are compared (e.g., vertical and horizontal lines of the same length are not perceived to have the same length). In these cases, the method of Ulrich and Vorberg cannot be used. We propose a generalization of their method for use in such cases and illustrate it with data from a 2AFC experiment involving length discrimination of horizontal and vertical lines. The resultant data could be fitted with our generalization but not with the method of Ulrich and Vorberg. Further extensions of this method are discussed.
Introduction
Two-alternative forced-choice (2AFC) procedures are regarded as objective methods to gather psychophysical evidence, although they suffer from some methodological problems. In a temporal 2AFC discrimination task, one of the intervals presents a fixed stimulus (the standard) and the other presents a test (or comparison) stimulus whose magnitude differs across trials. Test magnitudes may vary from well below that of the standard to well above it, and test and standard may have the same magnitude in some trials. The order of presentation of test and standard is randomized across trials, ideally with the constraint that at each test magnitude the test is presented in the first interval on half of the trials. Observers are asked to report the interval in which perceived magnitude was stronger. When the proportion of times that the test was judged stronger is plotted as a function of test magnitude, the data typically describe a sigmoidal pattern that is often summarized by fitting a psychometric function whose location and slope are free parameters.
Ulrich and Vorberg (2009) argued that the location of this psychometric function should not be a free parameter but should instead be fixed according to theoretical constraints. They started noting that 2AFC data come from a mixture of trials involving two orders of presentation of test and standard. They then discussed order effects whose origin is unknown but whose consequence is that the psychometric functions Ψ1 and Ψ2 that hold for trials in which the test is presented first or second may differ in slope, location, or both. Thus, points of subjective equality (PSEs) and difference limens vary with order of presentation in 2AFC tasks (see Woodruff et al., 1975; Masin and Fanton, 1989) and Ulrich and Vorberg noted that estimates of the difference limen obtained by fitting a single psychometric function to data aggregated across presentation orders may be seriously contaminated. In their search for uncontaminated estimation of the difference limen in the presence of order effects, Ulrich and Vorberg claimed that the psychometric function Ψ2AFC must have its 50% point at the magnitude of the standard. Their argument relies on two facts. The first one is that Ψ2AFC(x) = [Ψ1(x) + Ψ2(x)]/2. The second is that when the test has the same magnitude as the standard the two stimuli are physically identical. If xs is the magnitude of the standard, Ulrich and Vorberg’s contention is that Ψ1(xs) + Ψ2(xs) = 1 and, hence, that Ψ2AFC(xs) = 0.5. They claim that this result (which we will refer to as “the contention”) is a property of 2AFC tasks. Ulrich (2010, p. 1188) further emphasized that Ψ2AFC(xs) = 0.5 “must always hold, and it is not a theoretical constraint but a tautology associated with the 2AFC methodology. In other words, the PSE in a 2AFC task is always equal to [xs] (…). If PSE is estimated using some model that allows it to differ from [xs] and if the estimated PSE does differ from [xs], this merely reflects statistical noise.” As a result, Ulrich and Vorberg as well as Ulrich recommended that 2AFC psychometric functions always be fitted under this constraint.
Ulrich and Vorberg (2009) illustrated their method by fitting psychometric functions to 2AFC data from an experiment in which observers were asked to indicate which of two temporal intervals was longer. One of these intervals had fixed length on all trials and served as the standard stimulus; the other interval varied in length across trials and served as the test stimulus. In such experiment, in which test and standard differ in length but are identical in all other respects, the contention seems tenable and its validity can be proved formally on the reasonable assumption that stimuli that are physically identical in all respects are perceived identically. But the assumption that physical identity implies perceived identity does not necessarily hold when the two stimuli differ on dimensions other than that along which they are compared. This latter characteristic is actually prevalent in empirical use of 2AFC discrimination tasks, which leaves Ulrich and Vorberg’s method inapplicable.
This paper discusses the validity of Ulrich and Vorberg’s (2009) contention as a general property of 2AFC tasks and our main goal is to propose a generalization that is always valid and, thus, which allows obtaining uncontaminated estimates of the difference limen in all circumstances. To make the paper self-contained, the next section describes briefly Ulrich and Vorberg’s approach to fitting 2AFC data under the contention. Next, the inadequacy of the contention for 2AFC tasks in general is discussed in the light of countering and well-known empirical evidence. The contention is next amended so that it can be applied in all cases and an experiment is reported whose data reveal the inadequacy of the original contention and the validity of our generalization. Further extensions and improvements of the method are finally discussed, which should help to improve the estimation of psychometric functions from 2AFC discrimination data and, hence, to obtain estimates of the difference limen that are free of contamination from order effects.
Fitting 2AFC Data Under Ulrich and Vorberg’s (2009) Contention
Using Ulrich and Vorberg’s (2009) contention to fit 2AFC discrimination data involves three steps:
(1) collecting data in 2AFC trials designed so that at each test level half of the trials display the test in the first interval while the other half displays it in the second interval,
(2) segregating data by order of presentation of test and standard to compute the proportion of times that the test is judged stronger at each test level and separately for each presentation order, and
(3) fitting Ψ1 and Ψ2 to the applicable subsets of data simultaneously under a constraint arising from their proof that the psychometric function Ψ2AFC for data aggregated across presentation orders must satisfy Ψ2AFC(x) = [Ψ1(x; a1, b1) + Ψ2(x; a2, b2)]/2, where ai and bi are the location and slope parameters of Ψ1 and Ψ2. The constraint, given by the contention, is that Ψ2AFC(xs) = 0.5.
Neither Ulrich and Vorberg (2009) nor Ulrich (2010) stated condition (1) explicitly as a necessary requirement, but it is implicit in their discussion and examples. The requirement can indeed be relaxed, but we will defer a discussion of this issue to a later section of this paper.
Only a1, b1, and b2 are free parameters in the simultaneous fit of Ψ1 and Ψ2 because a2 is determined by the constraint. The functional relation of a2 to a1, b1, b2, and xs depends on the forms of Ψ1 and Ψ2. When they are both logistic functions given by

Ulrich and Vorberg showed that

If the logistic functions Ψ1 and Ψ2 include a range restriction determined by asymptote parameters λ1 and λ2 so that

García-Pérez and Alcalá-Quintana (2010a) showed that the relation is
Prior to fitting Ψ1 and Ψ2, a2 in the expression of Ψ2 must be replaced by the right-hand side of Eq. 2 or 4 as appropriate. This is what eliminates a2 as a parameter and it also demands a simultaneous fit because a1 and b1 are then common parameters in Ψ1 and Ψ2.
The results of applying this strategy can be summarized in a plot that includes three sets of data and three functions (see Figure 4 in Ulrich and Vorberg, 2009). The first set is the empirical proportion of times that the test was judged stronger when presented in the first interval and is accompanied by the fitted Ψ1 which should run through this data set; the second set represents data from trials in which the test was presented in the second interval and is also accompanied by the fitted Ψ2 which should run through these data; and the third set consists of the usual proportions computed from all trials (without distinction according to presentation order) and is accompanied by the average function Ψ2AFC, which should run through the points in this set even though Ψ2AFC was not actually fitted to these data but merely computed as the average of the fitted Ψ1 and Ψ2.
If the data have been fitted through Eqs 1 and 2 and parameter estimates  have been obtained, an estimate of the difference limen that is uncontaminated by order effects is given by the average inverse slope of Ψ1 and Ψ2, that is, by
  in Ulrich and Vorberg, 2009); if the data have been fitted through Eqs 3 and 4 instead, the uncontaminated estimate is obtained in the same way because the asymptote parameters λ1 and λ2 are independent of slope parameters.
Validity of the Contention
As discussed above, Ulrich and Vorberg (2009) seem to have derived the contention on the assumption that test and standard stimuli differ only in magnitude along the dimension on which observers compare them, and they overstated the validity of the contention by implying that it holds for all 2AFC discrimination tasks in general.
To set the stage for a discussion of the general validity of the contention, consider the 2AFC discrimination data reported by Armstrong and Marks (1997) in their Figure 1, which we reproduce and annotate in our Figure 1. These data come from a study involving length discrimination of horizontal and vertical lines, and reflect the proportion of times in which a vertical line (the test) was judged longer than a horizontal line (the standard), as a function of the length of the vertical line. The experiment involved five different lengths for the standard horizontal line, hence the five curves in each panel. The study involved a temporal 2AFC paradigm with equal numbers of trials at each test level and also with equal numbers of trials for each presentation order. The data plotted in Figure 1 represent aggregates across presentation orders. For data on the left panel, the two stimuli in each trial appeared at different times and locations on the screen (a sort of spatio-temporal 2AFC task); data on the right panel are thoroughly analogous but in this case the two stimuli appeared at different times on the same location on the screen (a pure temporal 2AFC task). These are indeed instances of 2AFC tasks, for which Ulrich and Vorberg (2009) claimed that the contention holds.
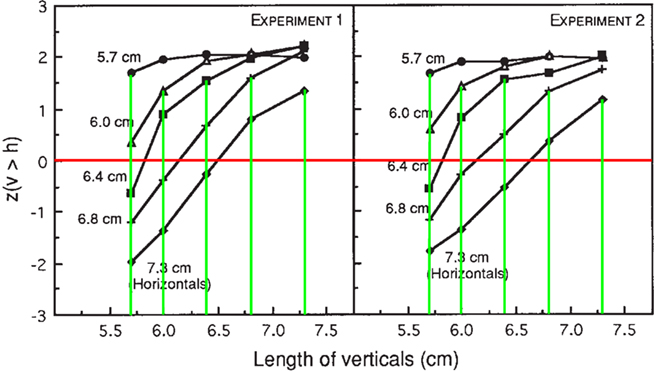
Figure 1. [Original caption from Armstrong and Marks (1997): Probability that the vertical lines were judged longer than the horizontals, as a function of the physical length of the vertical. Each function represents a fixed level of horizontal length. The left-hand panel gives the results of Experiment 1, in which the location of the stimuli on the screen varied randomly over four possible values. The right-hand panel gives the results of Experiment 2, in which the stimuli appeared at a constant location for a given subject. (Copyright 1997 by the Psychonomic Society, Inc.)]. Annotations: The red horizontal line across the panels indicates the 50% level (a z-score of 0), which reveals the PSE upon intersection with each curve. The abscissa at which the red line crosses a given curve indicates the length that the vertical stimulus must have to be perceived equal in length to the horizontal stimulus. Green vertical lines are drawn at the abscissa corresponding to the actual length of the horizontal stimulus for each curve and extend up to the data point on the curve reflecting the condition in which horizontal and vertical stimuli were physically identical; the ordinate of the upper end of each green line thus indicates the proportion of times (upon transformation of the z-score) that the vertical stimulus was judged longer than the horizontal stimulus when they actually had the same length.
No psychometric functions were fitted by Armstrong and Marks (1997), but the data clearly question the validity of the contention. The length of the standard is printed next to the leftmost point on the applicable curve in Figure 1, and green vertical lines help identify the z-score (i.e., the probit transformation of empirical proportion) when horizontal and vertical lines had the same physical length. These z-scores are all in the range 1.2–1.7, implying that the test was judged longer 88–96% of the times and, thus, remarkably above 50% (a level that is represented by a z-score of 0, marked by a red horizontal line across the panels). The intersection of the red horizontal line with each data curve indicates the PSE, that is, the length that the vertical line must have for it to be judged equal in length to the horizontal line. The intersection always occurs when the length of the vertical line is smaller than that of the standard horizontal line. It is certainly hard to reconcile these data with Ulrich and Vorberg’s (2009) contention that the PSE in 2AFC data aggregated across presentation orders must occur at the point of objective equality (POE), which is what Ψ2AFC(xs) = 0.5 means. And it is also hard to regard these differences between the PSE and the POE as mere statistical noise.
The results just discussed reflect the well-known horizontal–vertical illusion: Vertical and horizontal lines of the same length are not perceived equal, and the vertical line must be shorter than the horizontal line for them to be perceived equal. In contrast, the contention Ψ2AFC(xs) = 0.5 implies that indistinguishability occurs when x = xs and, hence, that vertical and horizontal lines would be perceived equal when they have the same physical length. All extant evidence on the horizontal–vertical illusion refutes the contention (see, e.g., Künnapas, 1955; Girgus and Coren, 1975; Prinzmetal and Gettleman, 1993; Armstrong and Marks, 1997; Richter et al., 2007; Searleman et al., 2009; Hamburger and Hansen, 2010; Mamassian and de Montalembert, 2010) and numerous studies involving all other illusory figures concur.
It must be stressed that an empirical discrepancy between the PSE and the POE is not limited to illusory phenomena. More often than not, test and standard stimuli differ on more dimensions than that along which their magnitudes are compared, and the presence of these different dimensions may push the PSE away from the POE. Consider the classical Georgeson and Sullivan (1975) study, which measured the contrast that a (test) grating of a given spatial frequency should have for it to be perceived equal to the contrast of a (standard) grating of another spatial frequency. Their study thus estimated the PSE for grating contrast across spatial frequency. Their results showed that the PSE does not occur at the POE at low standard contrasts although it certainly does at high standard contrasts. [Georgeson and Sullivan collected their data with the method of adjustment, but replications of their experiment using 2AFC tasks under various conditions have always rendered analogous results (see, e.g., Stephens and Banks, 1985; St. John et al., 1987).] A similar quest for whether or not the PSE matches the POE underlies other studies in contrast perception, where 2AFC procedures revealed a mismatch between the PSE and the POE for contrast when test and standard differed in luminance or size (Peli, 1995), phase or bandwidth (Peli, 1997; Benton and Johnston, 1999), or direction of motion (García-Pérez and Peli, 2001). In another context, research on perceptual aftereffects also relies on discrepancies between PSE and POE (e.g., Knapen et al., 2010). Situations in which PSE and POE differ are myriad and the method of Ulrich and Vorberg (2009) cannot be used in those cases. The question is, then, how one can estimate the difference limen without contamination from order effects in cases in which the PSE does not lie at the POE, a question that calls for a generalization of Ulrich and Vorberg’s method such that the (unknown) location of the PSE becomes an additional free parameter.
Generalizing the Contention
The preceding section has emphasized that perceived identity does not generally accompany physical identity, particularly when test and standard differ on extra dimensions. The assumption that physical identity implies perceived identity was laid out in signal detection theoretic terms by Ulrich (2010, p. 1190), who stated (in a different notation) that the internal representation of a standard of magnitude xs is a normally distributed random variable with mean μ(xs) whereas the internal representation of a test of magnitude x is also normally distributed with mean μ(x). He thus assumed that the function μ is the same for test and standard stimuli and, hence, x = xs inevitably yields internal representations with equal means for test and standard and chance performance on a 2AFC task. Although the assumption seems valid for the type of stimuli that Ulrich and Vorberg (2009) used in their experiment, it does not hold in general and needs to be replaced.
Consider again the horizontal–vertical illusion. The mean of internal representations (perceived length) of horizontal and vertical lines of length xs cannot be given by the same function μ because the defining property of the illusion is that the perceived length of a vertical line is larger than that of a horizontal line of the same physical length. Thus, empirical evidence shows that the mean of the internal representation of the test is given by a function μt that differs from the function μs that gives the mean for the standard. Empirical estimates of these functions were reported by Armstrong and Marks(1997, p. 1208 and Figure 5), showing that horizontal lines are perceived nearly veridically whereas the length of vertical lines is overestimated: When perceived length was plotted against physical length, magnitude-estimation data for horizontal lines described a unit-slope line through the origin whereas data for vertical lines described a line with a slope higher than unity.
Thus, in terms of signal detection theory, chance performance on a 2AFC discrimination task (or, in other terms, Ψ2AFC(x) = 0.5) does not necessarily occur at x = xs (i.e., when test and standard are physically equal on the dimension of comparison) but rather at the point x0 satisfying μt(x0) = μs(xs) (i.e., when the perceived magnitudes of test and standard are equal). Although nothing prevents μt and μs from being identical in special cases, those cases must be identified empirically. This seems to suggest that one would need to know the functions μt and μs (or, at least, know if they differ) in order to estimate Ψ1 and Ψ2 under the applicable constraints. Quite on the contrary, a simple amendment of Ulrich and Vorberg’s (2009) contention suffices.
Potential differences between μt and μs do not alter the unquestionable validity of Ulrich and Vorberg’s (2009) observation that Ψ2AFC should be the average of constrained functions Ψ1 and Ψ2, but we will use it with the three-parameter logistic function in Eq. 3, which yields

Even if μt and μs differ, it is still true that Ψ2AFC(x) = 0.5 when Ψ1(x; a1, b1, λ1) + Ψ2(x; a2, b2, λ2) = 1 but, by the above discussion, this does not occur when x = xs but at an unknown point xPSE for which μt(xPSE) = μs(xs). All that this means is that the constraint Ψ2AFC(xs) = 0.5 must be replaced by Ψ2AFC(xPSE) = 0.5, where xPSE is another free parameter. When Ψ1 and Ψ2 are logistic functions, the amended constraint transforms Eq. 4 into
so that fitting Ψ1 and Ψ2 involves estimating a1, b1, b2, λ1, λ2, and xPSE under the constraint of Eq. 6. It may happen that the estimated xPSE equals xs within sampling error, which would provide evidence that μt(xs) = μs(xs) and, hence, that Ulrich and Vorberg’s (2009) contention is empirically valid in such case. In other cases, this strategy will show that μt(xs) ≠ μs(xs) and will serve the more important goal of estimating xPSE under the theoretical constraints. Note also that the new parameter xPSE only shifts the functions Ψ1 and Ψ2 so as to “center” them away from the POE. Hence, the change of location does not alter the difference limen defined as the average inverse slope of Ψ1 and Ψ2, which is still obtained through Ulrich and Vorberg’s Eq. 14.
Empirical Demonstration
To illustrate the procedure just described, a 2AFC task was used in which observers judged whether a horizontal line or a vertical line was longer. The horizontal line was the standard and had a length of 104 pixels (∼3.1 cm); the vertical line was the test, whose length on each trial had one of eight values in the range between 94 and 110 pixels, in steps of two pixels. Line width was five pixels and all lines were black on a uniform light background. Each trial presented the lines in either an ‘L’ or a ‘Γ’ configuration, which is to say that the test could be placed above or below the standard in the spatial 2AFC paradigm typically used for the study of geometrical illusions. Hence, references to first and second intervals in the preceding discussion of temporal 2AFC should be understood here as referring to upper and lower spatial positions. Spatial 2AFC was used for convenience, but it should be inconsequential because (i) differences in the perceived length of horizontal and vertical lines have also been reported in spatial 2AFC tasks (e.g., Hamburger and Hansen, 2010; Mamassian and de Montalembert, 2010), (ii) order effects in temporal 2AFC have also been shown to occur as position effects in spatial 2AFC (e.g., Hellström, 2003; García-Pérez et al., 2005), and (iii) Ulrich and Vorberg (2009) claimed that the contention is a property of all 2AFC tasks.
Test lines of each length were presented 100 times in each configuration, for a total of 800 trials with each configuration. Data were collected in five sessions of 320 trials each (20 presentations at each of the eight test lengths in each of the two configurations); the sequence of trials was newly randomized in each session for each observer. Each session took 12–17 min, and observers applied self-administered pauses between sessions. The two authors participated in the experiment.
Stimuli were presented on a 19-in HP L1950g LCD monitor (flat screen size: 37.7 cm horizontally by 30.1 cm vertically) with a spatial resolution of 1280 × 1024 pixels and a 1:1 aspect ratio. All experimental events (randomization of the sequence of trials, stimulus display, and collection of responses) were controlled by a computer running custom software. Viewing distance was 60 cm, so that 1 cm on the screen subtended ∼0.95° of visual angle. Each trial started by displaying a configuration from the set of 320 in the current session. To prevent observers from developing strategies based on spatial cues, stimuli were displayed at a location on the screen such that the center of the putative rectangle closing the configuration would lie at a random position within 10 pixels of the center of the monitor. The stimulus remained present until the observer had responded with key presses indicating whether the horizontal or the vertical line appeared longer. The next trial started 500 msec after the observer’s response.
The proportion of times that the test was judged longer was computed at each test level in each configuration, and an overall proportion was also computed at each test level irrespective of configuration. These three sets of data are plotted as circles in Figure 2 in a separate panel for each observer; raw counts are reported in Table 1. Contrary to Ulrich and Vorberg’s (2009) expectation that the PSE for each test location should be displaced away from the POE in an opposite direction while that for aggregated data should be around the POE, all three PSEs are displaced to the left of the POE. The functions Ψ1 (red curve) and Ψ2 (blue curve) were fitted using Ulrich and Vorberg’s method but they do not do justice to the data (red and blue circles), nor does their average (Ψ2AFC; black curve) follow the path of aggregated data (black circles). Clearly, this outcome is not a failure to find the “correct” parameter estimates but, rather, a proof of the failure of a contention imposing (i) that the black curve passes through the point (xs, 0.5) = (104, 0.5) indicated by the intersection of the dashed lines in each panel and (ii) that at x = 104 the red and blue curves pass through points that are vertically equidistant from (104, 0.5) in opposite directions. Obviously, non-decreasing functions forced to satisfy these requirements cannot follow the path of the data. The fitted curves represent the solution that is least inconsistent with the data, which is still overly unacceptable.
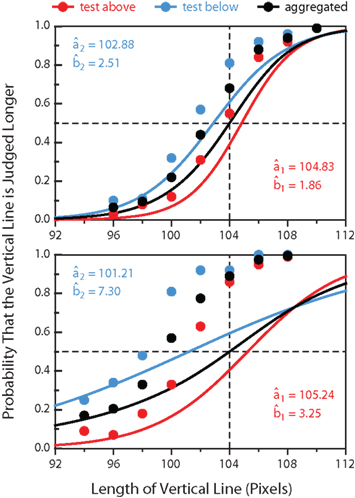
Figure 2. Data from the length discrimination experiment (circles) and fitted psychometric functions (curves). The dashed vertical line indicates the POE. Curves were estimated with Ulrich and Vorberg’s (2009) method, which fails to provide a good fit because it forces the functions to pass through points that are away from the data. Estimated parameters for Ψ1 (when the test was presented above) and Ψ2 (when the test was presented below) are given in insets. To make sure that the lack of fit was not caused by our asymptote parameters λ1 and λ2, their values were fixed at 0 and not regarded as free parameters. Repeating the procedure with free λ1 and λ2 did not result in any improvement because the problem is in the different horizontal location of the data and the fitted curves, not in the vertical range.
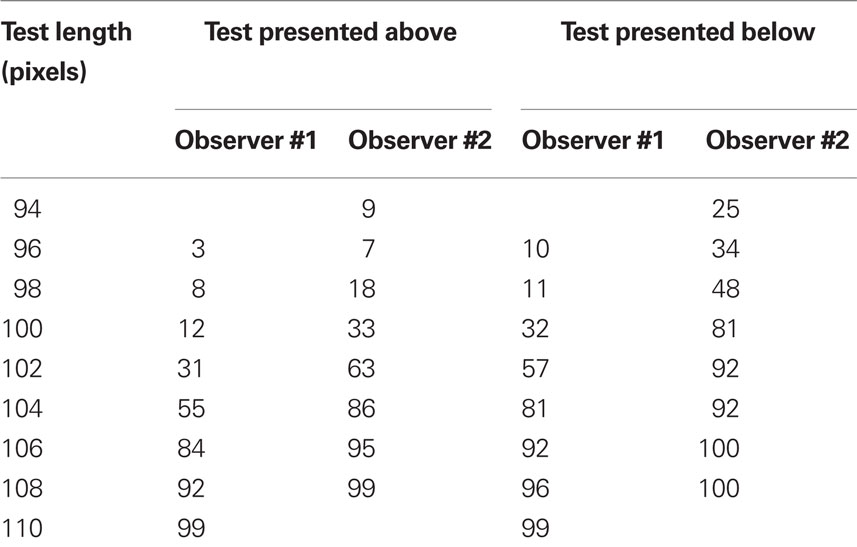
Table 1. Number of “vertical longer” responses across the 100 trials at each test level.
Figure 3 shows the results of fitting the data with our amended method, and it is obvious that the psychometric functions fit well. Order effects are also captured by the fact that Ψ1 and Ψ2 are laterally shifted away from xPSE in opposite directions, consistent with what the data indicate. Estimated values of xPSE are printed on the panels, and the location parameters a1 and a2 reveal where the PSE lies for each presentation order. Estimated values of xPSE compare well with the average values reported by Mamassian and de Montalembert (2010) and they are also within the range reported by Hamburger and Hansen (2010): Vertical lines have to be 1.53% (Observer #1) or 4.46% (Observer #2) shorter than horizontal lines to be perceived equally long. More importantly, estimates of the difference limen that are free of contamination from order effects can be obtained which are also reported in Figure 3.
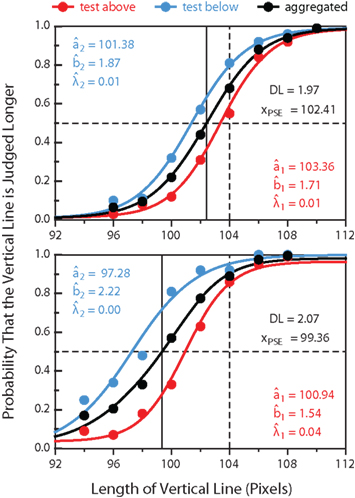
Figure 3. The same data from Figure 2, but curves are now fitted with our amended method and also with free λ1 and λ2. By removing the constraint that the 50% point on the black curve (for aggregated data across presentation orders) must occur at xs = 104, the curves can shift horizontally and meet the data. The amended constraint involves the same basic relation of Ψ2AFC to Ψ1 and Ψ2, but allows the curves to displace to the point xPSE indicated by the data, which becomes a free parameter in the fit. Estimates of xPSE for each observer are given in insets and their location is indicated by a solid vertical line. Estimates of the difference limen (DL) computed through Eq. 14 in Ulrich and Vorberg (2009) are also given in the inset.
Extensions and Further Improvements
Our generalized method lends itself to improvements that should increase its potential for providing a good fit to data and for the investigation of order effects. This section comments on them.
Mathematical Forms of Ψ1 and Ψ2
We have used logistic psychometric functions in our illustration, as did Ulrich and Vorberg (2009). In a signal detection theoretic framework, the form of the psychometric function is determined by assumptions about the distribution of internal responses or how their mean and variance change with stimulus level, and by what the decision rule is (for a formal analysis in the context of contrast perception, see García-Pérez and Alcalá-Quintana, 2007). Only under restrictive conditions will the resultant psychometric functions have a logistic form, but differences across alternative functional forms are generally small and inconsequential. Logistic functions are reasonable approximations because they are sufficiently flexible to accommodate the typical patterns that empirical data show.
Ulrich and Vorberg (2009) discussed how the location and slope of Ψ1 and Ψ2 may differ as a result of Type-A and Type-B order effects. Arguably, order effects may also cause Ψ1 and Ψ2 to differ in mathematical form through changes in some of the components determining them. Then, research on order effects using our amended method should be alert to empirical signs of different forms for Ψ1 and Ψ2 and not only to different estimated parameters of logistic functions.
Asymptotes
The logistic function in Eq. 3 includes a further parameter that reduces the range of Ψi to the interval (λi, 1 − λi), compared to the full range (0, 1) of the function in Eq. 1. This parameter has traditionally been dubbed “lapsing rate” or “finger error rate” because it was meant to describe unexpected empirical deviations from perfect performance attributed to lapses of attention or finger errors upon hitting the response keys (see Meese, 1995). Yet, parameter λ has a new meaning in this context because order effects may affect the asymptotes of Ψ1 or Ψ2 for reasons unrelated to finger errors or lapses of attention. Moreover, the lower and upper asymptotes might be differently affected so as to demand a four-parameter logistic function given by

whose range is the interval (κi, 1 − λi). We should stress that κ in Eq. 7 is by no means the “guessing rate” parameter typically included in psychometric functions for 2AFC detection tasks.
To better understand the relevance of parameters κ and λ outside the context of finger errors or lapses of attention, consider the model described by Ulrich (2010, p. 1191 and Figure 12). This model states that observers make their judgment by comparing the stimulus presented in the second interval with a stable internal standard and produces order effects such that Ψ2 will be adequately approximated by a logistic function with κ2 = λ2 = 0 whereas Ψ1(x) = y with constant 0 < y < 1. By being flat and independent of test level x, the shape of Ψ1 can only be described through the four-parameter function in Eq. 7 with κ1 = y and λ1 = 1 − y. Although the model seems implausible in this particular form (as no evidence of flat psychometric functions seems to have ever been reported), other variants of this model can produce non-flat psychometric functions that can only be described through different and non-zero values for κ and λ. Empirical evidence will tell whether a four-parameter function is actually necessary, or in what cases.
Equal Numbers of Trials for Each Presentation order at Each Test Level
Ulrich and Vorberg (2009) applied their method to data collected in equal numbers of trials for each presentation order at each test level. We have described this characteristic as step (1) of their method, although we noted that it is replaceable. Actually, neither Ulrich and Vorberg (2009) nor Ulrich (2010) declared this as a requisite, but it is worth discussing the effects of relaxing this requisite before we present the main issue that we want to raise here.
Suppose there are n1 = 200 trials at each test level for the presentation order relevant to Ψ1 but only n2 = 100 for the presentation order relevant to Ψ2. Suppose also, and only to facilitate our presentation, that Ψ1 and Ψ2 both fit the applicable data perfectly so that the curves run on top of the data points or, formally, that the empirical proportion pij at test level x = xj equals Ψi(xj). (To simplify the presentation, we will drop parameters a, b, κ, and λ from the notation.) Consider a sample case in which p1 j = 160/200 = 0.8 = Ψ1(xj) whereas p2 j = 20/100 = 0.2 = Ψ2(xj). Then, xPSE = xj because Ψ1(xj) + Ψ2(xj) = 1 and, thus, Ψ2AFC(xj) = 0.5, but the empirical proportion from aggregated data at xj would be (160 + 20)/(200 + 100) = 0.6. In a plot, Ψ1 and Ψ2 would run on top of their reference data points but Ψ2AFC would lie below all points in its reference data set, which might be taken as a sign of poor fit. In order for Ψ2AFC to match its reference data when n1 ≠ n2, the imbalance that affects proportions computed from aggregated data should be applied upon averaging Ψ1 and Ψ2, yielding Ψ2AFC(x) = [n1Ψ1(x) + n2Ψ2(x)]/(n1 + n2). This reduces to the simple average when n1 = n2. This discussion reveals the graphical consequences of using n1 ≠ n2. It should nevertheless be kept in mind that Ulrich and Vorberg (2009) aptly noted that the only “true” functions are Ψ1 and Ψ2, whereas Ψ2AFC is a misleading byproduct. Then, the shape described by Ψ2AFC and whether or not it follows the path of its reference data is immaterial. Of course, a potential graphical mismatch can be entirely eliminated by ensuring that experiments are carried out with n1 = n2, which brings us to our main issue.
The experiment of Ulrich and Vorberg (2009) and the experiment reported here have both used the method of constant stimuli: The same number of trials was administered at each of a number of fixed test levels, and this number of trials was also the same across presentation orders (i.e., n1 = n2). Our sample case in the preceding paragraph also implied the method of constant stimuli within each presentation order, although with n1 ≠ n2 across orders. This method is known to be inefficient (Meese, 1995), an inefficiency that is intensified when Type-A order effects push Ψ1 and Ψ2 apart from one another and Type-B order effects make them vary in support. Hence, the set of stimulus levels that is informative of one of the functions is likely to be uninformative of the other.
Adaptive methods are more efficient and much more used nowadays, and some of them provide optimal sampling plans for accurate estimation of psychometric functions even with small numbers of trials (García-Pérez and Alcalá-Quintana, 2005). The prevalence of adaptive methods raises the issue of whether our amended method could be used with data gathered through them, which thus comprise numbers of trials that differ across test levels within and across presentation orders. A satisfactory solution does not present itself upon first examination of the problem, but a reasonable-looking approach that requires thorough evaluation consists of
(1) running separate (though interwoven along the experimental session) adaptive tracks designed so that each individual track deploys trials with a fixed order of presentation, because individual adaptive tracks are efficient at gathering data appropriate for a fixed psychometric function, not for a mixture of them,
(2) setting the length of each individual track so as to ensure that the overall number N1 of trials across all tracks pertaining to Ψ1 is the same as its counterpart N2 for Ψ2, and
(3) to the extent that the above provides accurate constrained estimates of Ψ1 and Ψ2 with N1 = N2, computing Ψ2AFC as the simple average of Ψ1 and Ψ2 to reflect what aggregated data would be like in an experiment in which both presentation orders are equally frequent at each test level.
The validity of this approach must be evaluated in studies that might also identify alternative and/or more appropriate approaches. Yet, it should be kept in mind that the primary goal is obtaining accurate estimates of Ψ1 and Ψ2; how well the average of the estimated Ψ1 and Ψ2 follows the path of aggregated data seems secondary and largely immaterial.
Response Bias
Trials in a 2AFC discrimination task often present stimuli that are subjectively so similar that observers cannot make a judgment. The strategies that observers use to respond when unable to make a decision are known to bias 2AFC tasks (see, e.g., Morgan et al., 1990; Jäkel and Wichmann, 2006), and may indeed be one of the sources of Type-A order effects. On presenting his “Method of Right and Wrong cases,” Fechner (1860/1966, p. 63) noted that there appears to be an “interval of uncertainty” within which observers cannot make a decision. He then suggested that these undecided cases be recorded separately and counted as “half right and half wrong” and stated that this strategy “is the only one which can also yield a basis for elimination and precise determination of the influences (… which cause constant errors” (p. 78). But Fechner’s observation seems to have gone unnoticed and undecided cases are rarely recorded (for some exceptions, see Künnapas, 1955; Hellström, 2003; van Vleet and Robertson, 2006; Alcalá-Quintana and García-Pérez, 2007; García-Pérez, 2010), let alone treated as Fechner suggested.
García-Pérez and Alcalá-Quintana (2010a) described a model of response bias and showed how it produces Type-A order effects. They also illustrated how recording and treating undecided cases as Fechner (1860/1966) suggested eliminates this response bias, which is not to say that Type-B order effects can also be eliminated in this way or that this removes all sources of Type-A order effects. This strategy has been empirically shown to eliminate bias in 2AFC contrast detection tasks (García-Pérez and Alcalá-Quintana, 2010b) and to eliminate Type-A order effects in 2AFC contrast discrimination tasks (Alcalá-Quintana and García-Pérez, 2011). Although one of the virtues of Ulrich and Vorberg’s (2009) method and our amendment is that the constrained estimation of Ψ1 and Ψ2 isolates order effects and eliminates their contaminating influence on estimates of the difference limen, removing order effects whose cause is known can only help to identify the cause of those that remain.
To illustrate, the experiment reported earlier was repeated with the difference that observers were allowed to express indecision on a trial by hitting another response key. Thus, at a given test level for a given presentation order, the observer will have given Nv “vertical longer” responses, Nh “horizontal longer” responses, and Nu “undecided” responses. Following Fechner (1860/1966), undecided responses were counted as half right and half wrong to yield adjusted counts of Nv + Nu/2 “vertical longer” responses and Nh + Nu/2 “horizontal longer” responses. The results are shown in Figure 4, and Table 2 gives raw counts and the resultant adjusted proportions. Data from each presentation order are now closer together than in Figure 3 and Ψ1 and Ψ2 are also more similar; at the same time, estimates of xPSE stay close to what they were when undecided cases were not recorded (compare with Figure 3). A surely significant difference between Ψ1 and Ψ2 remains which is likely to reflect Type-A order effects of some other origin, but it seems safe to assume that the effects of response bias have been removed. As the raw counts in Table 2 reveal, observers gave undecided responses predominantly around the estimated PSE for each presentation order (i.e., around the values of the location parameters a1 and a2 reported in the insets of Figure 4).
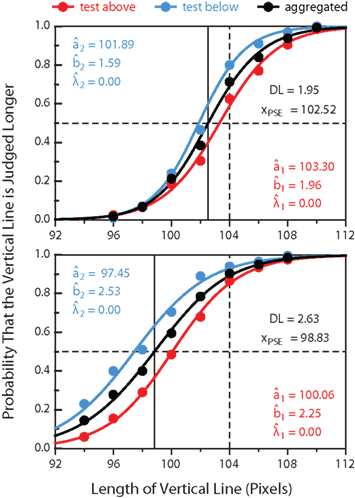
Figure 4. Data and fitted curves obtained again with the amended version of Ulrich and Vorberg’s (2009) method for the experiment in which undecided cases were recorded and counted as half right and half wrong. Estimates of xPSE (see the inset) are virtually identical to those reported in Figure 3. Also compared to Figure 3, the red and blue data sets (and the red and blue curves) are closer together, indicating that differences in performance across presentation orders are quantitatively smaller when response bias is eliminated with Fechner’s method.
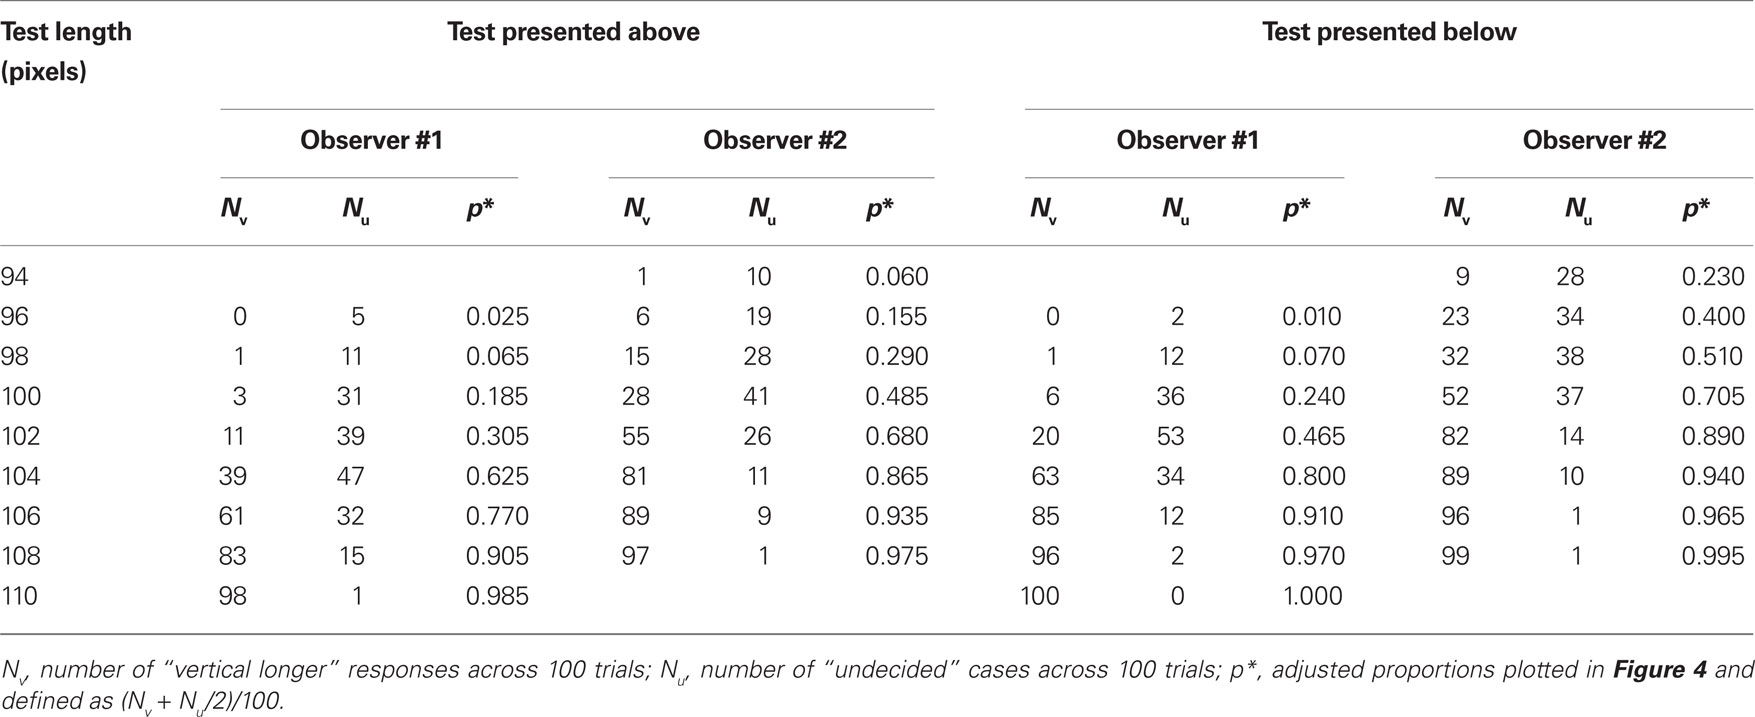
Table 2. Experimental results when undecided cases were recorded separately.
Conclusion
Ulrich and Vorberg’s (2009) contention holds in the special cases in which test and standard differ only on the dimension along which they are compared. These cases are an exception in empirical studies, which more often than not include additional differences between test and standard to assess their effect on sensory processing along the dimension of comparison, or simply to estimate the magnitude of visual illusions, aftereffects, or other instances of non-veridical perception. We have shown that their contention can be replaced by a more realistic one that renders a more general method also capable of isolating order effects and removing their contaminating effect on estimates of the difference limen. Removal of order effects caused by response bias through application of Fechner’s “half right and half wrong” treatment of undecided cases also reveals itself as a useful strategy for the investigation of order effects.
Conflict of Interest Statement
The authors declare that the research was conducted in the absence of any commercial or financial relationships that could be construed as a potential conflict of interest.
Acknowledgment
This research was supported by grant PSI2009-08800 from Ministerio de Ciencia e Innovaión (Spain).
References
Alcalá-Quintana, R., and García-Pérez, M. A. (2007). A comparison of fixed-step-size and Bayesian staircases for sensory threshold estimation. Spat. Vis. 20, 197–218.
Alcalá-Quintana, R., and García-Pérez, M. A. (2011). A model for the time-order error in contrast discrimination. Q. J. Exp. Psychol. in press.
Armstrong, L., and Marks, L. E. (1997). Differential effects of stimulus context on perceived length: implications for the horizontal–vertical illusion. Percept. Psychophys. 59, 1200–1213.
Benton, C. P., and Johnston, A. (1999). Contrast inconstancy across changes in polarity. Vision Res. 39, 4076–4084.
García-Pérez, M. A. (2010). Denoising forced-choice detection data. Br. J. Math. Stat. Psychol. 63, 75–100.
García-Pérez, M. A., and Alcalá-Quintana, R. (2005). Sampling plans for fitting the psychometric function. Spanish J. Psychol. 8, 256–289.
García-Pérez, M. A., and Alcalá-Quintana, R. (2007). The transducer model for contrast detection and discrimination: formal relations, implications, and an empirical test. Spat. Vis. 20, 5–43.
García-Pérez, M. A., and Alcalá-Quintana, R. (2010a). Reminder and 2AFC tasks provide similar estimates of the difference limen: a reanalysis of data from Lapid, Ulrich, and Rammsayer (2008) and a discussion of Ulrich and Vorberg (2009). Attention Percept. Psychophys. 72, 1155–1178.
García-Pérez, M. A., and Alcalá-Quintana, R. (2010b). The difference model with guessing explains interval bias in two-alternative forced-choice detection procedures. J. Sens. Stud. 25, 876–898.
García-Pérez, M. A., Giorgi, R. G., Woods, R. L., and Peli, E. (2005). Thresholds vary between spatial and temporal forced-choice paradigms: the case of lateral interactions in peripheral vision. Spat. Vis. 18, 99–127.
Georgeson, M. A., and Sullivan, G. D. (1975). Contrast constancy: deblurring in human vision by spatial frequency channels. J. Physiol. 252, 627–656.
Girgus, J. S., and Coren, S. (1975). Depth cues and constancy scaling in the horizontal–vertical illusion: the bisection error. Can. J. Psychol. 29, 59–65.
Hamburger, K., and Hansen, T. (2010). Analysis of individual variations in the classical horizontal–vertical illusion. Attention Percept. Psychophys. 72, 1045–1052.
Hellström, Å. (2003). Comparison is not just subtraction: effects of time- and space-order on subjective stimulus difference. Percept. Psychophys. 65, 1161–1177.
Jäkel, F., and Wichmann, F. A. (2006). Spatial four-alternative forced-choice method is the preferred psychophysical method for naïve observers. J. Vis. 6, 1307–1322.
Knapen, T., Rolfs, M., Wexler, M., and Cavanagh, P. (2010). The reference frame of the tilt aftereffect. J. Vis. 10, 1–13.
Künnapas, T. M. (1955). An analysis of the “vertical–horizontal illusion.” J. Exp. Psychol. 49, 134–140.
Mamassian, P., and de Montalembert, M. (2010). A simple model for the vertical–horizontal illusion. Vision Res. 50, 956–962.
Masin, S. C., and Fanton, V. (1989). An explanation for the presentation-order effect in the method of constant stimuli. Percept. Psychophys. 46, 483–486.
Meese, T. S. (1995). Using the standard staircase to measure the point of subjective equality: a guide based on computer simulations. Percept. Psychophys. 57, 267–281.
Morgan, M. J., Hole, G. J., and Glennerster, A. (1990). Biases and sensitivities in geometrical illusions. Vision Res. 30, 1793–1810.
Peli, E. (1995). Suprathreshold contrast perception across differences in mean luminance: effects of stimulus size, dichoptic presentation, and length of adaptation. J. Opt. Soc. Am. A 12, 817–823.
Peli, E. (1997). In search of a contrast metric: matching the perceived contrast of Gabor patches at different phases and bandwidths. Vision Res. 37, 3217–3224.
Prinzmetal, W., and Gettleman, L. (1993). Horizontal–vertical illusion: one eye is better than two. Percept. Psychophys. 53, 81–88.
Richter, H. O., Wennberg, P., and Raudsepp, J. (2007). The effects of inverting prisms on the horizontal–vertical illusion: a systematic effect of downward gaze. Exp. Brain Res. 183, 9–15.
Searleman, A., Porac, C., Alvin, J., and Peaslee, K. (2009). Manipulating the strength of the Ponzo and horizontal–vertical illusions through extraction of local cue information. Am. J. Psychol. 122, 383–394.
St. John, R., Timney, B., Armstrong, K. E., and Szpak, A. B. (1987). Changes in the perceived contrast of suprathreshold gratings as a function of orientation and spatial frequency. Spat. Vis. 2, 223–232.
Stephens, B. R., and Banks, M. S. (1985). The development of contrast constancy. J. Exp. Child. Psychol. 40, 528–547.
Ulrich, R. (2010). DLs in reminder and 2AFC tasks: data and models. Attention Percept. Psychophys. 72, 1179–1198.
Ulrich, R., and Vorberg, D. (2009). Estimating the difference limen in 2AFC tasks: pitfalls and improved estimators. Attention Percept. Psychophys. 71, 1219–1227.
Keywords: two-alternative forced-choice, point of subjective equality, difference limen, psychometric function, order effects, horizontal–vertical illusion
Citation: García-Pérez MA and Alcalá-Quintana R (2011) Improving the estimation of psychometric functions in 2AFC discrimination tasks. Front. Psychology 2:96. doi: 10.3389/fpsyg.2011.00096
Received: 10 March 2011;
Accepted: 29 April 2011;
Published online: 11 May 2011.
Edited by:
Michel Regenwetter, University of Illinois at Urbana-Champaign, USAReviewed by:
Jason W. Osborne, North Carolina State University, USAThorsten Meiser, University of Mannheim, Germany
Copyright: © 2011 García-Pérez and Alcalá-Quintana. This is an open-access article subject to a non-exclusive license between the authors and Frontiers Media SA, which permits use, distribution and reproduction in other forums, provided the original authors and source are credited and other Frontiers conditions are complied with.
*Correspondence: Miguel A. García-Pérez, Departamento de Metodología, Facultad de Psicología, Universidad Complutense, Campus de Somosaguas, 28223 Madrid, Spain. e-mail: miguel@psi.ucm.es