
- Centre for Cognitive Neuroimaging, Institute of Neuroscience and Psychology, University of Glasgow, Glasgow, UK
A commentary on
Four common conceptual fallacies in mapping the time course of recognition
by VanRullen, R. (2011). Front. Psychol. 2:365. doi: 10.3389/fpsyg.2011.00365
Filtering can distort signals (Lyons, 2004), a problem well documented for ERP data (see, e.g., Luck, 2005; Kappenman and Luck, 2010; May and Tiitinen, 2010). It is thus recommended to filter ERPs as little as possible (Luck, 2005). Recently, VanRullen (2011) provided a healthy reminder of filtering dangers. Using simulated data, VanRullen demonstrated that an effect occurring randomly between 150 and 180 ms post-stimulus can be smeared back in time by a 30-Hz low-pass filter, and appears to start at 100 ms. From this result, VanRullen concluded that if researchers filter their data, they cannot interpret the onsets of ERP effects and should limit their conclusions to peak amplitudes and latencies, without interpreting precise ERP time-courses. However, as we are going to see, we can study ERP onsets by using causal filters.
Non-Causal Filters Distort Onsets
For his demonstration, VanRullen used a zero-phase FIR filter. Zero-phase is achieved by applying the filter in the forward direction and then in the reverse direction – a non-causal filter. Causal filtering results from applying the filter in the forward direction only. Here is the crucial point: non-causal filters smear effects back in time; causal filters do not.
To illustrate, let us consider three sorts of 30 Hz low-pass filters (Figure 1; Appendix). The Butterworth filter has the lowest order, with a slow cut-off in its magnitude response. The FIR and elliptic filters have faster cut-offs but ripples in the pass-band and the stop-band. The FIR filter has a linear phase response over the pass-band, which means that every frequency is delayed by the same amount. On the contrary, the elliptic and Butterworth filters have non-linear phase responses, which can lead to phase distortions.
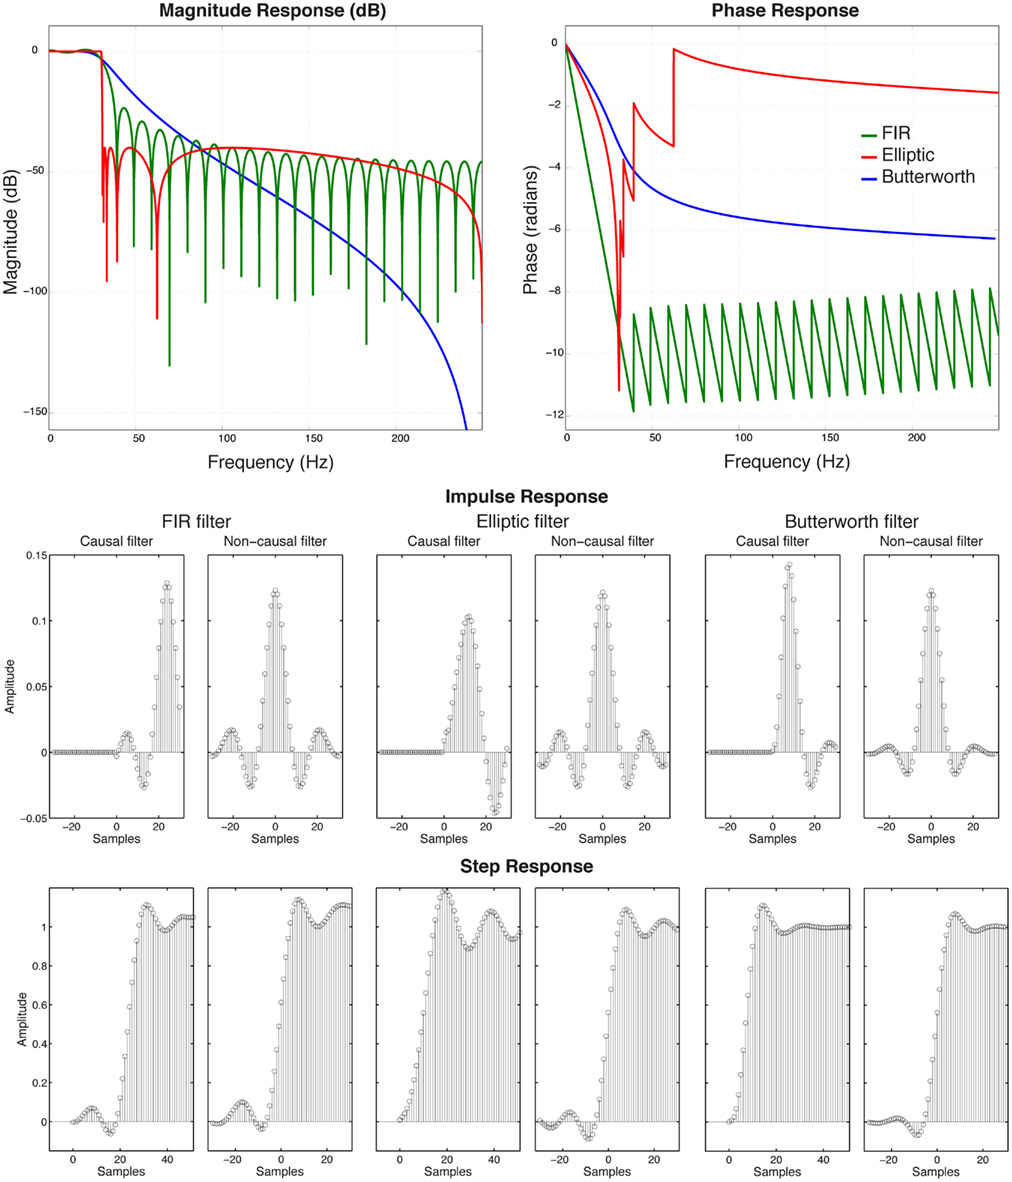
Figure 1. Magnitude, phase, impulse, and step responses of three 30 Hz low-pass filters. The FIR filter had 48 points and a transition bandwidth of 5 Hz. The elliptic filter had order 11 and a 1-Hz transition bandwidth. The Butterworth filter had order 4.
The performance of these filters is best appreciated by looking at their impulse and step responses. When these filters are applied in the forward direction only, they show only a response at or after time zero. Because of differences in magnitude response, these filters attenuate the peak of the response differently: maximum attenuation is observed for the high-order elliptic filter, followed by the FIR filter and then the Butterworth filter. In addition, faster cut-offs lead to larger side-lobes in the impulse and step responses. The peak of the response is also delayed differently by the filters, as predicted from their phase response: the FIR filter produces more delay than the elliptic filter, which is turn produces more delay than the Butterworth filter. Applying the filters in both direction leads to symmetric impulse responses. This is a necessary property of non-causal filters, but it comes at the cost of introducing side-lobes before signal onset. Thus, if we want to study ERP onsets, causal filtering is the appropriate tool.
Causal and Non-Causal Filter Distortion of Real Data
To evaluate the consequences of causal and non-causal filtering on real ERP data, I used data from a previous study (Rousselet et al., 2010) and repeated the analyses with different filters, with the unfiltered condition serving as benchmark (Appendix). The continuous raw data were filtered using the same EEGLAB FIR filter function used by VanRullen for his demonstration (Delorme et al., 2011). Similar results were obtained with a Butterworth filter. ERPs from two conditions were compared using t-tests and onsets were determined using cluster statistics (Pernet et al., 2011a).
In keeping with previous reports, high-pass filtering above 1 Hz had dramatic effects on ERP shapes. Moderate distortions were observed at 0.5 Hz and below. Compared to the raw data, ERP onsets were much shorter at 0.4 Hz and above. Filtering at 0.2 or 0.3 Hz seemed to have negligible effects. The effect of high-pass filtering was also much weaker on the median of individual onsets compared to the group onsets, which speaks in favor of single-subject analyses (Pernet et al., 2011b; Rousselet and Pernet, 2011). In contrast with VanRullen’s simulations, low-pass filtering had very little effects on the onset of ERP differences, except in few subjects. Most affected subjects actually showed delayed onsets, not shorter ones.
In sharp contrast to the distortions introduced by non-causal filters, much more drastic causal high-pass filters at 2–5 Hz can be used to remove DC drifts without affecting onsets (Appendix).
Finally, the distortions caused by non-causal filters are only problematic if researchers actually use similar filter settings. A non-exhaustive survey of the literature suggests that it is the case. Across a sample of 158 ERP studies, only one study used a high-pass causal filter. Modes and medians were both 0.1 Hz for high-pass and 30 Hz for low-pass; 21 studies used high-pass filters at 1 Hz, 1.5 Hz, or even 2 Hz; 38 studies used low-pass filters at 20 Hz or lower, and as low as 4 Hz. I am guilty of having used non-causal high-pass filters at 0.5 and 1 Hz.
In conclusion, causal high-pass filtering provides an excellent solution to study ERP onsets. Non-causal filtering might nevertheless be safe if the cut-off frequencies are far from the frequencies of the effects. Importantly, it seems that low-pass filtering has negligible effects on the time-course of the sort of large ERP effects I used here. The discrepancy with VanRullen’s results could be due to his use of a step function, which is particularly prone to ringing in the Fourier domain. However, it remains possible that low-pass filter distortions could be more detrimental at lower signal-to-noise ratios. Indeed, the results described here might not generalize to other contexts – you will need to check your own data.
Acknowledgments
Thank you to Lucas Parra for suggesting the use of causal filters to measure onsets and helping me getting the story right.
References
Delorme, A., Mullen, T., Kothe, C., Akalin Acar, Z., Bigdely-Shamlo, N., Vankov, A., and Makeig, S. (2011). EEGLAB, SIFT, NFT, BCILAB, and ERICA: new tools for advanced EEG processing. Comput. Intell. Neurosci. 2011, 130714.
Kappenman, E. S., and Luck, S. J. (2010). The effects of electrode impedance on data quality and statistical significance in ERP recordings. Psychophysiology 47, 888–904.
Luck, S. J. (2005). An Introduction to the Event-Related Potential Technique. Cambridge, MA: MIT Press.
Lyons, R. G. (2004). Understanding Digital Signal Processing. Upper Saddle River, NJ: Prentice Hall PTR.
May, P. J., and Tiitinen, H. (2010). Mismatch negativity (MMN), the deviance-elicited auditory deflection, explained. Psychophysiology 47, 66–122.
Pernet, C. R., Chauveau, N., Gaspar, C., and Rousselet, G. A. (2011a). LIMO EEG: a toolbox for hierarchical linear modeling of eletroencephalographic data. Comput. Intell. Neurosci. 2011, 11.
Pernet, C. R., Sajda, P., and Rousselet, G. A. (2011b). Single-trial analyses: why bother? Front. Psychol. 2:322. doi: 10.3389/fpsyg.2011.00322
Rousselet, G. A., Gaspar, C. M., Pernet, C. R., Husk, J. S., Bennett, P. J., and Sekuler, A. B. (2010). Healthy aging delays scalp EEG sensitivity to noise in a face discrimination task. Front. Psychol. 1:19. doi: 10.3389/fpsyg.2010.00019
Rousselet, G. A., and Pernet, C. R. (2011). Quantifying the time course of visual object processing using ERPs: it’s time to up the game. Front. Psychol. 2:107. doi:10.3389/fpsyg.2011.00107
VanRullen, R. (2011). Four common conceptual fallacies in mapping the time course of recognition. Front. Psychol. 2:365. doi: 10.3389/fpsyg.2011.00365
Appendix
Causal and Non-Causal Filter Distortion of Simulated Data
High-pass and low-pass elliptic filters were applied to a 10 Hz sin wave with onset at 20 ms. Both ends of the signal were zero-padded before filtering. The point is clear: causal filtering does not advance the onset of the sin wave, whereas non-causal filtering does (Figure A1). In Figure A1, high-pass causal filtering preserves the onset, whereas causal low-pass filtering delays the sin wave by 10 samples (20 ms). It is thus just a matter of left-shifting the filtered signal by the same number of samples to achieve zero phase.
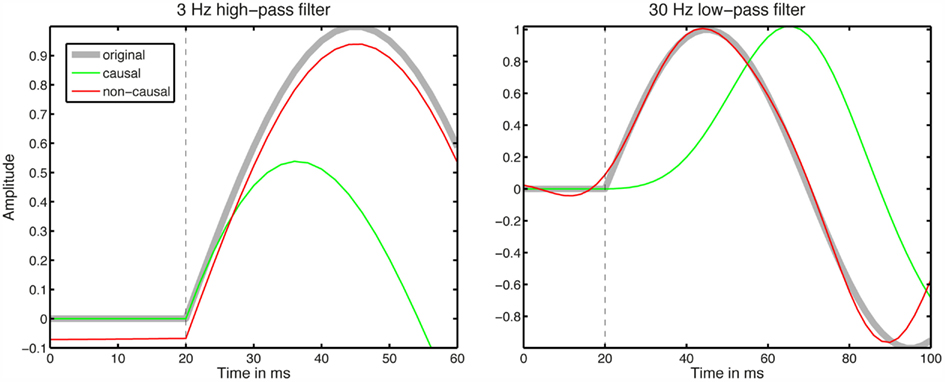
Figure A1. Distortions created by causal and non-causal filters. Left, the high-pass elliptic filter had a transition bandwidth of 1.0 Hz and its order was 6.0. Right, the low-pass filter had a transition bandwidth of 1.0 Hz and its order was 11.
Causal and Non-Causal Filter Distortion of Real Data
To quantify the effects of high-pass and low-pass filters on ERP onsets I used data from a previous study on aging and visual perception (Rousselet et al., 2010). Thirty sessions with the highest R2 from a GLM analysis were selected out of 55 sessions. Data were acquired using a 128-channel Biosemi system (http://www.biosemi.com/). During analog to digital conversion, a fifth order sinc filter was applied to prevent aliasing. The filter had a −3 dB point at 1/5th of the sample rate (512 Hz), i.e., 102.4 Hz. Data were saved to file fully DC coupled, without any high-pass filtering. Data were re-referenced offline to an average reference and down-sampled to 500 Hz. I only considered electrode B8, a right posterior electrode showing strong ERPs to objects in all subjects.
Then, I used a linear-phase least-square FIR filter, as implemented in EEGLAB’s pop_eegfilt function, which calls Matlab Signal Processing Toolbox functions firls and filtfilt. For low-pass filters, the parameters points and transition bandwidths were: 75/3 at 20 Hz, 48/5 at 30 Hz, 36/6 at 40 Hz, 30/7 at 50 Hz; for high-pass filters: 7500/0.03 at 0.2 Hz, 4998/0.04 at 0.3 Hz, 3750/0.06 at 0.4 Hz, 3000/0.08 at 0.5 Hz, 1500/0.02 at 1 Hz, 750/0.3 at 2 Hz. The continuous raw data were filtered independently with low-pass filters at 50, 40, 30, and 20 Hz, and high-pass filters at 0.2, 0.3, 0.4, 0.5, 1, and 2 Hz. Thus, including the original raw data, there were 11 filter conditions. No bad channel and artifact rejection or ICA blink correction were performed: the comparisons are paired and therefore remain valid even if data were contaminated with noise. However, to mitigate the effects of outliers, I used 20% trimmed means (Wilcox, 2005; Rousselet et al., 2008).
In the original experiment, subjects saw pictures modulated by noise along a continuum going from the original face to noise (Rousselet et al., 2010). In the current analysis, two conditions were created by grouping separately 192 face trials and 192 noise trials from the extremes of the continuum. These two conditions were compared in single-subjects and at the group level by using Yuen t-tests on 20% trimmed means (Wilcox, 2005; Pernet et al., 2011). I obtained the same results using t-tests on means. Onsets were determined after correction for multiple comparisons by using bootstrap and a max temporal cluster statistics (Pernet et al., 2011). An ad-hoc rule in which a t-test is considered significant if it is preceded for instance by 19 consecutive significant t-tests was inefficient: it did not protect effectively against false positives, with significant onsets in the baseline for group and single-subject analyses. Hence, this type of ad-hoc correction for multiple comparisons should be abandoned in favor of modern data driven techniques (Nichols and Holmes, 2002; Maris and Oostenveld, 2007; Oostenveld et al., 2011; Pernet et al., 2011).
ERP time courses and onsets are presented in Figure A2. Median onsets of face-noise ERP differences are reported in Table A1. Medians of differences in onsets between the unfiltered and the filtered data are reported in Table A2.
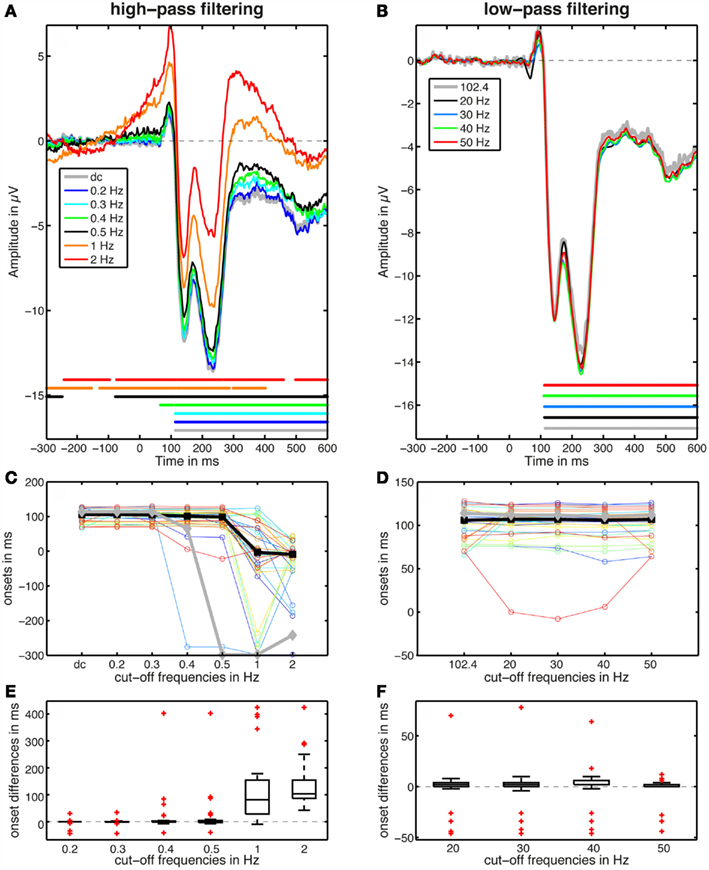
Figure A2. High-pass (left column) and low-pass (right column) filtering affects the timing of early ERP differences. (A,B) Show the group differences between ERPs to faces and noise textures. The horizontal lines indicate time points of significant differences. (C,D) Show the onsets of the ERP differences: thin lines for individual subjects, a thick black line for the median of the individual onsets, and a thick gray line for the onsets defined using group statistics [these group onsets are also shown in (A,B)]. (E,F) Show boxplots of pairwise differences between individual subjects onsets measured in the raw data and the onsets measured at other filter settings. Thus, in these boxplots, a negative number means that a later onset was observed in one filter condition compared to the reference condition.
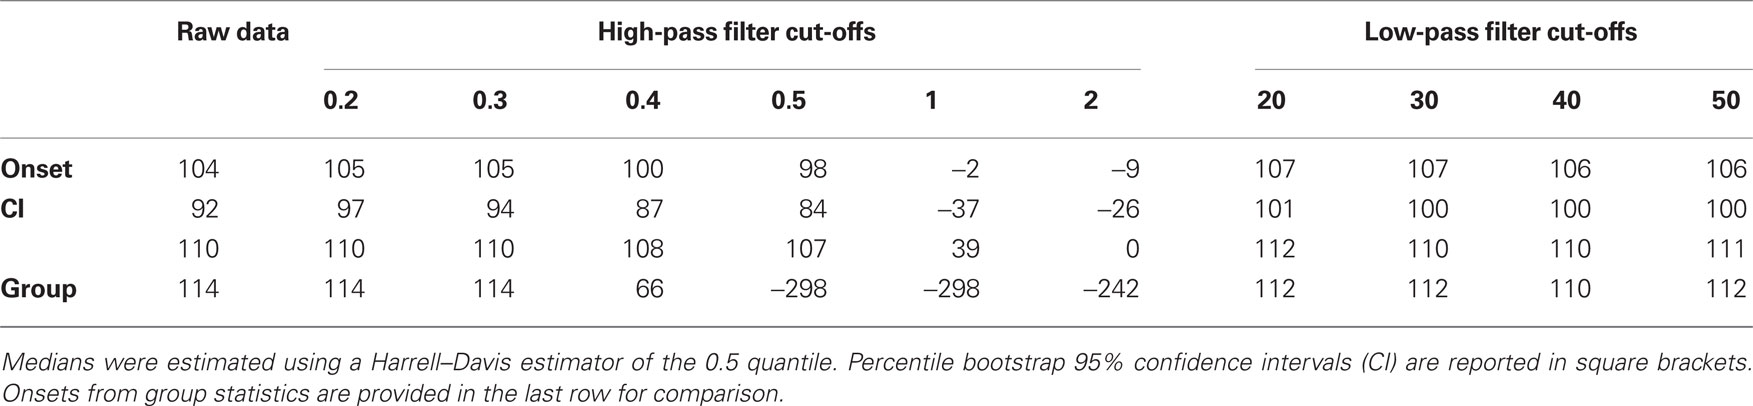
Table A1. Median onsets (ms) of face-noise ERP differences before and after application of a non-causal FIR filter.
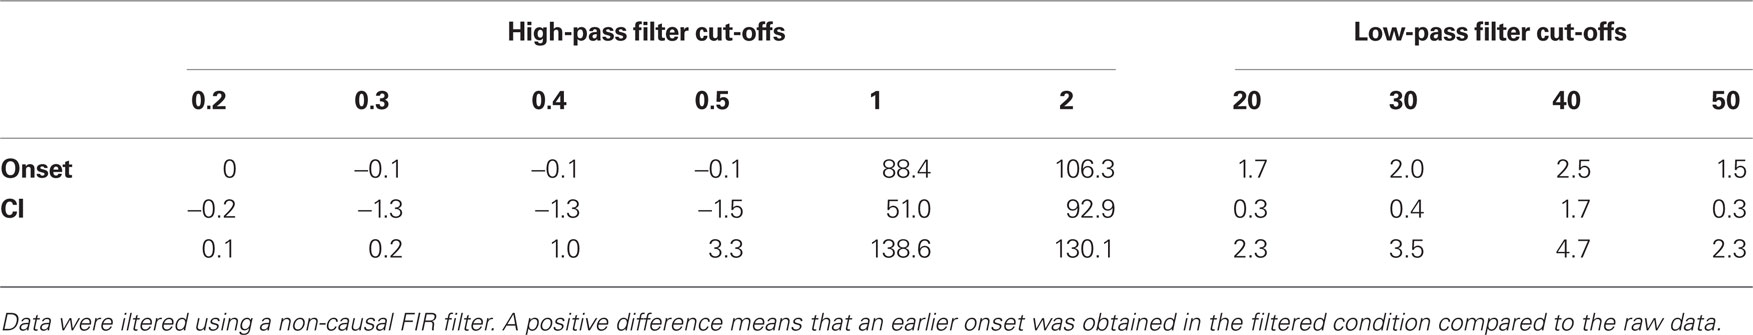
Table A2. Median of onset differences (ms) between unfiltered and filtered data.
Butterworth Filter
I repeated the same analyses as above on data filtered with a fourth order Butterworth filter as implemented in the pop_basicfilter function in ERPLAB (http://erpinfo.org/erplab), which calls Matlab Signal Processing Toolbox functions butter and filtfilt. The Butterworth filter created more distortions than the FIR filter at low high-pass cut-offs: significant baseline effects similar to those shown at 0.5 Hz in Figure A2 were observed at 0.3 and 0.4 Hz (Figure A3). Contrary to the low-pass FIR filter, the Butterworth filter did not create distortions at 20 Hz in the group averages.
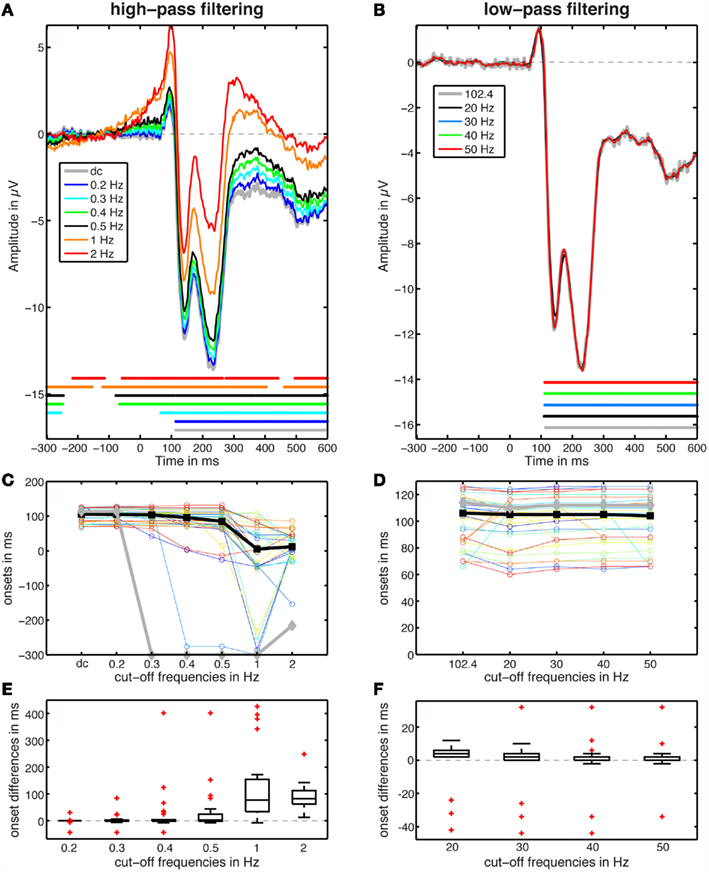
Figure A3. Effects of high-pass (left column) and low-pass (right column) filtering. A fourth order Butterworth filter was used. (A,B) Show the group differences between ERPs to faces and noise textures. The horizontal lines indicate time points of significant differences. (C,D) Show the onsets of the ERP differences: thin lines for individual subjects, a thick black line for the median of the individual onsets, and a thick gray line for the onsets defined using group statistics [these group onsets are also shown in (A,B)]. (E,F) Show boxplots of pairwise differences between individual subjects’ onsets measured in the raw data and the onsets measured at other filter settings. Thus, in these boxplots, a negative number means that a later onset was observed in one filter condition compared to the reference condition.
Causal Filtering
The same data used above were filtered with a high-pass elliptic causal filter as implemented in the iirfilt EEGLAB function, which calls Matlab Signal Processing Toolbox functions ellipord, ellip, and filter. The filter parameters were: 0.0025 dB ripple amplitude in the pass band, 40 dB ripple amplitude in the stop band, and transition bandwidths 0.2 for 0.5 Hz cut-off, 0.3 for 1 Hz, 0.7 for 2 Hz, 1 for 3 Hz, 1.3 for 4 Hz, 1 for 5 Hz (Figure A4).
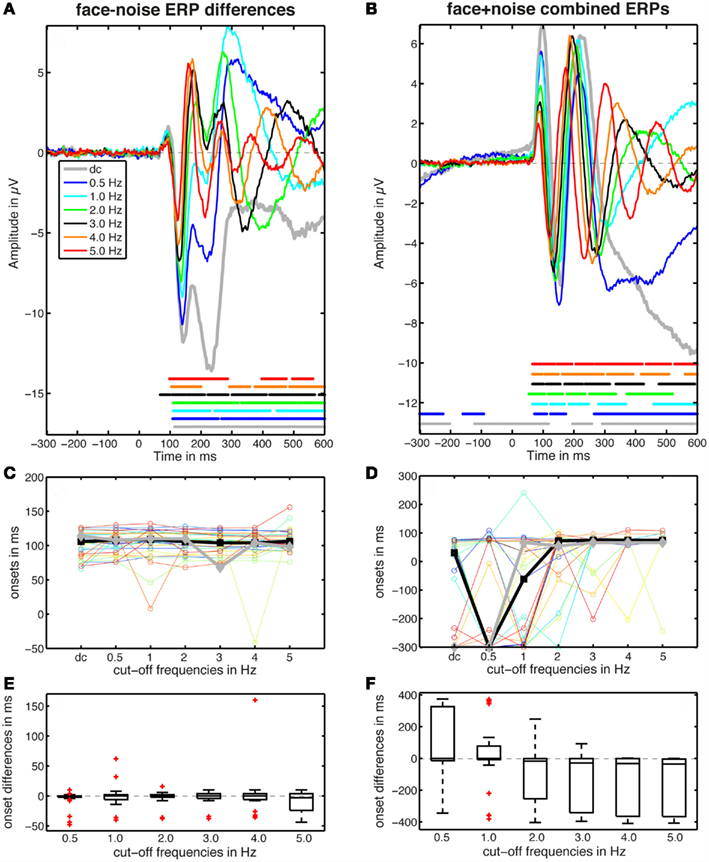
Figure A4. Effects of high-pass causal filtering on ERP data. The left column presents results for differences between ERPs to faces and noise textures. The right column presents results for combined ERPs to faces and noise textures. See Figure A2 for details about the other panels.
Median onsets of face-noise ERP differences, corresponding to the left column of Figure A4, are reported in Table A3. Medians of differences in onsets between the unfiltered and the filtered data are reported in Table A4.
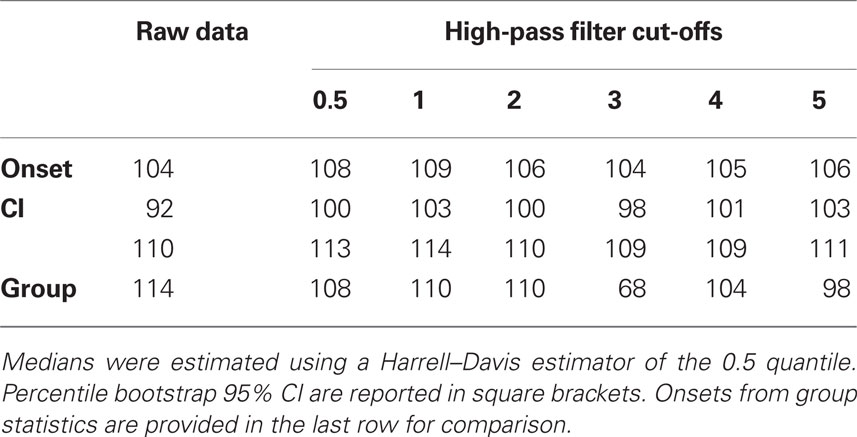
Table A3. Median onsets (ms) of face-noise ERP differences before and after application of a causal elliptic filter.
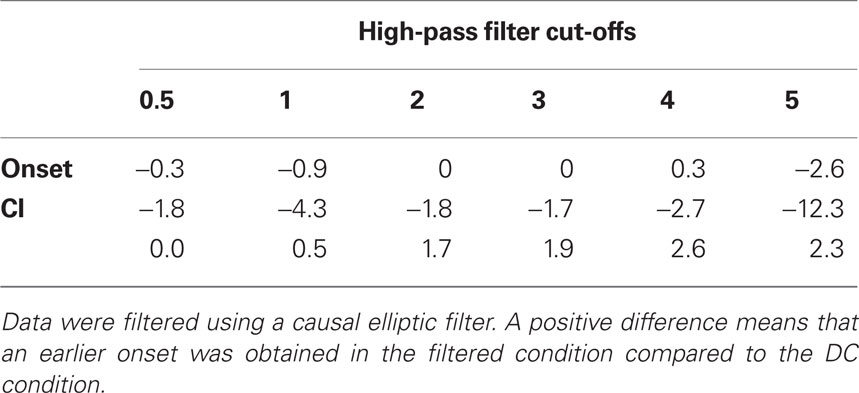
Table A4. Median of onset differences between unfiltered and filtered data.
In the right column of Figure A4, I consider the case in which one wants to determine the onset of the first ERP component, rather than the onset of a difference between two conditions. To that end, I combined together all the trials to faces and noise textures into one fake category. Thus, the DC condition is no longer flat in the baseline, because the drifts are no longer canceled by subtraction. Then, I performed one-sample t-tests against zero. For these comparisons against zero, cut-offs from 2 to 5 Hz provided flat baselines and consistent results between single-subject and group analyses. Median onsets of the first component were: 2 Hz = 71 ms [51 74]; 3 Hz = 73 [70 75]; 4 Hz = 73 [72 75]; 5 Hz = 74 [72 76].
Filter Settings in the Literature
To estimate the distribution of filter parameters used in ERP studies, I went through the methods section of all 2010 ERP papers from three journals that tend to publish a large number of ERP papers: Psychophysiology (n = 59), Journal of Cognitive Neuroscience (n = 58), Neuroimage (only the Cognitive Neuroscience section, n = 41). MEG studies were excluded, as wells as studies reporting only time-frequency analyses and the few ERP papers reporting data from monkeys. The results are reported in Figure A5.
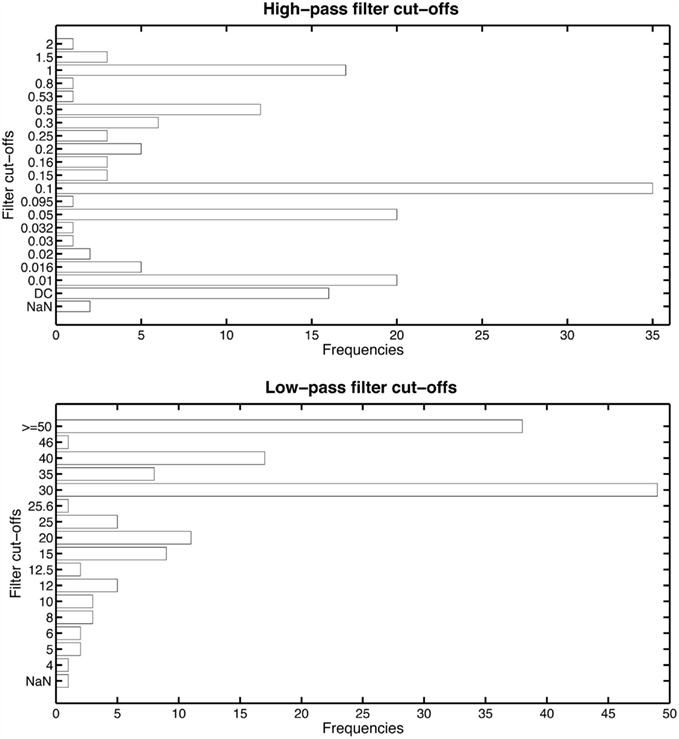
Figure A5. Frequencies of filter cut-offs in a sample of 158 ERP studies. Low-pass filter cut-offs at 50 Hz and above were grouped into one category. Cut-offs were missing in few publications (NaN). Only one publication described using a causal high-pass filter, so presumably all the other studies used non-causal filters.
References
Maris, E., and Oostenveld, R. (2007). Nonparametric statistical testing of EEG-and MEG-data. J. Neurosci. Methods 164, 177–190.
Nichols, T. E., and Holmes, A. P. (2002). Nonparametric permutation tests for functional neuroimaging: a primer with examples. Hum. Brain Mapp. 15, 1–25.
Oostenveld, R., Fries, P., Maris, E., and Schoffelen, J. M. (2011). FieldTrip: open source software for advanced analysis of MEG, EEG, and invasive electrophysiological data. Comput. Intell. Neurosci. 2011, 156869.
Pernet, C. R., Chauveau, N., Gaspar, C., and Rousselet, G. A. (2011). LIMO EEG: a toolbox for hierarchical linear modeling of eletroencephalographic data. Comput. Intell. Neurosci. 2011, 2011.
Rousselet, G. A., Gaspar, C. M., Pernet, C. R., Husk, J. S., Bennett, P. J., and Sekuler, A. B. (2010). Healthy aging delays scalp EEG sensitivity to noise in a face discrimination task. Front. Psychol. 1:19. doi: 10.3389/fpsyg.2010.00019
Rousselet, G. A., Husk, J. S., Bennett, P. J., and Sekuler, A. B. (2008). Time course and robustness of ERP object and face differences. J. Vis. 8, 1–18.
Wilcox, R. R. (2005). Introduction to Robust Estimation and Hypothesis Testing. New York, NY: Elsevier Academic Press.
Citation: Rousselet GA (2012) Does filtering preclude us from studying ERP time-courses? Front. Psychology 3:131. doi: 10.3389/fpsyg.2012.00131
Received: 05 March 2012; Accepted: 12 April 2012;
Published online: 04 May 2012.
Copyright: © 2012 Rousselet. This is an open-access article distributed under the terms of the Creative Commons Attribution Non Commercial License, which permits non-commercial use, distribution, and reproduction in other forums, provided the original authors and source are credited.
*Correspondence: guillaume.rousselet@glasgow.ac.uk