 Sergiu Tcaci Popescu* Mark Wexler
- Laboratoire Psychologie de la Perception, CNRS and Université Paris Descartes, Paris, France
People often perform spontaneous body movements during spatial tasks such as giving complex directions or orienting themselves on maps. How are these spontaneous gestures related to spatial problem-solving? We measured spontaneous movements during a perspective-taking task inspired by map reading. Analyzing the motion data to isolate rotation and translation components of motion in specific geometric relation to the task, we found out that most participants executed spontaneous miniature rotations of the head that were significantly related to the main task parameter. These head rotations were as if participants were trying to align themselves with the orientation on the map either in the image plane or on the ground plane, but with tiny amplitudes, typically below 1% of the actual movements. Our results are consistent with a model of sensorimotor prediction driving spatial reasoning. The efference copy of planned movements triggers this prediction mechanism. The movements themselves may then be mostly inhibited; the small spontaneous gestures that we measure are the visible traces of these planned but inhibited actions.
Introduction
Motor Activity in Spatial Tasks
Have you ever asked for directions in a department store? A salesperson might respond as follows, “Take the elevator to the upper floor and then [pointing to the left] you need to go to the left and… ahhm… [slight clockwise rotation of the head and shoulders] take the second aisle on your right.” The first gesture illustrates the directions that immediately follow. The nature of the second gesture, on the other hand, is less clear: it appears to be a spontaneous movement accompanying and perhaps facilitating the solution of the following problem: “If I were on the top floor facing left after the elevator, should I turn right or left to get where I want?” These movements are the subject of the current paper: spontaneous motions that are produced during spatial problem-solving involving an imaginary change of perspective.
Spontaneous gestures in spatial tasks have been studied by Chu and Kita (2008), who showed that the participants in their study spontaneously produced hand gestures while performing a Shepard and Metzler (1971) mental rotation task. In a second study, Chu and Kita (2011) found that more spontaneous gestures were produced in difficult spatial visualization problems than in easier ones.
Movements have been shown to enhance performance on a variety of tasks, both sensorimotor and speech-related. One role of movements is to reduce cognitive load. For example, gesturing increased the performance in a coin counting task, which was otherwise limited by the difficulty in remembering which coins had already been counted (Kirsh, 1995). In a dual-task paradigm, gesturing while verbally explaining the solution to a mathematics problem enhanced the performance on a concurrent task of word or letter retention (Goldin-Meadow et al., 2001; for a review see also Goldin-Meadow, 1999). More indirectly, when playing the computer game Tetris, both novices and experts executed rapid rotations of figures (via keystrokes) as a substitute to costly mental rotations (Kirsh and Maglio, 1994).
Motor activity can also trigger mechanisms that simulate the outcome of an action (see Wolpert and Flanagan, 2001, for a review of sensorimotor prediction) and thus infer otherwise unavailable information. For instance, Wexler et al. (1998) and Wohlschläger and Wohlschläger (1998) showed that unseen manual rotations improved performance in mental rotation tasks when the mental and manual rotations were in the same direction, and interfered with mental rotation when the two were in opposite directions. Wexler and Klam (2001) showed that manual action on an unseen object can increase the accuracy when predicting its trajectory. Schwartz and Black, 1999; see also Schwartz, 1999) showed their subjects glasses of various dimensions and shapes, filled by imagined water whose level was marked by a line; the task was to estimate the angle by which the glass had to be tilted for the water to start pouring out. Performance was significantly better when participants, with eyes closed, could actually tilt an empty glass, or imagined doing so, than when they used their descriptive knowledge to find the correct tilt angle. Adding to the same idea, the study of Chu and Kita (2011) mentioned above showed that encouraging participants to use hand gestures helped in a mental rotation task; moreover, the benefit of gesturing in a first mental rotation task extended to a subsequent, same or different spatial task (mental rotation and paper folding) in which participants could not gesture but that benefit did not extend to non-spatial tasks (digit span and visual pattern task).
The conclusion that we may draw from these results is that the execution of at least some of the visuo-spatial tasks described above includes a motor component that can either improve task performance or interfere with it. This conclusion is supported by the findings of neuroimaging studies showing, on the one hand, that mental image transformations engage the motor control system and, on the other hand, that this motor activity has a functional role in the performance of the task (for a review of neuroimaging studies, see Zacks, 2008).
Spatial Perspective-Taking
Spatial perspective-taking (or imagined perspective-taking) occurs when one adopts a viewpoint different from one’s physical viewpoint. In our initial example, in order to tell the correct direction of the final turn, the salesperson had to imagine having turned left after exiting the elevator on the upper floor, i.e., to adopt an imagined orientation. Spatial perspective-taking is particularly important in navigation, when planning one’s route or when remotely guiding a person or a device.
Tasks of three main types have been used so far to study imagined perspective-taking. In pointing tasks, participants learn the spatial positions of a number of objects and are asked to imagine themselves at the position of one the objects, or looking at one of the objects, and to point to another object or tell if it is to their right or left. The objects can be physically arranged around the participants, represented on a map or in a virtual reality environment, and the shape of the object array can be more or less regular. In change detection tasks, participants also learn the spatial positions of the objects in an array; the position of an object is covertly changed by the experimenter and the array shown again but from a novel viewpoint that is either due to the movement of the array or to participants’ self-motion. The participants are required to detect which object has changed position. The third type of task requires participants to adopt the perspective that they would have at the end of a navigation path as if they had actually traveled it, and to point to the origin of the path from that imagined viewpoint. In all the tasks, the imagined or novel perspective can differ from the actual or initial one by a translation, a rotation, or both. Baseline performance [response time (RT) and error] in these tasks is measured in the condition when the imagined perspective coincides with the actual physical perspective. In the following paragraphs of this section we will summarize the main findings of studies that used the tasks described above.
Spatial perspective-taking is more difficult when the imagined perspective differs from the actual (physical) one by a rotation than by a translation; performance after an imagined translation does not differ from baseline (Rieser, 1989; Presson and Montello, 1994; although Easton and Sholl, 1995 found that imagined translation distance affects the RT). Performance after an imagined rotation depends on the absolute magnitude of the rotation angle between the actual and the imagined perspective and shows the typical and robust angular disparity effect: the bigger the angle of rotation to the imagined perspective, the lower the performance (Rieser, 1989; Easton and Sholl, 1995; Roskos-Ewoldsen et al., 1998; see also Shelton and McNamara, 1997). In our study we therefore concentrated on the study of imagined rotations and the angular disparity effect.
More importantly, when people are allowed to move to the location of their imagined or novel perspective, even in absence of visual and auditory cues, performance after perspective rotations is greatly facilitated and may even attain the baseline level. In this condition, the imagined rotations no longer show an angular disparity effect (Rieser, 1989; Presson and Montello, 1994; Farrell and Robertson, 1998; Klatzky et al., 1998; Simons and Wang, 1998; Wang and Simons, 1999; Wraga, 2003; Avraamides et al., 2004; but see Riecke et al., 2007). These findings show that movements facilitate the performance of imagined rotations.
Simons and Wang (1998) (see also Wang and Simons, 1999) used a change detection task in which they compared performance after a viewpoint change resulting from either observer or from array motion. First, they found that performance was higher in the observer motion than the array motion condition (despite identical proximal stimuli). Second, and more interestingly, in the observer movement condition, performance was better when the view of the array reflected observer movement and therefore was different from the initial view, than when the initial view was shown after the movement as if the array rotated along with the observer. In other words, participants performed better when the perceptual change of viewpoint was consistent with the result of their motion. Farrell and Robertson (1998) found a similar result with a pointing task, asking participants to ignore the consequences of a physical rotation: they showed that ignoring a rotation was as hard as imaging one, hence when people move, the cognitive process that updates their spatial relationship to the environment seems to be automatic (a process that is termed “spatial updating;” e.g., Wang et al., 2006). These studies highlight the role of the observer’s own movements in performing imagined rotations and perhaps point to a sensorimotor prediction mechanism at work.
Our Hypotheses and Experiment
We now return to the original observation of spontaneous movements during spatial perspective-taking, as in the case of the department-store salesperson. What is the exact relationship between these movements and the mental task being performed? The studies cited above lead us to believe that spatial updating would be simple and automatic if the salesperson were to perform the full rotations that he or she imagines: he or she would simply and effortlessly know whether to turn left or right at the end. The updating is therefore driven by a sensorimotor prediction mechanism, and this mechanism is activated by motor plans or efference copies of the motor command (Wolpert and Flanagan, 2001). The planned action itself could be wholly or partly inhibited further downstream in the motor system. Are the salesperson’s small spontaneous movements a visible reflection of such simulated but inhibited actions? If so, then the spontaneous movements should be correlated in some geometrically specific way with the mental task being performed. To determine if this is so was the major goal of our study.
We used a perspective-taking task somewhat similar to those of Hintzman et al. (1981) and Roberts and Aman (1993). The stimuli resembled a simplified “you-are-here” map, with two streets that were oriented at various angles. Participants were asked to imagine themselves at a marked location on one of the streets, facing the intersection – this defined an imagined orientation. Participants were told that their goal was to reach a location marked on the other street (see Figure 1), their task being to indicate whether they would turn right or left at the intersection to reach the goal location. Pilot studies had shown that the task was easiest when the imagined orientation was vertical, facing upward, and that task difficulty increased as the angle between the imagined orientation and the upward direction – which we call the deviation angle – increased. We therefore varied the deviation angle, as well as the angle between the two streets.
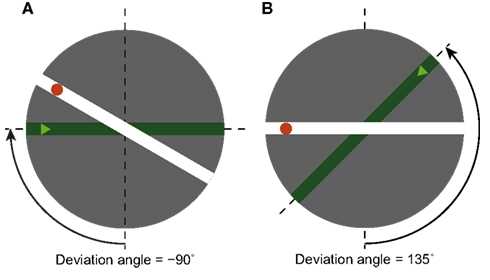
Figure 1. Two examples of stimuli (the dashed lines, the angle arrow and text were not part of the stimuli). Every stimulus represents the crossing of two streets. Participants imagined being on the dark green street, at the position of the triangle, and facing the intersection. We call this orientation the imagined orientation. The task was to decide if at the intersection one should turn left or right in order to reach the red dot on the other street. We call the angle between the 6 o’clock (or upward-facing) direction and the imagined orientation the deviation angle. (A) An example stimulus with deviation angle of −90°. (B) An example stimulus with deviation angle of +135°.
While participants performed this task, we measured the spontaneous movements of their head and shoulders. To our knowledge, this is the first time that spontaneous movements have been measured during a spatial orientation task. Our goal was to measure and characterize these movements, and to determine whether and how they were correlated with the concurrent spatial task.
Any attempt at finding correlations between voluminous motion tracker data and the sparse task parameters is a daunting task: how do we isolate the relevant invariants in the mountain of motion data?1 Initially, we simply looked at motion extent, and found that participants spontaneously moved further with increasing task difficulty (i.e., increasing deviation angle). We then decomposed motion into rotations and translations, separately for the head and shoulders. The extent of maximal rotations was also positively correlated to task difficulty. However, participants may have moved further on difficult trials simply because they had more time. We therefore searched for a more specific geometrical relation between task and spontaneous motion: trials with opposite deviation angles should result in motions – rotations or translations – in opposite directions. We found a significant linear relationship between both amplitude and direction of spontaneous head rotations and the deviation angle in a majority of our participants.
Materials and Methods
Participants
Twenty-four unpaid participants took part in the experiment. The motion tracking data of five participants did not attain our inclusion criterion (see below) and were discarded. We therefore performed all analyses on the data of the remaining 19 participants (8 women, mean age 33.8, SD 7.1 years).
Task and Stimulus
The participants were told to watch a simple map on a computer display (see Figure 1). The map, which was round and with a grey background (subtending a visual angle of about 11°), represented an intersection of two streets, depicted in distinct colors: deep green and white. The map was displayed at the center of a computer monitor, with the rest of the display black. The participants were told to imagine that they were located on the green street, at the position marked by a light green triangle, and facing the intersection. We will call this orientation the imagined orientation. The participants’ task was to answer as quickly and accurately as possible if, at the intersection, they needed to turn left or right in order to reach the red dot.
The stimuli were parametrized by two variables: the deviation angle (see Figure 1), and the corner angle (not shown in Figure 1). The deviation angle is the angular difference between the imagined orientation (i.e., the orientation of the green street, facing the intersection), and the 6 o’clock orientation – at which the imagined orientation would be facing upward on the map. We take the upward orientation as our “zero” because both previous studies and pilot results showed that it is easiest to perform the task when one’s initial imagined orientation is upward.2 Deviation angles are taken as positive counterclockwise and negative clockwise; for example, the imagined orientation at 9 o’clock corresponds to deviation angle −90° (Figure 1A). The second independent variable, the corner angle, is the angle between the two streets on the map. It was used to mask the similarity between the trials with the same value of the deviation angle. Positive corner angles correspond to right turns, negative to left turns; corner angles with absolute values below 90° correspond to acute turns, those with absolute values over 90° to obtuse turns.
Procedure and Apparatus
Participants were seated at about 60 cm from a vertically oriented computer display on which the stimulus was displayed. They used the left and right shift keys on a computer keyboard to answer respectively “left” and “right” with the corresponding hand.
Each trial began with the display of a central red cross that the participants were instructed to fixate. After 0.5 s, the stimulus appeared and was displayed until the participant pressed one of the two keys to answer. We recorded both the response and the RT.
Every experimental session started with 10 practice trials. Participants were given feedback only during those trials. The 500 experimental trials followed. Every 100 trials were followed by a pause; its duration was variable but did not exceed 5 min. The entire experimental session lasted about 40 min.
Motion Capture
Participants head and shoulder movements were recorded using a CODA cx1 scan unit of a Codamotion optical motion tracking system (Charnwood Dynamics Ltd, UK). It uses small remote active motion sensors that communicate via infrared with motion cameras (one camera in our experiment). Three sensors were placed on a light rigid helmet that participants wore during the trials, with the helmet fitted tightly to the head in order to minimize independent motion. The sensors were placed to form a triangle with its upper vertex positioned roughly on the sagittal suture in the center of the parietal area and the two lower vertices on each lateral side of the occipital area. The helmet did not obstruct the eyes or the ears. Another three sensors were taped to participants’ shirts at the shoulders, to form a triangle with its upper vertices a few centimeters below each scapular acromion end and the lower vertex on the vertebral column.
The tracking system recorded the spatial coordinates of each sensor at a sampling rate of 200 Hz. The angular resolution of the camera was about 0.002°; this results in a lateral position resolution of about 0.05 mm at 3 m distance (horizontally and vertically), and a distance resolution of about 0.3 mm. (Note, however, that the full position error also included systematic errors that are difficult to quantify.) The orientation of the axes was as follows: the X axis pointed to the right of the participant, the Y axis to the front, and the Z axis upward (following a right-hand rule).
Design
We used a within-participant factorial design. The main independent variable, the deviation angle, had eight levels (0°, ±45°, ±90°, ±135°, 180°). The second independent variable, the corner angle, had 10 levels (±30°, ±60°, ±90°, ±120°, ±150°). The crossing of the levels of the two factors resulted in 80 conditions. Participants completed 500 trials (5 repetitions for each condition except for deviation angle angles of 0° and 180°, for which 10 repetitions were set). Trials were presented in random order.
Data Analysis
Data filter
The motion tracking system was unable to supply sensor position data on some trials. We set an inclusion criterion for the raw motion data: a trial was considered valid if all sensor values were available for at least half of its duration and only subjects with at least 50% of valid trials were included in the motion analysis. The motion data of five participants did not attain this criterion and were discarded. We have further applied a criterion to the valid trials of each participant: only data from correctly answered trials with a RT that did not exceed the mean RT plus 3 SD were included in the analyses of responses and motion. A rectangular moving average filter of 20 samples (0.1 s) was applied in order to smooth the motion data.
The trials with a deviation angle of 180° were excluded from the analysis of the geometrical properties of rotations and translations as the sign of the angle is not informative in that case (angles of ±180° result in the same imagined orientation) and cannot be used to discriminate the direction of rotations or translations.
Motion data analysis
As a preliminary test of our hypothesis, we wanted first to find out whether participants moved more on trials with higher values of the deviation angle, irrespective of the kind of motion (translation and rotation). If participants did not move more for higher values of deviation angles, our hypothesis would be invalidated from the start. A positive answer, on the contrary, would require further and finer analyses of motion. We used the distance traveled by a body part (head or shoulders) as a first measure of motion. For every trial we computed the length of the path traveled by each of the three sensors from stimulus onset until participant’s response (by summing the absolute Euclidean distances between all successive samples of a sensor), and we selected the maximum path length among the three sensors for each body part as the representative value of the its motion extent. Since the path length is always positive, it did not allow us discriminate between trials with positive and negative deviation angles, we therefore posited a simple regression model of the path length on the absolute values of deviation angle:
where P i is the maximum path length of the three motion sensors on trial i (expressed in mm), θi, the deviation angle on that trial, b, a regression coefficient, and a, a constant term. If the slope is found to be positive, we could proceed to a more specific analysis, which consists in decomposing the motion in its translational and rotational components and analyzing their geometrical specificity in relation to the signed values of deviation angles.
For the sake of the detailed motion analysis, we assume that the head and shoulders each undergo rigid motion in space – a combination of rotation and translation. This assumption obviously makes sense for the head, and is probably reasonable for the shoulders as well (unless our subjects did a lot of shrugging, or wore very loose-fitting shirts). If we have sensor readings from three sensors sampled at two different times, and we assume rigid motion, there are exact formulas that allow us to disentangle the rotation and translation components of the motion. However, these formulas are not very robust to noise, of which we have two types: the non-rigidity of the actual motion (presumably worse for the shoulders than the head), as well as the systematic distortions and random noise in the motion tracker. Instead, we therefore extracted the rotation and translation in a different way, using an optimization algorithm. We first calculated the relative vectors between the three sensors, which isolates the rotation component of the rigid motion. Our algorithm then searched through the (3D) space of rotations, finding the rotation that most closely matched the final relative vectors. We calculated the translation separately by performing vector subtraction between centers of mass of the three sensors for the head and shoulders.
Before we turn to the results of our motion analysis, a word about how we represent rotations. In three dimensions, the rotations form a 3D Lie group, which has several properties that make operations on rotations, and notably statistics of rotations, difficult: 3D rotations are not only cyclical (which is what makes circular statistics hard), but also non-commutative (changing the order of rotations changes the outcome). In our case, however, rotations were small, typically no more than 5° or 10° over the course of a trial. We therefore used the axis-angle representation of rotations, in which a rotation by angle θ about axis â is represented by the 3D vector θâ, whose length is the angle of rotation and whose direction is the axis. This representation is faithful, in the limit of small rotations: if two rotations are represented as vectors in this way, the representation of the composition of the two rotations is approximately the sum of the two vectors (Goldstein et al., 2001). This relation becomes exact in the limit of small rotations. We will therefore represent our rotation as vectors in a 3D space, where the origin is the identity (no rotation), and where vectors’ lengths correspond to rotation angles and directions correspond to rotation axes (see Figure 2 for an example). This representation allows us to represent the directions of rotations and not only their amplitudes: a 5° rotation about the X axis is represented differently than a 5° rotation about the Y axis, and differently than a −5° rotation about the same X axis.
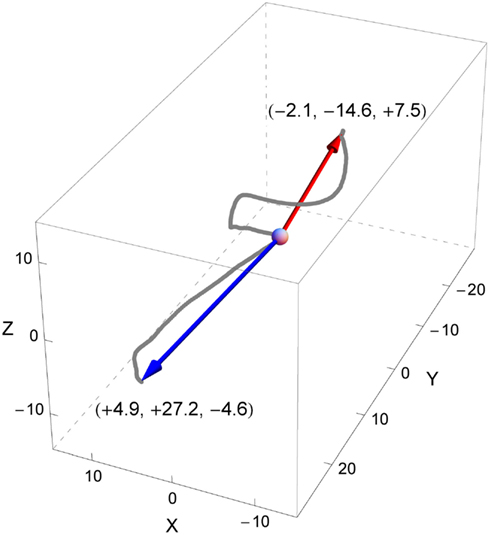
Figure 2. An example of a participant’s head rotations during two trials (red for one trial, blue for another), represented in the space of rotations. The deviation angles in both trials had the same absolute value of 135° but opposite signs (positive for the red trial, negative for the blue). The curves are constituted of dots that represent the terminal points of all rotation vectors (axis-angle representation) computed for each sample of the trials. The origin of the rotation space (corresponding to the initial orientation of the head at the beginning of each trial) is depicted by the gray sphere. The arrows represent the maximum rotation vectors of the head for each trial. Each arrow represents the axis of rotation (by its orientation), the direction of rotation (by its sense), and the angle or amplitude of rotation (by its length). Note that in our example the rotation axes of both trials have about the same direction but opposite signs denoting that in both trials the head has rotated around roughly the same axis but in opposed directions. Here, the main component of the rotation is about the Y axis, which suggests a rotation similar to a head roll, inclining the head to the left for the positive deviation angle (red trial) and to the right for the negative deviation angle (blue trial).
For each sample of sensor positions provided by the motion tracker, we computed participants’ head and shoulder rotations (axes and angles) and translations with respect to their initial orientation and position, respectively. We then selected the maximum values of rotation and translation reached during the trial, i.e., the rotation with the maximum angle and the translation with the greatest Euclidean distance (see the arrows representing the maximum rotations during two distinct trials in Figure 2).
If the spontaneous movements performed during our task are a visible reflection of a planned but inhibited action of actually changing the body orientation, the characteristics of these spontaneous movements (i.e., direction and amplitude of head/shoulder rotations or translations) should be correlated to the characteristics of the mental task hence to parameters that differentiate the trials, namely to the deviation angle. Thus, an imagined clockwise orientation change, for example by 45°, could trigger an incipient small rotation of the head or the shoulders about some axis; a larger 135° rotation in the same direction could cause a larger body part rotation about a similar axis; an imagined counterclockwise orientation change could trigger a rotation in the opposite direction. Figure 3 shows an example of actual values of maximal rotations for one participant, marked so as to show the corresponding deviation angles.
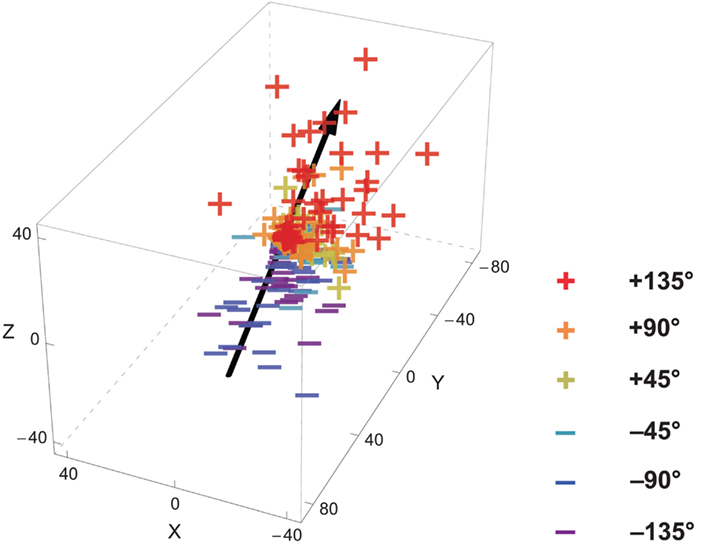
Figure 3. An example of participant’s maximum head rotation vectors for all trials and the computed head rotation axis. The “+” and “−” depict the terminal points of the maximum rotation vectors (see Figure 2) for trials with respectively positive and negative deviation angles. The black line represents the computed head rotation axis. It is derived by performing a linear regression of the observed maximum rotation vectors on the corresponding deviation angles. The orientation of the line in space represents the average rotation axis.
However, we could not predict the axis about which these spontaneous rotations take place. We therefore posited the following simple linear regression model, in terms of axis-angle rotation vectors (indicated in boldface) for the relation between spontaneous movements and task variables:
where R i is the maximum rotation – of either the head or the shoulders – on trial i (expressed in the axis-angle vector representation described above), θi the deviation angle on that trial, and r a triplet of regression coefficients. Thus, the vector r represents the rotation (again, as a vector in axis-angle space) that the participant would perform for deviation angle θ equal to 1°. We decomposed this vector into its axis-angle components:
where its length or norm, z, is a regression coefficient that we will call the spontaneous rotation coefficient, and its direction, â, the unit vector that corresponds to the axis of rotation. The linear regression is depicted in Figure 3: the line shows the direction of the axis â.
Thus, the spontaneous rotation coefficient z is always positive or 0. If z turns out to be equal to 1, then spontaneous rotations would, on the average, have the same amplitude as the deviation angle (a trial with 90° deviation angle would result in a 90° turn about some axis). If, on the other hand, the spontaneous rotation coefficient turns out to be 0, then there is no systematic linear relation between the spontaneous movements and the deviation angle. Finally, if the spontaneous motion coefficient is found to have some intermediate value, say 0.01, then participants spontaneously rotate – about an axis â that we will calculate – with an amplitude equal to 1% of the deviation angle. Our regression therefore yields both the spontaneous rotation coefficient and the axis of spontaneous rotation.
We posited a similar model for translations:
where T i is the maximum translation vector of the head or shoulders, and û is a unit vector indicating the direction of translation, and w the spontaneous translation coefficient.
To calculate statistical confidence intervals of these spontaneous motion coefficients, we performed a bootstrap (Efron and Tibshirani, 1994). For each bootstrap resample j, we calculated the rotation vector r(j) [or the translation w(j)t(j)]. We then calculated a 95% confidence ellipsoid for these points. If the origin fell outside this ellipsoid, then the regression was said to yield a coefficient statistically different from 0. We used the geometric mean of the ellipsoid semi-axes as a measure of SE of the spontaneous motion coefficients.
Results
RT and Error Rates
Overall, the mean reaction time on raw unfiltered data was 1.17 ± 0.38 s (± between-subject SD). Increasing the deviation angle (the difference between the imagined orientation and the upward orientation) lowers performance, increasing both RT and error rates, as shown respectively in Figures 4 and 5.
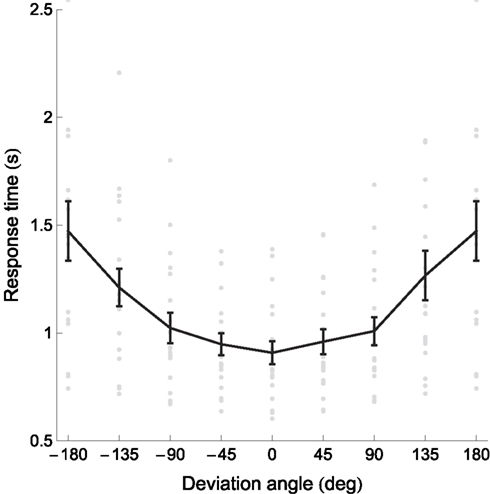
Figure 4. Response times and error rates increase with absolute deviation angle. Gray dots represent individual participants’ data, the black curve the mean, and error bars between-subject SE. The data for deviation angles ±180° is shown twice. Several outlying datapoints are not shown. Figure 4 shows the response times.

Figure 5. Response times and error rates increase with absolute deviation angle. Gray dots represent individual participants’ data, the black curve the mean, and error bars between-subject SE. The data for deviation angles ±180° is shown twice. Several outlying datapoints are not shown. Figure 5 shows the error rates as a function of the deviation angle.
The mean reaction time was submitted to a repeated-measures ANOVA with the factors: sign of deviation angle (two levels), absolute value of deviation angle (six levels, excluding 0° and 180°), sign of corner angle (two levels) and absolute value of corner angle (five levels). The analysis revealed a significant main effect of absolute value of the deviation angle (F2,36 = 29.1, p < 0.001, Huynh–Feldt corrected), a significant main effect of the sign of corner angle (F1,18 = 16.9, p < 0.001), a significant main effect of the absolute value of corner angle (F3.4,60.6 = 8.3, p < 0.001) and a significant third-order interaction between the sign of deviation angle, the sign of the corner angle and the absolute value of corner angle (F2.8,50.9 = 4.3, p < 0.01). This interaction is another, more complex, manifestation of left-right asymmetry: for positive deviation angles, participants always respond faster for right turns than for left, whereas for negative deviation angles, the right-left turn asymmetry depends on the amplitude of the corner angle, namely it is absent for the most acute turns (corner angle of 30°) and grows steadily as the turns become more and more obtuse. We have no explanation to offer for this complex interaction. The main effect of the sign of the deviation angle was not statistically significant nor were the other interactions.
With regard to our stimulus, the sign of the corner angle indicates the correct direction of the turn at the intersection of the two streets: positive corner angles correspond to a right turn and negative corner angles correspond to a left turn. It appears from our results that across all magnitudes of the corner angle, turning right in our task is quicker by about 100 ms than turning left (1.023 ± 0.065 s and 1.119 ± 0.081 s, ±SEM). Post hoc pairwise comparisons of the effects of absolute corner angles reveals, on the one hand, a significant difference (at p < 0.05 after Bonferroni’s adjustment) between the corner angles of 150° and those of 60°, 90°, and 120°, on the other hand, the difference between corner angles of 150° and 30° is not statistically significant. Despite the fact that a finer analysis of the effects of the sign and absolute magnitude of corner angle could lead to potentially interesting findings, in the following, we focus on the effect of the deviation angle as it corresponds to our main interest.
To quantify the relation between the deviation angle and the RT, we calculated the slopes of the linear regression of the RT on the absolute values of the deviation angle for every participant. (Since the sign of the deviation angle has no effect on the RT, we collapsed data for positive and negative deviation angles.) All individual slopes were positive and statistically significant (bootstrap with 104 resamples, p < 0.05); the mean slope was 3.09 ± 2.30 ms/° (± between-subject SD). In other words, mean RT increased by 3.09 ms for every additional degree of deviation angle. The plot of RT versus deviation angle (Figure 4) has a noticeably curvilinear shape, with the RT slope seemingly higher for deviation angles above 90°. The mean slope for deviation angles between 0° and 90° was 1.20 ± 0.89 ms/°, whereas between 90° and 180° it was 5.05 ± 3.82 ms/°. This difference between slopes for small and large deviation angles was statistically significant (paired t18 = 5.41, p < 0.0001) and showed that RTs increased faster (more than four times faster, according to the means) as a function of deviation angle above 90°.
The mean percentage of errors was 2.2 ± 3.5% (± between-subject SD) but one participant’s error rate of 15.6% seemed an outlier. We therefore also calculated the median error rate: 1.2 ± 0.6% (± between-subject median absolute deviations). Given that the participants answered incorrectly on only about 10 trials out of 500 we could not perform an analysis of variance similar to the one we did for the reaction time. Overall, the error rate was very low: the task was seemingly well understood by our participants and easy to perform. Figure 5 shows the error rate plotted against the deviation angle. We performed a similar linear regression in order to quantify the relation between the deviation angle and the error rate. The mean linear regression slope was 0.03 ± 0.07%/° (± between-subject SD). Sixteen out of 19 (84%) individual slopes were positive (the remaining 3 were equal to 0) and 8 out of 19 (42%) slopes were significantly positive (bootstrap with 104 resamples, p < 0.05).
Spontaneous Body Movements and Their Relation to the Task
Analysis of path length
As a first analysis of the relation between task performance and body movements, we wanted to see if there was a relationship between our participants’ spontaneous motion of the head or the shoulders and the deviation angle. As a measure of the extent of spontaneous motion, we used the length of the path traveled in space. Figure 6 shows the mean path lengths as a function of the absolute deviation angle.
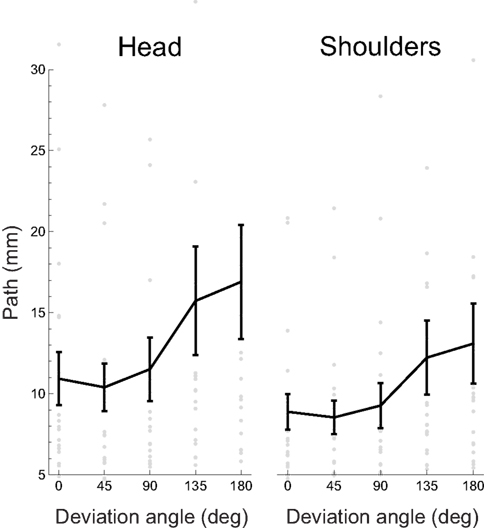
Figure 6. Mean path length traveled by the head and shoulders as a function of deviation angle. Gray dots represent individual participants’ data, the black curve the mean, and error bars between-subject SE. Several outlying datapoints are not shown.
The mean path length across participants and deviation angles is 13.1 ± 10.2 mm (± between-subject SD) for the head and 10.3 ± 6.9 mm for the shoulders.
The slope of the linear regression (including a constant term, see Materials and Methods) of path lengths on the absolute deviation angles provides an indication on the relation between the movements and the deviation angle: if positive, it would indicate that the participants move more in trials with higher deviation angles. For head movements, 17/19 (89%) regression slopes were positive and 13/19 (68%) were significantly so (bootstrap with 104 resamples, p < 0.05); the mean slope was 0.038 ± 0.058 mm/° (± between-subject SD). For the shoulders, 17/19 (89%) regression slopes were positive and 12/19 (63%) were significantly so (bootstrap with 104 resamples, p < 0.05); the mean slope was 0.026 ± 0.041 mm/°.
This analysis of path lengths shows that, for most participants, there was a relationship between the absolute extent of spontaneous movements and the absolute value of the principal task parameter, the deviation angle. (That relationship was stronger in case of the spontaneous head movements compared to the shoulder movements.) Because the movements of the head and shoulders were nearly rigid, for further analysis we decomposed them into the two components of rigid motion, rotations and translations.
Analysis of absolute amplitude of rotations
As stated in the Section “Materials and Methods,” for each trial we calculated the maximal rotation of the head and shoulders with respect to their initial orientations at the start of the trial. We represented these rotations as 3D vectors using the axis-angle representation, in which the length of the vector is the angle of rotation and its direction the axis.
To begin with, we analyzed only the angles of the maximal rotations, ignoring for the moment the axes. As in the preceding analysis, we wished to test whether this measure of absolute magnitude of rotation was correlated with task difficulty, i.e., the absolute value of deviation angle. Figure 7 shows the mean maximal rotation magnitude as a function of the absolute deviation angle.
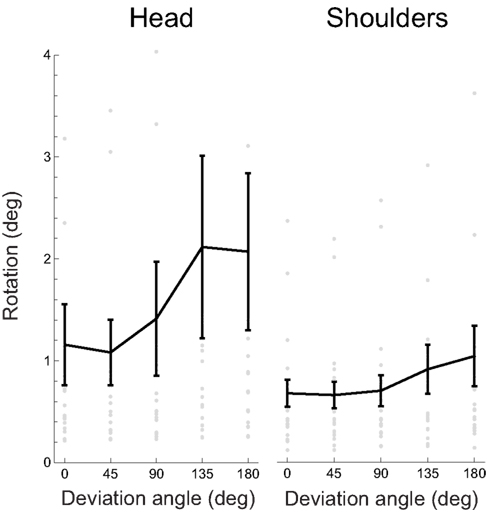
Figure 7. Absolute rotation amplitude, for the head and shoulders, as a function of the absolute deviation angle. Gray dots represent individual participants’ data, the black curve the mean, and error bars between-subject SE. Several outlying datapoints are not shown.
The overall mean rotation amplitude is 1.57 ± 0.5° (± between-subject SD) for the head and 0.78 ± 0.17° for the shoulders. Some of the spontaneous rotations were not specifically related to the main task parameter, as shown by the presence of rotations even when deviation angle is 0.
We performed a linear regression (including a constant term) of the rotation amplitude versus absolute deviation angles to quantify the relation between the rotations and the deviation angles. We found out that 17/19 (89%) regression slopes were positive for both head and shoulder rotations and 10/19 (53%) for the head and 7/19 (37%) for the shoulders were significantly so (bootstrap with 104 resamples, p < 0.05); the mean slope was 0.006 ± 0.013 (± between-subject SD) for the head and 0.002 ± 0.005 for the shoulders.
The analysis of absolute rotation angles shows that there was a relationship between the absolute amplitudes of spontaneous rotations and the deviation angle. It does not show, however, if this relationship was geometrically specific, if the spontaneous rotation depended specifically on the task. After all, as far as we can tell from Figure 7, participants could have always executed the same motion (e.g., a constant-speed translation or rotation), regardless of task parameters; they could have moved farther for larger deviation angles simply because there was more time to do so. What we wanted to test next was how specific was the relation between spontaneous motion and task: did participants spontaneously move in one direction for positive deviation angles and in the opposite direction for negative ones?
Directional analysis of rotations
To answer the question above, we performed a linear regression of the full axis-angle rotation vectors (i.e., including the direction of rotations in addition to their amplitudes) on the deviation angle – rather than just its absolute value – of the corresponding trial. We call the slopes of these linear regressions the spontaneous rotation coefficients (see Materials and Methods for details).
Figure 8 shows the spontaneous rotation coefficients for the head and for the shoulders for all individual participants. For head rotations, the mean coefficient is 0.007 ± 0.018 (± between-subject SD); the median coefficient is 0.001 ± 0.0009 (± between-subject median absolute deviations). For the shoulders, the mean coefficient is 0.001 ± 0.002; the median coefficient is 0.0005 ± 0.0002. The interpretation of these parameters, for example for head spontaneous rotations, is as follows: on the average, participants rotated their head by 0.7% (or 0.1%, if we use the medians) of the deviation angle. Contrary to the preceding analyses, we have extracted the directionally specific component of the spontaneous rotations: rotations that are in opposite directions for clockwise and counterclockwise deviation angles. The axis of these rotations varies from one participant to the next; we will return to the question of axes below.
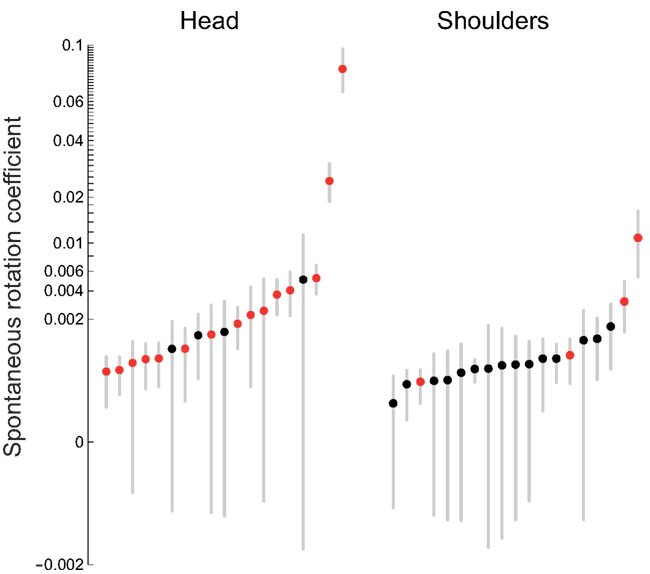
Figure 8. Spontaneous rotation coefficients for the head and shoulders. The dots are the individual coefficients values of the participants shown in increasing order; red dots correspond to statistically significant coefficients (p < 0.05). The error bars correspond to a measure of dispersion obtained by the cubic root of the product of the three semi-axis radii of the ellipsoid that contains 95% of the bootstrapped slope values (see Materials and Methods). The scale of the vertical axis is a power function of the linear scale (with the sign preserved), with the exponent 0.3.
To test whether these correlations were statistically significant, we stepped back to our original regression model, Ri = θir (recall that the spontaneous rotation coefficients are the lengths of the regression vectors r), and used the regression vectors r for significance analysis. We performed a bootstrap resampling (104 resamples) of the vectors r and calculated the 95% confidence ellipsoid of these vectors. We then checked whether these ellipsoids included the origin, the point corresponding to no rotation; if not, we considered the regression significant, or, in other words, that there was a significant linear relation between maximum rotation and deviation angle.
First of all, an omnibus regression analysis, including all data sets of all participants at once, shows a statistically significant spontaneous rotation coefficient of 0.0068 for the head and of 0.0006 for the shoulders. Second, the results of this significance test for individual participants are shown on the left side of Table 1, with statistically significant coefficient shown in red. Although spontaneous rotation coefficients were small (all but two are smaller than 1%), in case of head rotations 15/19 (79%) participants had a statistically significant linear relationship between maximum rotation and deviation angle. In case of shoulder rotations, on the other hand, only 4/19 (21%) participants had significant fits to the model. These results are represented graphically in Figure 8, with those participants having significant regressions marked with red circles. Given that only a few participants executed significant shoulder rotations, we carried out the rest of rotation analyses only for head movements.
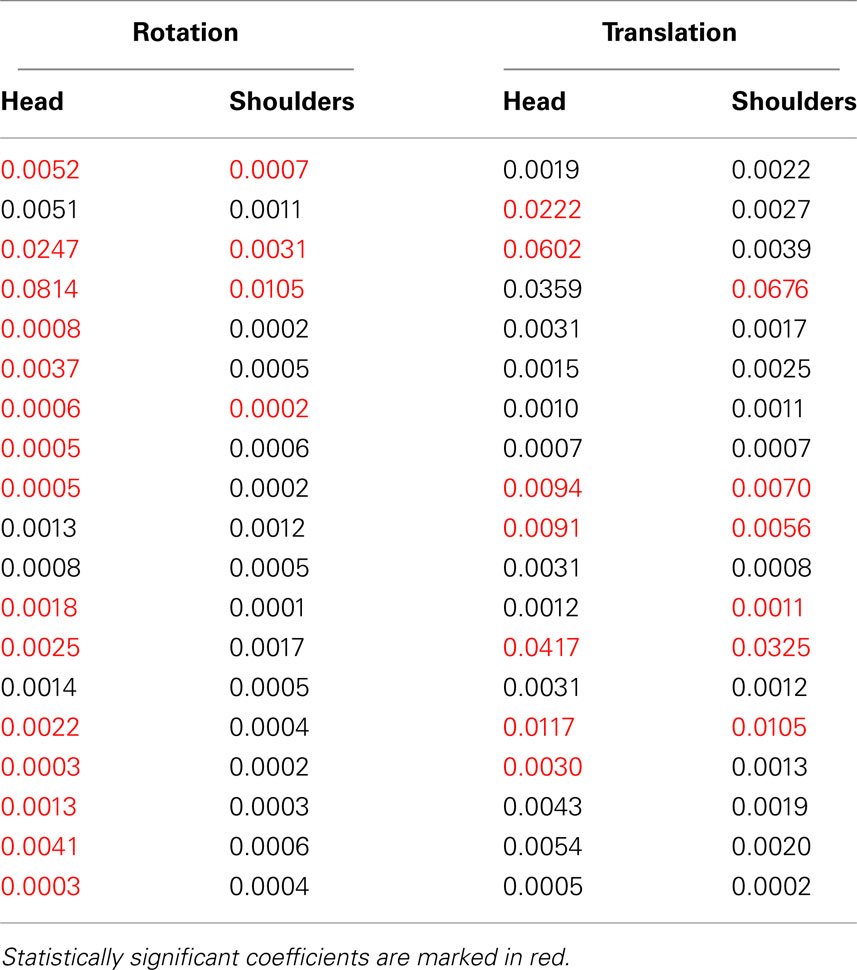
Table 1. Spontaneous rotation coefficients for rotation and translation, for the head and shoulders.
In order to check if spontaneous rotations decreased in amplitude throughout the course of the experiment, we compared the spontaneous rotation coefficients from the first and last halves of each experimental session. We found that, averaged over all participants, the mean head rotation coefficient in the first half of the experiment was 0.012 ± 0.03 (± between-subject SD), while in the second half of the experiment it was down to 0.004 ± 0.009. Although this shows an overall decrease of by about a factor of 3, the difference was not significant (paired t18 = 1.67, p = 0.11).
Analysis of rotation axes
Along with the spontaneous rotation coefficients, our analysis also yielded an axis of rotation for each subject, separately for the head and the shoulders. Figure 9 shows these axes, as unit vectors (the vector â in our regression model), for the head rotations of the 15 participants whose regression analyses yielded significant results. The meaning of each of these vectors is as follows: it is the axis that maximizes the correlation between a participant’s rotations and the corresponding values of the deviation angle.
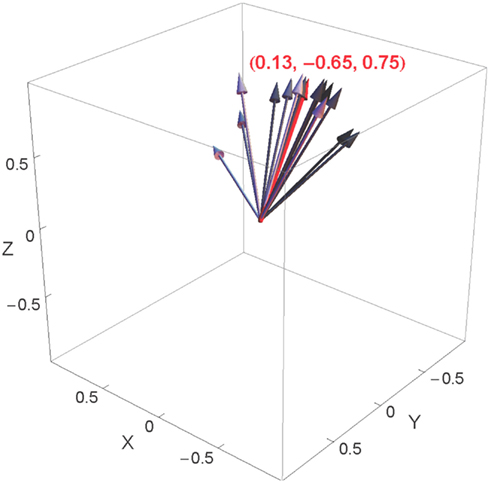
Figure 9. Individual head rotation axes represented in the space of rotations, shown in gray, as well as their mean, shown in red. The individual axes are shown in shades of gray that correspond to the value of the spontaneous rotation coefficient (the darker the arrow, the higher the corresponding coefficient). The three Euclidean coordinates represent the mean axis.
Figure 9 also shows the mean head rotation axis over all of these participants, equal to (+0.13, −0.65, +0.75). The axes of the fifteen participants are rather tightly clustered around this mean; the mean difference between the individual axes and the mean axis is only 24°. The largest contributions to this mean rotation axis come from the Z and Y axes. The signs of the components in this vector mean that for positive values of the deviation angle, participants tended to carry out rotations about the “positive” Z axis (head turned to the left, as seen from above) and the “negative” Y axis (head inclined to the left, as seen from behind); for trials in which the deviation angle was negative, on the other hand, the rotations tended to be in the opposite direction. This is illustrated in Figures 10B,D for positive deviation angle. We will return to the significance of these axes of rotation in the Discussion.
Figure 10. The main component axes of average spontaneous head rotations. (A,B) Head turn about vertical Z axis. (C,D) Head tilt about naso-occipital Y axis.
Analysis of translations
We now turn to the other component of body motion, translation. As for rotations, we calculated maximum translation vectors for the head and shoulders on every trial, and then performed a linear regression of these translations on the corresponding deviation angles. The resulting spontaneous translation coefficients are shown in the two right-hand columns of Table 1. We then performed the same statistical analysis of these regressions as for rotations. The translations of 7 (37%) and 6 (32%) out of 19 participants, for respectively the head and shoulders, were significantly correlated to deviation angle (bootstrap with 104 resampled datasets, p < 0.05).
Relation between task performance and body movements
Is there a correlation between how well participants performed the task, and their spontaneous motion? In other words, do participants who perform the task better carry out less or more ample head or shoulder rotations or translations? We defined task performance for each participant by his or her slope of RT versus the absolute value of deviation angle. We then computed Pearson’s correlation coefficients between the RT slopes and the four spontaneous motion coefficients: all four correlation coefficients were positive (0.77 for head rotations, 0.76 for shoulder rotations, 0.46 for head translations, 0.62 for shoulder translations). Of these, the correlation between RT slope and head rotation coefficient (0.77) was statistically significant (bootstrap with 105 resamples, p < 0.05). The participants whose RT is most affected by an increase of the deviation angle also have highest correlations between spontaneous head rotations and deviation angles. (This correlation is not due to slower participants’ simply having more time to move. The Pearson’s correlation coefficient between the head rotation coefficient and the average head rotation velocity is 0.83 (bootstrap with 105 resamples, p < 0.05): this means that the participants executing larger head rotations are also those that rotate their heads faster and thus, during a fixed amount of time they would rotate farther than other participants) However, if we remove the two participants with the highest head rotation coefficients, the correlation falls to 0.22 and, although remains positive, becomes non-significant. Thus, we can reach no definitive conclusion concerning the correlation between the level of task performance or skill and spontaneous motion.
Discussion
When asked for directions some people execute incipient body movements that are spatially consistent with the imagined route that they try to explain, but of much smaller amplitude. Are those spontaneous movements geometrically related to the imagined spatial locomotion and updating of self-position? If a geometrical relation were found between represented spatial self-displacements and co-occurring incipient spontaneous body movements, it would be indicative of the implication of motor processes (motor plans or efference copies) in our spatial task and consistent with the activation of a sensorimotor prediction mechanism in solving spatial updating problems. Thus, the spontaneous incipient body movements could be the trace of a planned but inhibited action, as discussed in the Section “Introduction.”
The studies on spatial perspective-taking showed that imagined body rotations are more difficult than translations, and that the principal factor of difficulty leading to lower performance is the magnitude of the angle between the actual and the imagined perspectives. Consequently, we focused on the study of the imagined rotations and the angular disparity effect.
We devised a task in which our participants where shown a simplified “you-are-here” map depicting an intersection of two streets and required to decide the direction (left or right) in order to reach the destination shown on the map (see Figure 1). The main task parameter was the angle between the canonical upright perspective on the map and the street with the you-are-here mark; we called it the “deviation angle.” In addition to behavioral data, we measured the spontaneous movements of our participants. To our knowledge, spontaneous movements have not been quantified so far in a spatial updating task. The additional motion data consisted of the spatial coordinates of motion detectors placed on participants head and shoulders.
Our behavioral results replicate the studied angular disparity effect on task performance (the bigger the deviation angle the lower the task performance) in agreement with the previous findings (Rieser, 1989; Easton and Sholl, 1995; Roskos-Ewoldsen et al., 1998; see also Shelton and McNamara, 1997). We also replicated the non-monotonicity of RT increase as a function of deviation angle: it took significantly longer to perform the task for deviation angles above 90° than for smaller angles; in agreement with similar studies (Keehner et al., 2006; Kessler and Thomson, 2010).
We found that 15 out of 19 (79%) participants executed spontaneous head rotations related to the task parameters [if we include translations, 17 out of 19 participants (89%) executed a statistically significant motion] – in spite of the ease of the task, as shown by low error rates. These rotations were very small in amplitude (typically below 2°). In a few participants, these rotations could be seen with the naked eye – and if one also saw the corresponding stimulus, the relationship between the task and the movement was obvious. However, in most of the participants, the movements were too small to be seen, but could nevertheless be measured with the motion tracker, and their relationship to the task parameters shown using our analysis. Indeed, these miniature head rotations were reliably correlated to the deviation angle, but much smaller (typically less than 1% of the deviation angle).
The geometrically specific correlation between spontaneous head rotations and the deviation angle has two aspects. First, larger deviation angles (corresponding to more difficult trials) led to larger rotations. Second, opposite deviation angles led to head rotations with opposite directions about a specific rotation axis, that we calculated using our linear model in rotation space.3 (For example, a clockwise deviation angle will lead to a spontaneous clockwise rotation of the head and a larger deviation angle in the opposite direction will lead to a proportionally larger counterclockwise head rotation, about the same rotation axis.)
The mean axis of rotation, averaged across participants, has a main vertical Z-axis component and a strong but lesser front-back Y-axis component: the resulting head movement is thus a horizontal rotation of the head (i.e., a head turn, see Figures 10A,B) with an important tilt component (Figures 10C,D). These head rotations are as if participants were trying to align themselves with the imagined orientation on the map. In the case of the front-back Y axis, this alignment is in the image plane; in the case of the vertical Z axis, it is as if the participants back-projected the vertical image onto the ground plane, and then tried to align themselves with the imagined orientation in this projection. One may argue that the head rotations were an attempt to partly align the image on the retina with the canonical upright perspective on the map; this would be consistent with studies showing that a partial rotation of the physical stimulus enhances performance in mental rotation (Jolicoeur and Cavanagh, 1992). This argument applies to the Y-axis component of spontaneous rotations, which did lead to tiny rotations on the retina in the correct direction to simplify the task. However, the main component of the axis of spontaneous head rotations was the Z-axis, and rotations about the Z-axis do not modify the retinal projection in this way, and therefore do not facilitate the task.
Another criticism of our study could be that participants were aware that their movements were being tracked and this could have somehow influenced their spontaneous movements. Although participants were indeed aware of the motion tracking, this fact could not predict the detailed geometric relationship between the deviation angles and the amplitude and direction of spontaneous movements. At most, we could expect an alteration of overall spontaneous movements (either an inhibition or an accentuation) and there is no reason to expect that it would vary with the deviation angle.
Our technique, involving a linear regression of maximal rotation vectors, had the advantage of extracting the axis of rotation in each participant that was maximally correlated with the task, rather than using the usual canonical axes. Nonetheless, we also performed an analysis of rotations around fixed canonical X-, Y- and Z-axes using plane projections of rotations and obtained very similar results. Another choice we made was to use the maximal rotation on each trial, rather than the rotation on every measured sample. We therefore performed an alternative analysis, using all rotations during a trial instead of selecting only the maximal rotation per trial, that also yielded very similar results.
It is important to note that our final analysis, leading to spontaneous rotation coefficients, does not take into account all of the spontaneous movements. By design, this analysis projects out the component of the spontaneous movement in agreement with our linear model, in which the head always rotates about the same axis, by an angle proportional to the deviation angle, either positive or negative. It is interesting to ask how much other movement is present, movement not taken into account by our model. If there were a lot of unaccounted spontaneous rotations, then the slopes found in the analysis of absolute amplitude of rotations, Figure 7, would be much higher than spontaneous rotation coefficients. This is not so. In fact, the two types of regression coefficients are close to each other. We therefore conclude that our linear model captures a great deal of the spontaneous rotations.
Regarding the predominance of spontaneous rotations over translations, the rotation being the difficult part of the simulated action in our task, we may speculate that either only the most difficult parts of an action are simulated (in that case there should be some a priori knowledge about what operations are more difficult) or that the entire action is simulated but the more difficult operations such as rotations are less well inhibited. Shoulder movements are also correlated to the task in a few participants, but not as convincingly as the head rotations. The fact that in our experiment participants were seated may have limited those movements.
Our findings on spontaneous head rotations are consistent with a motor contribution to spatial updating task performance and with our action inhibition hypothesis (see Introduction) as the characteristics of the spontaneous movements are geometrically consistent with those of actual rotations in the ground plane or image plane that would be required to bring the participant into alignment with the required initial orientation. We may speculate on several types of contribution. The premotor cortex could prepare an actual movement, which would lead to two separate processes: an anticipation process that predicts the outcome of the action (i.e., the map with the you-are-here street aligned with the participant’s vertical axis) from an efference copy of the motor command, and the execution of the overt motor action, which would be inhibited at early stages (earlier for some participants than for others). Mental transformations in opposite directions (for opposite signs of deviation angle) would lead to incipient rotations in opposite directions, and larger values of deviation angle would lead to more ample programmed movements, and therefore to higher accelerations and larger incipient motions, if inhibition starts at a fixed time.
Alternatively, the implication of the motor system may be epiphenomenal, related to concurrent cognitive processes but not causally so. One scenario in which this could occur would be if the process of perspective change, completely cognitive and non-motor, through some associative mechanism triggered the corresponding motor action – but neither the planning of this action nor its execution played any concrete role in the mental transformation. The opposite could be true as well: an incipient stereotyped motion from a memorized repertoire could be necessary to launch the purely cognitive, non-motor process.
The somewhat strange possibility that proprioceptive feedback from the actual movement is also used, with a gain factor applied at a later stage, cannot be ruled out, as there are some studies showing no difference in performance on spatial updating tasks in the active and the passive motion conditions (Wang and Simons, 1999; Experiment 4 in Wraga et al., 2004; see also Riecke et al., 2007).
Note that for a few participants we did not record any significant spontaneous movements. Using another technique, for example measuring muscle activity, would allow one to verify if motor activity is present in non-movers.
We cannot at this stage answer the question of causality of the spontaneous movements. The observed movements may well be a visible trace of the implication of the motor and premotor processes as we suggested above. Still, it is also possible that executing a mental rotation not involving any motor contribution activates, by association, some motor process. We are thus left with two equally plausible explanations: the motor processes may have a causal role in spatial updating or they may be an epiphenomenon of an otherwise symbolic task processing. To settle this argument, we need a new experimental setting contrasting a condition in which movement is allowed or facilitated with another one where movement is restrained. It will allow us to measure the impact of each condition on the task performance and shed more light on the causality of the motor processes in mental spatial updating tasks.
Conflict of Interest Statement
The authors declare that the research was conducted in the absence of any commercial or financial relationships that could be construed as a potential conflict of interest.
Acknowledgments
We are grateful to Thales Group and especially to Alain Léger for support of part of this research. We wish to thank Malika Auvray for discussions on the early version of the experiment presented in this paper and Danping Wang, Joseph A. McIntire, and Michele Tagliabue for their help with equipment.
Footnotes
- ^The motion tracker yielded several thousand numbers, or degrees of freedom, for each trial: a typical trial lasted between 1 and 2 s, the motion tracker sampled at 200 Hz, and we had six sensors, each returning three dimensions of data. The task, on the other hand, was characterized by only two parameters, only one of which was actually relevant.
- ^The upward orientation corresponds to the projection of the straight-ahead direction onto the vertical plane; this orientation preserves the left and right, i.e., locations that are to a person’s right would be to the right of this line on that map. It has been shown that left-right turn judgments using a map are facilitated when the map is oriented that way (Shepard and Hurwitz, 1984).
- ^The spontaneous movements were of course highly variable, and had components that did not follow these regularities. (The spontaneous head rotation axes varied somewhat from trial to trial, as can be seen in Figure 3.) What we mean is that we found significant fits of the spontaneous head rotations to a model—the linear model in rotation vector space—that does follow these rules.
References
Avraamides, M. N., Klatzky, R. L., Loomis, J. M., and Golledge, R. G. (2004). Use of cognitive versus perceptual heading during imagined locomotion depends on the response mode. Psychol. Science 15, 403–408.
Chu, M., and Kita, S. (2008). Spontaneous gestures during mental rotation tasks: insights into the microdevelopment of the motor strategy. J. Exp. Psychol. Gen. 137, 706–723.
Chu, M., and Kita, S. (2011). The nature of gestures’ beneficial role in spatial problem solving. J. Exp. Psychol. Gen. 140, 102–116.
Easton, R. D., and Sholl, M. J. (1995). Object-array structure, frames of reference, and retrieval of spatial knowledge. J. Exp. Psychol. Learn Mem Cogn, 21, 500–483.
Efron, B., and Tibshirani, R. J. (1994). An Introduction to the Bootstrap, 1st Edn. New York: Chapman and Hall/CRC.
Farrell, M. J., and Robertson, I. H. (1998). Mental rotation and automatic updating of body-centered spatial relationships. J. Exp. Psychol. Learn. Mem. Cogn. 24, 227–233.
Goldin-Meadow, S. (1999). The role of gesture in communication and thinking. Trends Cogn. Sci. 3, 419–429.
Goldin-Meadow, S., Nusbaum, H., Kelly, S. D., and Wagner, S. (2001). Explaining math: gesturing lightens the load. Psychol. Sci 12, 516–522.
Goldstein, H., Poole, C. P., and Safko, J. L. (2001). Classical Mechanics, 3rd Edn. San Francisco: Addison Wesley.
Hintzman, D. L., O’Dell, C. S., and Arndt, D. R. (1981). Orientation in cognitive maps. Cogn. Psychol. 13, 149–206.
Jolicoeur, P., and Cavanagh, P. (1992). Mental rotation, physical rotation, and surface media. J. Exp. Psychol. Hum. Percept. Perform. 18, 371–384.
Keehner, M., Guerin, S. A., Miller, M. B., Turk, D. J., and Hegarty, M. (2006). Modulation of neural activity by angle of rotation during imagined spatial transformations. Neuroimage 33, 391–398.
Kessler, K., and Thomson, L. A. (2010). The embodied nature of spatial perspective taking: embodied transformation versus sensorimotor interference. Cognition 114, 72–88.
Kirsh, D. (1995). “Complementary strategies: why we use our hands when we think,” in Proceedings of the Seventeenth Annual Conference of the Cognitive Science Society, eds J. D. Moore, and J. F. Lehman (Routledge: University of Pittsburgh), 212–217.
Kirsh, D., and Maglio, P. (1994). On distinguishing epistemic from pragmatic action. Cogn. Sci. 18, 513–549.
Klatzky, R. L., Loomis, J. M., Beall, A. C., Chance, S. S., and Golledge, R. G. (1998). Spatial updating of self-position and orientation during real, imagined, and virtual locomotion. Psychol. Sci. 9, 293–298.
Presson, C. C., and Montello, D. R. (1994). Updating after rotational and translational body movements: coordinate structure of perspective space. Perception 23, 1447–1455.
Riecke, B. E., Cunningham, D. W., and Bülthoff, H. H. (2007). Spatial updating in virtual reality: the sufficiency of visual information. Psychol. Res. 71, 298–313.
Rieser, J. J. (1989). Access to knowledge of spatial structure at novel points of observation. J. Exp. Psychol. Learn. Mem. Cogn. 15, 1157–1165.
Roberts, R. J., and Aman, C. J. (1993). Developmental differences in giving directions: spatial frames of reference and mental rotation. Child Dev. 64, 1258–1270.
Roskos-Ewoldsen, B., McNamara, T. P., Shelton, A. L., and Carr, W. (1998). Mental representations of large and small spatial layouts are orientation dependent. J. Exp. Psychol. Learn. Mem. Cogn. 24, 215–226.
Schwartz, D. L. (1999). Physical imagery: kinematic versus dynamic models. Cogn. Psychol. 38, 433–464.
Schwartz, D. L., and Black, T. (1999). Inferences through imagined actions: knowing by simulated doing. J. Exp. Psychol. Learn. Mem. Cogn. 25, 116–136.
Shelton, A. L., and McNamara, T. P. (1997). Multiple views of spatial memory. Psychon. Bull. Rev. 4, 102–106.
Shepard, R. N., and Hurwitz, S. (1984). Upward direction, mental rotation, and discrimination of left and right turns in maps. Cognition 18, 161–193.
Shepard, R. N., and Metzler, J. (1971). Mental rotation of three-dimensional objects. Science 171, 701–703.
Simons, D. J., and Wang, R. F. (1998). Perceiving real-world viewpoint changes. Psychol. Sci. 9, 315–320.
Wang, R. F., Crowell, J. A., Simons, D. J., Irwin, D. E., Kramer, A. F., Ambinder, M. S., Thomas, L. E., Gosney, J. L., Levinthal, B. R., and Hsieh, B. B. (2006). Spatial updating relies on an egocentric representation of space: effects of the number of objects. Psychon. Bull. Rev. 13, 281–286.
Wang, R. F., and Simons, D. J. (1999). Active and passive scene recognition across views. Cognition 70, 191–210.
Wexler, M., and Klam, F. (2001). Movement prediction and movement production. J. Exp. Psychol. Hum. Percept. Perform. 27, 48–64.
Wexler, M., Kosslyn, Stephen, M., and Berthoz, A. (1998). Motor processes in mental rotation. Cognition 68, 77–94.
Wohlschläger, A., and Wohlschläger, A. (1998). Mental and manual rotation. J. Exp. Psychol. Hum. Percept. Perform. 24, 397–412.
Wraga, M. (2003). Thinking outside the body: an advantage for spatial updating during imagined versus physical self-rotation. J. Exp. Psychol. Learn. Mem. Cogn. 29, 993–1005.
Wraga, M., Creem-Regehr, S. H., and Proffitt, D. R. (2004). Spatial updating of virtual displays. Mem. Cognit. 32, 399–415.
Keywords: spatial cognition, motor action, sensorimotor prediction, embodied cognition, mental simulation
Citation: Popescu ST and Wexler M (2012) Spontaneous body movements in spatial cognition. Front. Psychology 3:136. doi: 10.3389/fpsyg.2012.00136
Received: 16 November 2011; Paper pending published: 15 March 2012;
Accepted: 17 April 2012; Published online: 09 May 2012.
Edited by:
J. Toby Mordkoff, University of Iowa, USAReviewed by:
Sascha Topolinski, Universität Würzburg, GermanySusan Wagner Cook, University of Iowa, USA
Copyright: © 2012 Popescu and Wexler. This is an open-access article distributed under the terms of the Creative Commons Attribution Non Commercial License, which permits non-commercial use, distribution, and reproduction in other forums, provided the original authors and source are credited.
*Correspondence: Sergiu Tcaci Popescu, Laboratoire Psychologie de la Perception, CNRS and Université Paris Descartes, 45, rue des Saints-Pères, 75006 Paris, France e-mail: sergiu.popescu@etu.parisdescartes.fr