 Emil N. Coman
 Katherine Picho
 John J. McArdle
 Victor Villagra1
 Lisa Dierker
- 1TRIPP Center, University of Connecticut Health Center, Farmington, CT, USA
- 2Department of Medicine, Uniformed Services University, Bethesda, MD, USA
- 3Department of Psychology, University of Southern California, Los Angeles, CA, USA
- 4Psychology Department, Wesleyan University, Middletown, CT, USA
- 5Forestry Department, Transilvania University, Brasov, Romania
The t-test is a common statistical test of differences in means. Despite the fact that its extension, the paired t-test (t-testP), appears in most introductory statistics textbooks, it is less known that for repeated variables the t-testP is in fact a model of change that can be replicated within the Structural Equation Modeling (SEM) framework. We show how to perform the t-testP with latent change scores (LCS) models, which allow for direct testing of significance of mean changes, and moreover can explain inter-individual (and group) differences in changes over time.
Modeling Background
Structural models with latent variables can nowadays replicate virtually any statistical test (Skrondal and Rabe-Hesketh, 2004). It has been shown in particular that a latent growth curve model (LGM) with df = 0 fully replicates the t-testP statistical tests for two waves of data (Voelkle, 2007) and yields asymptotically identical results. LCS models themselves fully replicate the repeated measures Anova and LGMs models and results, and additionally are much broader and capable to relax their assumptions (McArdle, 2009). We show how a more flexible LCS model with changes correlated with initial levels fully replicates the t-testP, and moreover can be expanded to test more complex hypotheses of change.
We demonstrate our proposal with a dataset on changes in Hemoglobin A1c (HgA1c) levels among diabetics who participated in a quality improvement study using peer supporters (Phase II–Diabetes eCo-System, Villagra, 2013). HgA1c values range between 5 and 12% (HgA1c > 6.5% defines a diabetic patient, NGSP, 2013). Many studies reporting changes in HgA1c values use the t-testP to test for significance of changes (e.g., Satoh-Asahara et al., 2013). Hence, we tested the changes in HgA1c in a group of diabetics using the t-testP, and replicated these results in the LCS framework.
The key feature of the t-testP is the computation of the sample average of differences (ΔY21i = Y2i − Y1i) which is compared to zero, using an estimate of its standard error that accounts for the covariance between initial levels and changes. Because the t-testP is testing the significance of Y1 to Y2 changes, a natural alternative is to directly specify the change score (Y2 − Y1 or ΔY21) in a model of change. Because of known issues around the reliability of the change score (King et al., 2006) and estimation problems due to adding a variable that is a linear combination of two other variables in the same model, the LCS directly inserts the change score in a structural model, however, as a latent variable. Rewriting the ΔY21 = Y2 − Y1 equation as LCS21 = Y2 − Y1, one can define the true changes (McArdle and Nesselroade, 1994) with the multiple regression:
where we specifically indicate that the two regression coefficients are fixed to 1 (unity), and the intercept of Y2 is set to zero, as are the mean and variance of the Y2 residual error, i.e., the entire variance of Y2 is explained by the true change LCS21 (see Figure 1).
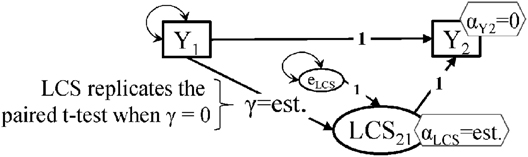
Figure 1. Structural modeling setup for the paired t-test model and the latent change score (LCS) model with self-feedback/mediation (SF/M). Notes: significance of Y1 to Y2 changes is captured by the αLCS intercept; ‘est.’ means parameter is estimated by the model; intercepts are shown in hexagons, variances as double-headed arrows (covariance with itself); the key features of the LCS mode are: (1). No Y2 residual error; (2). Intercept of Y2 is set to zero; (3). The auto-regressive path is set to 1; the LCS to Y2 path is set to 1.
While t-testp statistical outputs from various software report the correlation between the two repeated measures, the role of this indicator of measure stability is not directly obvious in the t-testP model. There are two ways in which one can incorporate stability information into the LCS model of change: by specifying a correlation between Y1 and LCS21 (like McArdle, 2001; Figure 16.3), or with a directed path from Y1 to LCS21. There is a clear difference in terms of the test of significance of changes in outcome Y between the two setups: the correlation specification tests the significance of the mean of the LCS21 score and yields identical results with the t-testP, while the γ path specification is testing the significance of the LCS21 intercept; hence, differences in significance level will be observed.
The simple model in Figure 1 is asymptotically equivalent to the t-testP, when Y1 is correlated with LCS21, or when the γ path is set to zero (in the directed path setup). The γ path has been called proportional growth (McArdle, 2009), immanent change (Coleman, 1968), self-feedback (McArdle, 2009), or self-mediation (Coman et al., 2013); we label it here as self-feedback/mediation (SF/M). It can be easily shown that the γ coefficient's absolute value is the complement (1 - ρ) of the common auto-regressive (AR1) path, or stability (Kenny, 1979, p. 287), from a simple lagged model Y1 → Y2 (Coman et al., 2013): when γ = 0, there is perfect stability (ρ = 1). When an outcome changes in level but under perfect stability (equivalent to the LCS model with zero SF/M), the knowledge of one's initial outcome value Y1 means perfect prediction of his/her Y2 follow-up value; the Y2 intercept in this case tells us by how much Y increases (or decreases) uniformly across the entire sample, i.e., the change is the same in all persons/cases.
This particular case of perfectly stable outcomes is rarely found in real life. Change usually happens within some boundaries, and often those starting off higher on an outcome will change less. The likelihood of this hypothesis can be tested against the data however: since the more relaxed LCS model with SE/M path γ estimated has df = 0, directly forcing γ = 0 on the full LCS model tells us whether the assumption is reasonable or not: a significant χ2 of the no-SF/M LCS model, or equivalently: a significant worsening of fit Δχ 2(1), tells us whether the “no SF/M link” hypothesis is tenable.
Results
We performed the t-testP in MS Excel, then replicated it in the free AMOS 5 (Arbuckle, 2007) software, as a LCS model with Y1 and LCS21 correlated, then with Y1 predicting LCS21, then forcing γ = 0 (all our models and data are posted at http://trippcenter.uchc.edu/modeling). To be able to meaningfully compare the results, the outcomes were both centered on the HgA1c1 mean, and thus the HgA1c2 mean became −0.395. The t-testP for significance of HgA1c changes in the diabetic patients (n = 97) indicates a mean of the paired differences of d = −0.395, SE = 0.182, t = −2.173, p = 0.032, and a paired sample correlation ρ = 0.566, p < 0.001. The LCS model with Y1 and LCS21 correlated yields similar results, whether the correlation is estimated or set to zero, d = −0.395, SE = 0.182, CR = −2.173 (critical ratio), p = 0.0297. The LCS with a SF/M path, however, yields a slightly lower p-value for the test of significance of changes, d = −0.395, SE = 0.171, CR = −2.307, p = 0.021. We note that the LCS model with no SF/M path (γ set to 0) indicated unacceptable misfit, χ 2(1) = 11.423, p = 0.001. This tells us that the path coefficient's γ = 0 constraint is not supported by data.
The difference between p-values from the models with the correlated initial level and changes vs. initial level predicting the changes occurs largely because the LCS model with SF/M path tests the significance of the HgA1c2 intercept, i.e., the mean changes controlled for HgA1c1.
To further illustrate our ideas, we re-tested the significance of the HgA1c reported in a recent study (Satoh-Asahara et al., 2013) for their control group (n = 24), from published summary data (means and variances), in the absence of reported information about the Y1 - Y2 correlation ρ. A re-test of the original classical paired t-test under the LCS setup replicated the original finding of a non-significant change, for a reasonable ρ = 0.50 correlation assumed between the two repeated measures. For higher values of ρ, however, the LCS t-testP models began to indicate significant changes for ρ larger than.70; the LCS model with SF/M consistently yielded slightly lower p-values than the t-testP, and showed significant changes, whereas the t-testP did not, for ρ 's between 65 and 70.
Conclusions and Recommendations
We showed how the classical paired t-test can be replicated in a SEM manner using LCS models, and illustrated the difference in results when one assumes an unexplained correlation between initial scores and changes, as opposed to initial scores predicting the changes. Between-individual and between-group differences in latent changes can be explained by various predictors in simple and more complex dynamical LCS models, hence the t-testP replicated here as a LCS model with self-SF/M is a first step in building better models of change.
We suggest that researchers perform paired t-tests both in their classical form, which assumes that change is simply correlated with initial levels, and in their more realistic form, where a path from initial level to the LCS is specified. Both these LCS models can be freely replicated by all interested with our input models posted online, using the free version 5 of the AMOS software (Arbuckle, 2007) and summary (or raw) data entered in Microsoft Excel. The LCS setup introduced here allows for models explaining the variability in changes, by predictors like prior levels or even prior changes in other variables (Grimm et al., 2012), and can be expanded to more complex models, like recovering latent classes for which the change model differs markedly. One can model in other words heterogeneity in changes or of effects (with mixture LCS models, see AMOS example model online).
Any comparative tests of changes, as commonly performed for instance in Comparative Effectiveness Research (CER, Sox and Greenfield, 2009), can benefit from this accommodation of more flexible models supported by data. CER studies evaluate the success of interventions implemented in different conditions by comparing changes in different groups, like treatment and matched control, or different adaptations of the same intervention. In such multiple-group LCS models, the self-SF/M paths will likely differ also by group or condition, so there is increased chance of misspecification, because models assuming them to be equal or different will fit data better/worse. Estimates of differences in changes between groups will therefore depend on the specific pattern of changes in each group, revealed by the best fitting models. More research seems to be needed to see how the LCS with self-SF/M performs against the simple structural modeling extensions of the classical paired t-test.
Acknowledgments
We thank Sanofi for funding the Phase II – Diabetes eCo-System quality improvement project. The first author thanks his mentor David Kenny for initiating him into the fascinating world of causal modeling and for his extensive guidance. The reviewers have dramatically improved the manuscript and we greatly appreciate their contribution.
References
Arbuckle, J. (2007). Amos (Version 5.0) [Computer Program]. Chicago: SPSS. Available online at: www.amosdevelopment.com/download
Coleman, J. S. (1968). “The mathematical study of change,” in Methodology in Social Research, ed Blalock, J. H. M. (New York, NY: McGraw-Hill), 428–478.
Coman, E., Bardus, M., Suggs, S., Iordache, E., Coman, M., and Blake, H. (2013). “Investigating the directionality and pattern of mutual changes of health outcomes: adding dynamic perspectives to static longitudinal analyses,” Poster Presented at the Modern Modeling Methods (M3) Conference, (Storrs, CT). Available online at: http://www.modeling.uconn.edu/m3c/assets/File/Coman_directionality%20poster.pdf
Grimm, K. J., An, Y., McArdle, J. J., Zonderman, A. B., and Resnick, S. M. (2012). Recent changes leading to subsequent changes: extensions of multivariate latent difference score models. Struct. Equation Model. 19, 268–292. doi: 10.1080/10705511.2012.659627
Kenny, D. (1979). Correlation and Causality. New York, NY: John Wiley and Sons. Available online at: http://davidakenny.net/doc/cc_v1.pdf
King, L. A., King, D. W., McArdle, J. J., Saxe, G. N., Doron-Lamarca, S., and Orazem, R. J. (2006). Latent difference score approach to longitudinal trauma research. J. Trauma. Stress 19, 771–785. doi: 10.1002/jts.20188
McArdle, J. J. (2001). “A latent difference score approach to longitudinal dynamic structural analyses,” in Structural Equation Modeling: Present and Future. A Festschrift in Honor of Karl Jöreskog, eds Cudeck, R., du Toit, S., Sörbom, D. (Lincolnwood, IL: Scientific Software International), 342–380.
McArdle, J. J. (2009). Latent variable modeling of differences and changes with longitudinal data. Annu. Rev. Psychol. 60, 577–605. doi: 10.1146/annurev.psych.60.110707.163612
McArdle, J. J., and Nesselroade, J. R. (1994). “Structuring data to study development and change,” in Life-span developmental psychology: Methodological innovations, eds Cohen, S. H., Reese, H. W. (Mahwah, NJ: Lawrence Erlbaum Associates, Inc), 223–267.
NGSP. (2013). National Glycohemoglobin Standardization Program. Available online at http://www.ngsp.org
Satoh-Asahara, N., Sasaki, Y., Wada, H., Tochiya, M., Iguchi, A., Nakagawachi, R., et al. (2013). A dipeptidyl peptidase-4 inhibitor, sitagliptin, exerts anti-inflammatory effects in type 2 diabetic patients. Metabolism 62, 347–351. doi: 10.1016/j.metabol.2012.09.004
Skrondal, A., and Rabe-Hesketh, S. (2004). Generalized Latent Variable Modeling: Multilevel, Longitudinal, and Structural Equation Models. Chapman & Hall/CRC. doi: 10.1201/9780203489437
Sox, H. C., and Greenfield, S. (2009). Comparative Effectiveness Research: A Report From the Institute of Medicine. Ann. Intern. Med. 151, 203–205. doi: 10.7326/0003-4819-151-3-200908040-00125
Villagra, V. (2013). Phase II Diabetes Care Coordination Eco-System. Health and Technology Vector, Inc. Available online at: http://trippcen-ter.uchc.edu/current_projects/phase_ii_diabetes_care.html
Keywords: paired t-test, latent change score, statistical power, true changes, Structural Equation Modeling, introductory statistics
Citation: Coman EN, Picho K, McArdle JJ, Villagra V, Dierker L and Iordache E (2013) The paired t-test as a simple latent change score model. Front. Psychol. 4:738. doi: 10.3389/fpsyg.2013.00738
Received: 30 July 2013; Accepted: 23 September 2013;
Published online: 10 October 2013.
Edited by:
Jeremy Miles, Research and Development Corporation, USAReviewed by:
Kevin Grimm, University of California, Davis, USACopyright © 2013 Coman, Picho, McArdle, Villagra, Dierker and Iordache. This is an open-access article distributed under the terms of the Creative Commons Attribution License (CC BY). The use, distribution or reproduction in other forums is permitted, provided the original author(s) or licensor are credited and that the original publication in this journal is cited, in accordance with accepted academic practice. No use, distribution or reproduction is permitted which does not comply with these terms.
*Correspondence: comanus@gmail.com