 Kui Wang
 Han Lu
 Eric F. C. Cheung5
 David L. Neumann
 David H. K. Shum
 Raymond C. K. Chan
- 1Neuropsychology and Applied Cognitive Neuroscience Laboratory, CAS Key Laboratory of Mental Health, Institute of Psychology, Beijing, China
- 2Department of Psychology, College of Humanities and Social Sciences, University of Chinese Academy of Sciences, Beijing, China
- 3Joint Master in Neuroscience, University of Strasbourg, Strasbourg, France
- 4School of Psychology, Beijing Normal University, Beijing, China
- 5Castle Peak Hospital, Hong Kong Special Administrative Region, Hong Kong, China
- 6Menzies Health Institute Queensland and School of Applied Psychology, Griffith University, Gold Coast, QLD, Australia
Clinical observations and research suggest a female preponderance in major depressive disorder. However, it is unclear whether a similar gender difference is found for the reporting of depressive symptoms in non-clinical populations. The present meta-analysis was conducted to address this issue. We searched for published papers targeting non-clinical populations in which the 21-item Beck Depression Inventory (BDI) was used. Eighty-four papers (91 studies) published between 1977 and 2014 were included in the final meta-analysis, which comprised 23,579 males and 29,470 females. Females in the general population reported higher level of depressive symptoms than males (d = -0.187, corresponding to 1.159 points in the 21-item BDI). This pattern was not found to influence by years of publication, socioeconomic status, or version of the BDI used. Using age group as a moderator, studies with adolescents and young adults were found to show a smaller effect size than studies with older participants. Our results appear to confirm the “female preponderance” in the level of self-report depressive symptoms in the general population, and support the social gender role theory in explaining gender difference over biological susceptibility theory and evolutionary theory.
Introduction
While results of several large-scale studies seem to suggest a higher level of depressive symptoms in females than males in the general population (Nolen-Hoeksema et al., 1999; Koivumaa-Honkanen et al., 2004; Aalto et al., 2012; Lopez Molina et al., 2014), consistent results are not always reported (Hammen and Padesky, 1977; Kim et al., 2011). However, due to the apparent agreement of this idea with the widely accepted “female preponderance” of major depressive disorder (Weissman and Klerman, 1977), this notion has been widely accepted, despite the lack of any systematic investigation in the general population.
Three representative theories purport to explain this gender difference in the level of depressive symptoms in the general population. First, the social gender role theory is based on females’ long-standing disadvantaged social status which exists across many different cultures (Gove, 1977; Mirowsky, 1996). The theory states that lower status in the workplace and in heterosexual relationships cause chronic strain, decrease the sense of mastery and stimulate the use of a rumination strategy for emotional coping, thus contributing to a higher vulnerability to depression in females. Second, the biological susceptibility theory is based on the observation that clinical depression tends to be associated with events in the female reproductive cycle. Thus, the effect of female hormones has been proposed as a potential cause for the observed gender difference in depression (Janowsky and Rausch, 1985). Third, evolutionary psychologists have noted that males tend to value physical appearance more than females when choosing a partner. In modern societies, the mass media has repeatedly promoted the images of idealized attractive females and these images are readily accepted by both males and females. Thus, females may become increasingly dissatisfied with their own physical appearances due to increased pressure for mate selection, and as a result are more likely to become depressed when their appearances fall short of the ideal (Buss, 2003). All of these theories have been elaborated extensively (Weissman et al., 1993), but a direct comparison between them has not been carried out.
Unlike the ratio of gender difference in patients with diagnosed major depressive disorder (about 2:1), which is supported by many community surveys, epidemiological studies, clinical observations, and meta-analyses (Weissman and Klerman, 1977; Boyd and Weissman, 1981; Ayuso-Mateos et al., 2001; Hankin and Abramson, 2001; Seedat et al., 2009; Luppa et al., 2012), empirical support for the difference in level of depressive symptoms in the general population is less clear (Hill and Needham, 2013). In fact, some large scale studies have not found any gender difference in the level of depressive symptoms in non-clinical samples (Hammen and Padesky, 1977; Kim et al., 2011). Depressive symptoms are frequently measured by self-report measures, such as the Beck Depression Inventory (BDI; Beck et al., 1961). By combining results from different studies, a meta-analysis can answer not only whether there is a gender difference in the level of depressive symptoms in non-clinical populations, but also assess the magnitude of this difference. In view of the widely observed gender difference in diagnosed major depressive disorder (Weissman and Klerman, 1977; Boyd and Weissman, 1981; Blazer et al., 1998; Hankin et al., 1998; Ayuso-Mateos et al., 2001; Seedat et al., 2009; Luppa et al., 2012) and the continual nature of depression, we expected to find a gender difference in the level of depressive symptoms in non-clinical populations as well.
Using moderator analyses, it is also possible to examine what factors might be related to gender difference in the level of depressive symptoms. For example, the association between depression and economic status has been well-established (McGrath et al., 1990; Steptoe et al., 2007; Kessler et al., 2009). In addition to a stable ratio of gender difference in major depressive disorder (especially in industrialized countries), people living in poverty have been found to show a higher prevalence of diagnosed depression than those of a higher economic status in the same country (Kessler et al., 2009). However, whether gender difference in the level of depressive symptoms in the general population, if it exists, is influenced by socioeconomic status is largely unknown. Similarly, epidemiological surveys and family studies suggest that the rate of depression has been increasing over the past few decades (Angst, 1985; Klerman and Weissman, 1989; Cross-National Collaborative Group, 1992; Weissman et al., 1993), which may also influence gender difference in the level of depressive symptoms. For example, with epidemiological survey data collected in the United States, Canada, Germany, and New Zealand, Weissman et al. (1993) suggested that gender difference in the rate of depression is decreasing due to the increased prevalence of depression in men. This question has not been addressed in the general population. By including year of publication and socioeconomic status of countries/regions where the study was carried out as moderators, a meta-analysis could address both of the above questions. In addition, taking year of publication as a potential moderator offers us an opportunity to observe whether the expected gender difference in the general population is decreasing or not, since such a trend has been suggested in diagnosed depression (Klerman and Weissman, 1989).
Finally and theoretically, taking participants’ age as a moderator in the meta-analysis offers the opportunity to test which of the three theories mentioned above best explain gender difference in the level of depressive symptoms in the general population. If the social gender role theory is valid, we would expect gender difference in the level of depressive symptoms to increase with gender socialization processes, and to remain unchanged when an individual attains the socially accepted gender role. If female hormones best explain this phenomenon, we would expect gender difference in the level of depressive symptoms to decrease in the age period when the production and release of female hormones decrease (Mirowsky, 1996), especially in the elderly group. Finally, if gender difference in the level of depressive symptoms was mainly due to increased dissatisfaction of physical appearance and increased mate selection pressure, we would expect the largest gender difference to be found in young adulthood when an individual’s prime concern is to develop intimacy and find a mate (Erikson, 1975).
In summary, the primary aim of the present research was to conduct a meta-analysis to investigate whether there is gender difference in the level of depressive symptoms in the general population and to examine how this gender difference, if it exists, varies with time and socioeconomic status of a country/region. Finally, we aimed to examine which of the three aforementioned theories best explains this gender difference, if it exists, by including age as a moderator. The findings of the current meta-analysis may contribute to our understanding of clinical depression, since depression has been suggested as a spectrum ranging from subthreshold depressive symptoms to clinically diagnosed depression (Seligman, 1978; Flett et al., 1997; Bowins, 2015).
Materials and Methods
Literature Search
First developed in 1961, the Beck Depression Inventory (Beck et al., 1961) is one of the best known and most widely used instruments for assessing the presence and severity of depressive symptoms in individuals aged 13 years and above (Beck et al., 1996). It is considered a gold standard of self-rating scales of depressive symptoms (Cusin et al., 2010). Good agreement between the BDI and a clinical diagnosis of depression has been repeatedly demonstrated (Beck et al., 1996; Schotte et al., 1997; Lasa et al., 2000; Gomes-Oliveira et al., 2012; Araya et al., 2013). The cross-cultural acceptance of the BDI also makes it a good tool to use in studying the underlying construct of depression in different cultural settings. The BDI has several versions, with the 21-item version most frequently adopted in either English or non-English languages. Thus, in the present meta-analysis, we only selected studies that had used the 21-item BDI for a better cross-cultural comparison of depressive symptoms.
Potential journal articles were identified from PubMed, EBSCO (PsychINFO, PsychARTICLE), and Web of Knowledge between 1961 and February 2014. The keywords used were ‘Beck Depression Inventory’ or “BDI” in the text but not “patient” in either the title or the abstract of a paper. The search yielded an initial pool of 2174 articles.
The 2174 papers were checked against criteria for inclusion and exclusion (Figure 1).
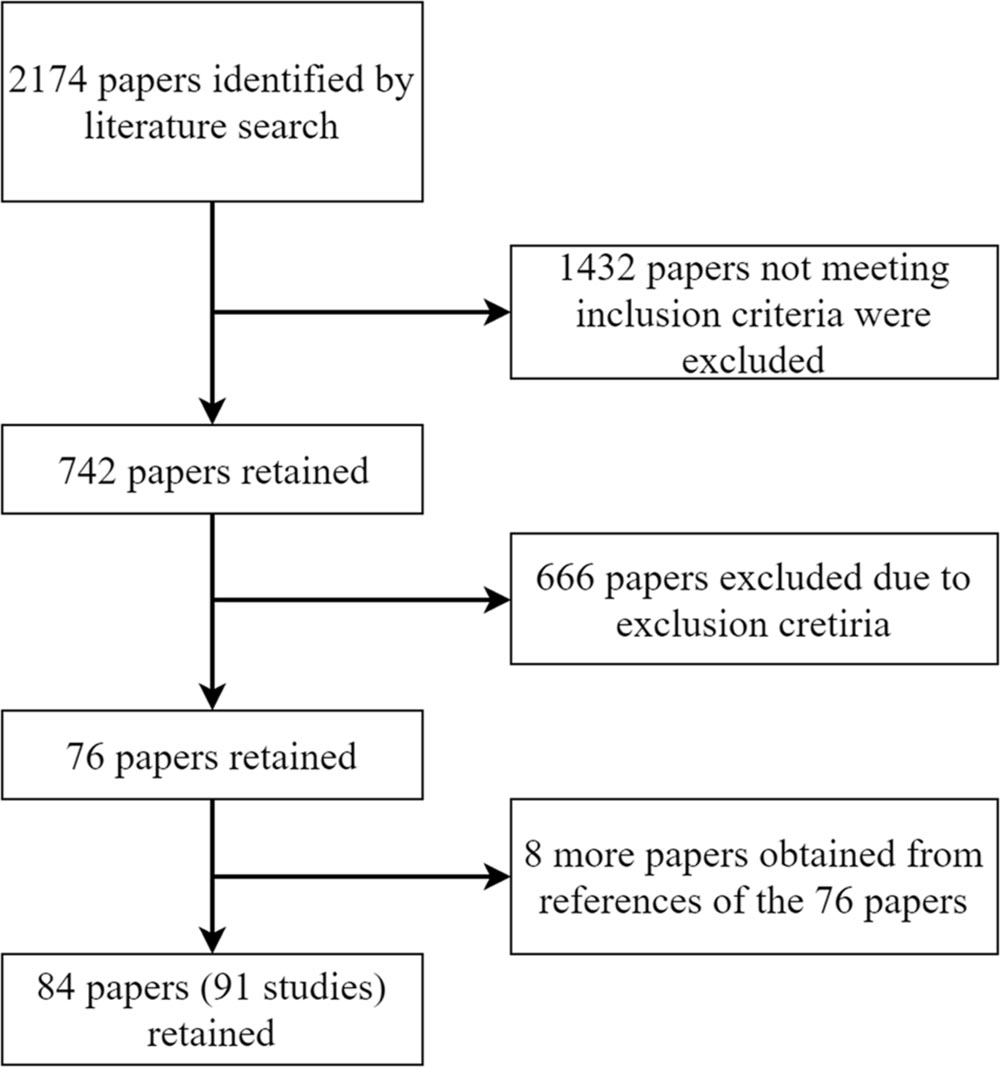
FIGURE 1. Flowchart for the inclusion of published data for the current meta-analysis.
The inclusion criteria were:
(1) Published in English (106 studies excluded);
(2) Participants included both genders (507 studies excluded);
(3) Participants were selected from the normal population (e.g., not elite athletes, transsexuals, cancer survivors, or cross-culturally married couples), and were free from physical and mental disorders (e.g., eating disorder, depression), addiction of any kind or obvious stress (e.g., care givers, survivors of accidents, victims of sexual assault, or recently bereaved; 800 studies excluded);
(4) The 21-item BDI was used (19 studies excluded).
After this step, a total of 742 papers remained and they were then subjected to the following six exclusion criteria:
(1) Studies that included data already reported in a previous study (one study excluded);
(2) Data for meta-analysis (means and SDs for both genders or exact t values or F values for gender means comparison) were not available (651 studies excluded);
(3) The BDI was used to measure the effect of a manipulation (10 studies excluded);
(4) Participants were asked to respond to the BDI under faked conditions (one study excluded);
(5) Not all 21 items of the BDI were used in the study (one study excluded);
(6) Case study (two studies excluded).
After this step, 76 papers were retained. A review of the reference list of these 76 papers generated another eight additional papers which were included in the meta-analysis. Consequently, the final sample included 84 papers, seven of which had two participant groups. Thus, the final meta-analysis contained 91 studies.
The socioeconomic status of a country/region where the study was carried out was measured using two indices: the gross domestic product (GDP) per capita and the Gini index. GDP data for 2013 (the most recent available data) were retrieved from the World Bank online database1. The Gini index reflects the income distribution of a nation’s residents, and is the most commonly used measure of inequality (Gini, 1909). Since the Gini index data for each country/region provided by the World Bank contained many missing data, we retrieved the relevant data from Quandl2, a search engine with financial, economic, and social studies. Nevertheless, the Gini indices for four studies were not available (one from the United Arab Emirates, one from Bahrain and two from Saudi Arabia). We then compared the Gini indices of regions/countries included in the present analysis with data available from the World Bank and found that the data tallied well.
It has been suggested that different versions of the BDI used across studies may be the cause of inconsistent findings in gender difference in the level of depressive symptoms in the general population (O’Hara et al., 1998). For this reason, we also investigated whether gender difference in the level of depressive symptoms may be influenced by the BDI version used (English vs. non-English; for English version: BDI-I vs. BDI-II). This measure was taken as a potential moderator for analysis. Overall, potential moderators in this meta-analysis included the age range of the participants, year of publication, the BDI version used, the GDP per capita, and the Gini index of the country/region where the study was carried out.
Meta-Analysis Procedure
The present meta-analysis was carried out using the Comprehensive Meta-Analysis (version 2.0) software package (Borenstein et al., 2005). Since we only included studies using the 21-item BDI, the mean difference (the mean BDI score in the male sample minus the mean BDI score in the female sample) was also available as an effect size, together with the widely used Cohen’s d. For both measures, a negative difference score indicates a higher BDI depression score in females than in males. The random model was used for calculating the effect sizes due to expected heterogeneity. A funnel plot was used to illustrate potential publication bias and quality of individual studies. In addition, the fail-safe-N, the number of additional unpublished studies with negative effect that would be needed to increase the p value for the meta-analysis to above 0.05, was also calculated to estimate publication bias (Rosenberg, 2005).
Results
Feature of Studies
The 91 studies were published between 1977 and 2014, with 38 published before 2000 and 53 published in 2000 or later. These studies involved 23,579 males and 29,470 females in 22 different countries/regions from six continents (1 in Africa, 11 in Asia, 25 in Europe, 40 in North America, 3 in Oceania, and 11 in South American). The socio-economic status of these countries varies substantially, with the GDP per capita ranging from USD 4838.50–67458.40 and the Gini index from 27.79 to 63.14. In relation to the versions of the BDI used, 47 studies used the English version of the BDI, among which 22 clearly stated using the BDI-I and 13 stated using the BDI-II. The other 44 studies were carried out with a non-English version of the BDI. Based on the age range of the participants and the sampling approach used, the studies were classified into five groups, adolescents (13 studies), young adults (exclusively university students, 45 studies), middle-aged adults (30–50 year old, five studies), older adults (six studies), and general population aged above 13 years (15 studies). The remaining seven studies could not be classified into any of these groups due to insufficient information. The mean depression score in 86 studies (five did not report the mean total scores, but the t or F value for between-gender comparison on BDI total score were available for meta-analysis) ranged from 2.08 to 19.30 [five reported a BDI mean total score higher than 13, the cut-off for mild depression on BDI-II (Beck et al., 1988)] for males, and 2.86–19.00 (eight reported a BDI mean total score higher than 13) for females.
General Analysis
The effect size for gender difference of each study varied from -1.146 to 0.227. Taken together, a random effect size of -0.187 (SE = 0.017, 95% CI = [-0.220, -0.155]) was found. The small but significant (Z = -11.70, p < 0.001) effect size indicated that on average females scored about 1.159 points (SE = 0.112, 95% CI = [-1.379, -0.939]) higher on the 21-item BDI than males. Given the large number of studies, it could be expected that the 91 studies were not homogeneous [Q(90) = 223.218, p < 0.001, I2 = 59.681]. Closer inspection showed that the study reported by Goodrich and Weaver (1998) generated a very large effect size of -1.146 (the second largest was -0.576). The sample included only 11 men and 13 women. Removing this study from the pool had a negligible effect on the mean effect size (Cohen’s d = -0.186). This study was therefore excluded from further analysis.
Publication bias was evaluated by the fail-safe-N and funnel plot. The fail safe N was 6987. Figure 2 shows the funnel plot with each circle representing an individual study included in the meta-analysis. The circles were generally symmetrical in their distribution, indicating the absence of publication bias. Additionally, most of the circles were located near the top of the funnel, indicating a relatively small standard error, suggesting good methodological quality of these studies.
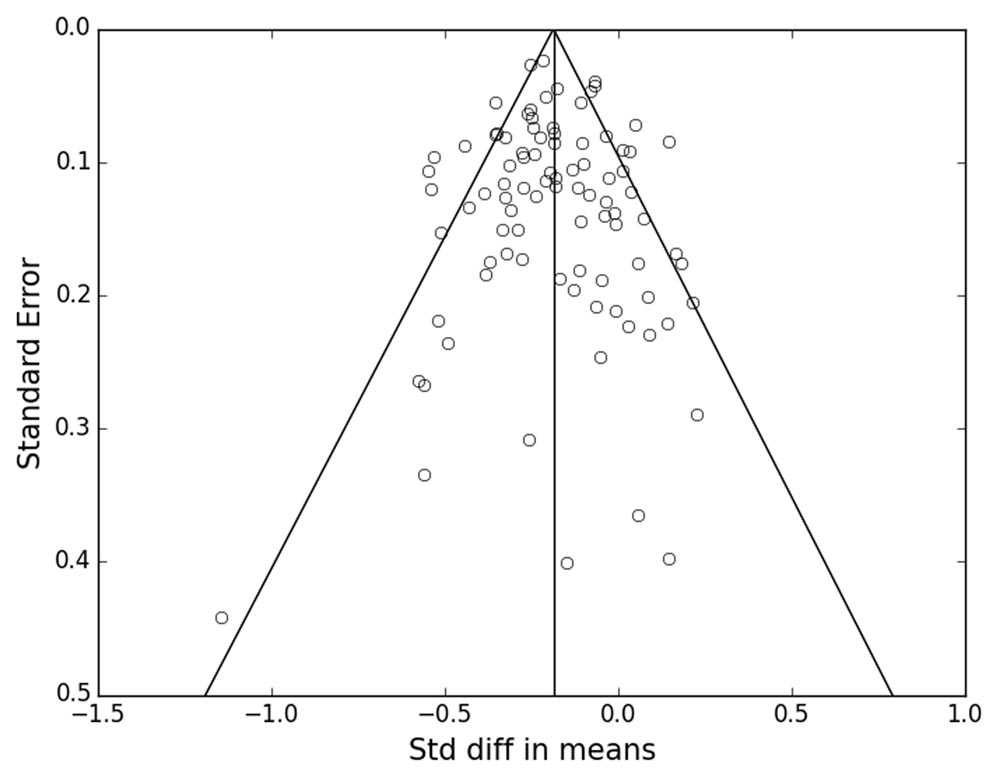
FIGURE 2. Funnel plot of standard errors as a function of standard difference in the means.
Potential Moderator Analysis
Taking age as a moderator, we compared the effect sizes of the five groups of studies, namely adolescents, young adults, middle-aged adults, general population, and older adults. Significant effect sizes (Table 1) were generated from each group. Studies in the older adult group, the general population group, and the middle-aged adult group were homogenous. Additionally, the effect sizes generated from these three groups were not significantly different [Q(2) = 4.089, p = 0.13]. Studies in the adolescent group and the young adult group were heterogeneous, and generated relatively small but significant effect sizes (adolescents: d = -0.188; early adults: d = -0.157). To test whether the effect sizes of the two younger groups were smaller than those of the three older groups, we created a “young” group including studies with adolescents and young adults, and an “old” group with studies involving middle-aged adults, older adults, and the general population. The 58 studies in the “young” group generated a small but significant effect size of -0.166 (SE = 0.024, 95% CI = [-0.212, -0.119], Z = -11.66, p < 0.01), which corresponded to -1.063 (SE = 0.167, 95% CI = [-1.390, -0.736]) points in the total BDI score. The fail-safe N was 1804. The 26 papers in the “old” group generated an effect size of -0.224 (SE = 0.019, 95% CI = [-0.262, -0.187], Z = -11.76, p < 0.01), which corresponded to -1.33 (SE = 0.117, 95% CI = [-1.562, -1.103]) points in the total BDI score. The fail-safe N was 1283. The Q-test indicated that the effect sizes in the “old” group were larger than those in the “young” group [Q(1) = 3.702, p = 0.05]. Studies that recruited from the general population contained individuals belonging to both the “old” and “young” groups. For this reason, we excluded these studies from the “old” group and found a similar group difference [Q(1) = 5.270, p < 0.05].
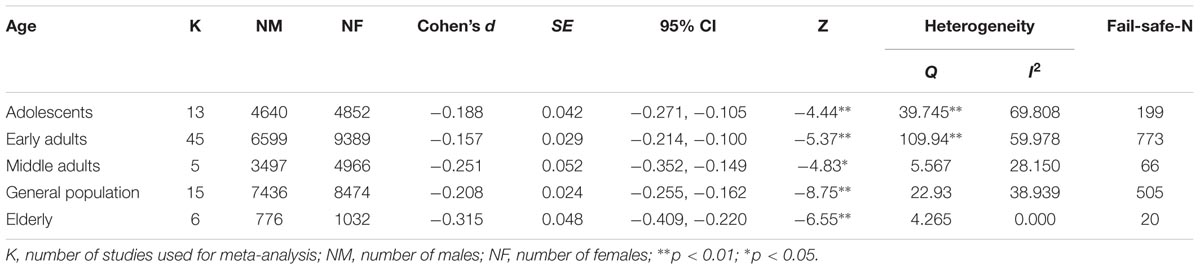
TABLE 1. Effect sizes of gender difference in BDI (Beck Depression Inventory) total score across age groups.
To test whether the observed gender difference in depressive symptoms systematically varied with time, a correlation analysis between publication year and effect size of the 91 studies was carried out. This revealed no significant correlation (r = -0.11, p = 0.30). In addition, we classified all the 91 studies into two groups, those published before 2000 and those published after 2000. The 38 studies published before 2000 generated an effect size of -0.181 (SE = 0.032, 95% CI = [-0.243, -0.119], Z = -5.730, p < 0.001), with a fail-safe number of 688. The studies included were heterogeneous [Q(37) = 86.372, p < 0.01, I2 = 57.162]. Similarly, the 53 studies published in 2000 or later also generated a small but significant effect size of -0.190 (SE = 0.020, 95% CI = [-0.229, -0.151], Z = -9.54, p < 0.001), and the studies included were heterogeneous [Q(52) = 135.672, p < 0.01, I2 = 61.672.162]. The fail-safe number was 3218. The effect sizes of the two groups were not significantly different [Q(1) = 0.056, p = 0.82]. Using the 85 studies that reported the mean BDI score for each gender, correlation analyses were carried out to test whether depressive symptoms increased with publication year. No significant correlation was found (male: r = 0.064, p = 0.55; female: r = 0.13, p = 0.23. Please see Supplementary Figure S1 for a scatter plot between depressive symptoms and year of publication for both genders).
Next, the two measures of socioeconomic status were included as moderators for analysis. First, correlation analyses between socioeconomic indices (GDP per capita and Gini index) and BDI scores were carried out separately for both genders for the 87 studies. GDP per capita correlated negatively and significantly with BDI scores for both genders (females: r = -0.428, p < 0.01; males: r = -0.414, p < 0.01), indicating that studies carried out in areas with higher GDP per capita generated a lower mean BDI score. Similar significant correlations were observed between the Gini index and BDI scores (females: r = 0.336, p < 0.01; males: r = 0.356, p < 0.01), indicating a higher BDI score in countries/regions with a higher Gini index. To test whether gender difference in the level of depressive symptoms also varied with socioeconomic status, correlation analyses between the two socioeconomic indices and the respective effect sizes were carried out. No significant correlation was found (GDP: r = 0.006, p = 0.96; Gini index: r = 0.056, p = 0.61). Figure 3 illustrates the relationship between the BDI score of each gender, effect sizes, and GDP. All the data were standardized.
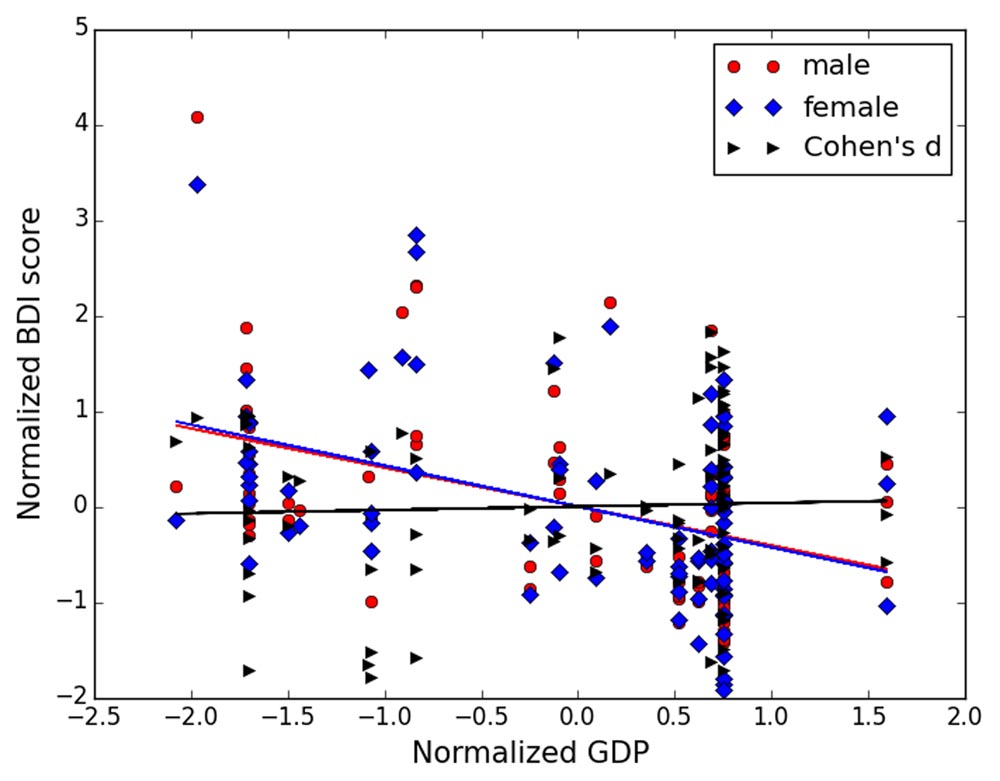
FIGURE 3. Scatter plots between GDP (gross domestic product) per capita and male BDI (Beck Depression Inventory) score (red), between GDP per capita and female BDI score (blue), and between GDP per capita and Cohen’s d (black). All data were normalized for illustration purpose.
The last moderator examined was the BDI version used. The wordings used in the BDI of a certain language may contribute to the observed gender difference in the level of depressive symptoms. As such, we separated all the studies into two groups: one group consisting of studies using an English version of the BDI and the other group consisting of studies using a non-English version of the BDI. The 47 studies using the English version of the BDI generated a small but significant effect size of -0.155 (SE = 0.027, 95% CI = [-0.208, -0.102], Z = -5.725, p < 0.01). These studies were heterogeneous [Q(46) = 89.701, p < 0.01, I2 = 48.718]. The large fail-safe-N of 710 indicated that this small effect was reliable. Similarly, the 44 studies using non-English versions of the BDI also generated a significant effect size of -0.211 (SE = 0.021, 95% CI = [-0.252, -0.170], Z = -10.097, p < 0.01). These studies were heterogeneous [Q(43) = 121.616, p < 0.01, I2 = 64.643]. The fail-safe-N was 9162. There was no significant difference between the effect sizes of the two groups [Q(1) = 2.754, p = 0.10].
In studies using the English version of the BDI, we also tested whether different versions of the BDI contributed to the observed gender difference in the level of depressive symptoms. Among the 47 studies adopting the English version of the BDI, 22 clearly stated that they used the original BDI-I (published in 1961) and 13 used the BDI-II. The 22 studies using the BDI-I generated a significant effect size of -0.172 (SE = 0.041, 95% CI = [-0.253, -0.091], Z = -4.149, p < 0.01). The studies were heterogeneous [Q(21) = 38.36, p = 0.01, I2 = 45.255] and the fail-safe-N was 142. Similarly, a small but significant effect size of -0.117 (SE = 0.041, 95% CI = [-0.198, -0.037], Z = -2.848, p < 0.01) was generated from the 13 studies using the BDI-II. These studies were heterogeneous [Q(12) = 22.091, p < 0.01, I2 = 45.679]. The fail-safe-N was 42. These two effect sizes were not significantly different [Q(1) = 0.865, p = 0.35], indicating that gender difference in the level of depressive symptoms was not likely to be influenced by the version of the BDI used.
Discussion
The main aim of the present study was to use the meta-analytic method to ascertain whether there is a gender difference in the level of depressive symptoms in the general population. With 91 studies from five continents, we found that females did report a significantly higher level of depressive symptoms than males, with female scoring on average about 1.159 points more on the BDI than males (the highest possible BDI total score is 63). Importantly, the studies in the present meta-analysis were largely homogeneous, except those that included adolescents and young adults. This finding is interesting because most of the previous studies that did not find a gender difference in the level of depressive symptoms in non-clinical populations were based on adolescent (Teri, 1982; Martin et al., 1995; Kim et al., 2011) or university student samples (Hammen and Padesky, 1977; Gould, 1982; Bryson and Pilon, 1984; Endler et al., 1992; Steer and Clark, 1997; O’Hara et al., 1998; Pillay et al., 2002; Erol et al., 2006; Thomas and Altareb, 2012). Moreover, the gender difference in the level of depressive symptoms appeared to be independent of socioeconomic status, year of publication, and version of the BDI used. Overall, our results appear to confirm that there is a “female preponderance” in the level of depressive symptoms in the general population.
By taking into consideration two socioeconomic indices as moderators, we found a negative relationship between socioeconomic status and the level of depressive symptoms when socioeconomic status was assessed at the country/region level. Previous research on the relationship between socioeconomic status and depression was mainly carried out by assessing socioeconomic status at the individual level (Kessler et al., 2009). Taking the findings together, it can be concluded that poor socioeconomic status has a negative impact on a person not only at the individual level, but also at a country/region level. If we take depression as a continuum (Flett et al., 1997; Bowins, 2015), with healthy individuals showing mild symptoms at one end and those with a clinical diagnosis at the other end, this finding speaks against the notion that depression is a disease of modernization (Hidaka, 2012), and supports that poverty is “the pathway to depression”(McGrath et al., 1990). It is possible that in developed countries/regions, people have more knowledge about and better acceptance of mental illness, and more opportunity to have their depression diagnosed and treated. As a result, the prevalence of depression in developed countries/regions presented may be artificially inflated3. In contrast, in less developed countries/regions, due to poorer knowledge and acceptance of mental illness and less opportunity for diagnosis and treatment, more depressed individuals are left undiagnosed and untreated, presenting a “lower” prevalence rate.
Depression in China, where people’s acceptance of depression is not high (Xu, 1987), might offer some insight for the above point of view. The prevalence of depression in China is relatively low, with a 1-year prevalence of 1.8% and a life-time prevalence of 3.6% according to a WHO survey (Lee et al., 2009), which is much lower than the USA (Kessler et al., 2003). In another study, researchers randomly selected 50 general hospitals in Beijing in 2003–2004. A total of 73 cases who met the DSM-IV criteria for major depression were screened out among all the outpatients. Only 10 of them (14%) were identified by physicians, and only four (5%) sought help from psychologists or psychiatrists (Zhang et al., 2006). In other words, the existence of many unidentified patients may artificially “decrease” the prevalence of depression in China. This possibility is also compatible with our analysis using year of publication as a moderator. We observed that level of depressive symptoms did not vary with year of publication in the last few decades, while epidemiological studies have shown an “increasing” prevalence of depression (Joyce et al., 1990; Kessler et al., 1994; Murphy et al., 2000; Lee et al., 2007). It is possible that the increasing prevalence rate was due to an increasing number of people being diagnosed and treated secondary to increased awareness and acceptance of depression.
Another interesting finding regarding the influence of socioeconomic status on the level of depressive symptoms is that these indices had no relationship with gender difference in depressive symptoms. This suggests that women in both non-industrialized and industrialized countries/regions report a higher level of depressive symptoms than males. Previously, it has been suggested that the gender ratio of major depressive disorder in non-industrialized countries is smaller than in industrialized countries (Weissman et al., 1993). One piece of evidence that supports this viewpoint is that treated cases of depression in some non-industrialized countries indicated either equal gender ratio [e.g., Bulaways in Rhodesia (Republic of Zimbabwe after 1980) and Baghdad in Iraq; see Table 1 in Weissman and Klerman, 1977] or even a higher proportion of males than females (e.g., Dakar in Guinea, Madurai, Madras, and New Delhi in India, see Table 1 in Weissman and Klerman, 1977). Considering the economic situation as well as the level of medical service in these countries/regions, it is possible that depression in females in these countries/regions may be even more under-diagnosed than males. This issue warrants further research in these countries/regions.
The final aim of the present meta-analysis was to evaluate the validity of the three theories purporting to explain the gender difference in depression. To do this, analyses were conducted using age as a moderator. Similar to the finding previously reported in a study using patients with diagnosed depressive disorders (Angold et al., 1999), gender difference in the level of depressive symptoms was found in our youngest group, that is, the adolescents. A similar extent of gender difference in the level of depressive symptoms was also observed in young adults. The gender difference increased significantly when the group reached 30 years of age. The change in gender difference magnitude with age is consistent with the social gender role theory of depression, which is based on the disadvantaged social status that females experience relative to males (Gove, 1977; Mirowsky, 1996). In particular, it supports the age increment prediction of this theory as originally proposed by Mirowsky. Smaller gender differences are expected in adolescence since the majority of women and men would be in school and relatively few would be in paid employment. Gender difference in levels of depressive symptoms emerges in adolescence and increases significantly in middle adulthood due to the emergence of inequities in employment, housework, family responsibilities, and other factors.
The change in gender difference with age is not consistent with the biological or evolutionary theories. A biological account of gender difference, which suggests that the influence of female hormones as the cause (Janowsky and Rausch, 1985), is not consistent with the similar gender difference in the level of depressive symptoms in the middle-age and the older adult groups. We would expect female hormone levels to be different in these two periods of the human lifespan. Similarly, the evolutionary theory, which highlights females concerns about their own appearance and body image in mate selection, would predict a peak in gender difference in the level of depressive symptoms in the two younger age groups. However, our results did not support this prediction.
The embodiment of unequal social gender for adult females has been well described by those who believe that an unfavorable social gender role causes females to be at a higher risk of depression (Barnett et al., 1992; McIntosh et al., 1994). A quote from the recent Human Development Report summarized the poor situation experienced by many females worldwide: “Women experienced many kinds of disadvantage and discrimination in health, education, and employment” (United Nations Development Programme, 2014, p. 39). Thus, it appears that there is a significant link between the present finding of females scoring 1.159 points higher than males on the 21-item BDI and the observed 8% lower score of females on the Human Development Index (a comprehensive index which takes into consideration life expectancy, education, and economy) as reported by the recent Human Development Project (United Nations Development Programme, 2014). Importantly, the present findings suggest that the link may be important even at the sub-clinical level of depression in the general population.
It might be expected that the gender difference in depression would show a decline over recent decades, given improvements in education, technology, and life expectancy (United Nations Development Programme, 1990). Moreover, changes in society have begun to address the disadvantages experienced by women, particularly in industrialized countries. However, correlation analysis between year of publication and the magnitude of gender difference in the level of depressive symptoms did not support this prediction. Similar conclusions of stable gender differences in mathematical and science achievements have also been reported (Reilly et al., 2015), which further reinforces the conclusion that recent societal changes asserting women’s rights did not seem to reduce gender gaps. Such findings suggest that more specific factors may be important for the gender difference in psychological functions (Reilly and Neumann, 2013).
A limitation of the present meta-analysis is that we cannot exclude the possibility that the observed gender difference in the level of depressive symptoms is due to systematic bias in participants’ responses to certain items of the BDI. For example, several studies have shown that females are more likely to respond positively to items such as “crying” (O’Hara et al., 1998), “self-dislike,” “fatigability,” and “somatic preoccupation” (Gorenstein et al., 1999). Future studies are needed to explore and address this possibility. Additionally, the results of the present study might have been influenced by the exclusion of certain studies.
Author Contributions
KW designed the study; HL and KW searched the literature and analyzed data; KW wrote the first version of the manuscript; other authors contributed on writing and revising the manuscript.
Conflict of Interest Statement
The authors declare that the research was conducted in the absence of any commercial or financial relationships that could be construed as a potential conflict of interest.
Acknowledgments
This study was supported by the National Natural Science Foundation of China (31200775) and the Key Laboratory of Mental Health, Chinese Academy of Sciences (KLMH2014ZG09) to KW. KW is also supported by the China Scholarship Council as a visiting scholar to the University of Pennsylvania. RC and DS were supported by the CAS/SAFEA International Partnership Program for Creative Research Teams (Y2CX131003). These funding agents had no role in the study design, the collection, analysis, and interpretation of data; the writing of the manuscript; or the decision to submit the paper for publication.
Supplementary Material
The Supplementary Material for this article can be found online at: http://journal.frontiersin.org/article/10.3389/fpsyg.2016.01398
FIGURE S1 | The scatter plots between mean BDI (Beck Depression Inventory) score and year of publication for female (circle) and male (square).
Footnotes
- ^http://data.worldbank.org/indicator/NY.GDP.PCAP.CD
- ^http://www.quandl.com/demography/gini-index-by-country
- ^In cases of countries/regions where a hunter-gather lifestyle is dominant and contact with the “outside” world is nearly absent, there may be another explanation. However, none of the reviewed studies were conducted in such counties/regions.
References
Aalto, A. M., Elovainio, M., Kivimaki, M., Uutela, A., and Pirkola, S. (2012). The Beck Depression Inventory and general health questionnaire as measures of depression in the general population: a validation study using the composite international diagnostic interview as the gold standard. Psychiatry Res. 197, 163–171. doi: 10.1016/j.psychres.2011.09.008
Angold, A., Costello, E. J., Erkanli, A., and Worthman, C. M. (1999). Pubertal changes in hormone levels and depression in girls. Psychol. Med. 29, 1043–1053. doi: 10.1017/S0033291799008946
Angst, J. (1985). Switch from depression to mania–a record study over decades between 1920 and 1982. Psychopathology 18, 140–154. doi: 10.1159/000284227
Araya, R., Montero-Marin, J., Barroilhet, S., Fritsch, R., and Montgomery, A. (2013). Detecting depression among adolescents in Santiago, Chile: sex differences. BMC Psychiatry 13:122. doi: 10.1186/1471-244X-13-122
Ayuso-Mateos, J. L., Vazquez-Barquero, J. L., Dowrick, C., Lehtinen, V., Dalgard, O. S., Casey, P., et al. (2001). Depressive disorders in Europe: prevalence figures from the ODIN study. Br. J. Psychiatry 179, 308–316. doi: 10.1192/bjp.179.4.308
Barnett, R. C., Marshall, N. L., and Singer, J. D. (1992). Job experiences over time, multiple roles, and women’s mental health: a longitudinal study. J. Pers. Soc. Psychol. 62, 634–644. doi: 10.1037/0022-3514.62.4.634
Beck, A. T., Steer, R. A., and Brown, G. K. (1996). Manual for the Beck Depression Inventory-II. San Antonio, TX: Psychological Corporation.
Beck, A. T., Steer, R. A., and Carbin, M. G. (1988). Psychometric properties of the Beck Depression Inventory: twenty-five years of evaluation. Clin. Psychol. Rev. 8, 77–100. doi: 10.1016/0272-7358(88)90050-5
Beck, A. T., Ward, C. H., Mendelson, M., Mock, J. E., and Erbaugh, J. (1961). An inventory for measuring depression. Arch. Gen. Psychiatry 4, 561–571. doi: 10.1001/archpsyc.1961.01710120031004
Blazer, D. G., Kessler, R. C., and Swartz, M. S. (1998). Epidemiology of recurrent major and minor depression with a seasonal pattern. The national comorbidity survey. Br. J. Psychiatry 172, 164–167. doi: 10.1192/bjp.172.2.164
Borenstein, M., Hedges, L., Higgins, J., and Rothstein, H. (2005). Comprehensive Meta Analysis Software, 2nd Edn. Englewood, NJ: Biostat.
Bowins, B. (2015). Depression: discrete or continuous? Psychopathology 48, 69–78. doi: 10.1159/000366504
Boyd, J. H., and Weissman, M. M. (1981). Epidemiology of affective disorders. A reexamination and future directions. Arch. Gen. Psychiatry 38, 1039–1046.
Bryson, S. E., and Pilon, D. J. (1984). Sex differences in depression and the method of administering the Beck Depression Inventory. J. Clin. Psychol. 40, 529–534. doi: 10.1002/1097-4679(198403)40:2<529::AID-JCLP2270400224>3.0.CO;2-F
Cross-National Collaborative Group (1992). The changing rate of major depression. Cross-national comparisons. JAMA 268, 3098–3105.
Cusin, C., Yang, H., Yeung, A., and Fava, M. (2010). “Rating scales for depression,” in Handbook of Clinical Rating Scales and Assessment in Psychiatry and Mental Health, eds L. Baer and M. A. Blais (New York, NY: Humana Press).
Endler, N. S., Cox, B. J., Parker, J. D., and Bagby, R. M. (1992). Self-reports of depression and state-trait anxiety: evidence for differential assessment. J. Pers. Soc. Psychol. 63, 832–838. doi: 10.1037/0022-3514.63.5.832
Erol, A., Toprak, G., and Yazici, F. (2006). Psychological and physical correlates of disordered eating in male and female Turkish college students. Psychiatry Clin. Neurosci. 60, 551–557. doi: 10.1111/j.1440-1819.2006.01557.x
Flett, G. L., Vredenburg, K., and Krames, L. (1997). The continuity of depression in clinical and nonclinical samples. Psychol. Bull. 121, 395–416. doi: 10.1037/0033-2909.121.3.395
Goodrich, S., and Weaver, K. A. (1998). Differences in depressive symptoms between traditional workers and shiftworkers. Psychol. Rep. 83, 571–576.
Gomes-Oliveira, M. H., Gorenstein, C., Lotufo Neto, F., Andrade, L. H., and Wang, Y. P. (2012). Validation of the Brazilian Portuguese version of the Beck Depression Inventory-II in a community sample. Rev. Bras. Psiquiatr. 34, 389–394. doi: 10.1016/j.rbp.2012.03.005
Gorenstein, C., Andrade, L., Vieira Filho, A. H., Tung, T. C., and Artes, R. (1999). Psychometric properties of the Portuguese version of the Beck Depression Inventory on Brazilian college students. J. Clin. Psychol. 55, 553–562. doi: 10.1002/(SICI)1097-4679(199905)55:5<553::AID-JCLP3>3.0.CO;2-D
Gould, J. (1982). A psychometric investigation of the standard and short form Beck Depression Inventory. Psychol. Rep. 51, 1167–1170. doi: 10.2466/pr0.1982.51.3f.1167
Gove, W. R. (1977). The relationship between sex roles, marital status, and mental illness. Soc. Forces 51, 34–44. doi: 10.2307/2576129
Hammen, C. L., and Padesky, C. A. (1977). Sex differences in the expression of depressive responses on the Beck Depression Inventory. J. Abnorm. Psychol. 86, 609–614. doi: 10.1037/0021-843X.86.6.609
Hankin, B. L., and Abramson, L. Y. (2001). Development of gender differences in depression: an elaborated cognitive vulnerability-transactional stress theory. Psychol. Bull. 127, 773–796. doi: 10.1037/0033-2909.127.6.773
Hankin, B. L., Abramson, L. Y., Moffitt, T. E., Silva, P. A., Mcgee, R., and Angell, K. E. (1998). Development of depression from preadolescence to young adulthood: emerging gender differences in a 10-year longitudinal study. J. Abnorm. Psychol. 107, 128–140. doi: 10.1037/0021-843X.107.1.128
Hidaka, B. H. (2012). Depression as a disease of modernity: explanations for increasing prevalence. J. Affect. Disord. 140, 205–214. doi: 10.1016/j.jad.2011.12.036
Hill, T. D., and Needham, B. L. (2013). Rethinking gender and mental health: a critical analysis of three propositions. Soc. Sci. Med. 92, 83–91. doi: 10.1016/j.socscimed.2013.05.025
Janowsky, D. S., and Rausch, J. (1985). Biochemical hypotheses of premenstrual tension syndrome. Psychol. Med. 15, 3–8. doi: 10.1017/S0033291700020870
Joyce, P. R., Oakley-Browne, M. A., Wells, J. E., Bushnell, J. A., and Hornblow, A. R. (1990). Birth cohort trends in major depression: increasing rates and earlier onset in New Zealand. J. Affect. Disord. 18, 83–89. doi: 10.1016/0165-0327(90)90063-E
Kessler, R. C., Berglund, P., Demler, O., Jin, R., Koretz, D., Merikangas, K. R., et al. (2003). The epidemiology of major depressive disorder: results from the National Comorbidity Survey Replication (NCS-R). JAMA 289, 3095–3105. doi: 10.1001/jama.289.23.3095
Kessler, R. C., Berglund, P., Demler, O., Jin, R., Koretz, D., Merikangas, K. R., et al. (2009). The epidemiology of major depressive disorder. JAMA 289, 3095–3105. doi: 10.1001/jama.289.23.3095
Kessler, R. C., Mcgonagle, K. A., Nelson, C. B., Hughes, M., Swartz, M., and Blazer, D. G. (1994). Sex and depression in the National Comorbidity Survey. II: cohort effects. J. Affect. Disord. 30, 15–26.
Kim, S. J., Lee, Y. J., Cho, S. J., Cho, I. H., and Lim, W. (2011). Relationship between weekend catch-up sleep and poor performance on attention tasks in Korean adolescents. Arch. Pediatr. Adolesc. Med. 165, 806–812. doi: 10.1001/archpediatrics.2011.128
Klerman, G. L., and Weissman, M. M. (1989). Increasing rates of depression. JAMA 261, 2229–2235. doi: 10.1001/jama.1989.03420150079041
Koivumaa-Honkanen, H., Kaprio, J., Honkanen, R., Viinamaki, H., and Koskenvuo, M. (2004). Life satisfaction and depression in a 15-year follow-up of healthy adults. Soc. Psychiatry Psychiatr. Epidemiol. 39, 994–999. doi: 10.1007/s00127-004-0833-6
Lasa, L., Ayuso-Mateos, J. L., Vazquez-Barquero, J. L., Diez-Manrique, F. J., and Dowrick, C. F. (2000). The use of the Beck Depression Inventory to screen for depression in the general population: a preliminary analysis. J. Affect. Disord. 57, 261–265. doi: 10.1016/S0165-0327(99)00088-9
Lee, S., Tsang, A., Huang, Y. Q., He, Y. L., Liu, Z. R., Zhang, M. Y., et al. (2009). The epidemiology of depression in metropolitan China. Psychol. Med. 39, 735–747. doi: 10.1017/S0033291708004091
Lee, S., Tsang, A., Zhang, M. Y., Huang, Y. Q., He, Y. L., Liu, Z. R., et al. (2007). Lifetime prevalence and inter-cohort variation in DSM-IV disorders in metropolitan China. Psychol. Med. 37, 61–71. doi: 10.1017/S0033291706008993
Lopez Molina, M. A., Jansen, K., Drews, C., Pinheiro, R., Silva, R., and Souza, L. (2014). Major depressive disorder symptoms in male and female young adults. Psychol. Health Med. 19, 136–145. doi: 10.1080/13548506.2013.793369
Luppa, M., Sikorski, C., Luck, T., Ehreke, L., Konnopka, A., Wiese, B., et al. (2012). Age- and gender-specific prevalence of depression in latest-life–systematic review and meta-analysis. J. Affect. Disord. 136, 212–221. doi: 10.1016/j.jad.2010.11.033
Martin, G., Rozanes, P., Pearce, C., and Allison, S. (1995). Adolescent suicide, depression and family dysfunction. Acta Psychiatr. Scand. 92, 336–344. doi: 10.1111/j.1600-0447.1995.tb09594.x
McGrath, E., Keita, G. P., Strickland, B., and Russo, N. F. (1990). Women and Depression: Risk Factors and Treatment Issues. Washington, DC: American Psychological Association.
McIntosh, D. N., Keywell, J., Riefman, A., and Ellsworth, P. C. (1994). Stress and health in first-year law students: women fare worse. J. Appl. Soc. Psychol. 24, 1474–1497. doi: 10.1111/j.1559-1816.1994.tb01559.x
Mirowsky, J. (1996). Age and the gender gap in depression. J. Health Soc. Behav. 37, 362–380. doi: 10.2307/2137263
Murphy, J. M., Laird, N. M., Monson, R. R., Sobol, A. M., and Leighton, A. H. (2000). A 40-year perspective on the prevalence of depression: the Stirling County Study. Arch. Gen. Psychiatry 57, 209–215. doi: 10.1001/archpsyc.57.3.209
Nolen-Hoeksema, S., Larson, J., and Grayson, C. (1999). Explaining the gender difference in depressive symptoms. J. Pers. Soc. Psychol. 77, 1061–1072. doi: 10.1037/0022-3514.77.5.1061
O’Hara, M. M., Sprinkle, S. D., and Ricci, N. A. (1998). Beck Depression Inventory–II: college population study. Psychol. Rep. 82, 1395–1401. doi: 10.2466/pr0.1998.82.3c.1395
Pillay, A. L., Edwards, S. D., Gambu, S. Q., and Dhlomo, R. M. (2002). Depression among university students in South Africa. Psychol. Rep. 91, 725–728. doi: 10.2466/PR0.91.7.725-728
Reilly, D., and Neumann, D. L. (2013). Gender-related differences in spatial ability: a meta-analytic review. Sex Roles 68, 521–535. doi: 10.1007/s11199-013-0269-0
Reilly, D., Neumann, D. L., and Andrews, G. (2015). Sex differences in mathematics and science achievement: A meta-analysis of National Assessment of Educational Progress assessments. J. Educ. Psychol. 107, 645–662. doi: 10.1037/edu0000012
Rosenberg, M. S. (2005). The file-drawer problem revisited: a general weighted method for calculating fail-safe numbers in meta-analysis. Evolution 59, 464–468. doi: 10.1111/j.0014-3820.2005.tb01004.x
Schotte, C. K., Maes, M., Cluydts, R., De Doncker, D., and Cosyns, P. (1997). Construct validity of the Beck Depression Inventory in a depressive population. J. Affect. Disord. 46, 115–125. doi: 10.1016/S0165-0327(97)00094-3
Seedat, S., Scott, K. M., Angermeyer, M. C., Berglund, P., Bromet, E. J., Brugha, T. S., et al. (2009). Cross-national associations between gender and mental disorders in the World Health Organization World Mental Health Surveys. Arch. Gen. Psychiatry 66, 785–795. doi: 10.1001/archgenpsychiatry.2009.36
Seligman, M. E. (1978). Learned helplessness as a model of depression. Comment and integration. J. Abnorm. Psychol. 87, 165–179. doi: 10.1037/0021-843X.87.1.165
Steer, R. A., and Clark, D. A. (1997). Psychometric characteristic of the Beck Depression Inventory-II with college students. Meas. Eval. Couns. Dev. 30, 128–136. doi: 10.1080/13651500510014800
Steptoe, A., Tsuda, A., Tanaka, Y., and Wardle, J. (2007). Depressive symptoms, socio-economic background, sense of control, and cultural factors in university students from 23 countries. Int. J. Behav. Med. 14, 97–107. doi: 10.1007/BF03004175
Teri, L. (1982). The use of the Beck Depression Inventory with adolescents. J. Abnorm. Child Psychol. 10, 277–284. doi: 10.1007/BF00915946
Thomas, J., and Altareb, B. (2012). Cognitive vulnerability to depression: an exploration of dysfunctional attitudes and ruminative response styles in the United Arab Emirates. Psychol. Psychother. 85, 117–121. doi: 10.1111/j.2044-8341.2011.02015.x
United Nations Development Programme (1990). Human Development Report 1990. Available at: http://hdr.undp.org/sites/default/files/reports/219/hdr_1990_en_complete_nostats.pdf
United Nations Development Programme (2014). Sustaining Progress: Reducing Vulnerabilities and Buiding Resilience (Human Development Report 2014). Available at: http://hdr.undp.org/en/2014-report/download
Weissman, M. M., Bland, R., Joyce, P. R., Newman, S., Wells, J. E., and Wittchen, H. U. (1993). Sex differences in rates of depression: cross-national perspectives. J. Affect. Disord. 29, 77–84. doi: 10.1016/0165-0327(93)90025-F
Weissman, M. M., and Klerman, G. L. (1977). Sex differences and the epidemiology of depression. Arch. Gen. Psychiatry 34, 98–111. doi: 10.1001/archpsyc.1977.01770130100011
Xu, J. M. (1987). Some issues in the diagnosis of depression in China. Can. J. Psychiatry 32, 368–370.
Keywords: gender difference, depression, age, social gender role, economic status, BDI
Citation: Wang K, Lu H, Cheung EFC, Neumann DL, Shum DHK and Chan RCK (2016) “Female Preponderance” of Depression in Non-clinical Populations: A Meta-Analytic Study. Front. Psychol. 7:1398. doi: 10.3389/fpsyg.2016.01398
Received: 28 April 2016; Accepted: 01 September 2016;
Published: 15 September 2016.
Edited by:
Francisco José Eiroa-Orosa, University of East London, UKReviewed by:
Michelle Dow Keawphalouk, Harvard University, USA; Massachusetts Institute of Technology, USAHans Menning, Forel Clinic, Switzerland
Copyright © 2016 Wang, Lu, Cheung, Neumann, Shum and Chan. This is an open-access article distributed under the terms of the Creative Commons Attribution License (CC BY). The use, distribution or reproduction in other forums is permitted, provided the original author(s) or licensor are credited and that the original publication in this journal is cited, in accordance with accepted academic practice. No use, distribution or reproduction is permitted which does not comply with these terms.
*Correspondence: Kui Wang, wangk@psych.ac.cn Raymond C. K. Chan, rckchan@psych.ac.cn