 Akitsu Ikeda
 Jun J. Miyamoto
 Nobuo Usui
 Masato Taira2
 Keiji Moriyama
- 1Maxillofacial Orthognathics, Division of Maxillofacial and Neck Reconstruction, Graduate School of Medical and Dental Sciences, Tokyo Medical and Dental University, Tokyo, Japan
- 2Cognitive Neurobiology, Division of Maxillofacial and Neck Reconstruction, Graduate School of Medical and Dental Sciences, Tokyo Medical and Dental University, Tokyo, Japan
Based on the theory of incentive sensitization, the exposure to food stimuli sensitizes the brain’s reward circuits and enhances attentional bias toward food. Therefore, reducing attentional bias to food could possibly be beneficial in preventing impulsive eating. The importance of chewing has been increasingly implicated as one of the methods for reducing appetite, however, no studies to investigate the effect of chewing on attentional bias to food. In this study, we investigated whether chewing stimulation (i.e., chewing tasteless gum) reduces attentional bias to food as well as an actual feeding (i.e., ingesting a standardized meal) does. We measured reaction time, gaze direction and gaze duration to assess attentional bias toward food images in pairs of food and non-food images that were presented in a visual probe task (Experiment 1, n = 21) and/or eye-tracking task (Experiment 2, n = 20). We also measured appetite ratings using visual analog scale. In addition, we conducted a control study in which the same number of participants performed the identical tasks to Experiments 1 and 2, but the participants did not perform sham feeding with gum-chewing/actual feeding between tasks and they took a rest. Two-way ANOVA revealed that after actual feeding, subjective ratings of hunger, preoccupation with food, and desire to eat significantly decreased, whereas fullness significantly increased. Sham feeding showed the same trends, but to a lesser degree. Results of the visual probe task in Experiment 1 showed that both sham feeding and actual feeding reduced reaction time bias significantly. Eye-tracking data showed that both sham and actual feeding resulted in significant reduction in gaze direction bias, indexing initial attentional orientation. Gaze duration bias was unaffected. In both control experiments, one-way ANOVAs showed no significant differences between immediately before and after the resting state for any of the appetite ratings, reaction time bias, gaze direction bias, or gaze duration bias. In conclusion, chewing stimulation reduced subjective appetite and attentional bias to food, particularly initial attentional orientation to food. These findings suggest that chewing stimulation, even without taste, odor, or ingestion, may affect reward circuits and help prevent impulsive eating.
Introduction
The worldwide prevalence of obesity is increasing, and the condition is a major risk factor for many diseases and premature death (Ng et al., 2014). In recent years, a positive correlation has been found between the speed of eating and body mass index (BMI) (Sasaki et al., 2003; Otsuka et al., 2006; Maruyama et al., 2008; Leong et al., 2011), as well as an association between reduced masticatory function and obesity (Katagiri et al., 2011; Sanchez-Ayala et al., 2013). Therefore, the importance of chewing has been increasingly implicated as one of the methods for preventing overeating.
Food intake is regulated by two complementary drives: the homeostatic and reward pathways (Lutter and Nestler, 2009). The homeostatic pathway controls energy balance with regard to eating after the depletion of energy stores (Lutter and Nestler, 2009). Reward circuits in the mesolimbic dopamine system are driven by environmental cues such as reward, cognitive, and emotional factors (Lutter and Nestler, 2009). In the modern world of plenty, the reward pathway can override the homeostatic pathway by increasing the desire to consume highly palatable foods (Lutter and Nestler, 2009). Therefore, addressing the reward system is considered important.
The visual appearance of food interacts with the brain’s reward circuits and triggers motivated behavior, which plays a significant role in excessive food intake and the resultant obesity (Castellanos et al., 2009). This process can be explained by the concept of “incentive sensitization” proposed by Robinson and Berridge (1993, 2008), in which addictive substances modify the brain’s reward circuits, leading to hypersensitivity to reward-related stimuli. Dopamine plays a key role in influencing communication among the reward circuits, a complex network of cortical and mesolimbic brain structures (Kelley and Berridge, 2002; Castellanos et al., 2009). The release of dopamine in the reward circuits causes feelings of “wanting” (Volkow et al., 2011). “Wanting” evolves into craving, which manifests behaviorally as seeking and consuming (Robinson and Berridge, 1993). This series of rewarding experiences increases salience of the reward-expected stimuli. Attentional bias occurs when the reward-related stimuli acquire the ability to command attention and increase priority of attentional cues associated with motivational goals in cognitive processing (Field and Cox, 2008). It has been proposed that attentional bias to food stimuli may be an outcome of dopamine activation in the reward circuits (Nijs, 2010). A recent study found that a Food Attention Control Training Program reduced attentional bias to food, and also reduced diet failure rates and BMI in the follow-up assessment (Bazzaz et al., 2017). Therefore, further utilization of methods of reducing attentional bias may be beneficial in preventing impulsive eating.
Mastication/chewing could be one factor that increases satiation and reduces food intake (Hetherington and Boyland, 2007; Hetherington and Regan, 2011; Li et al., 2011; Swoboda and Temple, 2013; Miquel-Kergoat et al., 2015). Several studies have reported appetite reduction by sham feeding (i.e., food is chewed but not eaten) (Wijlens et al., 2012) and gum-chewing (also a type of sham feeding) (Schuster et al., 2006; Xu et al., 2015; Lee et al., 2016). Such chewing stimulation includes motor activities of the jaws, saliva secretion, and intra- and extra-oral somatosensory stimulation. In a systematic review of the effects of chewing on appetite using the meta-analysis approach, some studies reported that chewing stimulation could reduce subjective appetite and influence the metabolic appetite regulation system, including secretion of gut hormones (Li et al., 2011; Zhu et al., 2013; Miquel-Kergoat et al., 2015; Xu et al., 2015). Recent evidence also supports the idea that metabolic signals exert effects on the motivation to obtain food through the regulation of mesolimbic dopamine signaling, i.e., reward circuits (Lutter and Nestler, 2009; Skibicka, 2013). Therefore, chewing stimulation presumably affects not only metabolic signals but also reward circuits, and in turn reduces attentional bias to food. However, to our knowledge there are no studies that investigate the effect of chewing on attentional bias to food.
Therefore, the aim of the present study is to verify whether chewing stimulation reduces attentional bias to food, which reflects the reward pathway, in normal-weight participants. In Experiment 1, as a preliminary investigation of whether chewing affects attentional bias to food, we measured RT in a VPT, which is an index of attentional bias. In Experiment 2, we used ET as the method for accurately assessing changes in gaze direction (index of initial visual attention bias) and gaze duration (index of maintained visual attention bias). Furthermore, we investigated whether chewing stimulation by itself, even in the absence of taste, odor or ingestion showed similar effects to the actual feeding condition on subjective appetite and attentional bias to food. In addition, we conducted a control study to determine the baseline condition in which participants did not perform sham feeding with gum-chewing/actual feeding between tasks.
Materials and Methods
Participants
Participants in Experiment 1 (11 males and 10 females, mean age = 25.9 ± 4.7) completed the VPT, and participants in Experiment 2 (16 males and 12 females, mean age = 25.7 ± 3.1) were subjected to ET. Eight participants in Experiment 2 were excluded because they had unusable eye-tracking data, or their proportion of acquired samples was less than 60% (Graham et al., 2011). The proportion of acquired samples of the participants in Experiment 2 is shown in Supplementary Table S1. The final sample in Experiment 2 comprised 20 participants (13 males and 7 females, mean age = 25.8 ± 2.9). Differences in the characteristics of participants between Experiments 1 and 2 were examined using a Mann–Whitney U test (α = 0.05). No significant differences were found in terms of age, weight, or BMI.
The control groups of Experiment 1 (12 males and 9 females, mean age = 29.0 ± 3.6) and Experiment 2 (11 males and 12 females, mean age = 29.5 ± 5.1) were subjected to identical tasks to Experiments 1 and 2, but the participants did not perform sham feeding with gum-chewing/actual feeding between tasks and they took a rest. Three participants in the Experiment 2 control group were excluded because of unusable eye-tracking data, and the final sample in the Experiment 2 control group comprised 20 participants (10 males and 10 females, mean age = 29.9 ± 5.3). No significant differences were found in terms of age, weight, or BMI between Experiment 1 and Experiment 2 control group.
All participants fulfilled the following criteria, as screened by a questionnaire: (i) no history of metabolic, neurological, or psychiatric diseases, nor any eating disorders; (ii) no use of any medication; (iii) no current or recent efforts to lose weight; (iv) not pregnant; and (v) BMI < 25 kg/m2. The participants received a description of the experimental procedure, but were not informed about the purpose of this study. All procedures in this study complied with the Code of Ethics of the World Medical Association (Declaration of Helsinki) and the standards established by the Institutional Ethical Review Board of Tokyo Medical and Dental University (approval #D2014-063). All participants provided their written informed consent prior to inclusion. A power analysis was conducted by G∗Power Version 3.1 (Heinrich-Heine-Universität, Düsseldorf, Germany) to justify the sample size with effect size f = 0.4 (η2 = 0.14, referring to the previous study by Castellanos et al., 2009), α = 0.05, and 1 - β = 0.8.
Further details regarding trials are provided in the Supplementary Information.
Study Design
The overview of the study is shown in Supplementary Figure S1. In Experiment 1, a VPT and subjective ratings of appetite, using visual analog scales (VASs), were conducted. In Experiment 2, ET (with VPT) and VAS ratings were conducted. Participants in the two experiments attended on two separate days: one was a sham-feeding day with a gum-chewing session, and the other was an actual feeding session. The order of the sessions was counterbalanced across the participants. In both sessions, the relevant measures were performed twice: once before and once after either chewing gum (sham feeding condition) or ingesting a standardized meal (actual feeding condition). In addition, subjective appetite was rated four times in each session using VAS: before the first VPT or ET (T1); before sham feeding or actual feeding (T2); after sham feeding or actual feeding (T3); and after the second VPT or ET (T4). In both experiments, the participants started chewing gum or ingesting a meal immediately after finishing VAS of T2. Five minutes after T2, participants started completing VAS of T3.
In the sham feeding session, participants were instructed to chew an odorless and tasteless gum base (LOTTE Co., Ltd., Tokyo, Japan) for 5 min to remove any effect other than chewing stimulation. Each participant chewed gum in time with a metronome set at 100 beats/min. In the actual feeding session, participants ingested a fruit-flavored energy supplement (CalorieMate®, Otsuka Pharmaceutical Co., Ltd., Tokyo, Japan; 200 kcal/40 g) until they felt satiated. Participants were instructed in advance to fast for at least 10 h before the experiment to create conditions of hunger. They undertook the experiment between 8:00 a.m. and 11:30 a.m., and the average fasting time was 12.4 ± 1.6 h.
Image Selection
We conducted preliminary experiments to select the stimulus images. In the pre-experiment, 60 images, portraying various types of appetizing high-calorie foods (e.g., pizza, hamburgers, and steaks), were selected from the Internet. These images were rated by a group of 20 individuals (9 males and 11 females, mean age = 23.8 ± 1.54) for valence (level of pleasantness or unpleasantness), arousal (from calm to excited), and the subjective feeling of appetite. Individuals from the pre-experiment were not included in the main study. The ratings of valence and arousal were made with the Self-Assessment Manikin system (Lang et al., 2008), and the ratings of the subjective feeling of appetite were made on a 5-point scale. For valence, 1 represented “unpleasant” and 5 represented “extremely pleasant.” For arousal, 1 represented “calm” and 5 represented “excited.” Concerning the ratings of appetite, 1 denoted “This food is not appetizing for me; I would not like to eat this.” and 5 denoted “This food is very appetizing; I would really like to eat this food.” Sixty non-food images (e.g., tools and furniture) were selected for the target trials from the International Affective Picture System (IAPS) (Lang et al., 2008), which is designed to provide a standardized set of pictures with ratings on the dimensions of valence and arousal. In addition, 80 images of non-food contents (e.g., street scenes and nature scenes) were selected for filler trials from the IAPS, and were interspersed with target trials to vary the task and reduce monotony.
Regarding the target trials, the 60 food images were divided into four sets. Similarly, the 60 non-food images for the target trials and 80 non-food images for the filler trials were also divided into four sets. The mean ratings of the sets for each stimulus type (food, non-food, filler) on each rating (valence, arousal, appetite) are shown in Supplementary Table S2. Within each set, 15 pairs of food and non-food images were matched as closely as possible with regard to color, complexity, and size. For the filler trials, 10 image pairs were made in the same way. Four sets of visual stimuli were allocated to each of four VPT or ET sessions, and stimulus sets were counterbalanced across participants.
Tasks
Appetite Ratings
The ratings of the subjective feeling of appetite were made using four 100-mm VASs (Zhu et al., 2013). Participants were presented with a series of questions: (i) How hungry do you feel right now?; (ii) How full do you feel right now?; (iii) How preoccupied with food are you right now?; and (iv) “How strong is your desire to eat right now?” The VASs were anchored by diametrically opposed statements at each end (e.g., not hungry at all; as hungry as I have ever felt). Participants were instructed to draw a vertical line on the scale at the position that reflected the current strength of their feeling of appetite.
Visual Probe Task
In Experiment 1, following published studies using the VPT, we used an image presentation duration of 500 ms (Mogg et al., 1998; Field and Cox, 2008; Nijs et al., 2010).
The VPT included 100 experimental trials: 60 target trials and 40 filler trials. Each trial commenced with a central fixation cross for 1,000 ms, followed by a pair of images for 500 ms (Figure 1). Each food–non-food image pair was presented four times, with each food image appearing equally often on the left side and the right side. Immediately after the image pair disappeared, a dot probe appeared at the location of one of the images. The position of the probe was equally distributed between food and non-food images and the left and right sides of the screen. The dot probe remained until the participant responded. Participants were instructed to look at the fixation cross at the start of each trial and to respond to the probe by pressing either the right or left button on a response box as quickly and accurately as possible. In general, RT to the probe provides an index of attention to the image; for example, if participants are attending to the food image, their RT should be faster to a probe that replaces the food image than to one that replaces the non-food image (Castellanos et al., 2009). The order of the images was randomized for each participant.
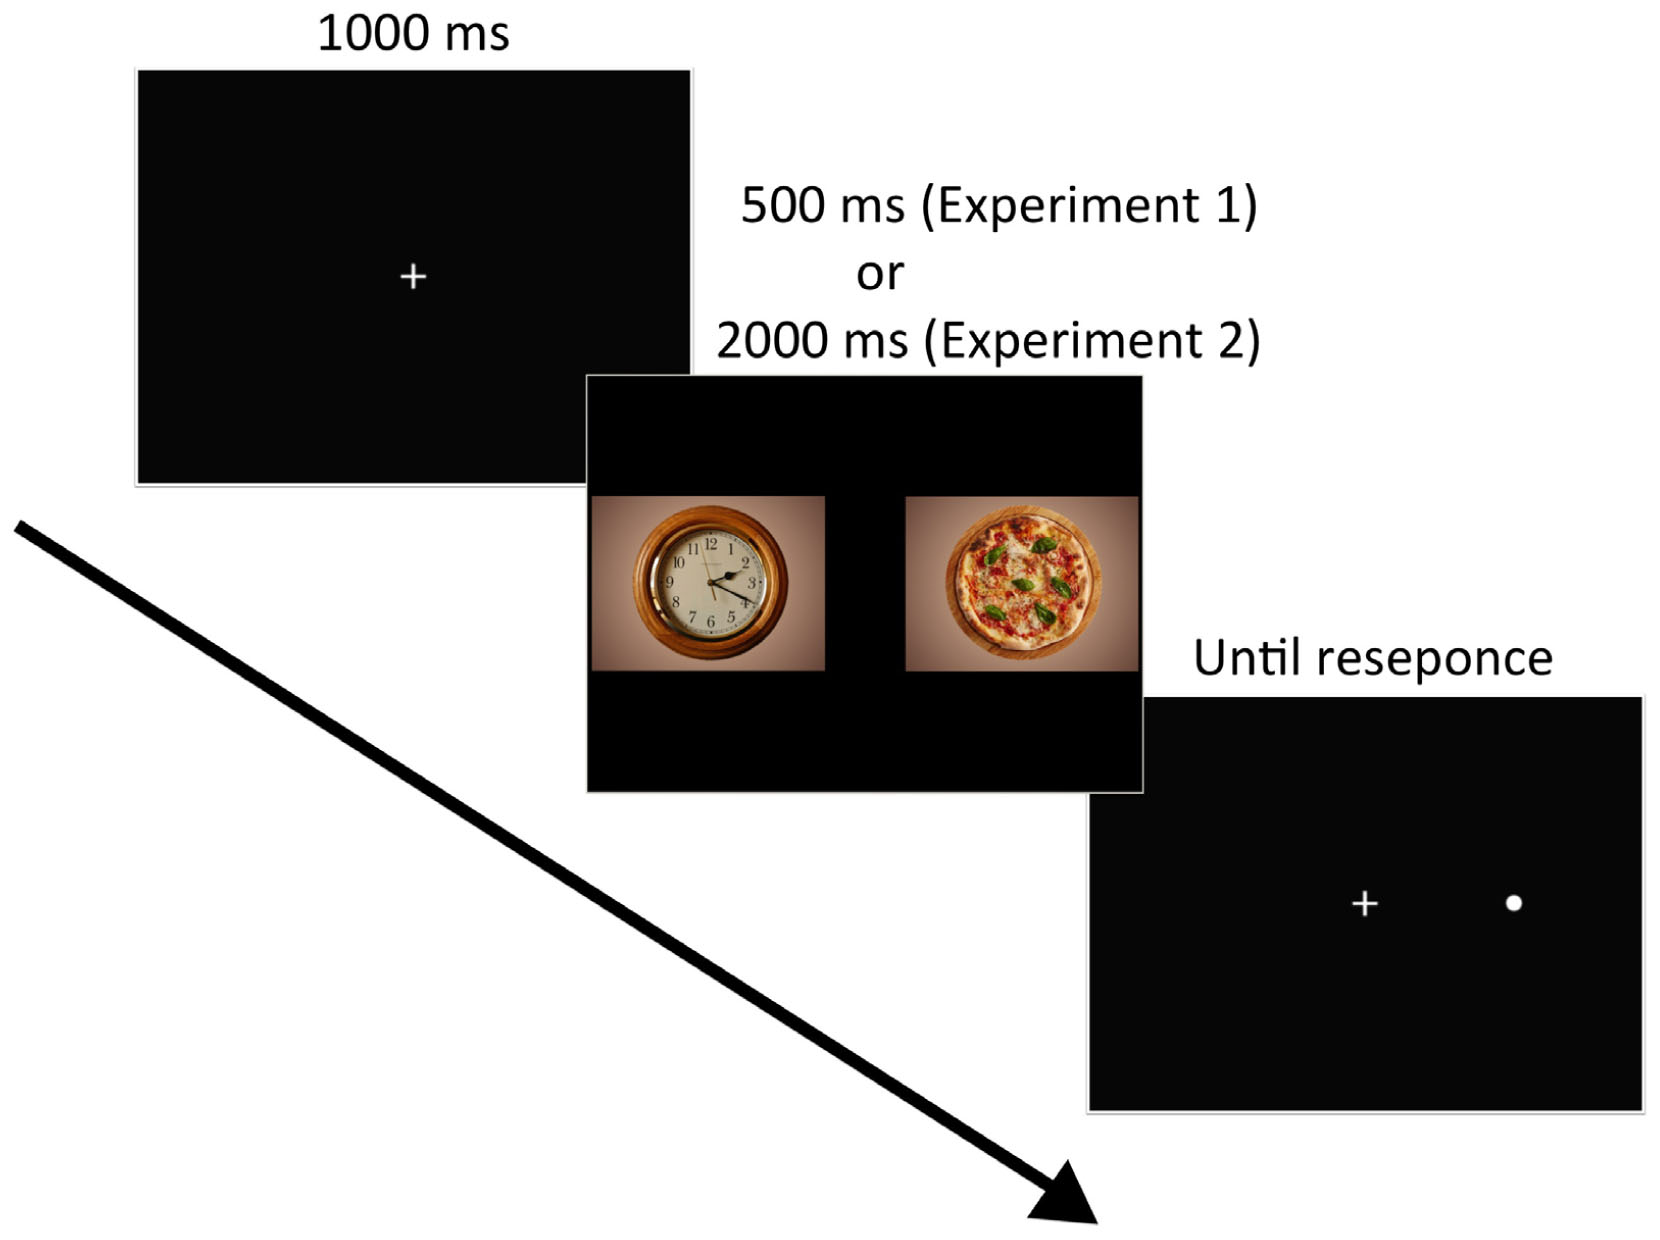
FIGURE 1. Example of trial events. Each trial displayed the fixation cross (1,000 ms) followed by the paired images (500 ms or 2,000 ms) and the probe, which remained until a response occurred. Image source: https://pixabay.com/en/clock-wall-clock-clock-face-pointer-2634551/ (left image in the middle), https://pixabay.com/en/pizza-food-italy-3000285/ (right image in the middle). License: CC Public Domain.
Reaction time bias scores were calculated by subtracting the mean RTs of the food-relevant trials in which probe replaced food image (RT food) from the mean RTs of the non-food-relevant trials in which probe replaced non-food image (RT non-food). Positive values signified attentional bias toward the food images, and negative values signified attentional bias toward the non-food images (Mogg et al., 1998; Castellanos et al., 2009).
Eye-Tracking
Eye-tracking was conducted including the VPT for participants of Experiment 2 to measure aspects of attention more accurately. Following published studies using ET, we presented the images for 2,000 ms (Castellanos et al., 2009; Nijs et al., 2010; Doolan et al., 2014). The data were recorded with a Tobii X60 apparatus (Tobii Technology, Inc., Pittsburgh, PA, United States) comprising a table-mounted camera positioned below the monitor and a system that utilized near-infrared pupil-center/corneal-reflection ET (Weigle and Banks, 2008). The ET data were sampled every 16.7 ms (60 Hz). Prior to beginning ET, participants’ eye movements were calibrated using a 9-point calibration procedure (Doolan et al., 2014).
We calculated gaze direction bias scores and gaze duration bias scores (Castellanos et al., 2009; Nijs et al., 2010; Doolan et al., 2014). Gaze direction bias is an index of initial attentional orientation to a food image (Castellanos et al., 2009). It was calculated as the proportion of the number of trials in which the first fixation was directed to a food image out of the number of all trials in which the fixation was directed toward either the food or non-food image. Gaze duration bias is an index of maintained attention to food (Castellanos et al., 2009). It was calculated as the average proportion of gaze duration toward a food image out of the average total gaze duration toward all images (food and non-food). The fixations that occurred outside of the image pairs (e.g., on a blank screen or not on the screen) were excluded from the data analysis.
Control Study
Additionally, we conducted a control study to determine the baseline condition in which the same number of participants performed the identical tasks to Experiments 1 and 2, but the participants did not perform sham feeding with gum-chewing/actual feeding between tasks and they took a rest. The data for the control study was collected with different participants to Experiments 1 and 2.
Data Analysis
The subjective appetite ratings (VAS scores) were standardized as a z-score for each participant to allow for variations among participants. The appetite ratings were focused mainly on changes in T2 and T3, immediately before and after the intervention. However, the appetite ratings of T1 (before the first VPT or ET) and T4 (after the second VPT or ET) were also evaluated because visual food stimuli during VPT or ET might have changed the appetite ratings. For statistical analysis, 4 (time: T1–T4) × 2 (condition: sham feeding vs. actual feeding) two-way repeated measures ANOVAs and post hoc Ryan’s tests were conducted to compare participants’ appetite levels.
For the RTs on the target trials in the VPTs, incorrect responses, RTs of less than 200 ms or greater than 1,500 ms, and RTs greater than 2 SDs above each participant’s mean were excluded from analysis (Mogg et al., 1998; Castellanos et al., 2009; Nijs et al., 2010). For statistical analysis of VPT, 2 (time: before vs. after sham feeding/actual feeding) × 2 (condition: sham feeding vs. actual feeding) two-way repeated measure ANOVA were used.
With regard to ET, gaze fixations from the target trials were analyzed using the Tobii Studio software (Tobii Technology, Inc., Pittsburgh, PA, United States). Gaze fixations were defined as saccades that remained within either the food image or the non-food image for ≥100 ms and that were initiated at least 100 ms after image onset. Because eye movements occurring within 100 ms after image onset were considered to reflect anticipatory eye movement, we did not include these data in the analysis (Castellanos et al., 2009; Doolan et al., 2014). For statistical analysis of ET, 2 (time: before vs. after sham feeding/actual feeding) × 2 (condition: sham feeding vs. actual feeding) two-way repeated measure ANOVA were used.
For the control study, each VAS scores or attentional bias scores from VPT and ET were compared among time points using one-way repeated ANOVA followed by Ryan’s tests.
All statistical analyses were conducted with a significance level of 0.05. Effect size was calculated using the following formula:
where dfA and dfE are the degrees of freedom for between A groups and errors, respectively, the FA value being the one for the A effect (Cohen, 1973; Suzukawa and Toyoda, 2012).
where t and df represent t-test value and degrees of freedom, respectively (Schulze, 2004).
An additional Bayesian analysis was conducted using JASP software (The JASP Team, Amsterdam, 2017; Version 0.8.5). We ran within-subject Bayesian paired t-tests to compare between T2 vs. T3 for appetite ratings, and to compare between before vs. after sham feeding, actual feeding, and resting conditions for RT bias scores, as well as gaze direction and gaze duration bias scores. Moreover, we calculated the difference between before and after task scores for the RT bias (Experiments 1 and 2), gaze direction bias, and gaze duration bias, and ran within-subject Bayesian paired t-tests to compare the sham feeding and actual feeding conditions. The data were not analyzed to compare the sham/actual feeding vs. control conditions because they were collected at different times with different participants, and these studies were not powered to examine between-subjects differences. To examine relationships between appetite ratings (the difference between T2 and T3 in ratings of hunger, fullness, preoccupation with food, and desire to eat) and attentional bias (the difference between before and after in RT bias, gaze direction bias, and gaze duration bias), Pearson correlations were computed. The pearson’s correlation coefficient between subjective appetite and attentional bias scores are shown in Supplementary Table S3 (see Supporting Information).
Results
Experiment 1
Appetite Ratings
Figure 2A illustrates the mean standardized scores of subjective appetite from Experiment 1. In all appetite ratings, significant main effects of time and condition, and a significant interaction were observed (p < 0.001, Table 1).
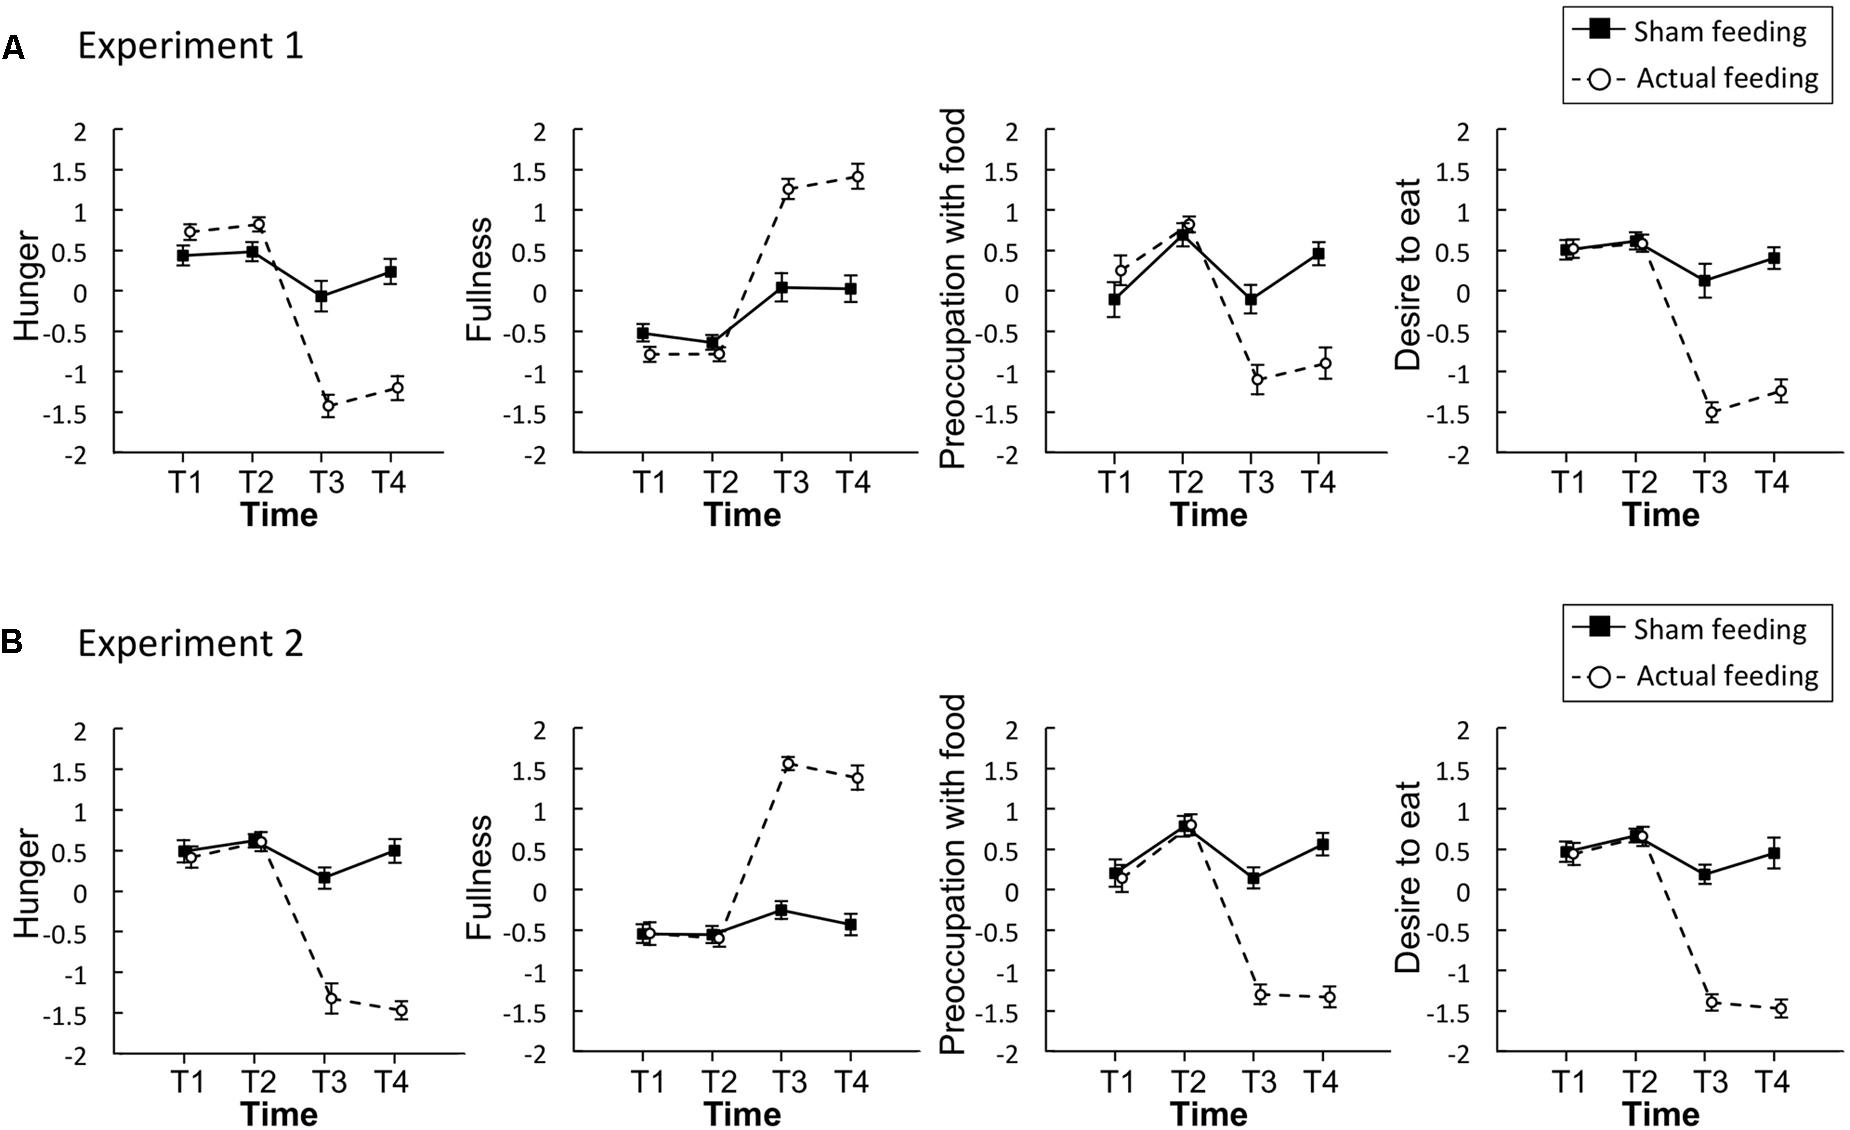
FIGURE 2. Time series of the standardized visual analog scales (VASs) for appetite ratings of hunger, fullness, preoccupation with food, and desire to eat in Experiment 1 (A) and 2 (B). Solid lines represent sham feeding with gum-chewing sessions, and dashed lines represent actual feeding sessions. Error bars represent the standard error of the mean. T1, before the first visual probe tasks (VPT) or eye-tracking (ET); T2, before sham feeding or actual feeding; T3, after sham feeding or actual feeding; and T4, after the second VPT or ET.
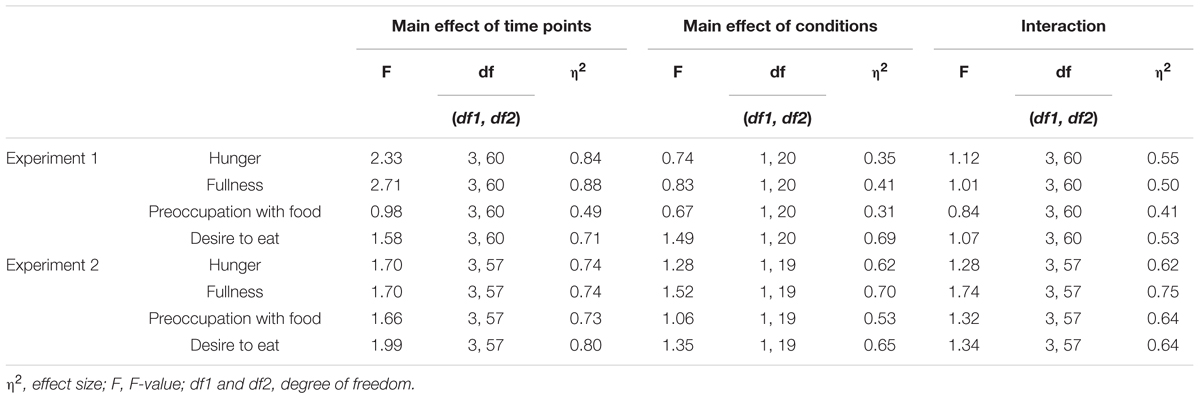
TABLE 1. Results of two-way ANOVA for effects of time and condition on appetite ratings.
In the sham feeding condition, significant simple main effects of time were observed for hunger [F(3,120) = 4.3, p = 0.006, η2 = 0.10], fullness [F(3,120) = 9.4, p < 0.001, η2 = 0.19], and preoccupation with food [F(3,120) = 5.5, p = 0.001, η2 = 0.12]. There was a marginal main effect on desire to eat [F(3,120) = 2.4, p = 0.067, η2 = 0.06]. A post hoc Ryan’s test revealed significant decreases between T2 and T3 in hunger [t(120) = 3.2, p = 0.002, r = 0.28] and preoccupation with food [t(120) = 3.3, p = 0.001, r = 0.29], and a significant increase in fullness [t(120) = 4.1, p < 0.001, r = 0.35] (Table 2).
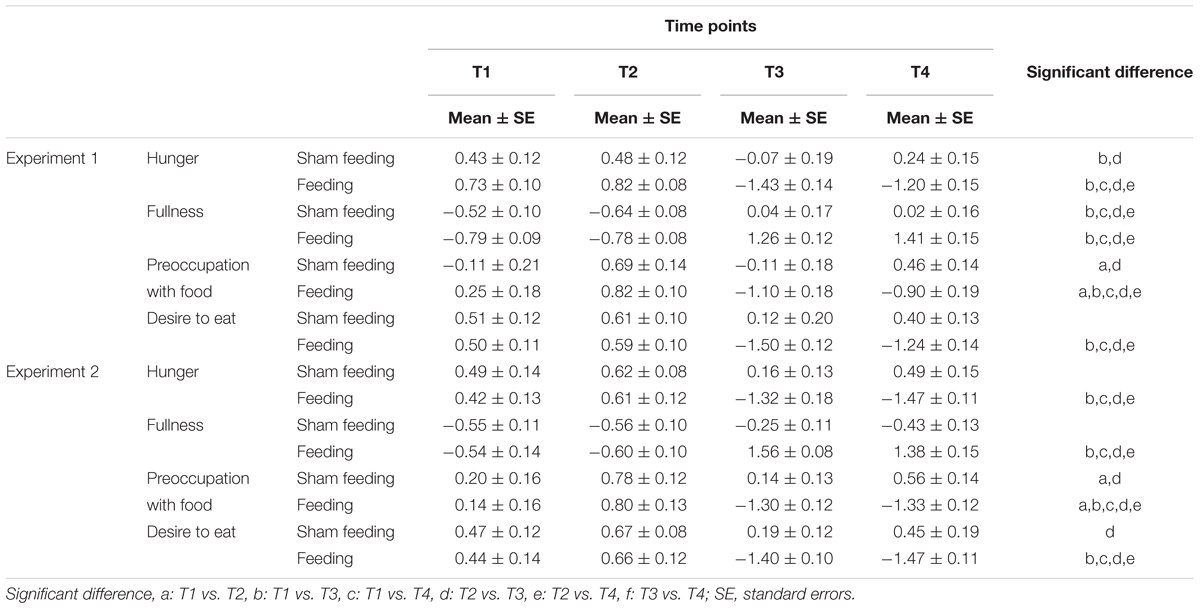
TABLE 2. Mean standardized appetite ratings (standard errors) as assessed at four points in time during the experiment.
In the actual feeding condition, significant simple main effects of time were observed for hunger [F(3,120) = 100.4, p < 0.001, η2 = 0.72], fullness [F(3,120) = 110.4, p < 0.001, η2 = 0.73], preoccupation with food [F(3,120) = 28.6, p < 0.001, η2 = 0.42], and desire to eat [F(3,120) = 68.4, p < 0.001, η2 = 0.63]. Post hoc Ryan’s tests revealed significant decreases between T2 and T3 in hunger, preoccupation with food, and desire to eat, and a significant increase in fullness (p < 0.001 for all, Table 2).
The Bayes factors of appetite ratings for the comparisons between T2 vs. T3 were presented in Table 3. In the sham feeding condition, the Bayes factors of all appetite ratings support the alternative hypothesis; fullness and preoccupation with food support strong evidence, hunger supports moderate evidence, and desire to eat supports anecdotal evidence for alternative hypothesis. In the actual feeding condition, the Bayes factors of all appetite ratings support extreme evidence for alternative hypothesis (Schönbrodt and Wagenmakers, 2017). In Experiments 2, 8 participants were excluded due to a lack of sufficient ET data. We removed these data from all the tasks to match the sample numbers among participants. When the data of the 8 excluded participants were included in the visual analog scales (VASs) and VPTs, the results were reported in supporting information (Supplementary Figure S2).
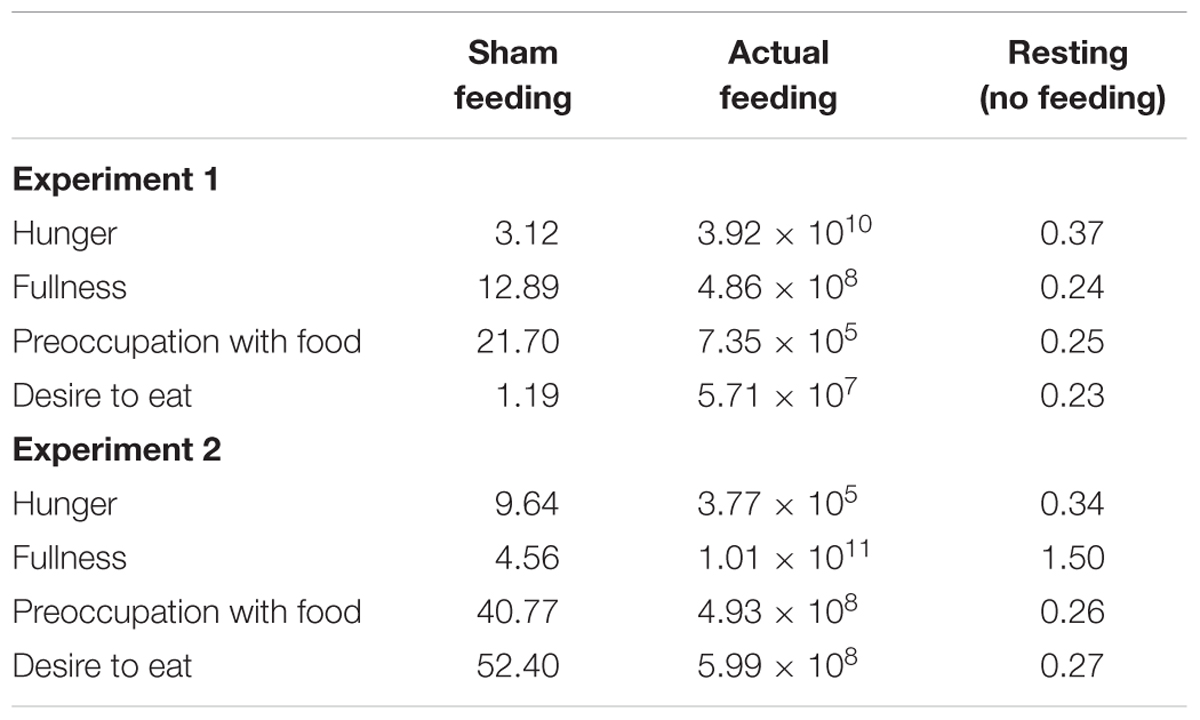
TABLE 3. The Bayes factors of appetite ratings for the comparisons between T2 vs. T3 under the conditions of hunger, fullness, preoccupation with food, and desire to eat.
RT Bias Scores
Figure 3A and Table 4 shows the magnitude of the RT bias in 500 ms trials to food images. For RT bias, there was a significant main effect of time [F(1,20) = 7.3, p = 0.014, η2 = 0.27] but no significant main effect of condition [F(1,20) = 3.2, p = 0.09, η2 = 0.14], nor any interaction between the two factors [F(1,20) = 0.01, p = 0.93, η2 = 0.0003], indicating that sham feeding with gum-chewing reduced RT bias scores as well as the actual feeding condition did.
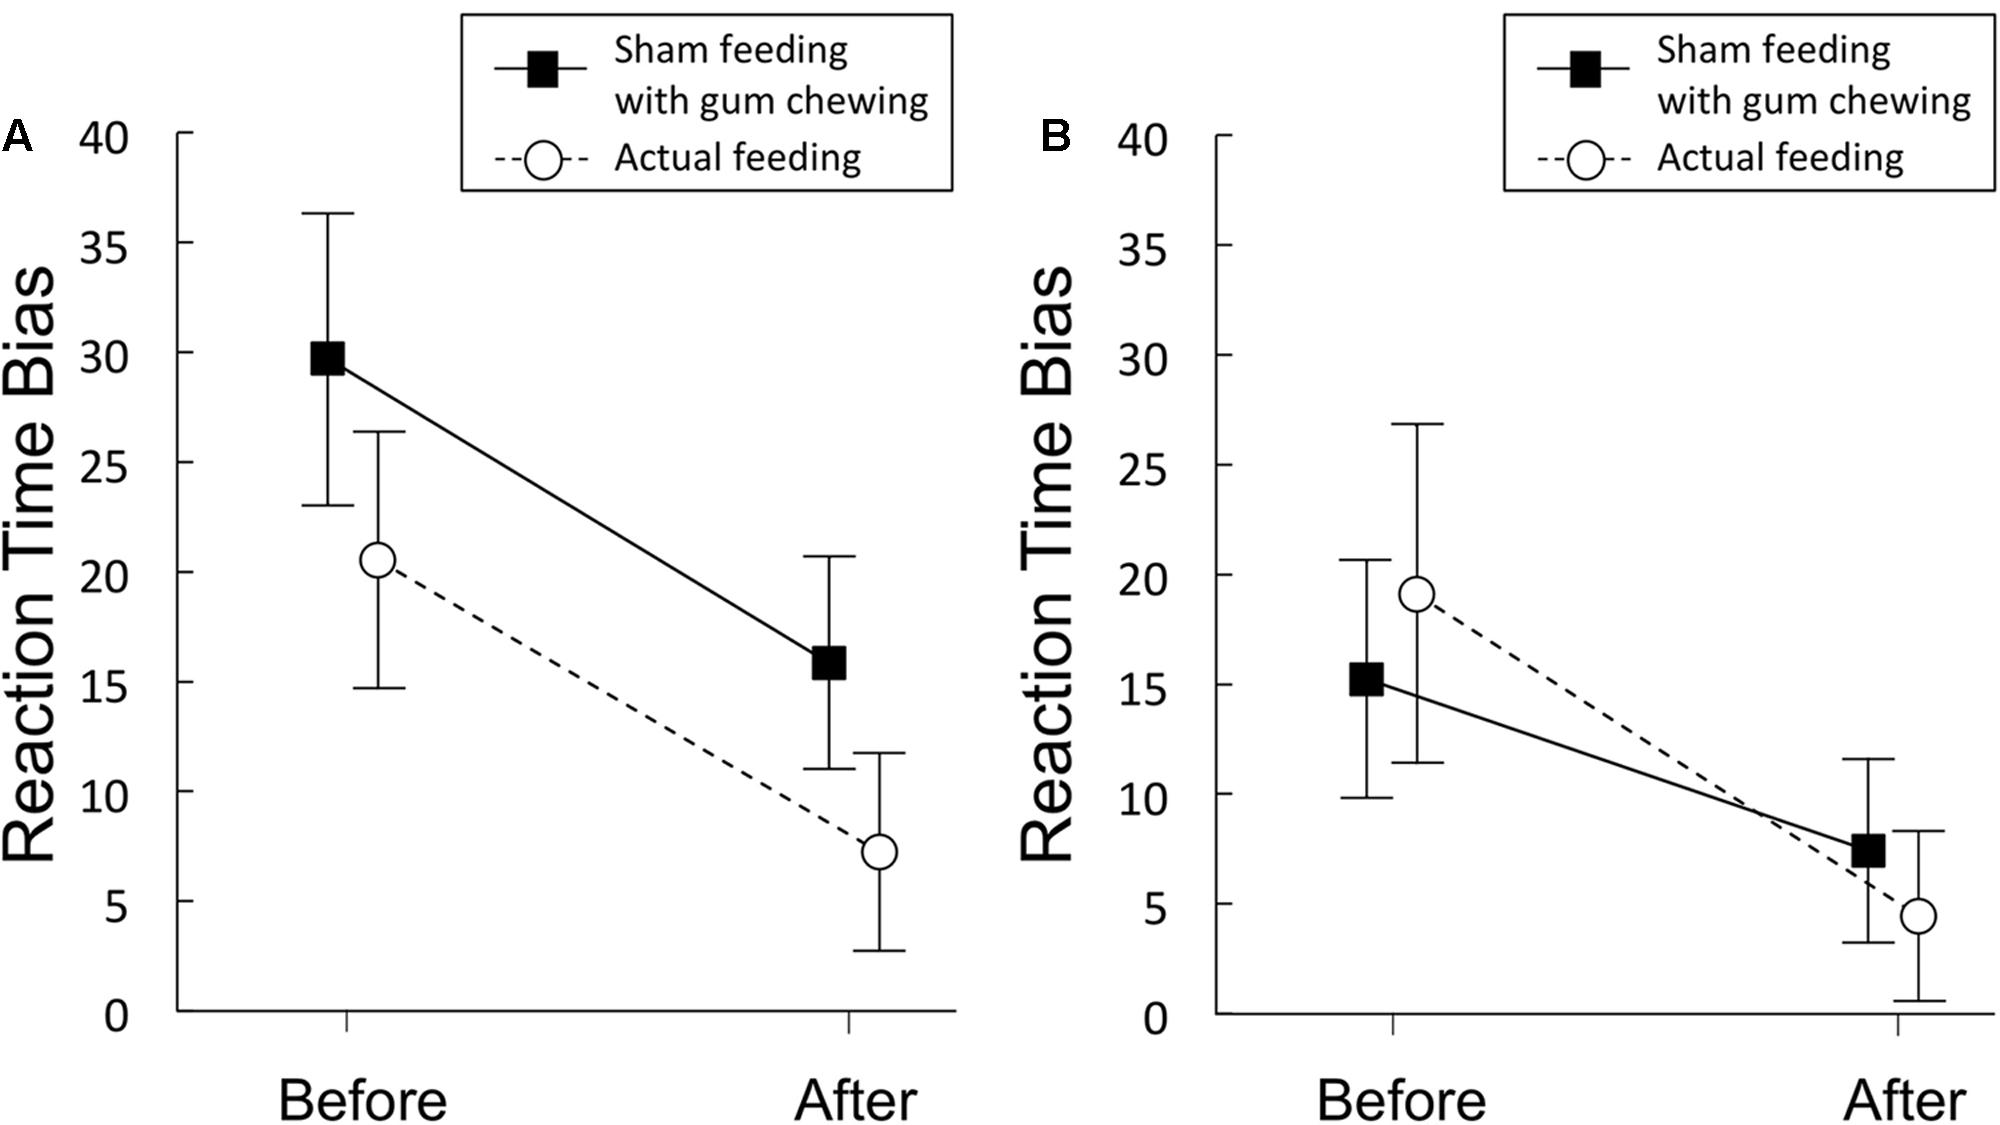
FIGURE 3. Reaction time bias scores (in ms) obtained from the visual probe tasks in Experiment 1 (A) and 2 (B). Solid lines represent sham feeding with gum-chewing sessions, and dashed lines represent actual feeding sessions. The food and non-food images were presented for 500 ms (A) or 2,000 ms (B). Error bars represent the standard error of the mean.
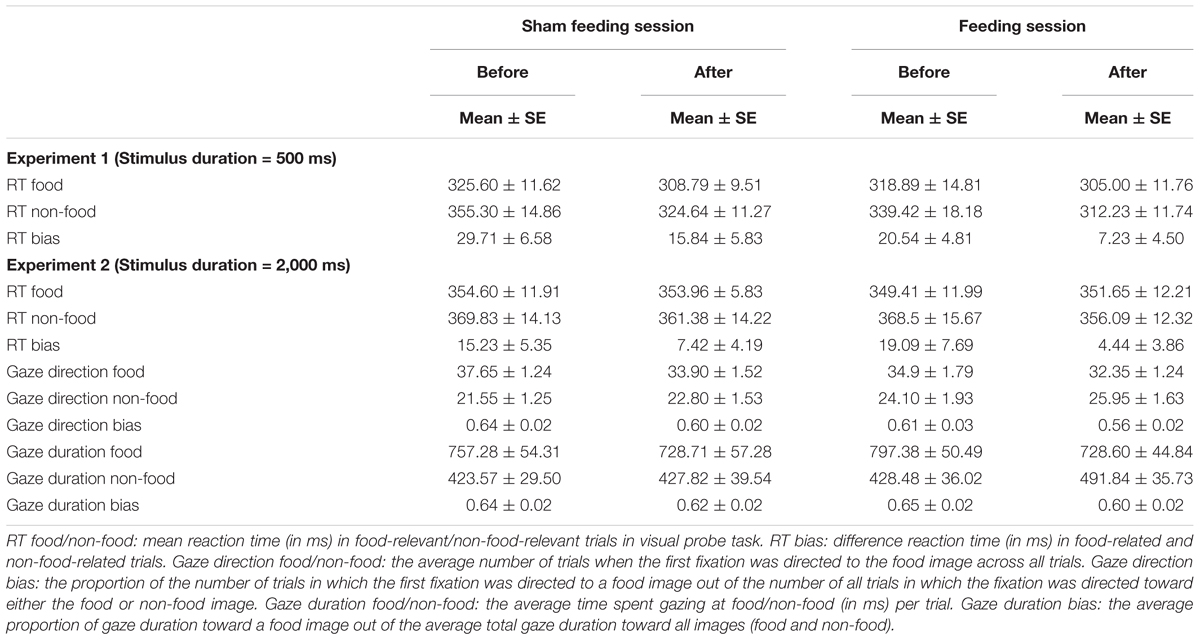
TABLE 4. Mean scores on attention-related measures before and after sham feeding or actual feeding.
The Bayes factors of RT bias in 500 ms trials for the comparisons between before vs. after sham/actual feeding conditions were presented in Table 5. The Bayes factors of sham/actual feeding conditions support anecdotal evidence for alternative hypothesis (Schönbrodt and Wagenmakers, 2017).
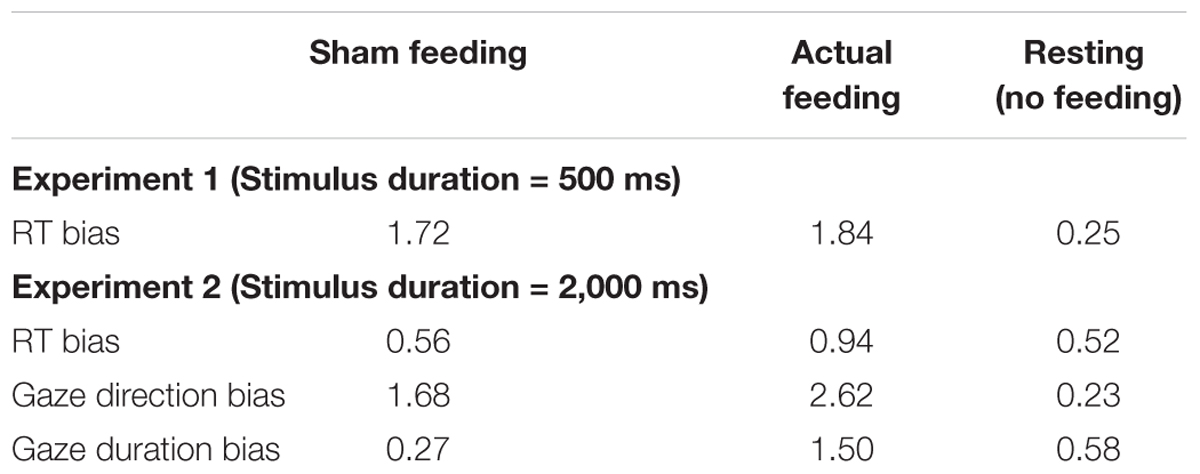
TABLE 5. The Bayes factors of attentional bias scores for the comparisons between before and after sham feeding, actual feeding, and resting conditions.
Concerning the comparison between sham vs. actual feeding conditions, the Bayes factor of RT bias in 500 ms trials was 0.228, suggesting that the Bayes factors support the moderate evidence for null hypothesis (Schönbrodt and Wagenmakers, 2017).
Experiment 2
Appetite Ratings
Figure 2B illustrates the mean standardized scores for subjective appetite in Experiment 2. In all appetite ratings, significant main effects of time and condition, and a significant interaction were observed (p < 0.001, Table 1).
In the sham feeding condition, significant simple main effects of time were observed on preoccupation with food [F(3,114) = 6.5, p < 0.001, η2 = 0.14] and desire to eat [F(3,114) = 2.9, p = 0.004, η2 = 0.07]. There was a marginal simple main effect on hunger [F(3,114) = 2.5, p = 0.059, η2 = 0.06]. Post hoc Ryan’s tests revealed significant decreases between T2 and T3 in preoccupation with food [t(114) = 3.8, p < 0.001, r = 0.34] and desire to eat [t(114) = 3.0, p = 0.004, r = 0.27] (Table 2).
In the actual feeding condition, a significant simple main effect of time was observed for hunger [F(3,114) = 82.0, p < 0.001, η2 = 0.68], fullness [F(3,114) = 110.0, p < 0.001, η2 = 0.74], preoccupation with food [F(3,114) = 79.5, p < 0.001, η2 = 0.68], and desire to eat [F(3,114) = 100.7, p < 0.001, η2 = 0.73]. Post hoc Ryan’s tests revealed significant decreases between T2 and T3 in hunger, preoccupation with food, and desire to eat, and a significant increase in fullness (p < 0.001 for all, Table 2).
The Bayes factors of appetite ratings for the comparisons between T2 vs. T3 were presented in Table 3. In the sham feeding condition, the Bayes factors of all appetite ratings support the alternative hypothesis; preoccupation with food and desire to eat support very strong evidence, hunger and fullness support moderate evidence for alternative hypothesis. In the actual feeding condition, the Bayes factors of all appetite ratings support extreme evidence for alternative hypothesis (Schönbrodt and Wagenmakers, 2017).
RT Bias Scores
Figure 3B and Table 4 shows the RT bias scores in 2,000 ms trials obtained from the VPT in Experiment 2. No significant main effects of time [F(1,19) = 3.89, p = 0.06, η2 = 0.17] or condition [F(1,19) = 0.009, p = 0.92, η2 = 0.0005], nor any significant interaction between the two factors [F(1,19) = 0.81, p = 0.38, η2 = 0.04] were observed.
The Bayes factors of RT bias in 2,000 ms trials for the comparisons between before vs. after sham/actual feeding conditions were presented in Table 5. The Bayes factors of sham feeding and actual feeding conditions support anecdotal evidence for null hypothesis (Schönbrodt and Wagenmakers, 2017).
Regarding the comparison between sham vs. actual feeding conditions, the Bayes factor of RT bias in 2,000 ms trials was 0.333, suggesting that the Bayes factor supports moderate evidence for the null hypothesis (Schönbrodt and Wagenmakers, 2017).
Gaze Direction Bias Scores
Gaze direction bias scores are presented in Figure 4A and Table 4. A significant main effect of time was observed [F(1,19) = 12.3, p = 0.002, η2 = 0.39], but no significant main effect of condition [F(1,19) = 2.77, p = 0.11, η2 = 0.13], nor any interaction of the two factors [F(1,19) = 0.27, p = 0.61, η2 = 0.014] emerged, indicating that sham feeding with gum-chewing reduced gaze direction bias as well as the actual feeding condition did.
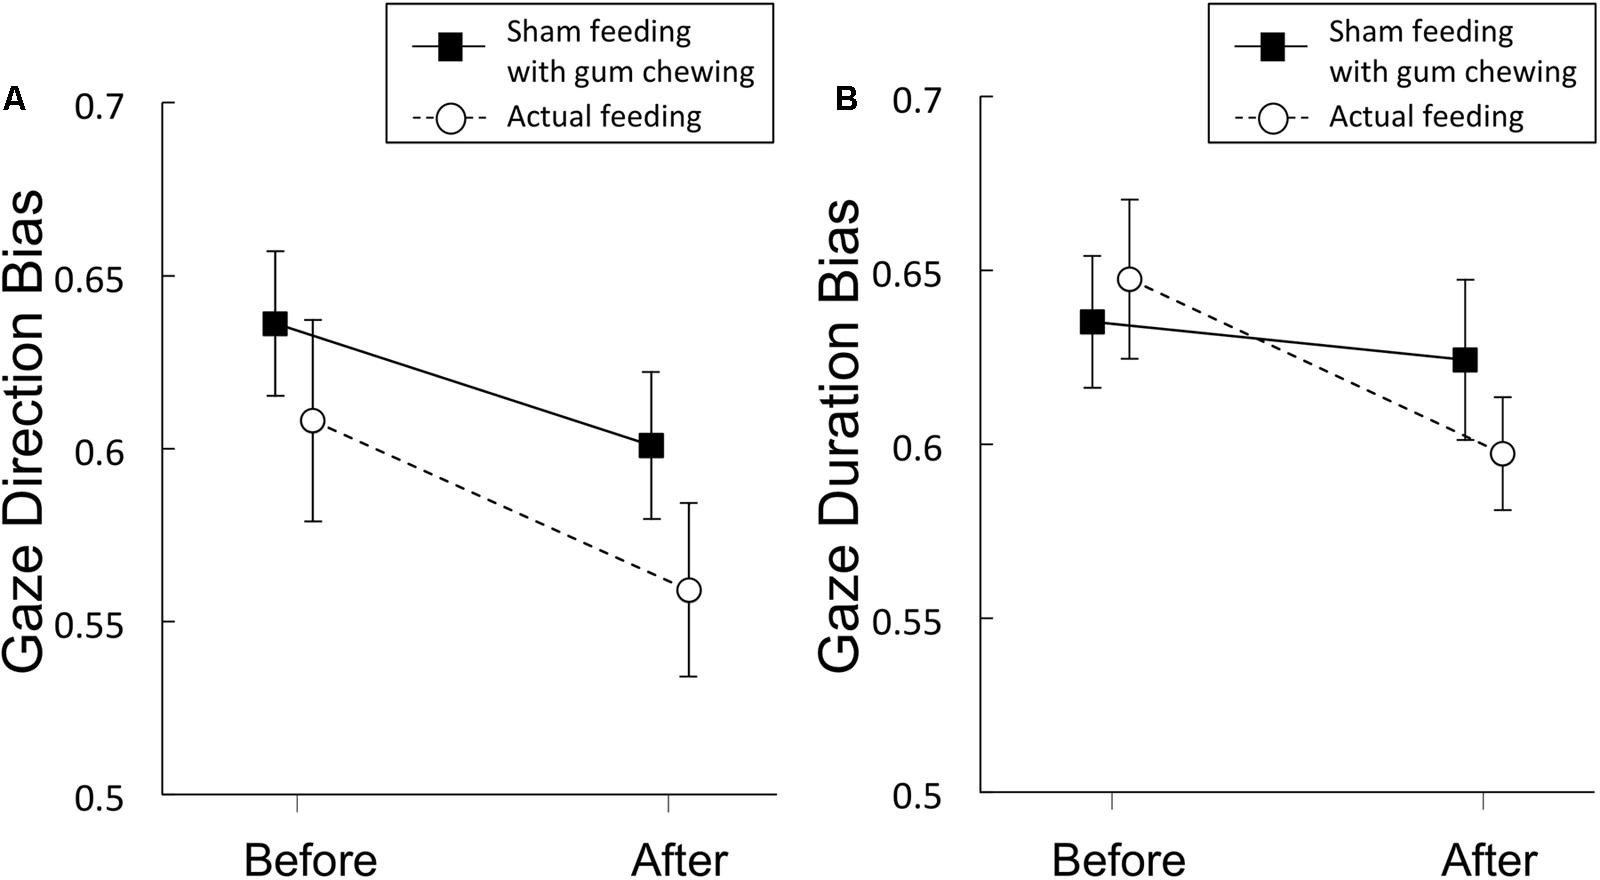
FIGURE 4. Gaze direction bias scores (A) and gaze duration bias scores (B) from Experiment 2. Solid lines represent sham feeding with gum-chewing sessions, and dashed lines represent actual feeding sessions. Error bars represent the standard error of the mean.
The Bayes factors of gaze direction bias for the comparisons between before vs. after sham/actual feeding conditions were presented in Table 5. The Bayes factors of sham feeding and actual feeding conditions support anecdotal evidence for alternative hypothesis (Schönbrodt and Wagenmakers, 2017).
Regarding the comparison between sham vs. actual feeding conditions, the Bayes factor of gaze direction bias was 0.262, suggesting that the Bayes factor supports moderate evidence for the null hypothesis (Schönbrodt and Wagenmakers, 2017).
Gaze Duration Bias Scores
Gaze duration bias scores are presented in Figure 4B and Table 4. Marginally significant interaction were observed [F(1,19) = 3.81, p = 0.07, η2 = 0.17], although no significant main effects of time [F(1,19) = 2.77, p = 0.11, η2 = 0.13] or condition [F(1,19) = 0.231, p = 0.64, η2 = 0.01] were observed.
The Bayes factors of gaze duration bias for the comparisons between before vs. after sham/actual feeding conditions were presented in Table 5. The Bayes factor of sham feeding condition supports moderate evidence for null hypothesis and the Bayes factor of actual feeding condition supports anecdotal evidence for alternative hypothesis (Schönbrodt and Wagenmakers, 2017).
Regarding the comparison between sham vs. actual feeding conditions, the Bayes factor of gaze duration bias was 1.112, suggesting that the Bayes factor supports anecdotal evidence for the alternative hypothesis (Schönbrodt and Wagenmakers, 2017).
Control Study
Appetite Ratings
Figures 5A,B illustrates the mean standardized scores of subjective appetite from the control study for Experiments 1 and 2, respectively. The Bayes factors of appetite ratings for the comparisons between T2 vs. T3 were presented in Table 3.
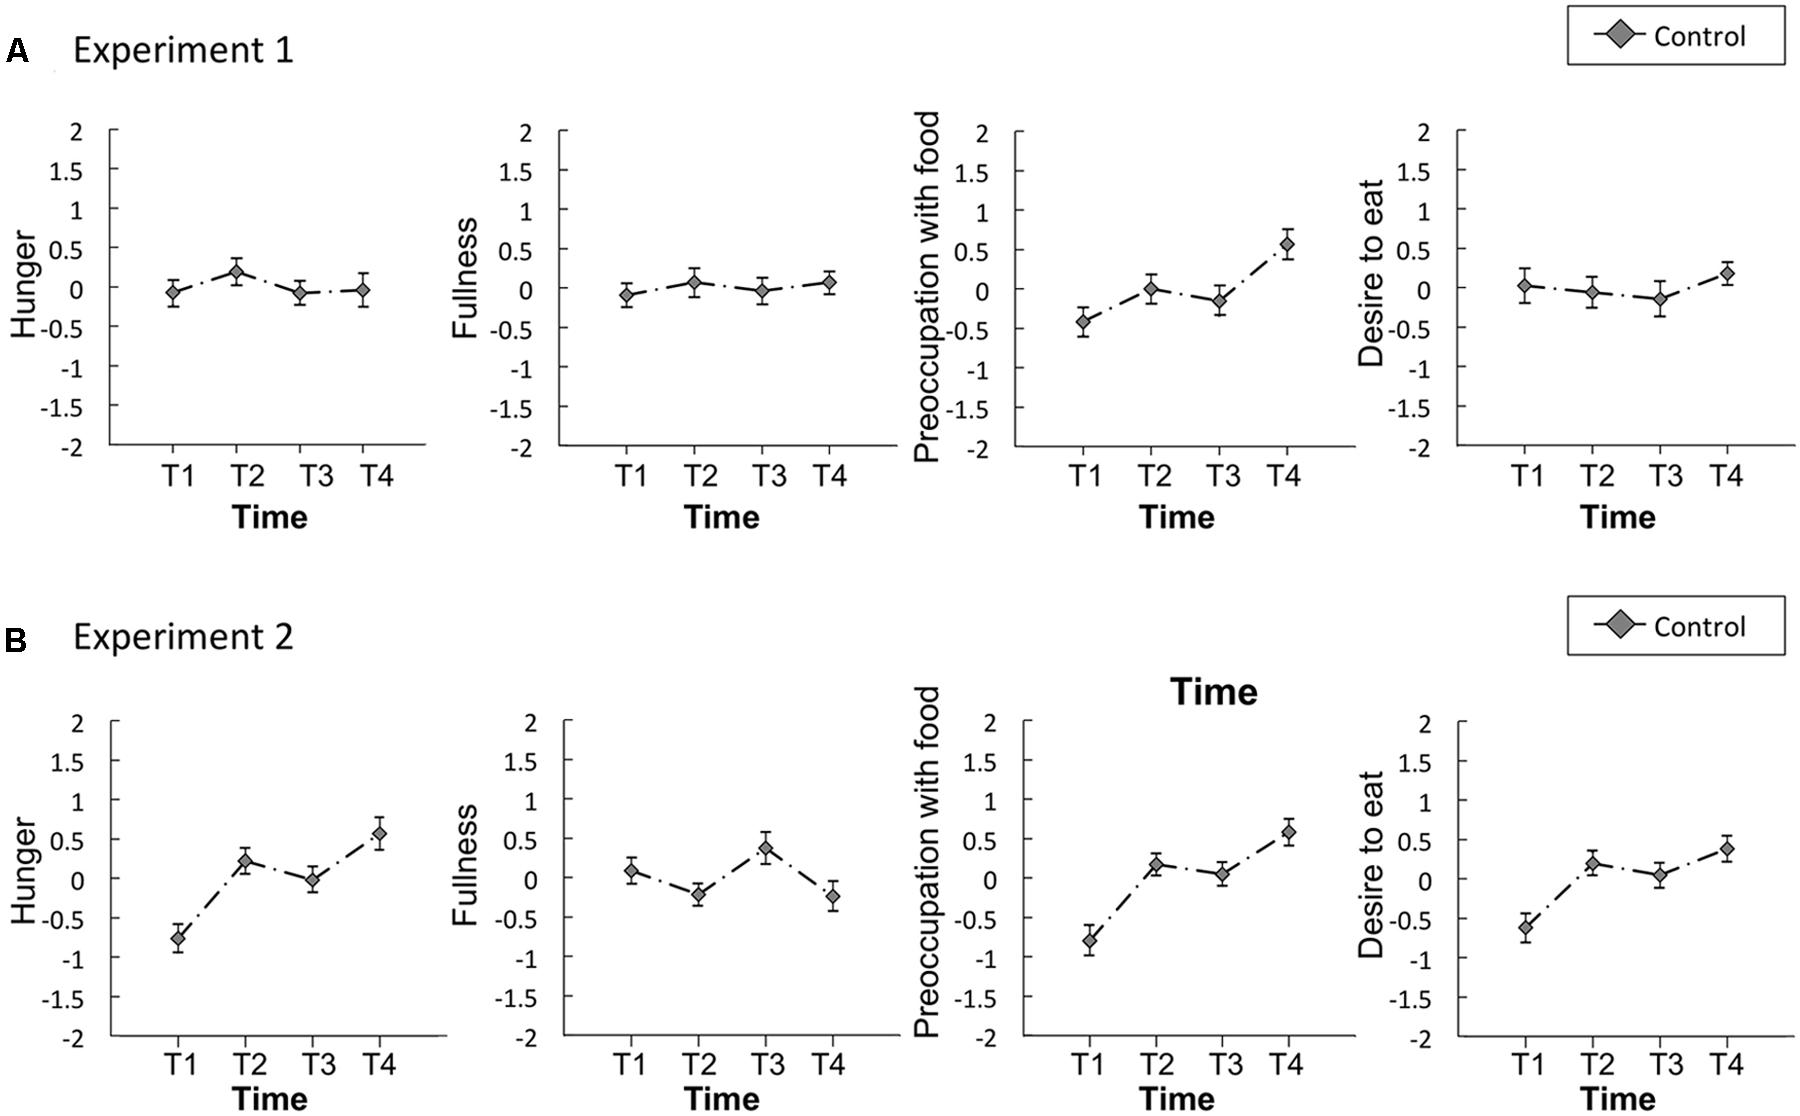
FIGURE 5. Time series of the standardized visual analog scales (VASs) for appetite ratings of hunger, fullness, preoccupation with food, and desire to eat in the control study for Experiments 1 (A) and 2 (B). Error bars represent the standard error of the mean. T1, before the first visual probe tasks (VPT) or eye-tracking (ET); T2, before resting state; T3, after resting state; and T4, after the second VPT or ET.
Regarding the control study for Experiment 1, significant main effects of time were observed for preoccupation with food [F(3,60) = 3.80, p = 0.01, η2 = 0.16]. A post hoc Ryan’s test revealed no significant decreases between T2 and T3 in all appetite ratings. However, there were significant differences between T1 and T4 in preoccupation with food [t(60) = 3.3, p = 0.002, r = 0.39] (Supplementary Table S4). The Bayes factors of all appetite ratings except for hunger support the moderate evidence for the null hypothesis and hunger supports anecdotal evidence for the null hypothesis (Schönbrodt and Wagenmakers, 2017).
Concerning the control study for Experiment 2, significant main effects of time were observed for hunger [F(3,57) = 7.38, p < 0.01, η2 = 0.28], preoccupation with food [F(3,57) = 9.54, p < 0.01, η2 = 0.33], and desire to eat [F(3,57) = 5.34, p < 0.01, η2 = 0.22]. A post hoc Ryan’s test revealed no significant decreases between T2 and T3 in all appetite ratings. However, there were significant differences between T1 and T2 [t(57) = 3.4, p = 0.001, r = 0.40], T1 and T3 [t(57) = 2.5, p = 0.014, r = 0.31], T1 and T4 [t(57) = 4.5, p < 0.001, r = 0.51] in hunger, T1 and T2 [t(57) = 3.7, p < 0.001, r = 0.43], T1 and T3 [t(57) = 3.2, p = 0.002, r = 0.38], T1 and T4 [t(57) = 5.2, p < 0.001, r = 0.56] in preoccupation with food, T1 and T2 [t(57) = 3.1, p = 0.003, r = 0.37], T1 and T3 [t(57) = 2.5, p = 0.015, r = 0.31], T1 and T4 [t(57) = 3.7, p < 0.001, r = 0.44] in desire to eat (Supplementary Table S4). The Bayes factors of all appetite ratings except for fullness support the null hypothesis; preoccupation with food and desire to eat support moderate evidence and hunger support anecdotal evidence for null hypothesis. Only fullness supports anecdotal evidence for the alternative hypothesis (Schönbrodt and Wagenmakers, 2017).
RT Bias Scores
Figures 6A,B shows the RT bias scores obtained from the VPT in the control study for Experiments 1 and 2, respectively. Mean scores are shown in Supplementary Table S5. No significant difference was observed between before and after in the RT bias scores in the control study for Experiments 1 or 2. The Bayes factors of RT bias for the comparisons between before vs. after resting were presented in Table 5. The Bayes factor of RT bias in 500 ms trials supports moderate evidence for null hypothesis and the Bayes factor of RT bias in 2,000 ms trials supports anecdotal evidence for null hypothesis (Schönbrodt and Wagenmakers, 2017).
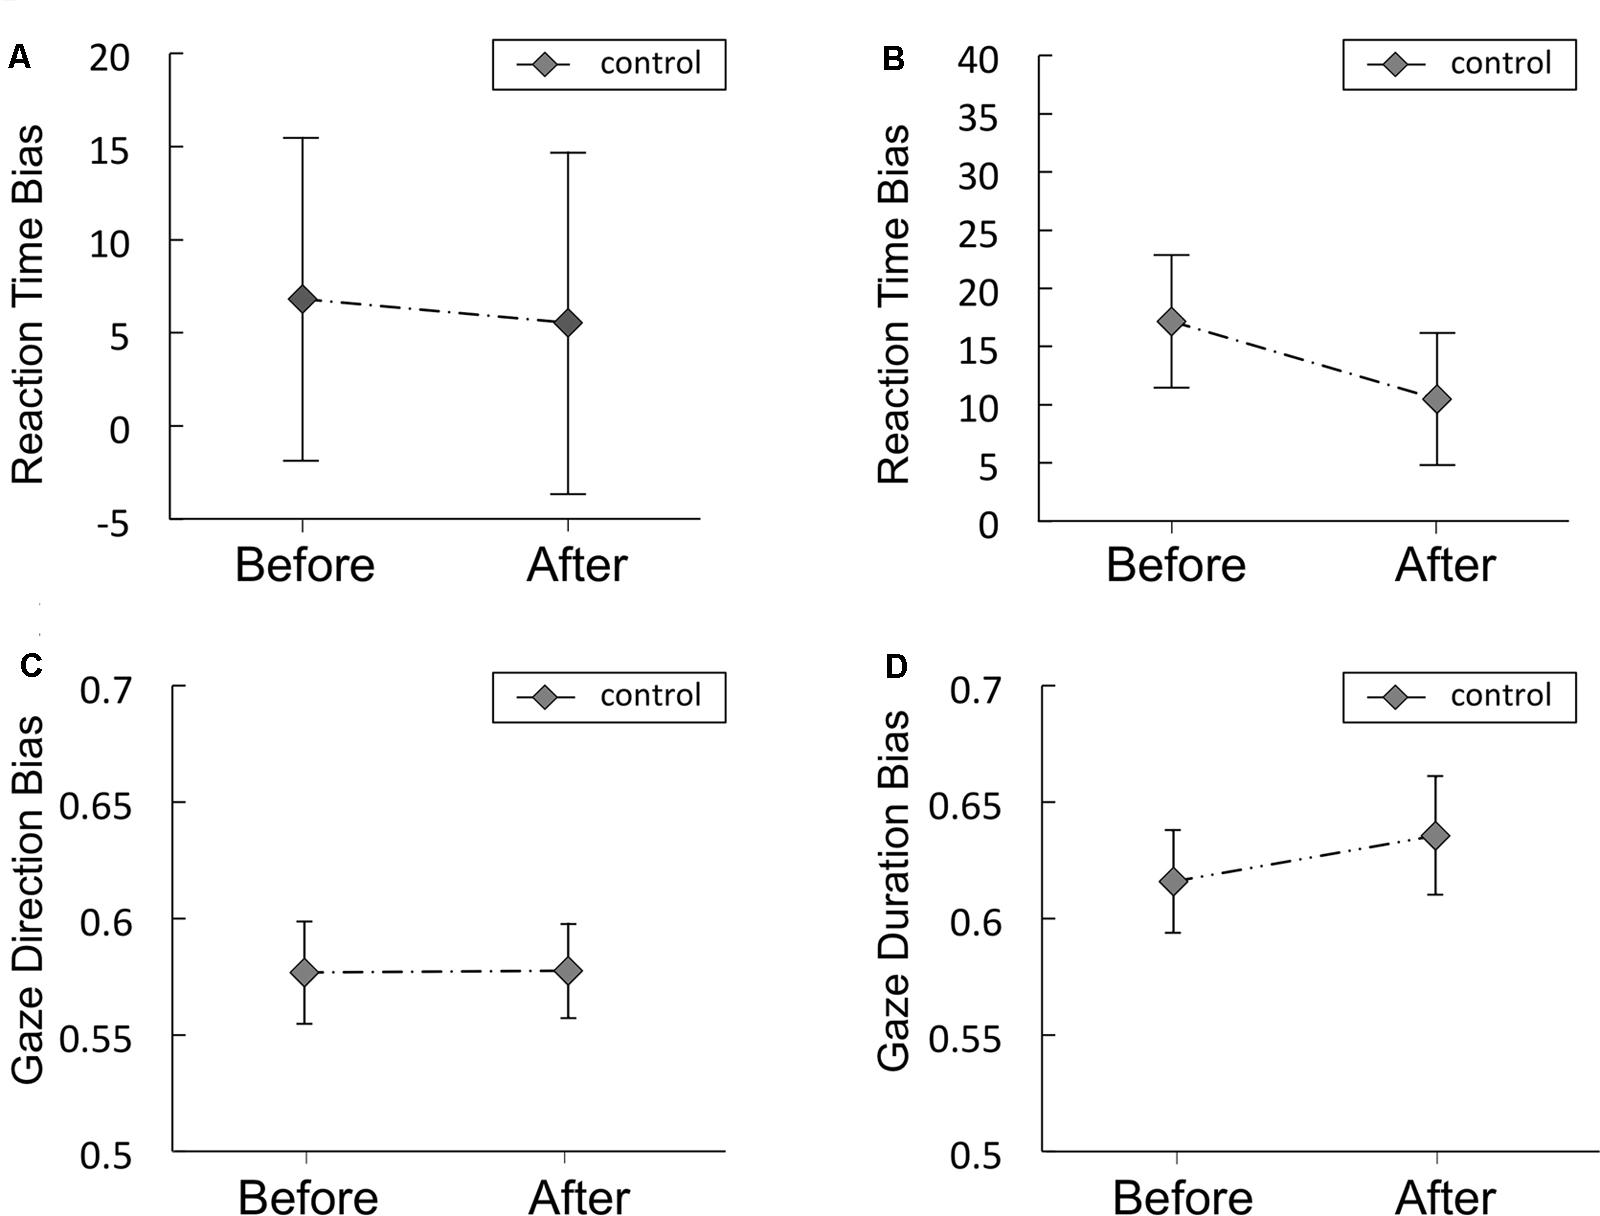
FIGURE 6. Reaction time bias scores (in ms) obtained from the visual probe tasks in the control study for Experiments 1 (A) and 2 (B), Gaze direction bias scores (C) and gaze duration bias scores (D) from Experiment 2. The food and non-food images were presented for 500 ms (A) or 2,000 ms (B). Error bars represent the standard error of the mean.
Gaze Direction and Duration Bias Scores
Gaze direction and duration bias scores in the control study are presented in Figures 6C,D, respectively. Mean scores are shown in Supplementary Table S5. No significant difference was observed between before and after in gaze direction or duration bias scores. The Bayes factors of gaze direction and duration bias for the comparisons between before vs. after resting condition were presented in Table 5. The Bayes factor of gaze direction bias supports moderate evidence for null hypothesis and the Bayes factor of gaze duration bias supports anecdotal evidence for null hypothesis (Schönbrodt and Wagenmakers, 2017).
Discussion
Using VPT and ET, this study investigated that the effects of chewing stimulation on appetite from the perspective of the reward pathway, and compared these effects in a sham feeding (gum-chewing) condition with those in an actual feeding condition.
Subjective appetite ratings in the actual feeding condition showed that hunger, preoccupation with food, and desire to eat were reduced significantly, and fullness increased significantly after feeding (Experiments 1 and 2). Similarly, after sham feeding with gum-chewing, ratings of hunger (Experiment 1), preoccupation with food (Experiments 1 and 2), and desire to eat (Experiment 2) decreased significantly, and fullness increased significantly (Experiment 1). Additionally, hunger ratings in Experiment 2 and desire to eat in Experiment 1 showed marginally significant increases. Thus, a reduction in subjective appetite after chewing calorie free gum, although not as much as in the actual feeding session, suggests that chewing stimulation itself might reduce appetite. These results were supportive of findings from previous studies that chewing sugarless gum increased satiety on VAS (Xu et al., 2015).
In a systematic review of the effects of chewing on appetite using the meta-analysis approach, 15 papers were extracted, six of which were involved in the effect of gum chewing on appetite. Three papers’ results showed significant changes in subjective appetite, but two papers showed no significant changes (Miquel-Kergoat et al., 2015). The possible causes of these inconsistent results are those of chewing being subjective to thresholds (Miquel-Kergoat et al., 2015) in its duration (Shikany et al., 2012), its timing (Julis and Mattes, 2007), number of chews (Mattes and Considine, 2013; Zhu et al., 2013). In this study, even though there was no difference in the sham feeding condition between Experiments 1 and 2, such as duration of chewing, timing, and numbers of chews, different appetite ratings resulted. Perhaps, therefore, individuals may respond differently to the chewing stimulation’s effect on appetite.
Additionally, in Experiments 1 and 2, significantly increased appetite ratings from T1 to T2 were observed only in preoccupation with food, while other appetite ratings were not altered significantly. It is assumed that visual food stimuli during the tasks made participants more preoccupied with food, and it can be said that appetite ratings generally were not increased by visual food stimuli. However, under control conditions, the ratings of not only preoccupation with food, but also hunger and desire to eat, significantly increased from T1 to T2.
Moreover, appetite ratings of hunger, preoccupation with food, and desire to eat all tended to decrease after sham feeding with gum-chewing in both experiments. A previous study had suggested that appetite-related drives to eat – for example, hunger, preoccupation with food, and the desire to eat – were influenced more by physiological, environmental, social, and behavioral factors than by the diet’s energy content and macronutrient composition (Leidy et al., 2011). In addition, feelings of hunger might reflect the desire to eat (Harris et al., 2008), which might then evolve into craving (Pelchat et al., 2004). Conversely, satiety appeared to be less driven by those factors (Leidy et al., 2011). Indeed, it has been reported that increasing gastric distention and the infusion of gastric hormones (e.g., cholecystokinin) increases fullness ratings but does not reliably alter hunger ratings (Melton et al., 1992; Harris et al., 2008). Therefore, ratings of hunger, preoccupation with food, and desire to eat seem to have similar appetite properties that reflect more feelings of craving, whereas fullness may be a different type of indicator. There were no significant changes between T2 and T3 in any of the control conditions, suggesting that chewing stimulation by itself might reduce feelings of craving.
The Bayesian analyses show clear evidence for a difference between T2 vs. T3 appetite ratings for the sham and actual feeding condition, albeit substantially stronger evidence for a difference in the actual condition. Furthermore, there is evidence for no difference across the majority of appetite ratings in the control study. The pattern observed for the sham and actual feeding conditions also replicates across Experiments 1 and 2. Combined, it can be interpreted that the effects of chewing stimulation and actual feeding on appetite ratings are clearly strong effects.
The results of VPT in Experiment 1 demonstrate that RT bias scores are reduced significantly after sham feeding with gum-chewing and after actual feeding; i.e., not only ingesting a meal, but also chewing tasteless, odorless, calorie-free gum reduced attentional bias to food. However, the results of the VPT in Experiment 2 showed no significant main effects and no interaction. It could therefore follow that the use of longer presentation durations, such as 2,000 ms, allows multiple shifts in attention between two adjacent images (Nijs et al., 2010).
It has been suggested that initial attentional orientation could be evaluated with a presentation time of 200 ms or less (Field and Cox, 2008). Whereas, Armstrong and Olatunji (2012) suggested that fixation duration in the first 500 ms provided a valid measure of initial orienting. Thus, interpretation regarding VPT presentation time is inconsistent, and mentioning initial or maintained attention is assumed to be difficult for the present study’s VPT results for image presentation time. In the present study, at least, the result of VPT as a preliminary investigation showed reduced attentional bias after sham feeding with gum-chewing.
The results of ET show a significant reduction in the gaze direction bias score, which is considered to reflect initial attentional orientation (Castellanos et al., 2009), after sham feeding and actual feeding. In contrast, there were no significant main effects in the gaze duration bias score, which is considered to be an index of maintained attention (Castellanos et al., 2009). Therefore, the present study’s results suggest that chewing stimulation, similar to actual feeding, reduces initial attentional orientation to food. Initial attention involves an involuntary, automatic, passive, bottom-up attentional process (Nijs, 2010), suggesting that chewing stimulation – even when it lacks taste, odor, or ingestion – might affect involuntary attention. In addition, it has also been said that salience generally captures initial attention (Sawaki and Luck, 2010). Thus, chewing stimulation may suppress the salience of food stimuli and in this way, potentially prevent cravings for food. Bazzaz et al. (2017) suggested that reducing attentional bias to food through food attention control training might positively impact eating behavior. In our study, attentional bias to food did not completely disappear but significantly decreased after sham feeding and actual feeding, suggesting the possibility of chewing stimulation’s influence on impulsive eating behavior.
The specific disinhibited eating pattern in binge eating disorder (BED) patients has promoted the assumption that BED might represent a phenotype within the obesity spectrum that is characterized by increased impulsivity (Giel et al., 2017). Food-related reward sensitivity and rash-spontaneous behavior, as the two components of impulsivity, are increased in BED (Schag et al., 2013). Moreover, it has been reported that an increased initial attention toward food is related to greater BED symptomatology (Sperling et al., 2017). Thus, reduced initial attention to food stimuli by prompting masticatory activity might be effective against BED.
The hitherto described mechanism of chewing stimulation’s effect on appetite has typically involved two aspects. First, chewing stimulation is a crucial factor in cephalic phase responses, and it may increase the gastric or hormonal release of substances related to appetite, such as pancreatic polypeptide and cholecystokinin (Teff, 2000; Zhu et al., 2013; Veedfald et al., 2016). Second, animal studies have shown that mastication-induced activation of histamine neurons suppresses physical food intake through the H-1 receptor in the hypothalamic paraventricular nucleus and the ventromedial hypothalamus, which together are known as the satiety center (Sakata et al., 2003).
Furthermore, this study led to a new insight into the mechanism of reducing appetite by chewing stimulation: chewing stimulation reduces attentional bias to food, and might affect the reward pathway because the attentional bias to food stimuli could be a behavioral output of the individuals’ reward circuits (Jonker et al., 2016).
No reports have specifically investigated the association between chewing stimulation and the reward circuits; however, some reports support this hypothesis. One previous study demonstrated that the dopamine turnover in the frontal cortex was elevated in mice that were fed a powdered diet (less chewing) compared with those fed a standard diet (control) (Niijima-Yaoita et al., 2013). Another study revealed that dopamine activity in rats was suppressed; that is, the rats made less effort to obtain food, and food intake was therefore reduced (Wise and Rompre, 1989). Considering these studies, it can be assumed that chewing stimulation might inhibit the secretion of dopamine, which could contribute to the suppression of appetite.
It is notable, however, that the Bayes factors for the before vs. after RT bias and gaze direction bias differences do not provide convincing evidence for either the alternative or null hypotheses in both the sham and actual feeding conditions. There might be several possible reasons why not so strong evidence was provided in these conditions in the present study.
First, participants in the actual feeding condition completed the VPT or were subjected to ET immediately after food ingestion. It is therefore possible that postprandial hormones had not yet sent satiety signals to the brain, even though participants did report a significant decrease in appetite. In future studies, including a time delay seems advisable, as exemplified by Castellanos et al. (2009).
Second, the duration of gum chewing in this study was much shorter than those in previous studies reporting chewing’s effect on appetite (Miquel-Kergoat et al., 2015). With regard to the actual feeding session, the time required to “feeling satiated” by an energy supplement ingestion was preliminarily verified to take approximately 5 min. Accordingly, we set gum-chewing time to 5 min to match the actual feeding time as much as possible. However, Miquel-Kergoat et al. (2015) reported that the chewing effect was obtained after more than 10 min chewing time. Thus, in further research, we would like to consider a longer chewing period. In addition to this, we would like to consider long-term effects of gum chewing on appetite.
Thirdly, we conducted control study with different participants in Experiments 1 and 2, so that we could not compare among the effects of chewing, actual feeding, and control conditions in within-subject design due to limitations of our present study. Therefore, further investigations would be needed to give light on the effect of mastication on satiety, which might be beneficial in preventing impulsive eating especially in people with obesity.
Conclusion
We have demonstrated that chewing stimulation can reduce subjective appetite ratings that reflect craving. Moreover, chewing alone, as with feeding, results in reduced attentional bias to food, which has been suggested to be a behavioral output of the individual’s reward system, and particularly the initial attentional orientation to food, although the Bayes factors do not provide strong evidence for the alternative hypotheses in both the sham and actual feeding conditions. These findings possibly suggest that appetite reduction by chewing stimulation, even in the absence of taste, odor, and ingestion, may affect reward circuits and help prevent impulsive eating. We therefore propose that interventions directed toward stimulation of chewing activity could become a valuable adjunct tool for controlling the drive to eat.
Author Contributions
AI has conceived the study. All authors made a substantial and intellectual contribution to the work, participated in writing the manuscript and approved it for publication. AI, JM, and NU contributed to the design, data collection, analysis, and writing. MT and KM contributed to the design and writing.
Funding
This study was supported by JSPS Grant-in-Aid for Young Scientists (A) grant number 26713055 and Lotte Research Promotion Grant.
Conflict of Interest Statement
The authors declare that the research was conducted in the absence of any commercial or financial relationships that could be construed as a potential conflict of interest.
The reviewer MB and handling Editor declared their shared affiliation.
Acknowledgments
The authors thank Ms. Masako Akiyama (University Research Administration Office, Tokyo Medical and Dental University, Tokyo, Japan) for her advices of statistical analysis in this article. They also thank LOTTE Co., Ltd., Tokyo, Japan for the supply of the chewing gum.
Supplementary Material
The Supplementary Material for this article can be found online at: https://www.frontiersin.org/articles/10.3389/fpsyg.2018.00099/full#supplementary-material
Abbreviations
ET, eye-tracking; RT, reaction time; VPT, visual probe task.
References
Armstrong, T., and Olatunji, B. O. (2012). Eye tracking of attention in the affective disorders: a meta-analytic review and synthesis. Clin. Psychol. Rev. 32, 704–723. doi: 10.1016/j.cpr.2012.09.004
Bazzaz, M. M., Fadardi, J. S., and Parkinson, J. (2017). Efficacy of the attention control training program on reducing attentional bias in obese and overweight dieters. Appetite 108, 1–11. doi: 10.1016/j.appet.2016.08.114
Castellanos, E. H., Charboneau, E., Dietrich, M. S., Park, S., Bradley, B. P., Mogg, K., et al. (2009). Obese adults have visual attention bias for food cue images: evidence for altered reward system function. Int. J. Obes. 33, 1063–1073. doi: 10.1038/ijo.2009.138
Cohen, C. (1973). Eta-squared and partial Eta-squared in fixed factor anova designs. Educ. Psychol. Meas. 33, 107–112. doi: 10.1177/001316447303300111
Doolan, K. J., Breslin, G., Hanna, D., Murphy, K., and Gallagher, A. M. (2014). Visual attention to food cues in obesity: an eye-tracking study. Obesity 22, 2501–2507. doi: 10.1002/oby.20884
Field, M., and Cox, W. M. (2008). Attentional bias in addictive behaviors: a review of its development, causes, and consequences. Drug Alcohol Depend. 97, 1–20. doi: 10.1016/j.drugalcdep.2008.03.030
Giel, K. E., Teufel, M., Junne, F., Zipfel, S., and Schag, K. (2017). Food-related impulsivity in obesity and binge eating disorder-a systematic update of the evidence. Nutrients 9:E1170. doi: 10.3390/nu9111170
Graham, R., Hoovera, A., Ceballos, N. A., and Komogortsev, O. (2011). Body mass index moderates gaze orienting biases and pupil diameter to high and low calorie food images. Appetite 56, 577–586. doi: 10.1016/j.appet.2011.01.029
Harris, R., Harris, R. B. S., and Mattes, R. D. (2008). Appetite and Food Intake: Behavioral and Physiological Considerations. Boca Raton, FL: CRC Press. doi: 10.1201/9781420047844
Hetherington, M. M., and Boyland, E. (2007). Short-term effects of chewing gum on snack intake and appetite. Appetite 48, 397–401. doi: 10.1016/j.appet.2006.10.001
Hetherington, M. M., and Regan, M. F. (2011). Effects of chewing gum on short-term appetite regulation in moderately restrained eaters. Appetite 57, 475–482. doi: 10.1016/j.appet.2011.06.008
Jonker, N. C., Glashouwer, K. A., Ostafin, B. D., Van Hemel-Ruiter, M. E., Smink, F. R., Hoek, H. W., et al. (2016). Attentional bias for reward and punishment in overweight and obesity: the trails study. PLOS ONE 11:e0157573. doi: 10.1371/journal.pone.0157573
Julis, R. A., and Mattes, R. D. (2007). Influence of sweetened chewing gum on appetite, meal patterning and energy intake. Appetite 48, 167–175. doi: 10.1016/j.appet.2006.08.003
Katagiri, S., Nitta, H., Nagasawa, T., Izumi, Y., Kanazawa, M., Matsuo, A., et al. (2011). Reduced masticatory function in non-elderly obese Japanese adults. Obes. Res. Clin. Pract. 5, e267–e360. doi: 10.1016/j.orcp.2011.303.005
Kelley, A. E., and Berridge, K. C. (2002). The neuroscience of natural rewards: relevance to addictive drugs. J. Neurosci. 22, 3306–3311.
Lang, P. J., Bradley, M. M., and Cuthbert, B. N. (2008). International Affective Picture System (IAPS): Affective Ratings of Pictures and Instruction Manual. Technical Report A-8. Gainesville, FL: University of Florida.
Lee, H., Cho, C. W., Yoon, S., Suh, K. S., and Ryu, H. G. (2016). Effect of sham feeding with gum chewing on postoperative ileus after liver transplantation-a randomized controlled trial. Clin. Transplant. 30, 1501–1507. doi: 10.1111/ctr.12849
Leidy, H. J., Tang, M., Armstrong, C. L., Martin, C. B., and Campbell, W. W. (2011). The effects of consuming frequent, higher protein meals on appetite and satiety during weight loss in overweight/obese men. Obesity 19, 818–824. doi: 10.1038/oby.2010.203
Leong, S. L., Madden, C., Gray, A., Waters, D., and Horwath, C. (2011). Faster self-reported speed of eating is related to higher body mass index in a nationwide survey of middle-aged women. J. Am. Diet. Assoc. 111, 1192–1197. doi: 10.1016/j.jada.2011.05.012
Li, J., Zhang, N., Hu, L., Li, Z., Li, R., Li, C., et al. (2011). Improvement in chewing activity reduces energy intake in one meal and modulates plasma gut hormone concentrations in obese and lean young Chinese men. Am. J. Clin. Nutr. 94, 709–716. doi: 10.3945/ajcn.111.015164
Lutter, M., and Nestler, E. J. (2009). Homeostatic and hedonic signals interact in the regulation of food intake. J. Nutr. 139, 629–632. doi: 10.3945/jn.108.097618
Maruyama, K., Sato, S., Ohira, T., Maeda, K., Noda, H., Kubota, Y., et al. (2008). The joint impact on being overweight of self reported behaviours of eating quickly and eating until full: cross sectional survey. BMJ 337:a2002. doi: 10.1136/bmj.a2002
Mattes, R. D., and Considine, R. V. (2013). Oral processing effort, appetite and acute energy intake in lean and obese adults. Physiol. Behav. 120, 173–181. doi: 10.1016/j.physbeh.2013.08.013
Melton, P. M., Kissileff, H. R., and Pi-Sunyer, F. X. (1992). Cholecystokinin (CCK-8) affects gastric pressure and ratings of hunger and fullness in women. Am. J. Physiol. 263, R452–R456. doi: 10.1152/ajpregu.1992.263.2.R452
Miquel-Kergoat, S., Azais-Braesco, V., Burton-Freeman, B., and Hetherington, M. M. (2015). Effects of chewing on appetite, food intake and gut hormones: a systematic review and meta-analysis. Physiol. Behav. 151, 88–96. doi: 10.1016/j.physbeh.2015.07.017
Mogg, K., Bradley, B. P., Hyare, H., and Lee, S. (1998). Selective attention to food-related stimuli in hunger: are attentional biases specific to emotional and psychopathological states, or are they also found in normal drive states? Behav. Res. Ther. 36, 227–237. doi: 10.1016/S0005-7967(97)00062-4
Ng, M., Fleming, T., Robinson, M., Thomson, B., Graetz, N., Margono, C., et al. (2014). Global, regional, and national prevalence of overweight and obesity in children and adults during 1980-2013: a systematic analysis for the Global Burden of Disease Study 2013. Lancet 384, 766–781. doi: 10.1016/S0140-6736(14)60460-8
Niijima-Yaoita, F., Tsuchiya, M., Saito, H., Nagasawa, Y., Murai, S., and Arai, Y. (2013). Influence of a long-term powdered diet on the social interaction test and dopaminergic systems in mice. Neurochem. Int. 63, 309–315. doi: 10.1016/j.neuint.2013.07.004
Nijs, I. M., Muris, P., Euser, A. S., and Franken, I. H. (2010). Differences in attention to food and food intake between overweight/obese and normal-weight females under conditions of hunger and satiety. Appetite 54, 243–254. doi: 10.1016/j.appet.2009.11.004
Nijs, I. M. T. (2010). Attentional Mechanisms in Food Craving and Overeating: A study of an Addiction Model of Obesity. Erasmus University Rotterdam. Available at: http://hdl.handle.net/1765/18482 [accessed Nov 20, 2016].
Otsuka, R., Tamakoshi, K., Yatsuya, H., Murata, C., Sekiya, A., Wada, K., et al. (2006). Eating fast leads to obesity: findings based on self-administered questionnaires among middle-aged Japanese men and women. J. Epidemiol. 16, 117–124. doi: 10.2188/jea.16.117
Pelchat, M. L., Johnson, A., Chan, R., Valdez, J., and Ragland, J. D. (2004). Images of desire: food-craving activation during fMRI. Neuroimage 23, 1486–1493. doi: 10.1016/j.neuroimage.2004.08.023
Robinson, T. E., and Berridge, K. C. (1993). The neural basis of drug craving: an incentive-sensitization theory of addiction. Brain Res. Brain Res. Rev. 18, 247–291. doi: 10.1016/0165-0173(93)90013-P
Robinson, T. E., and Berridge, K. C. (2008). The incentive sensitization theory of addiction: some current issues. Philos. Trans. R. Soc. Lond. B Biol. Sci. 18, 247–291. doi: 10.1098/rstb.2008.0093
Sakata, T., Yoshimatsu, H., Masaki, T., and Tsuda, K. (2003). Anti-obesity actions of mastication driven by histamine neurons in rats. Exp. Biol. Med. 228, 1106–1110. doi: 10.1177/153537020322801002
Sanchez-Ayala, A., Campanha, N. H., and Garcia, R. C. (2013). Relationship between body fat and masticatory function. J. Prosthodont. 22, 120–125. doi: 10.1111/j.1532-849X.2012.00937.x
Sasaki, S., Katagiri, A., Tsuji, T., Shimoda, T., and Amano, K. (2003). Self-reported rate of eating correlates with body mass index in 18-y-old Japanese women. Int. J. Obes. Relat. Metab. Disord. 27, 1405–1410. doi: 10.1038/sj.ijo.0802425
Sawaki, R., and Luck, S. J. (2010). Capture versus suppression of attention by salient singletons: electrophysiological evidence for an automatic attend-to-me signal. Atten. Percept. Psychophys. 72, 1455–1470. doi: 10.3758/APP.72.6.1455
Schag, K., Teufel, M., Junne, F., Preissl, H., Hautzinger, M., and Zipfel, S. (2013). Impulsivity in binge eating disorder: food cues elicit increased reward responses and disinhibition. PLOS ONE 8:e76542. doi: 10.1371/journal.pone.0076542
Schönbrodt, F. D., and Wagenmakers, E. J. (2017). Bayes factor design analysis: planning for compelling evidence. Psychon. Bull. Rev. doi: 10.3758/s13423-017-1230-y [Epub ahead of print].
Schuster, R., Grewal, N., Greaney, G. C., and Waxman, K. (2006). Gum chewing reduces ileus after elective open sigmoid colectomy. Arch. Surg. 141, 174–176. doi: 10.1001/archsurg.141.2.174
Shikany, J. M., Thomas, A. S., Mccubrey, R. O., Beasley, T. M., and Allison, D. B. (2012). Randomized controlled trial of chewing gum for weight loss. Obesity 20, 547–552. doi: 10.1038/oby.2011.336
Skibicka, K. P. (2013). The central GLP-1: implications for food and drug reward. Front. Neurosci. 7:181. doi: 10.3389/fnins.2013.00181
Sperling, I., Baldofski, S., Luthold, P., and Hilbert, A. (2017). Cognitive food processing in binge-eating disorder: an eye-tracking study. Nutrients 9:E903. doi: 10.3390/nu9080903
Suzukawa, Y., and Toyoda, H. (2012). Effect sizes, statistical power and sample sizes in “The Japanese Journal of Psychology”. Shinrigaku Kenkyu 83, 51–63. doi: 10.4992/jjpsy.83.51
Swoboda, C., and Temple, J. L. (2013). Acute and chronic effects of gum chewing on food reinforcement and energy intake. Eat. Behav. 14, 149–156. doi: 10.1016/j.eatbeh.2013.01.011
Teff, K. (2000). Nutritional implications of the cephalic-phase reflexes: endocrine responses. Appetite 34, 206–213. doi: 10.1006/appe.1999.0282
Veedfald, S., Plamboeck, A., Deacon, C. F., Hartmann, B., Knop, F. K., Vilsboll, T., et al. (2016). Cephalic phase secretion of insulin and other enteropancreatic hormones in humans. Am. J. Physiol. Gastrointest. Liver Physiol. 310, G43–G51. doi: 10.1152/ajpgi.00222.2015
Volkow, N. D., Wang, G. J., and Baler, R. D. (2011). Reward, dopamine and the control of food intake: implications for obesity. Trends Cogn. Sci. 15, 37–46. doi: 10.1016/j.tics.2010.11.001
Weigle, C., and Banks, D. C. (2008). Analysis of Eye-Tracking Experiments Performed on a Tobii T60. Available at: http://download.sr-support.com/marcus/Tobii_Paper_Eye_Tracking.pdf [accessed Nov 20, 2016].
Wijlens, A. G., Erkner, A., Alexander, E., Mars, M., Smeets, P. A., and De Graaf, C. (2012). Effects of oral and gastric stimulation on appetite and energy intake. Obesity 20, 2226–2232. doi: 10.1038/oby.2012.131
Wise, R. A., and Rompre, P. P. (1989). Brain dopamine and reward. Annu. Rev. Psychol. 40, 191–225. doi: 10.1146/annurev.ps.40.020189.001203
Xu, J., Xiao, X., Li, Y., Zheng, J., Li, W., Zhang, Q., et al. (2015). The effect of gum chewing on blood GLP-1 concentration in fasted, healthy, non-obese men. Endocrine 50, 93–98. doi: 10.1007/s12020-015-0566-1
Keywords: chewing, attentional bias, visual probe task, eye-tracking, reward circuit, appetite
Citation: Ikeda A, Miyamoto JJ, Usui N, Taira M and Moriyama K (2018) Chewing Stimulation Reduces Appetite Ratings and Attentional Bias toward Visual Food Stimuli in Healthy-Weight Individuals. Front. Psychol. 9:99. doi: 10.3389/fpsyg.2018.00099
Received: 31 October 2017; Accepted: 22 January 2018;
Published: 08 February 2018.
Edited by:
Esther Katharina Papies, University of Glasgow, United KingdomReviewed by:
Maisy Jane Best, University of Glasgow, United KingdomAndrea Sabrina Hartmann, University of Osnabrück, Germany
Copyright © 2018 Ikeda, Miyamoto, Usui, Taira and Moriyama. This is an open-access article distributed under the terms of the Creative Commons Attribution License (CC BY). The use, distribution or reproduction in other forums is permitted, provided the original author(s) and the copyright owner are credited and that the original publication in this journal is cited, in accordance with accepted academic practice. No use, distribution or reproduction is permitted which does not comply with these terms.
*Correspondence: Jun J. Miyamoto, mjmort@tmd.ac.jp