
- 1 The Mind Research Network, Albuquerque, NM, USA
- 2 Department of ECE, University of New Mexico, Albuquerque, NM, USA
- 3 Olin Neuropsychiatry Research Center, Hartford, CT, USA
- 4 Department of Psychiatry, Yale University, New Haven, CT, USA
- 5 Department of Psychology, University of New Mexico, Albuquerque, NM, USA
Intrinsic functional brain networks (INs) are regions showing temporal coherence with one another. These INs are present in the context of a task (as opposed to an undirected task such as rest), albeit modulated to a degree both spatially and temporally. Prominent networks include the default mode, attentional fronto-parietal, executive control, bilateral temporal lobe, and motor networks. The characterization of INs has recently gained considerable momentum, however; most previous studies evaluate only a small subset of the INs (e.g., default mode). In this paper we use independent component analysis to study INs decomposed from functional magnetic resonance imaging data collected in a large group of schizophrenia patients, healthy controls, and individuals with bipolar disorder, while performing an auditory oddball task. Schizophrenia and bipolar disorder share significant overlap in clinical symptoms, brain characteristics, and risk genes which motivates our goal of identifying whether functional imaging data can differentiate the two disorders. We tested for group differences in properties of all identified INs including spatial maps, spectra, and functional network connectivity. A small set of default mode, temporal lobe, and frontal networks with default mode regions appearing to play a key role in all comparisons. Bipolar subjects showed more prominent changes in ventromedial and prefrontal default mode regions whereas schizophrenia patients showed changes in posterior default mode regions. Anti-correlations between left parietal areas and dorsolateral prefrontal cortical areas were different in bipolar and schizophrenia patients and amplitude was significantly different from healthy controls in both patient groups. Patients exhibited similar frequency behavior across multiple networks with decreased low frequency power. In summary, a comprehensive analysis of INs reveals a key role for the default mode in both schizophrenia and bipolar disorder.
Introduction
Schizophrenia (SZ) is a psychotic disorder characterized by altered perception, cognition, thought processes, and behaviors whereas bipolar (BP) illness is a mood disorder involving prolonged states of depression and mania (Goodwin and Jamison, 2007). Clinicians have noted for many years that there are extensive commonalities between them, for a recent review see (Keshavan et al., in press). Specifically, the two brain diseases have overlapping symptoms (e.g., 60% of bipolar 1 patients have psychotic features (Guze et al., 1975; Goes et al., 2007), both types of patients show persistent neurocognitive deficits (Glahn et al., 2004), similar risk genes (Bahn, 2002), and co-occurrence within relatives (Lichtenstein et al., 2009); however, the common and distinct neural mechanisms underlying these disorders remain unclear.
Over the past decade there has been increasing study of functional connectivity in mental illness. Two of the more widely used methods include seed-based approaches (Greicius et al., 2004) and investigations based on independent component analysis (ICA; Calhoun et al., 2004, 2009a). These approaches both capitalize on underlying temporal coherence in the functional magnetic resonance imaging (fMRI) timecourses (TCs) which appears to reflect functionally relevant activity and is present both at rest and during a task (Biswal et al., 1995; Calhoun et al., 2008a). Intrinsic functional brain networks (INs) are sets of brain regions of the brain showing temporal coherence with one another; they provide a key way of evaluating the human (macro) functional connectome (Biswal et al., 2010; Allen et al., 2011; Sporns, 2011). The INs are quite robust and as we have shown in a direct comparison of extended rest data and auditory oddball data, the task essentially gives us a controlled way to study how these networks are modulated both spatially and temporally by a directed task (versus an undirected task such as resting; Calhoun et al., 2008a). Numerous INs have been identified consistently by many groups, such as the default mode network, the attentional fronto-parietal networks, the executive control network (or salience network), and bilateral temporal lobe and motor cortex. The INs are likely critical components of healthy and aberrant brain functions given the many studies showing important cognitive processes which appear to be localized to these networks such as prediction of errors (Eichele et al., 2008) and studies showing dysfunction in INs in various mental illness (Greicius et al., 2004; Calhoun et al., 2008b, 2009a; Broyd et al., 2009).It is also important to note that INs comprise most of the variance of the fMRI data (Calhoun et al., 2008a).
Evaluating characteristics of INs in health and disease has gained considerable momentum in recent years. However, most previous studies have evaluated only a small subset of the INs (e.g., default mode). While this approach has revealed significant differences in, e.g., schizophrenia and bipolar disorder (Calhoun et al., 2008b), it does not enable us to evaluate the underlying functional brain changes in a comprehensive manner. We have recently developed a multivariate testing framework that allows us to test multiple INs and multiple aspects of each network while also controlling the false positive rate associated with the multiple testing (Allen et al., 2011).
In this paper we use ICA to study INs from a large group of schizophrenia patients, healthy controls, and individuals with bipolar disorder. ICA is increasingly utilized as a tool for evaluating the hidden spatiotemporal structure contained within brain imaging data and is often applied to fMRI data in a group framework to enable inference about individual variation within groups of subjects (Calhoun et al., 2001; Allen et al., in press; Erhardt et al., in press). Following application of group ICA to fMRI data from all subjects, we then identify all plausible INs and use a comprehensive approach to test for group differences in all identified INs. Within a rigorous statistical framework, we evaluate multiple parameters of these networks and their relationship with disease group, including spatial maps (SMs), spectra, and functional network connectivity (FNC). We also discuss the potential of using these parameters for classification of disease and differentiation of the bipolar and schizophrenia groups.
Results reveal a key role for the default mode network in that these regions show significant and specific differences between healthy subjects, patients with schizophrenia, and patients with bipolar disorder. These regions are somewhat similar to a model previously proposed by Williamson (Williamson, 2007; Williamson and Allman, 2011) with anterior regions involved in emotional processing more relevant in comparisons between healthy subjects and those with bipolar disorder and posterior and temporal lobe dysfunction more specific to schizophrenia patients. Results are also consistent with findings reported in Lynall et al. (2010).
Materials and Methods
Participants
Sixty-two healthy controls [HC, age 38 ± 17 (range), 30 females], 54 patients with schizophrenia (SZ, age 37 ± 12, 22 females), and 48 patients with bipolar disorder (BP, age 37 ± 14, 26 females) were recruited at the Olin Neuropsychiatric Research Center and were scanned with fMRI while performing an auditory oddball task (Kiehl and Liddle, 2001). These data have been analyzed jointly with diffusion tensor imaging in another study (Sui et al., in press). All subjects gave written, informed, Hartford Hospital, and Yale University IRB-approved consent. Schizophrenia or bipolar disorder was diagnosed according to DSM-IV–TR criteria on the basis of a structured clinical interview (First et al., 1995) administered by a research nurse and review of the medical file. Bipolar patients with further sub-classified into those who were historically psychotic or non-psychotic based on previously published criteria (Strasser et al., 2005); 48% of bipolar patients were thus classified as psychotic in one or more illness episodes, including the current one. All patients were stabilized on medication for at least 4 weeks prior to the scan session in this study. Healthy participants were screened to ensure they were free from DSM-IV Axis I or Axis II psychopathology (assessed using the SCID; Spitzer et al., 1996) and also interviewed to determine that there was no history of psychosis or major mood disorder in any first-degree relatives). All subjects were urine-screened to eliminate those who were positive for abused substances, or currently pregnant in the case of females. Patients and controls were age and sex matched, with no significant differences among three groups, where age: p = 0.93, F = 0.07, DF = 2. Sex: p = 0.99, χ2 = 0.017, DF = 2. All participants had normal hearing, and were able to perform the oddball task successfully during practice prior to the scanning session. Bipolar subjects were also assessed for current psychosis at the time of scanning based on a criterion of scoring 3 or higher in one or more of the following PANSS (Kay et al., 1987) positive subscale items: P1 (delusions), P2 (conceptual disorganization), P3 (hallucinations), and P6 (suspiciousness/persecutory). Other positive symptoms such as grandiosity and excitement (P4, 5) did not qualify as psychosis. Based on these criteria 48% (23/48) of bipolar subject met the criterion of current psychosis at the time of scanning.
Imaging Parameters
Scans were acquired at the Institute of Living, Hartford, CT, USA on a 3 T dedicated head scanner (Siemens Allegra) equipped with 40 mT/m gradients and a standard quadrature head coil. The functional scans were acquired using gradient-echo echo planar imaging (EPI) with the following parameters: repeat time (TR) = 1.5 s, echo time (TE) = 27 ms, field of view = 24 cm, acquisition matrix = 64 × 64, flip angle = 70°, voxel size = 3.75 mm × 3.75 mm × 4 mm, slice thickness = 4 mm, gap = 1 mm, number of slices = 29; ascending acquisition. Six dummy scans were carried out at the beginning to allow for longitudinal equilibrium, after which the paradigm was automatically triggered to start by the scanner.
Task
The auditory oddball task involved subjects encountering three frequencies of sounds: target (1200 Hz with probability, p = 0.09), novel (computer generated complex tones, p = 0.09), and standard (1000 Hz, p = 0.82) presented through a computer system via sound insulated, MR-compatible earphones. Stimuli were presented sequentially in pseudorandom order for 200 ms each with inter-stimulus interval (ISI) varying randomly from 500 to 2050 ms. Subjects were asked to make a quick button–press response with their right index finger upon each presentation of each target stimulus; no response was required for the other two stimuli. Two runs of 244 stimuli were presented (Kiehl et al., 2005).
Preprocessing
Functional magnetic resonance imaging data were preprocessed using an automated preprocessing pipeline and neuroinformatics system developed at MRN (Bockholt et al., 2010) and based around SPM51. Following the completion of a scan, data are automatically archived and copied to an analysis directory where preprocessing is performed. In the functional data pipeline, the first four volumes are discarded to remove T1 equilibration effects, images are realigned using INRIalign, and slice-timing correction is applied using the middle slice as the reference frame. Data are then spatially normalized into the standard Montreal Neurological Institute (MNI) space (Friston et al., 1995), resliced to 3 mm × 3 mm × 3 mm voxels, and smoothed using a Gaussian kernel with a full-width at half-maximum (FWHM) of 10 mm.
Group ICA
Group independent components analysis was performed using the GIFT toolbox2. Our analysis followed a similar approach as described in a recent study performed on a large (N = 603) analysis of resting fMRI data (Allen et al., 2011). We chose relatively high model order ICA (75 components) as previous studies have demonstrated that such models yield refined components that correspond to known anatomical and functional segmentations (Kiviniemi et al., 2009; Abou-Elseoud et al., 2010). Subject-specific data reduction principal components analysis (PCA) retained 100 principal components (PCs). Group data reduction retained 75 PCs using the expectation–maximization (EM) algorithm, included in GIFT. The Infomax ICA algorithm (Bell and Sejnowski, 1995) was used to estimate the independent components. Subject-specific SMs and TCs were estimated using a back-reconstruction method based on PCA compression and projection (Calhoun et al., 2001; Erhardt et al., in press).
Feature identification
IN selection. We identified a subset of components considered to be INs (as opposed to physiological artifacts) by inspecting the aggregate SMs and average power spectra. Components were evaluated based on expectations that INs should exhibit peak activations in gray matter, low spatial overlap with known vascular, ventricular, motion, and susceptibility artifacts, and TCs dominated by low frequency fluctuations (Cordes et al., 2001; Allen et al., 2011). From the 75 decomposed components, we identified c1 = 47 putative INs for further study.
Outcome measures. For the set of selected INs, we considered three outcome variables: (1) component power spectra, (2) component SMs, and (3) between component connectivity (FNC). We additionally evaluated the task-relatedness of the ICA time courses by the task stimuli. Component SMs were thresholded based on the distribution of voxel-wise t-statistics to identify voxels with strong and consistent activation across subjects to focus our analysis on the subset of voxels most representative of each network (Allen et al., 2011). From this point forward, descriptions of component SMs refer to the thresholded maps, which include regions most associated with component TCs. FNC was estimated as the Pearson’s correlation coefficient between pairs of TCs (Jafri et al., 2008). Subject-specific TCs were detrended and despiked based on the median absolute deviation as implemented in 3dDespike3, then filtered using a fifth-order Butterworth low-pass filter with a high frequency cutoff of 0.15 Hz. Pairwise correlations were computed between RSN TCs, resulting in a symmetric c1 × c1 correlation matrix for each subject. For all FNC analyses, correlations were transformed to z-scores using Fisher’s transformation, z = atanh(k), where k is the correlation between two component TCs.
Statistical analyses
Overview. We utilize a recently published multivariate model selection strategy optimized for the large dimensions of the three ICA-derived outcome measures (Allen et al., 2011). Such an approach reduces the total number of statistical tests performed and facilitates testing predictors on the response matrices as a whole. We utilize a multivariate analysis of covariance (MANCOVA) to identify factors that influence the response matrix. We then proceed to perform univariate tests with a reduced design matrix and correct for multiple comparisons using the false discovery rate (FDR; Genovese et al., 2002). The design matrix included regressors for group membership (bipolar, schizophrenia, healthy) as well as group interactions.
Response variables. For each of I = 1,…, N subjects, we have c = 1,…, c1 power spectra (Pic) each with 150 spectral bins, c = 1,…, CSMs (Sic), and a single vector of FNC pairwise correlations between the C components (Ki). Each of these response variables is modeled separately. Prior to modeling, response variables are transformed and dimension reduced. Spectra are element wise log-transformed, which is useful because it normalizes the highly skewed power distribution. Similarly, FNC correlations are Fisher-transformed [z = atanh(k)]. We perform a PCA dimension reduction on each matrix using 15 dimensions (several different dimensions were compared with similar results). Those reduced components are used as input to the MANCOVAs, to capture the primary effects.
Univariate tests. Following the MANCOVA on the reduced response variables to determine whether diagnosis has a significant effect, we perform univariate tests on the original response variables to determine which spectral bins, SM voxels, or FNC correlations are associated with diagnosis. Associations are visualized by plotting the log of the p-value with the sign of the associated t-statistic, −sign(t)log10(p), which provides information on both the directionally and statistical strength of the result. Univariate tests were corrected for multiple comparisons at an alpha = 0.05 significance level using FDR.
We also report the task modulation of each of the identified IN components by performing a multiple regression of the hemodynamic model (creating using the default SPM hemodynamic response function). This provides a beta for each regressor and each component, and these betas are then subjected to one-sample t-tests to evaluate whether a given component is modulated by a particular task stimulus. A two-sample t-test is used to test for group differences in the task modulation (Calhoun et al., 2009b).
Results
Behaviorally (see Table 1) all subjects performed with comparable accuracy on the auditory oddball task; schizophrenia; and bipolar patients however performed significantly more slowly than healthy controls, consistent with multiple prior studies (Muller et al., 2001).
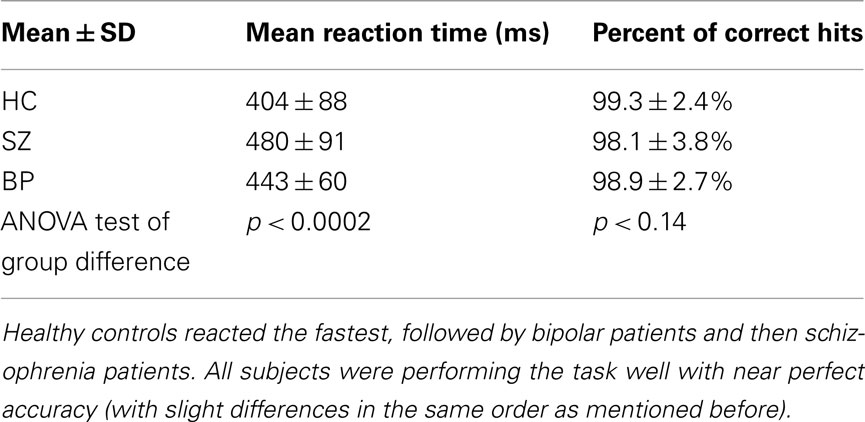
Table 1. Auditory oddball behavioral results: mean reaction time and percent correct hits are presented for each group.
We performed a 75-component GICA. Based on visual inspection of SMs and power spectra, we identified 47 components as plausible INs. The MANCOVA yielded significant effects of diagnosis within multiple components and within all response variables of the group ICA including voxel-wise SMs, FNC, and spectra. In addition, we found significant differences in task modulation between groups as well. In the following we summarize each set of results, starting with the SMs.
Six components out of 47 were found to show SM group differences using a threshold of p < 0.05 within the MANCOVA framework. Univariate tests revealed significant voxels in all six components for each of the pairwise group contrasts. Results are summarized in Figure 1. The INs showing group differences can be grouped into three categories, comprised of default mode, frontal, and temporal components.
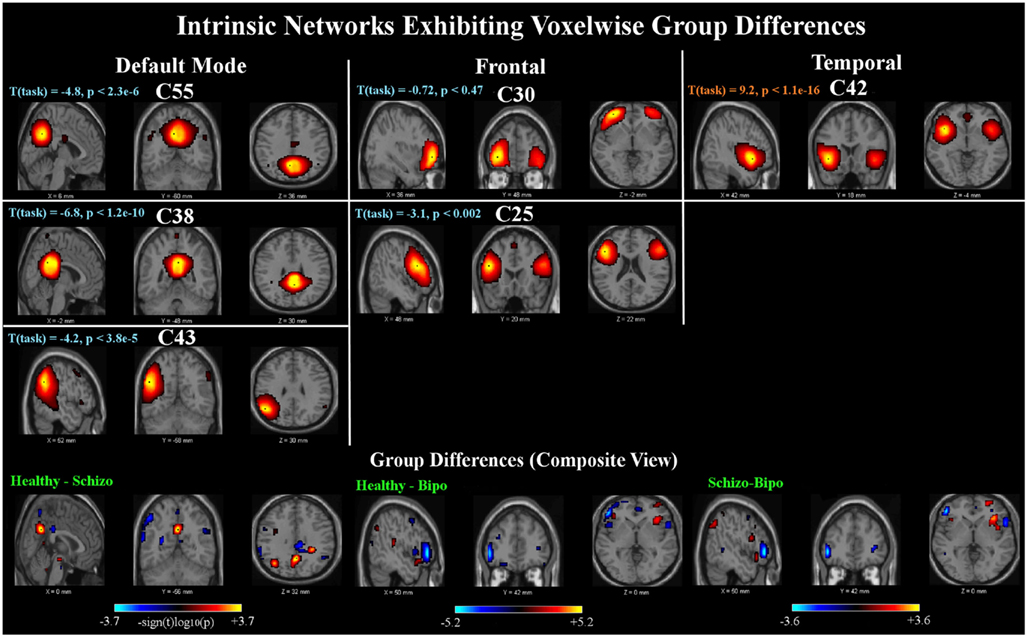
Figure 1. Spatial maps: top panels show sagittal, coronal, and axial slices of the six components found to have group differences. In this and subsequent figures, component spatial maps are thresholded at T > 1. T (task) indicates the task-relatedness of each component, as assessed with a one-sample t-test of the subject beta values. Bottom panels show composite maps of the group differences for the Healthy – Schizo (left), Healthy – Bipo (middle), and Schizo – Bipo (right) contrasts (thresholded at p < 0.05, corrected for multiple comparisons). Composite maps for each contrast are created by taking the maximum significant value (over the six components) at each voxel.
The first category includes two networks [Components (C)55 and C38] showing posterior cingulate regions. These regions in addition to a left parietal network (C43) are implicated as being part of the default mode network (Raichle et al., 2001). All three of these components are significantly negatively modulated by the target stimuli. The second category includes two frontal lobe networks (C30 and C25) mostly in superior and inferior frontal lobe and inclusive of dorsolateral prefrontal cortex (DLPFC). Both INs in our study are slightly left lateralized and neither shows significant modulation by the target stimuli. The third category includes one component (C42) in bilateral temporal lobe, mostly superior temporal gyrus, and insula but also the anterior cingulate; this component is also very strongly positively modulated by the target stimuli.
A composite view of the univariate contrasts showing group differences in any of the six components are shown in Figure 1. To create the composite, the maximum significant value over all comparisons is shown at each voxel. Voxel-wise differences show primarily posterior parietal, default mode regions differentiate schizophrenia from healthy individuals, with additional parietal and inferior frontal regions showing stronger measures in subjects with schizophrenia than in healthy individuals. Subject with bipolar disease show similar increased measures in the frontal cortex, and weaker measures in the precuneus and posterior default mode areas, as well as additional lateral frontal and temporal regions. The largest differences between healthy controls and schizophrenia patients include the inferior frontal triangle (including Brodman 44, 45, and 46) and regions in the temporal lobe. A full listing of the regions is provided in Table 2.
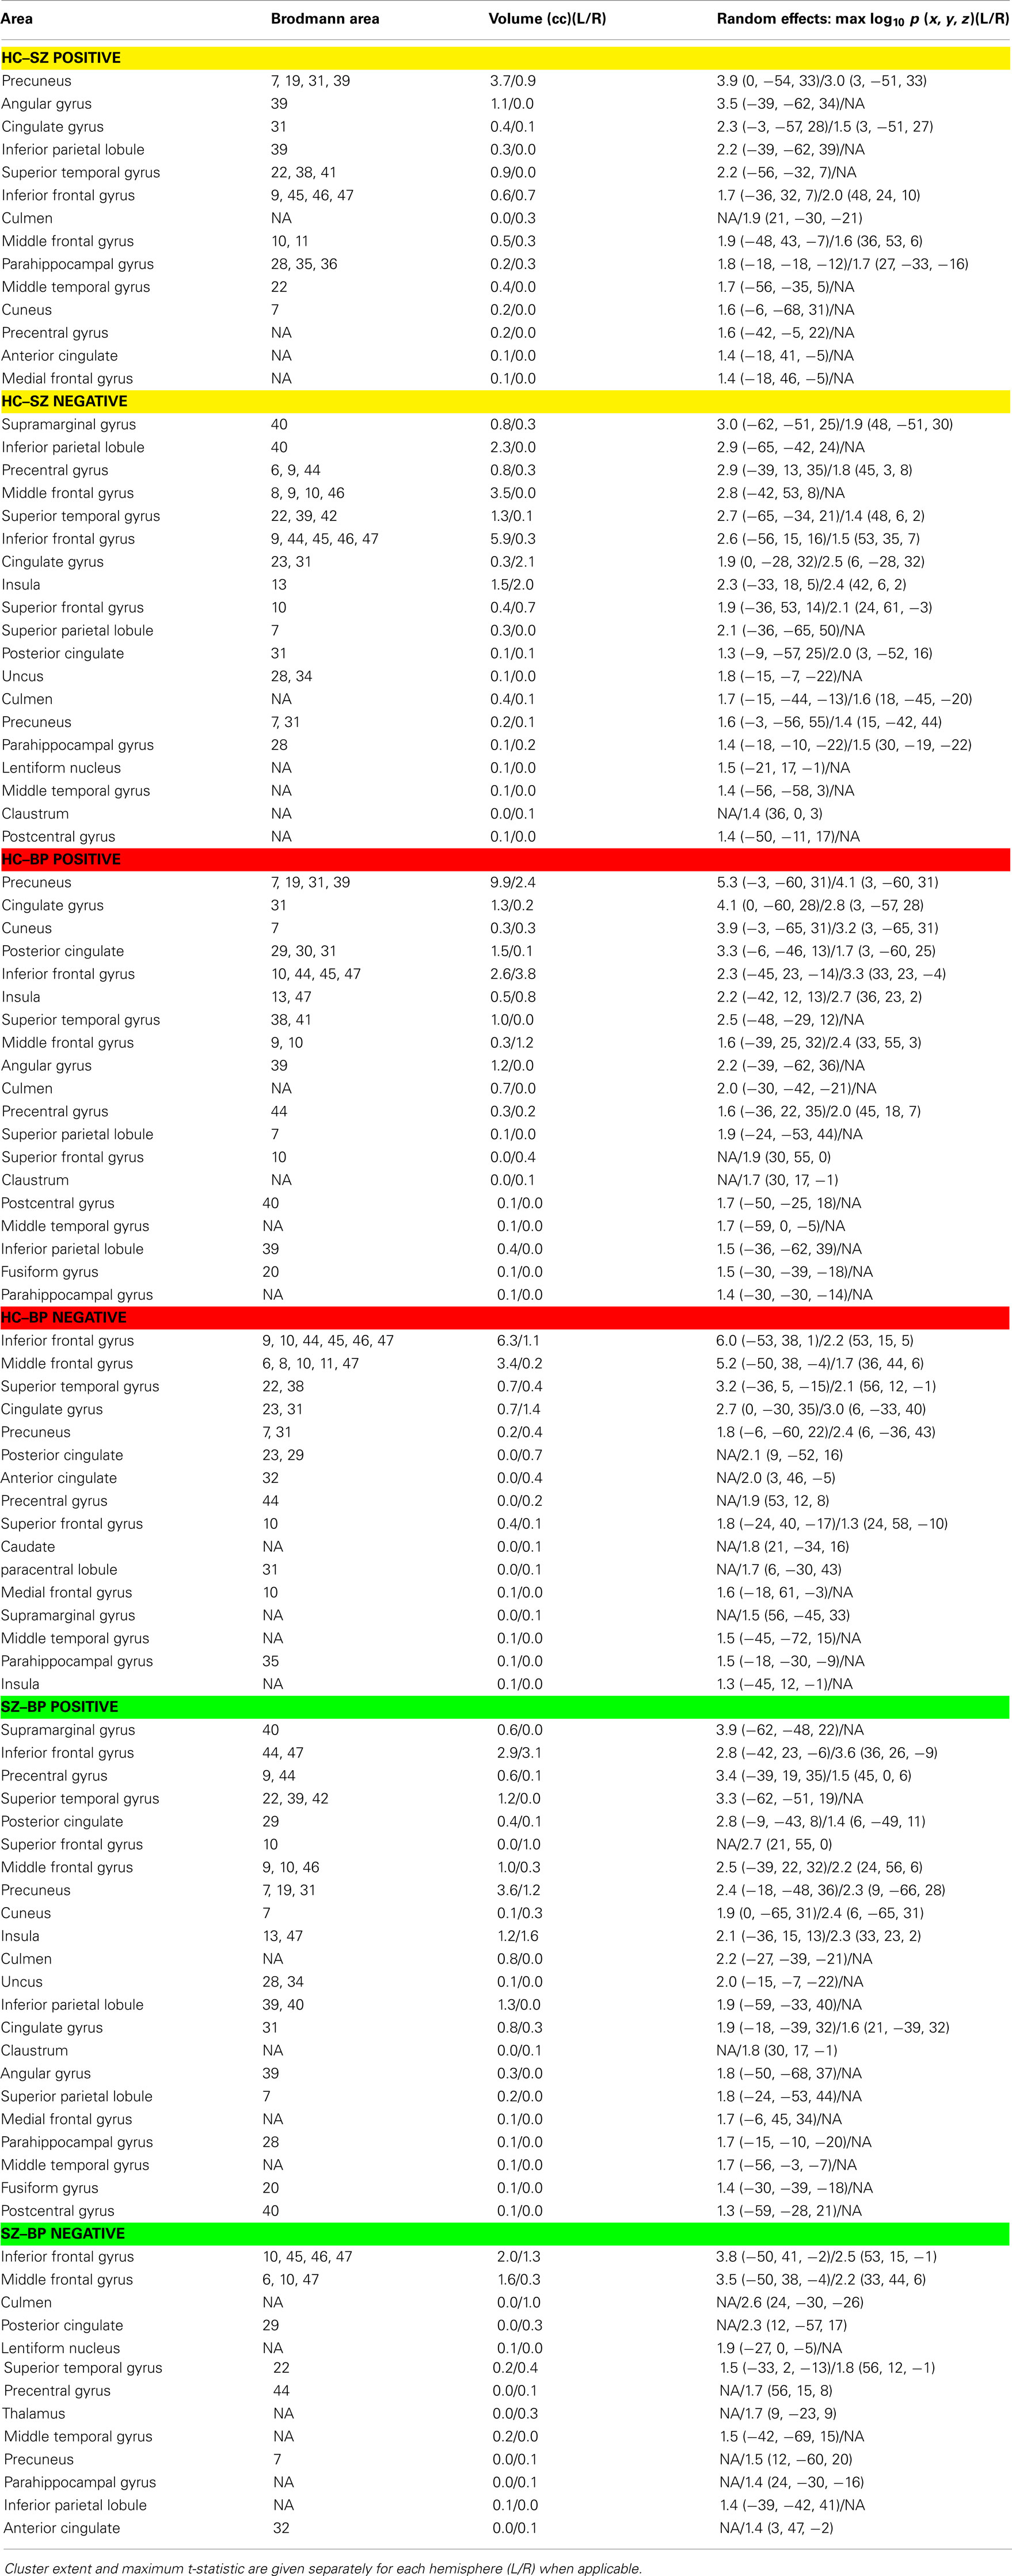
Table 2. Summary of regions showing group differences in spatial maps: clusters of significant between-group differences (cluster size > 27 voxels; p < 0.05 corrected for multiple comparisons within each component) from components C55, C38, C43, C30, C25, and C42 (which are displayed in Figure 1).
Functional network connectivity results are shown in Figure 2. All significant FNC differences (p < 0.05 FDR corrected) are shown on the left. In addition, the FNC matrix (uncorrected for multiple comparisons) is shown on the right. In comparisons between the groups, the default mode regions played a primary role. Group differences between schizophrenia and healthy controls are found between the posterior cingulate (C14) and both right cerebellum (C7) and posterior temporal lobe (C8). Differences between healthy controls and bipolar patients revealed two pairs, the first being posterior cingulate (C14) linked to a visual component including the temporo-occipital–parietal junction (C24) and the second being a link between the anterior default mode (C44) with the inferior parietal lobule and angular gyri in addition to the posterior portion of the superior temporal lobe (C1). Differences between schizophrenia and bipolar patients manifested as a pair of links between the anterior cingulate (C68) and bilateral superior temporal gyrus (C42) and also the temporal pole (mostly right lateralized; C22). In addition, FNC difference between patient groups were significant for lateral frontal (C25) and lateral parietal (C43), both left lateralized. Three of the same networks showing voxel-wise SM differences (C42, C43, C25) were also demonstrated FNC differences between schizophrenia and bipolar disorder.
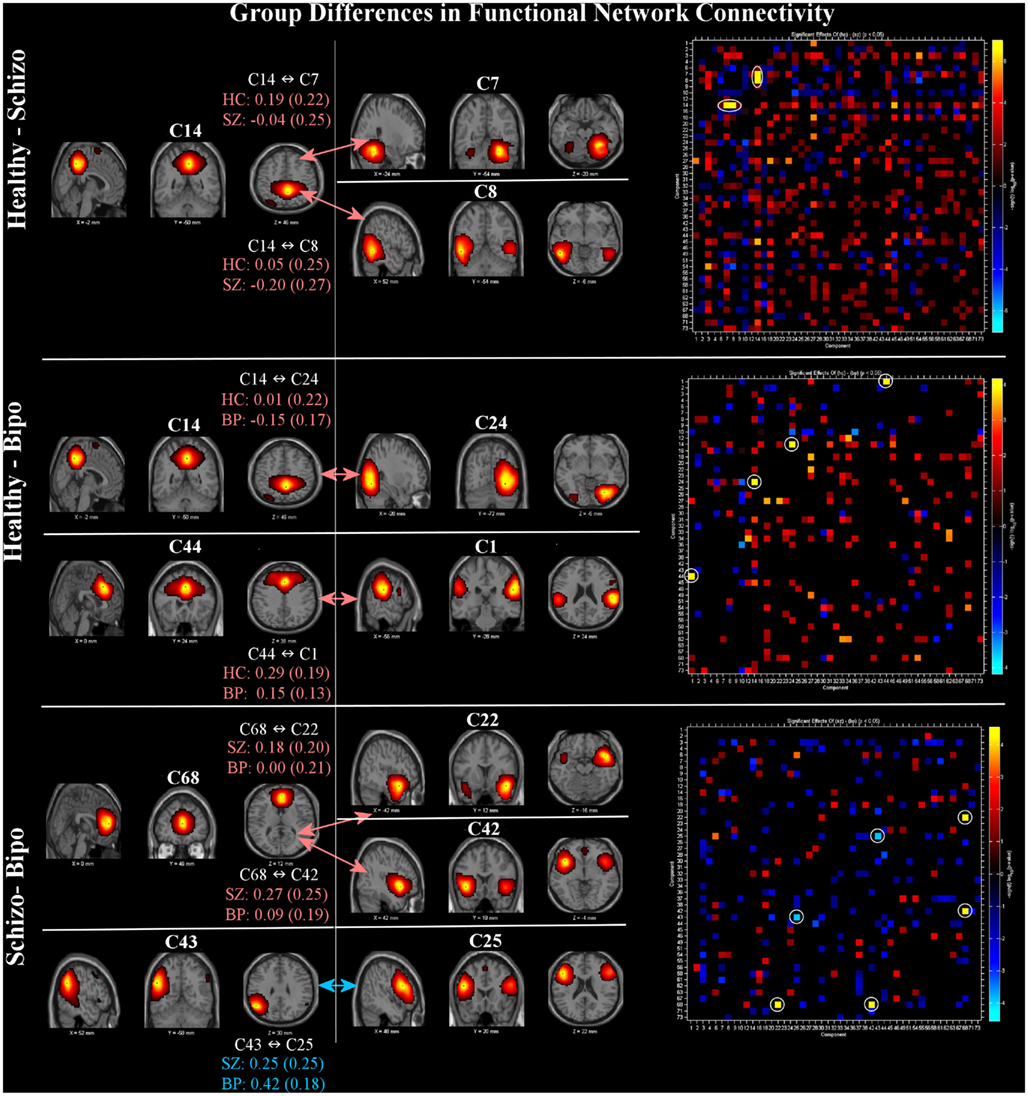
Figure 2. Functional network connectivity (FNC): significant between-group differences (thresholded at p < 0.05, corrected for multiple comparisons) in FNC (left) and full difference matrices (thresholded at p < 0.05, not corrected, to provide additional context) for Healthy – Schizo (top), Healthy – Bipo (middle), and Schizo – Bipo (bottom) contrasts (right). Significant FNC differences are highlighted with white circles in the matrices. For each example, the FNC values (temporal correlations between components) within each group are displayed as mean (SD).
The right portion of Figure 2 shows the full FNC difference matrices for all pairs of components. Generally, healthy controls show more positive correlations among ICA TCs across networks than do either schizophrenia or bipolar patients (more orange/red in the figure) whereas schizophrenia patients show more FNC than bipolar patients.
Finally, we also evaluated group differences in spectral power. Figure 3 (left and middle) shows a spectral image of components (y axis) by spectra (x axis) with significant differences shown in orange (HC < SZ or BP) or blue (HC < SZ or BP). On the right is the average spectra across all components for each group. Consistent with previous work we found healthy controls showed more spectral power at lower frequencies whereas patients showed more spectral power at higher frequencies (Garrity et al., 2007; Calhoun et al., 2008a). In addition, we saw a similar pattern in the bipolar patients: there were no significant differences in spectral profiles between schizophrenia patients and bipolar patients. It is clear from this that controls have greater power in the low frequency bands that do the patients and both patients groups have more power in the high frequencies. The general tendency off all component spectra tended to be similar, with some showing slightly stronger effects which passed significance.
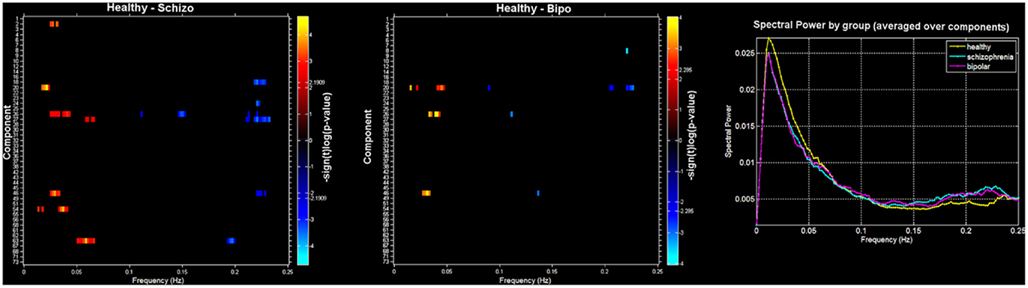
Figure 3. Spectra: between-group differences in spectral power (thresholded at p < 0.05, corrected for multiple comparisons) for Healthy – Schizo (top) and Healthy – Bipo (middle) contrasts. Note that the Schizo – Bipo contrast showed no significant differences. Color maps in left and middle panels show the power differences at each frequency over each component separately. Rightmost panel shows the mean power spectra for each group, averaged over all components.
A recurring finding in these analyses is the implication of the regions from the posterior cingulate into precuneus region of the default mode network, showing lower coherence and connectivity in the patients than in the healthy individuals. However, the distinctions between the patient groups implicate relatively less of the posterior areas and more of the frontal regions, as summarized in Figure 4.
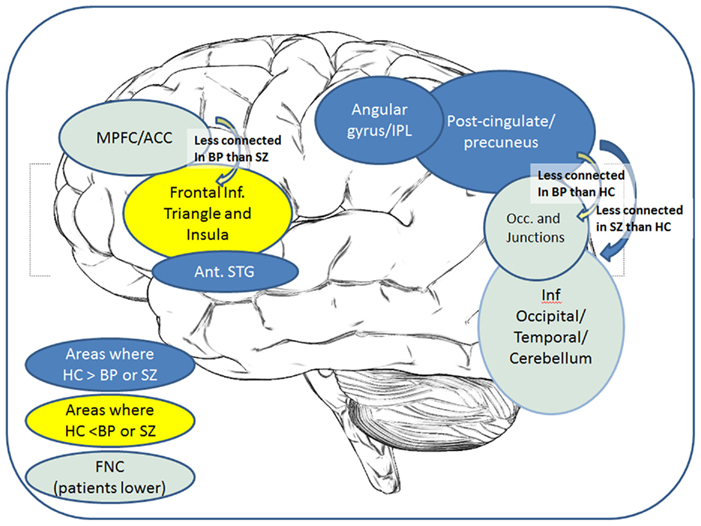
Figure 4. Overall summary of results: a cartoon depicting the key regions showing group differences in either voxel-wise maps or FNC correlations.
Discussion
In this paper we have performed, to our knowledge, the first comprehensive comparative analysis of INs to identify those which differentiate schizophrenia and bipolar disorder from healthy controls. We performed a relatively high model order ICA decomposition in order to evaluate the relationship among sub-nodes of INs in a simple auditory oddball task. We evaluated three different properties of the extracted INs, focused on group differences. The first property we evaluated was within-network voxel-wise differences, providing a measure of the strength of the connectivity differences in a given region. This property was significantly different in anterior and posterior cingulate and parietal default mode regions, temporal lobe, and lateral frontal/DLPFC. Results are consistent with those reported in a recent graph theoretic study (Lynall et al., 2010).
Group variations in the strength of connectivity were observed in temporal gyrus (BA 21 22 41 42) which is responsible for processing of auditory information, as has been found previously both in these data and others (Kim et al., 2009; Sui et al., in press), and is in keeping with auditory oddball processing differences in SZ and BP found using other modalities (Ford et al., 1994; Schulze et al., 2008; Calhoun et al., 2010). Structural and functional abnormalities in the superior temporal gyrus, particularly on the left side, have been demonstrated in schizophrenia patients in multiple studies as well as in psychotic bipolar disorder and constitute the best-replicated brain differences correlating with the severity of psychotic symptoms in schizophrenia, most specifically auditory hallucinations and formal thought disorder collectively; abnormalities in these regions likely underpin psychotic phenomena (Swerdlow, 2010; Fusar-Poli et al., 2011). This supports the idea that aberrant patterns of coherence in temporal lobe may be a cardinal abnormality in both schizophrenia, and to a lesser extent in bipolar disorder (Pearlson, 1997; Calhoun et al., 2008b; Chance et al., 2008). The insula has a role in emotional regulation, as reviewed by (McIntosh et al., 2008; Kempton et al., 2009) who discuss differential insula response in BP compared to HC and SZ.
Intrinsic functional brain networks showing group differences include C55 and C38, comprising posterior cingulate regions together with a left parietal network (C43) constituting part of the default mode network. The finding that DMN subcomponents exhibit differential behavior in schizophrenia (Skudlarski et al., 2010) further validates earlier conclusions that the DMN should be seen not as a single unit but as composed of substructures that all contribute to resting state activation while varying substantially in connectivity patterns. Here such a distinction is shown to be clinically relevant in identifying distinctions between SZ and BP.
A second network set includes two frontal lobe networks (C30 and C25) mostly located in superior and inferior frontal lobe, including DLPFC. DLPFC plays an important role in the integration of sensory and mnemonic information, executive function, planning and regulation of cognitive function and action. Researchers have frequently reported dysfunction and lack of functional connectivity of this region in patients with schizophrenia (Badcock et al., 2005; Hamilton et al., 2009) and bipolar disorder (Curtis et al., 2001; Glahn et al., 2010). Our results are consistent with the above findings and suggest that these deficits might be related to shared risk factors and disease mechanisms common to both disorders.
The second property we evaluated was FNC, evaluating differences in the pairwise correlation among component TCs. Default mode regions again proved to play a major role with schizophrenia subjects differentiated from bipolar subjects via a greater association between anterior default mode and two temporal lobe INs, and from healthy controls via a weaker association between the posterior default mode and a more inferior posterior temporal lobe IN and a cerebellar IN. In contrast, bipolar subjects were differentiated from healthy subjects via a posterior default mode – right visual IN as well as an anterior default mode – right parietal IN.
Strakowski et al. (2005) supports a model of bipolar disorder that involves dysfunction within subcortical (striatal–thalamic) – prefrontal networks and the associated limbic modulating regions (amygdala, midline cerebellum). These studies suggest that, in bipolar disorder, there may be diminished prefrontal modulation of subcortical and medial temporal structures within the anterior limbic network (e.g., amygdala, anterior striatum, and thalamus) that results in dysregulation of mood.
The fact that both ventral anterior cingulate DMN regions as well as medial PFC regions were prevalent in the comparisons with bipolar disorder is consistent with the role of both these regions in emotional processing (Bush et al., 2000; Laird et al., 2009; Uddin et al., 2009; Ongur et al., 2010) as well as with a predicted model of bipolar disorder implicating the emotional encoding network (Williamson and Allman, 2011). It is notable that in the comparison of HC–SZ negative and HC–BP negative voxels, anterior cingulate BA 32 is one of the few regions that distinguishes the two pathologic diagnostic groups, as reflected in the final part of Table 2 (SZ − BP negative voxels) BA 32 constitutes an important part of the “affective anterior cingulate,” together with regions BA 24 and 25, which is connected to portions of emotional processing circuitry including amygdala and orbitofrontal cortex (Bush et al., 2000).
The key role that DMN plays in both schizophrenia and bipolar disorder is also consistent with the hypothesis that DMN plays a sentinel role in monitoring the external environment. The default network is hypothesized to support internally focused cognition that relies on mnemonic systems (Buckner et al., 2008). Hahn and colleague suggest that activity at rest “may reflect, among other functions, the continuous provision of resources for spontaneous, broad, and exogenously driven information gathering.” Their results also suggest that nicotine improved attentional performance by down-regulating resting brain function in response to task-related cues (Hahn et al., 2007).
Schizophrenia has been associated with overactive (more rapidly fluctuating) default mode activity (Garrity et al., 2007), which when connected to Hahn’s results, could explain the higher prevalence of smoking in patients with schizophrenia. In this study we also evaluated the spectra of the INs, providing a measure of differences in the fluctuations in the intrinsic activity (at least within the frequencies captured by fMRI data). Consistent with previous results, schizophrenia patients reliably show significantly less low frequency power and more high frequency power (Garrity et al., 2007; Calhoun et al., 2008a; Ongur et al., 2010; Turner et al., in press). In addition, the frequency content of INs from the bipolar patients showed a similar behavior, indeed, bipolar, and schizophrenia spectra did not show significant differences from one another. This may reflect the fact that the spectra are just sensitive to amplitude differences, not connectivity differences, so it is perhaps not surprising that they appear to be less sensitive to discriminate between these two disorders. Numerous recent papers have stressed the similarities between bipolar disorder with psychotic symptoms and schizophrenia, e.g., as reviewed in (Keshavan et al., in press). Multiple regions implicated as abnormal in both schizophrenia and bipolar disorder, differed in turn from each other, as shown in the lower part of Table 2, with many more temporal lobe regions implicated as abnormal in the (SZ–BP positive) category, perhaps consistent with proposed developmentally based extensive temporal connectivity differences in schizophrenia reviewed by (Swerdlow, 2010).
Results described in this paper may also be useful in direction classification work. Using a comprehensive approach, we have found that connectivity with posterior cingulate and precuneus regions may be the most important in future diagnostic classification and for potential biomarker identification. This is a focus of future work. In addition, recent network studies of structural MRI data have shown some similarities with the functional data and suggest that a direct combination of structural and functional findings will prove useful (Calhoun et al., 2006; Calhoun and Adali, 2009; van den Heuvel et al., 2009; Michael et al., 2010; Segall and Calhoun, 2011; Sui and Calhoun, 2011; Wang et al., 2011; Zalesky et al., 2011). Finally, the use of graph theoretic measures on the ICA output (either using the TCs, Yu et al., 2011, or the maps, Ma et al., in press, as nodes) is straightforward and is a promising direction to pursue for this work.
Conclusion
We have performed a comprehensive analysis of differences in multiple aspects of INs in schizophrenia, bipolar disorder, and healthy controls. One key finding was the prevalence of regions implicated in the default mode network, substructures of which played different roles in identifying distinctions between schizophrenia and bipolar disorder.
Conflict of Interest Statement
The authors declare that the research was conducted in the absence of any commercial or financial relationships that could be construed as a potential conflict of interest.
Acknowledgments
This work was supported by the National Institutes of Health grants R01MH072681 (to K. A. Kiehl), R01EB006841, 5P20RR021938, and R01EB005846 (to V. D. Calhoun), and R01MH43775, R01MH074797, and R01MH077945 (to G. D. Pearlson). We thank the research staff at the Olin Neuropsychiatric Research Center who helped collect and check the data.
Footnotes
References
Abou-Elseoud, A., Starck, T., Remes, J., Nikkinen, J., Tervonen, O., and Kiviniemi, V. (2010). The effect of model order selection in group PICA. Hum. Brain Mapp. 31, 1207–1216.
Allen, E., Erhardt, E., Damaraju, E., Gruner, W., Segall, J., Silva, R., Havlicek, M., Rachakonda, S., Fries, J., Kalyanam, R., Michael, A., Turner, J., Eichele, T., Adelsheim, S., Bryan, A., Bustillo, J. R., Clark, V. P., Feldstein, S., Filbey, F. M., Ford, C., Hutchison, K., Jung, R., Kiehl, K. A., Kodituwakku, P., Komesu, Y., Mayer, A. R., Pearlson, G. D., Phillips, J., Sadek, J., Stevens, M., Teuscher, U., Thoma, R. J., and Calhoun, V. D. (2011). A baseline for the multivariate comparison of resting state networks. Front. Hum. Neurosci. 1, 12.
Allen, E. A., Erhardt, E., Wei, Y., Eichele, T., and Calhoun, V. D. (in press). Capturing inter-subject variability with group independent component analysis of fMRI data: a simulation study. Neuroimage.
Badcock, J. C., Michiel, P. T., and Rock, D. (2005). Spatial working memory and planning ability: contrasts between schizophrenia and bipolar I disorder. Cortex 41, 753–763.
Bahn, S. (2002). Gene expression in bipolar disorder and schizophrenia: new approaches to old problems. Bipolar. Disord. 4(Suppl. 1), 70–72.
Bell, A. J., and Sejnowski, T. J. (1995). An information maximisation approach to blind separation and blind deconvolution. Neural Comput. 7, 1129–1159.
Biswal, B., Yetkin, F. Z., Haughton, V. M., and Hyde, J. S. (1995). Functional connectivity in the motor cortex of resting human brain using echo-planar MRI. Magn. Reson. Med. 34, 537–541.
Biswal, B. B., Mennes, M., Zuo, X. N., Gohel, S., Kelly, C., Smith, S. M., Beckmann, C. F., Adelstein, J. S., Buckner, R. L., Colcombe, S., Dogonowski, A. M., Ernst, M., Fair, D., Hampson, M., Hoptman, M. J., Hyde, J. S., Kiviniemi, V. J., Kotter, R., Li, S. J., Lin, C. P., Lowe, M. J., Mackay, C., Madden, D. J., Madsen, K. H., Margulies, D. S., Mayberg, H. S., McMahon, K., Monk, C. S., Mostofsky, S. H., Nagel, B. J., Pekar, J. J., Peltier, S. J., Petersen, S. E., Riedl, V., Rombouts, S. A., Rypma, B., Schlaggar, B. L., Schmidt, S., Seidler, R. D., Siegle, G. J., Sorg, C., Teng, G. J., Veijola, J., Villringer, A., Walter, M., Wang, L., Weng, X. C., Whitfield-Gabrieli, S., Williamson, P., Windischberger, C., Zang, Y. F., Zhang, H. Y., Castellanos, F. X., and Milham, M. P. (2010). Toward discovery science of human brain function. Proc. Natl. Acad. Sci. U.S.A. 107, 4734–4739.
Bockholt, H. J., Scully, M., Courtney, W., Rachakonda, S., Scott, A., Caprihan, A., Fries, J., Kalyanam, R., Segall, J., De la Garza, R., Lane, S., and Calhoun, V. D. (2010). Mining the mind research network: a novel framework for exploring large scale, heterogeneous translational neuroscience research data sources. Front. Neuroinformatics 3:36. doi: 10.3389/neuro.11.036.2009
Broyd, S. J., Demanuele, C., Debener, S., Helps, S. K., James, C. J., and Sonuga-Barke, E. J. (2009). Default-mode brain dysfunction in mental disorders: a systematic review. Neurosci. Biobehav. Rev. 33, 279–296.
Buckner, R. L., Andrews-Hanna, J. R., and Schacter, D. L. (2008). The brain’s default network: anatomy, function, and relevance to disease. Ann. N. Y. Acad. Sci. 1124, 1–38.
Bush, G., Luu, P., and Posner, M. I. (2000). Cognitive and emotional influences in anterior cingulate cortex. Trends Cogn. Sci. (Regul. Ed.) 4, 215–222.
Calhoun, V. D., and Adali, T. (2009). Feature-based fusion of medical imaging data. IEEE Trans. Inf. Technol. Biomed. 13, 1–10.
Calhoun, V. D., Adali, T., Giuliani, N., Pekar, J. J., Pearlson, G. D., and Kiehl, K. A. (2006). A method for multimodal analysis of independent source differences in schizophrenia: combining gray matter structural and auditory oddball functional data. Hum. Brain Mapp. 27, 47–62.
Calhoun, V. D., Adali, T., Pearlson, G. D., and Pekar, J. J. (2001). A method for making group inferences from functional MRI data using independent component analysis. Hum. Brain Mapp. 14, 140–151.
Calhoun, V. D., Eichele, T., and Pearlson, G. (2009a). Functional brain networks in schizophrenia: a review. Front. Neurosci. 3:17. doi: 10.3389/neuro.09.017.2009
Calhoun, V. D., Liu, J., and Adali, T. (2009b). A review of group ICA for fMRI data and ICA for joint inference of imaging, genetic, and ERP data. Neuroimage 45, 163–172.
Calhoun, V. D., Kiehl, K. A., Liddle, P. F., and Pearlson, G. D. (2004). aberrant localization of synchronous hemodynamic activity in auditory cortex reliably characterizes schizophrenia. Biol. Psychiatry 55, 842–849.
Calhoun, V. D., Kiehl, K. A., and Pearlson, G. D. (2008a). Modulation of temporally coherent brain networks estimated using ICA at rest and during cognitive tasks. Hum. Brain Mapp. 29, 828–838.
Calhoun, V. D., Pearlson, G. D., Maciejewski, P., and Kiehl, K. A. (2008b). Temporal lobe and “default” hemodynamic brain modes discriminate between schizophrenia and bipolar disorder. Hum. Brain Mapp. 29, 1265–1275.
Calhoun, V. D., Wu, L., Kiehl, K. A., Eichele, T., and Pearlson, G. D. (2010). Aberrant processing of deviant stimuli in schizophrenia revealed by fusion of fMRI and EEG data. Acta Neuropsychiatr. 22, 127–138.
Chance, S. A., Casanova, M. F., Switala, A. E., and Crow, T. J. (2008). Auditory cortex asymmetry, altered minicolumn spacing and absence of ageing effects in schizophrenia. Brain 131(Pt 12), 3178–3192.
Cordes, D., Haughton, V. M., Arfanakis, K., Carew, J. D., Turski, P. A., Moritz, C. H., Quigley, M. A., and Meyerand, M. E. (2001). Frequencies contributing to functional connectivity in the cerebral cortex in “resting-state” data. AJNR Am. J. Neuroradiol. 22, 1326–1333.
Curtis, V. A., Dixon, T. A., Morris, R. G., Bullmore, E. T., Brammer, M. J., Williams, S. C., Sharma, T., Murray, R. M., and McGuire, P. K. (2001). Differential frontal activation in schizophrenia and bipolar illness during verbal fluency. J. Affect. Disord. 66, 111–121.
Eichele, T., Debener, S., Calhoun, V. D., Specht, K., Engel, A. K., Hugdahl, K., Cramon, D. Y., and Ullsperger, M. (2008). Prediction of human errors by maladaptive changes in event-related brain networks. Proc. Natl. Acad. Sci. U.S.A. 105, 6173–6178.
Erhardt, E., Rachakonda, S., Bedrick, E., Adali, T., and Calhoun, V. D. (in press). Comparison of multi-subject ICA methods for analysis of fMRI data. Hum. Brain Mapp.
First, M., Spitzer, R. L., Gibbon, M., and Williams, J. B. (1995). Structured Clinical Interview for DSM-IV Axis I Disorders-Patient Edition (SCID-I/P, Version 2.0). New York: New York State Psychiatric Institute.
Ford, J. M., White, P., Lim, K. O., and Pfefferbaum, A. (1994). Schizophrenics have fewer and smaller P300s: a single-trial analysis. Biol. Psychiatry 352, 96–103.
Friston, K., Ashburner, J., Frith, C. D., Poline, J. P., Heather, J. D., and Frackowiak, R. S. (1995). Spatial registration and normalization of images. Hum. Brain Mapp. 2, 165–189.
Fusar-Poli, P., Borgwardt, S., Crescini, A., Deste, G., Kempton, M. J., Lawrie, S., Mc Guire, P., and Sacchetti, E. (2011). Neuroanatomy of vulnerability to psychosis: a voxel-based meta-analysis. Neurosci. Biobehav. Rev. 35, 1175–1185.
Garrity, A., Pearlson, G. D., McKiernan, K., Lloyd, D., Kiehl, K. A., and Calhoun, V. D. (2007). Aberrant “default mode” functional connectivity in schizophrenia. Am. J. Psychiatry 164, 450–457.
Genovese, C. R., Lazar, N. A., and Nichols, T. (2002). Thresholding of statistical maps in functional neuroimaging using the false discovery rate. Neuroimage 15, 870–878.
Glahn, D. C., Bearden, C. E., Niendam, T. A., and Escamilla, M. A. (2004). The feasibility of neuropsychological endophenotypes in the search for genes associated with bipolar affective disorder. Bipolar. Disord. 6, 171–182.
Glahn, D. C., Robinson, J. L., Tordesillas-Gutierrez, D., Monkul, E. S., Holmes, M. K., Green, M. J., and Bearden, C. E. (2010). Fronto-temporal dysregulation in asymptomatic bipolar I patients: a paired associate functional MRI study. Hum. Brain Mapp. 31, 1041–1051.
Goes, F. S., Zandi, P. P., Miao, K., McMahon, F. J., Steele, J., Willour, V. L., Mackinnon, D. F., Mondimore, F. M., Schweizer, B., Nurnberger, J. I. Jr., Rice, J. P., Scheftner, W., Coryell, W., Berrettini, W. H., Kelsoe, J. R., Byerley, W., Murphy, D. L., Gershon, E. S., Bipolar Disorder Phenome, G., Depaulo, J. R. Jr., McInnis, M. G., and Potash, J. B. (2007). Mood-incongruent psychotic features in bipolar disorder: familial aggregation and suggestive linkage to 2p11-q14 and 13q21-33. Am. J. Psychiatry 164, 236–247.
Goodwin, F. K., and Jamison, K. R. (2007). Manic-Depressive Illness. New York, NY: Oxford University Press, 54–59.
Greicius, M. D., Srivastava, G., Reiss, A. L., and Menon, V. (2004). Default-mode network activity distinguishes Alzheimer’s disease from healthy aging: evidence from functional MRI. Proc. Natl. Acad. Sci. U.S.A. 101, 4637–4642.
Guze, S. B., Woodruff, R. A. Jr., and Clayton, P. J. (1975). The significance of psychotic affective disorders. Arch. Gen. Psychiatry 32, 1147–1150.
Hahn, B., Ross, T. J., Yang, Y., Kim, I., Huestis, M. A., and Stein, E. A. (2007). Nicotine enhances visuospatial attention by deactivating areas of the resting brain default network. J. Neurosci. 27, 3477–3489.
Hamilton, L. S., Altshuler, L. L., Townsend, J., Bookheimer, S. Y., Phillips, O. R., Fischer, J., Woods, R. P., Mazziotta, J. C., Toga, A. W., Nuechterlein, K. H., and Narr, K. L. (2009). Alterations in functional activation in euthymic bipolar disorder and schizophrenia during a working memory task. Hum. Brain Mapp. 30, 3958–3969.
Jafri, M., Pearlson, G. D., Stevens, M., and Calhoun, V. D. (2008). A method for functional network connectivity among spatially independent resting-state components in schizophrenia. Neuroimage 39, 1666–1681.
Kay, S. R., Fiszbein, A., and Opler, L. A. (1987). The positive and negative syndrome scale (PANSS) for schizophrenia. Schizophr. Bull. 13, 261–276.
Kempton, M. J., Haldane, M., Jogia, J., Grasby, P. M., Collier, D., and Frangou, S. (2009). Dissociable brain structural changes associated with predisposition, resilience, and disease expression in bipolar disorder. J. Neurosci. 29, 10863–10868.
Keshavan, M., Morris, D. W., Sweeney, J. A., Pearlson, G. D., Thaker, G., Seidman, L. J., Eack, S. M., and Tamminga, C. A. (in press). A dimensional approach to the continuum between bipolar disorder with psychosis and schizophrenia: the Schizo-Bipolar Scale. Schizophr. Res.
Kiehl, K. A., and Liddle, P. F. (2001). An event-related functional magnetic resonance imaging study of an auditory oddball task in schizophrenia. Schizophr. Res. 48, 159–171.
Kiehl, K. A., Stevens, M. C., Celone, K., Kurtz, M., and Krystal, J. H. (2005). Abnormal hemodynamics in schizophrenia during an auditory oddball task. Biol. Psychiatry 57, 1029–1040.
Kim, D., Mathalon, D., Ford, J. M., Mannell, M., Turner, J., Brown, G., Belger, A., Gollub, R. L., Lauriello, J., Wible, C. G., O’Leary, D., Lim, K., Potkin, S., and Calhoun, V. D. (2009). Auditory oddball deficits in schizophrenia: an independent component analysis of the fMRI multisite function BIRN study. Schizophr. Bull. 35, 67–81.
Kiviniemi, V., Starck, T., Remes, J., Long, X., Nikkinen, J., Haapea, M., Veijola, J., Moilanen, I., Isohanni, M., and Zang, Y. F. (2009). Functional segmentation of the brain cortex using high model order group PICA. Hum. Brain Mapp. 30, 3865–3886.
Laird, A. R., Eickhoff, S. B., Li, K., Robin, D. A., Glahn, D. C., and Fox, P. T. (2009). Investigating the functional heterogeneity of the default mode network using coordinate-based meta-analytic modeling. J. Neurosci. 29, 14496–14505.
Lichtenstein, P., Yip, B. H., Bjork, C., Pawitan, Y., Cannon, T. D., Sullivan, P. F., and Hultman, C. M. (2009). Common genetic determinants of schizophrenia and bipolar disorder in Swedish families: a population-based study. Lancet 373, 234–239.
Lynall, M. E., Bassett, D. S., Kerwin, R., McKenna, P. J., Kitzbichler, M., Muller, U., and Bullmore, E. (2010). Functional connectivity and brain networks in schizophrenia. J. Neurosci. 30, 9477–9487.
Ma, S., Correa, N., Li, X., Eichele, T., Calhoun, V. D., and Adali, T. (in press). Automatic identification of functional clusters in fMRI data using spatial information. IEEE Trans. Biomed. Eng.
McIntosh, A. M., Whalley, H. C., McKirdy, J., Hall, J., Sussmann, J. E., Shankar, P., Johnstone, E. C., and Lawrie, S. M. (2008). Prefrontal function and activation in bipolar disorder and schizophrenia. Am. J. Psychiatry 165, 378–384.
Michael, A., Baum, S., White, T., Demirci, O., Andreasen, N. C., Segall, J. M., Jung, R. E., Pearlson, G. D., Clark, V. P., Gollub, R. L., Schulz, S. C., Roffmann, J., Lim, K. O., Ho, B. C., Bockholt, H. J., and Calhoun, V. D. (2010). Does function follow form? Methods to fuse structural and functional brain images show decreased linkage in schizophrenia. Hum. Brain Mapp. 49, 2626–2637.
Muller, T. J., Kalus, P., and Strik, W. K. (2001). The neurophysiological meaning of auditory P300 in subtypes of schizophrenia. World J. Biol. Psychiatry 2, 9–17.
Ongur, D., Lundy, M., Greenhouse, I., Shinn, A. K., Menon, V., Cohen, B. M., and Renshaw, P. F. (2010). Default mode network abnormalities in bipolar disorder and schizophrenia. Psychiatry Res. 183, 59–68.
Pearlson, G. D. (1997). Superior temporal gyrus and planum temporale in schizophrenia: a selective review. Prog. Neuropsychopharmacol. Biol. Psychiatry 21, 1203–1229.
Raichle, M. E., MacLeod, A. M., Snyder, A. Z., Powers, W. J., Gusnard, D. A., and Shulman, G. L. (2001). A default mode of brain function. Proc. Natl. Acad. Sci. U.S.A. 98, 676–682.
Schulze, K. K., Hall, M. H., McDonald, C., Marshall, N., Walshe, M., Murray, R. M., and Bramon, E. (2008). Auditory P300 in patients with bipolar disorder and their unaffected relatives. Bipolar. Disord. 10, 377–386.
Segall, J., and Calhoun, V. D. (2011). Structural and Functional Networks in the Human Brain Proc. Quebec City: HBM.
Skudlarski, P., Jagannathan, K. A., Anderson, K., Stevens, M. C., Calhoun, V. D., and Pearlson, G. D. (2010). Brain connectivity is not only lower but also different in schizophrenia: a combined anatomical and functional approach. Biol. Psychiatry 68, 61–69.
Spitzer, R. L., Williams, J. B., and Gibbon, M. (1996). Structured Clinical Interview for DSM-IV: Non-Patient Edition (SCID-NP). New York, NY: New York State Psychiatric Institute.
Strakowski, S. M., DelBello, M. P., and Adler, C. M. (2005). The functional neuroanatomy of bipolar disorder: a review of neuroimaging findings. Mol. Psychiatry 10, 105–116.
Strasser, H. C., Lilyestrom, J., Ashby, E. R., Honeycutt, N. A., Schretlen, D. J., Pulver, A. E., Hopkins, R. O., Depaulo, J. R., Potash, J. B., Schweizer, B., Yates, K. O., Kurian, E., Barta, P. E., and Pearlson, G. D. (2005). Hippocampal and ventricular volumes in psychotic and nonpsychotic bipolar patients compared with schizophrenia patients and community control subjects: a pilot study. Biol. Psychiatry 57, 633–639.
Sui, J., and Calhoun, V. D. (2011). Discriminating Schizophrenia and Bipolar Disorder by Unique Patterns of Brain Function and Structure Proc. Montreal: ISMRM.
Sui, J., Pearlson, G. D., Adali, T., Kiehl, K. A., Caprihan, A., Liu, J., Yamamoto, J., and Calhoun, V. D. (in press). Discriminating schizophrenia and bipolar disorder by fusing fMRI and DTI in a multimodal CCA+ joint ICA based model. Neuroimage.
Swerdlow, N. R. (2010). Integrative circuit models and their implications for the pathophysiologies and treatments of the schizophrenias. Curr. Top. Behav. Neurosci. 4, 555–583.
Turner, J., Chen, H., Mathalon, D., Allen, E., Mayer, A., Abbott, C., Calhoun, V. D., and Bustillo, J. (in press). Reliability of the amplitude of low-frequency fluctuations in resting state in chronic schizophrenia. Psychol. Res. Neuroimaging.
Uddin, L. Q., Kelly, A. M., Biswal, B. B., Xavier Castellanos, F., and Milham, M. P. (2009). Functional connectivity of default mode network components: correlation, anticorrelation, and causality. Hum. Brain Mapp. 30, 625–637.
van den Heuvel, M. P., Mandl, R. C., Kahn, R. S., and Hulshoff Pol, H. E. (2009). Functionally linked resting-state networks reflect the underlying structural connectivity architecture of the human brain. Hum. Brain Mapp. 30, 3127–3141.
Wang, Q., Su, T. P., Zhou, Y., Chou, K. H., Chen, I. Y., Jiang, T., and Lin, C. P. (2011). Anatomical insights into disrupted small-world networks in schizophrenia. Neuroimage 59, 1085–1093.
Williamson, P. (2007). Are anticorrelated networks in the brain relevant to schizophrenia? Schizophr. Bull. 33, 994.
Williamson, P., and Allman, J. (2011). The Human Illnesses: Neuropsychiatri Disorders and the Nature of the Human Brain. New York, NY: Oxford University Press.
Yu, Q., Sui, J., Rachakonda, S., He, H., Gruner, W., Pearlson, G. D., Kiehl, K. A., and Calhoun, V. D. (2011). Altered topological properties of functional network connectivity in schizophrenia during resting state: a small-world brain network study. PLoS ONE 6, e25423. doi: 10.1371/journal.pone.0025423
Keywords: fMRI, connectivity, networks, intrinsic activity, independent component analysis, ICA, default mode network
Citation: Calhoun VD, Sui J, Kiehl K, Turner J, Allen E and Pearlson G (2012) Exploring the psychosis functional connectome: aberrant intrinsic networks in schizophrenia and bipolar disorder. Front. Psychiatry 2:75. doi: 10.3389/fpsyt.2011.00075
Received: 18 October 2011; Accepted: 12 December 2011;
Published online: 10 January 2012.
Edited by:
Alex Fornito, University of Melbourne, AustraliaReviewed by:
Christopher A. Wall, Mayo Clinic, USAMartijn Van Den Heuvel, University Medical Center Utrecht, Netherlands
Copyright: © 2012 Calhoun, Sui, Kiehl, Turner, Allen and Pearlson. This is an open-access article distributed under the terms of the Creative Commons Attribution Non Commercial License, which permits non-commercial use, distribution, and reproduction in other forums, provided the original authors and source are credited.
*Correspondence: Vince D Calhoun, The Mind Research Network, 1101 Yale Blvd NE, Albuquerque, NM 87106, USA. e-mail: vcalhoun@unm.edu