 Mohammad M. Herzallah1,2*
 Hussain Y. Khdour1,2
 Ahmad B. Taha1
 Amjad M. Elmashala1
 Hamza N. Mousa1
 Mohamad B. Taha1
 Zaid Ghanim1Mahmud M. Sehwail1Adel J. Misk1Tarryn Balsdon3
 Ahmed A. Moustafa3
 Catherine E. Myers4,5Mark A. Gluck2
- 1Palestinian Neuroscience Initiative, Al-Quds University, Abu Dis, Palestine
- 2Center for Molecular and Behavioral Neuroscience, Rutgers University, Newark, NJ, United States
- 3School of Social Sciences and Psychology, Marcs Institute for Brain and Behavior, Western Sydney University, Sydney, NSW, Australia
- 4Department of Veterans Affairs, VA New Jersey Health Care System, East Orange, NJ, United States
- 5Department of Physiology, Pharmacology and Neuroscience, New Jersey Medical School, Rutgers University, Newark, NJ, United States
Major depressive disorder (MDD) is the most common non-motor manifestation of Parkinson’s disease (PD) affecting 50% of patients. However, little is known about the cognitive correlates of MDD in PD. Using a computer-based cognitive task that dissociates learning from positive and negative feedback, we tested four groups of subjects: (1) patients with PD with comorbid MDD, (2) patients with PD without comorbid MDD, (3) matched patients with MDD alone (without PD), and (4) matched healthy control subjects. Furthermore, we used a mathematical model of decision-making to fit both choice and response time data, allowing us to detect and characterize differences between the groups that are not revealed by cognitive results. The groups did not differ in learning accuracy from negative feedback, but the MDD groups (PD patients with MDD and patients with MDD alone) exhibited a selective impairment in learning accuracy from positive feedback when compared to the non-MDD groups (PD patients without MDD and healthy subjects). However, response time in positive feedback trials in the PD groups (both with and without MDD) was significantly slower than the non-PD groups (MDD and healthy groups). While faster response time usually correlates with poor learning accuracy, it was paradoxical in PD groups, with PD patients with MDD having impaired learning accuracy and PD patients without MDD having intact learning accuracy. Mathematical modeling showed that both MDD groups (PD with MDD and MDD alone) were significantly slower than non-MDD groups in the rate of accumulation of information for stimuli trained by positive feedback, which can lead to lower response accuracy. Conversely, modeling revealed that both PD groups (PD with MDD and PD alone) required more evidence than other groups to make responses, thus leading to slower response times. These results suggest that PD patients with MDD exhibit cognitive profiles with mixed traits characteristic of both MDD and PD, furthering our understanding of both PD and MDD and their often-complex comorbidity. To the best of our knowledge, this is the first study to examine feedback-based learning in PD with MDD while controlling for the effects of PD and MDD.
Introduction
Patients with Parkinson’s disease (PD) suffer from a variety of non-motor symptoms, such as sleep disturbances, autonomic dysfunction, gastrointestinal, urogenital and psychiatric problems, as well as cognitive decline (1, 2). Comorbid major depressive disorder (MDD) is the most frequently reported non-motor manifestation of PD in ~40–60% of patients (3–5). Among patients with PD, comorbid MDD (PD-MDD) has the strongest association with declines in health-related quality of life (6–8) and cognitive function (9–12). Several cognitive domains are affected by PD-MDD such as episodic and working memory, language, visuospatial abilities, abstract reasoning, executive function, and reinforcement learning (13–16).
Recently, the focus of cognitive research in PD has been on reinforcement learning (17). A number of studies have shown that patients with PD exhibit deficits in associative learning, such as category-learning tasks where subjects learn through trial and error to make specific responses based on corrective feedback (18–21). Previous research has shown that this learning impairment in PD specifically reflects deficits in learning from positive feedback, but with spared learning from negative feedback (22). We have shown similar selective deficits in learning from positive feedback in patients with MDD (23).
Cognitive impairment in PD and MDD patients is not limited to cognitive accuracy, but extends to “cognitive slowing” (24) where the speed of cognitive processing and responding is affected (25, 26). The level of cognitive slowing in PD has been shown to correlate with the level of motor slowing (27, 28). In other words, motor slowing in PD is inseparable from cognitive slowing as they occur in parallel (29). On the other hand, MDD does not entail a global deficit of the sensorimotor processing. Instead, stimulus preprocessing is unaffected by MDD, while response selection is impaired (30). However, it is unclear whether cognitive deficits in PD-MDD are inherited from PD, MDD, or both.
In this study, we investigate both learning accuracy and response time (RT) in patients with PD-MDD, patients with PD without MDD, patients with MDD without PD, and matched healthy controls (HCs). We used a new version of a computer-based cognitive task that dissociates learning from positive and negative feedback and has been well-validated in both patients with PD and those with MDD (22, 23). We predicted that the learning accuracy of patients with PD-MDD will be similar to that of patients with MDD, while their RT will be similar to patients with PD. The underlying cognitive mechanisms behind these potential differences were further investigated using a mathematical diffusion model that describes the decision-making process as the accumulation of noisy evidence toward a decision threshold (31). To the best of our knowledge, this is the first study to investigate both learning accuracy and RT in patients with PD-MDD, using both experimental and mathematical modeling methods.
Materials and Methods
Participants
We recruited 57 eligible Arabic-speaking participants from different neurological and psychiatric clinics in the West Bank, Palestine. The participant groups were (1) PD-MDD (n = 13), (2) PD without MDD (n = 17), (3) medication-naïve MDD (n = 12), and (4) matched HCs (n = 15).
The stages of PD, as assessed by the Hoehn and Yahr (H&Y) scale (32) ranged from 1.0 to 3.5 (M = 2.18; SD = 0.73). Motor symptoms were assessed using the Unified Parkinson Disease Rating Scale [UPDRS (33)] and ranged from 7 to 67 (M = 28.6; SD = 14.6). Duration since initial diagnosis with PD or MDD ranged from 0 to 15 years (M = 4.73; SD = 3.88). All PD patients were on dopaminergic medications at the time of testing. Out of the 30 PD patients, 20 were on l-DOPA/carbidopa only (9 with MDD and 11 without MDD), 3 on l-DOPA/carbidopa plus the dopamine agonist ropinirole (1 with MDD and 3 without MDD), 3 on l-DOPA/carbidopa plus the dopamine agonist pramipexole (1 with MDD and 2 without MDD), and 3 on ropinirole alone (2 with MDD and 1 without MDD). All participants underwent clinical diagnostic DSM-IV-TR unstructured clinical interviews as well as structured clinical interviews using the Mini International Neuropsychiatric Interview (34) to confirm the diagnosis of MDD in the PD-MDD and the MDD groups, and the absence of MDD and other psychiatric diseases in the PD and HC groups.
Participants’ age ranged from 26 to 81 years. Participants were group matched for age (M = 54.4; SD = 4.5), gender (33 males and 24 females), and years of education (M = 12.8; SD = 2.2), as shown in Table 1. Inclusion criteria for HCs included absence of any psychiatric, neurological, or other disorders that might affect cognition. Exclusion criteria for all participants included psychotropic drug exposure; major medical or neurological illness other than PD and/or MDD; illicit drug use or alcohol abuse within the past year; lifetime history of alcohol or drug dependence; psychiatric disorders other than MDD; current pregnancy; or breastfeeding. This study was carried out in accordance with the recommendations of the Al-Quds University Research Ethics Committee with written informed consent from all subjects. All subjects gave written informed consent in accordance with the Declaration of Helsinki. The protocol was approved by the Al-Quds University Research Ethics Committee.
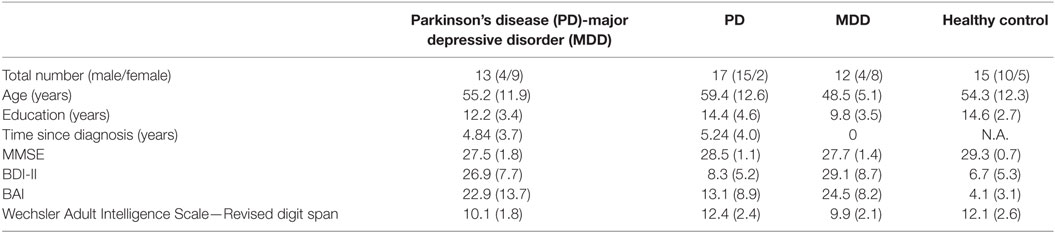
Table 1. Neuropsychological and demographic characteristics of the participants.
Neuropsychological Test Battery
All participants completed the Arabic version (35) of neuropsychological tests: the Mini Mental State Examination (36), the Beck Depression Inventory II (37), the Beck Anxiety Inventory (38), and the Wechsler Adult Intelligence Scale—Revised (WAIS-R) digit span test (39).
There was a significant difference between groups in MMSE scores (Kruskal–Wallis H = 15.117, df = 3, p = 0.002). Post hoc Mann–Whitney tests, with Bonferroni corrected α = 0.008, revealed significant differences between the HCs and both MDD and PD-MDD groups (p = 0.001 and 0.002, respectively), but no significant differences between the three disease groups (MDD, PD-MDD, and PD; p > 0.05). As expected, BDI-II scores differed significantly across groups [F(3, 56) = 43.885, p < 0.001, η2 = 0.71]; specifically, Tukey’s HSD post hoc test revealed significant differences between HC vs. MDD and PD-MDD groups, and PD vs. MDD and PD-MDD groups (all p < 0.001), but no significant differences between HCs and PD or between the MDD and PD-MDD (all p > 0.05). In addition, BAI differed significantly across groups [F(3, 56) = 15.015, p < 0.001, η2 = 0.46]. Tukey’s HSD on BAI results revealed significant differences between HC and all disease groups (all p < 0.05), PD with both MDD and PD-MDD (all p < 0.05) and no significant difference between MDD and PD-MDD (p > 0.05). We used one-way ANOVA to compare WAIS-R digit span results among groups, which revealed a significant effect of group [F(3, 55) = 4.548, p = 0.007, η2 = 0.21]. Tukey’s HSD revealed significant differences only between the PD and MDD groups (p < 0.05). Independent-samples t-test to compare UPDRS scores showed a significant difference between the PD-MDD and PD groups [t(28) = 2.696, p = 0.012, r2 = 0.21]. Finally, Mann–Whitney test on H&Y scores revealed a significant difference between the PD-MDD and PD groups (Mann–Whitney U = 62.5, p = 0.031, r2 = 0.15). The PD-MDD group had significantly higher scores than the PD group in both UPDRS and H&Y.
Computer-Based Cognitive Task
Learning from Positive and Negative Feedback
All participants were administered a new and improved version of the computer-based probabilistic classification task that was used by Bódi et al. (22). For each participant, four images were randomly assigned to be S1, S2, S3, and S4. On each trial, participants viewed one of the four stimuli (Figure 1) and were asked to guess whether it belonged to category A (rain) or B (sun). On any given trial, stimuli S1 and S3 belonged to category A with 90% probability and to category B with 10% probability, while stimuli S2 and S4 belonged to category B with 90% probability and to category A with 10% probability (Table 2). Stimuli S1 and S2 were used in positive-feedback learning trials. Thus, if the participant correctly guessed category membership on a trial with either of these stimuli, a positive feedback of +25 points was received; if the participant guessed incorrectly, no feedback appeared and there was no point gain. Stimuli S3 and S4 were used in the negative-feedback learning trials. Thus, if the participant guessed incorrectly on a trial with either of these stimuli, a negative feedback of −25 points was received; correct guesses received no feedback or point loss. The no-feedback outcome, when it arrived, was ambiguous, as it could signal lack of positive feedback (if received during a trial with S1 or S2) or lack of negative feedback (if received during a trial with S3 or S4).
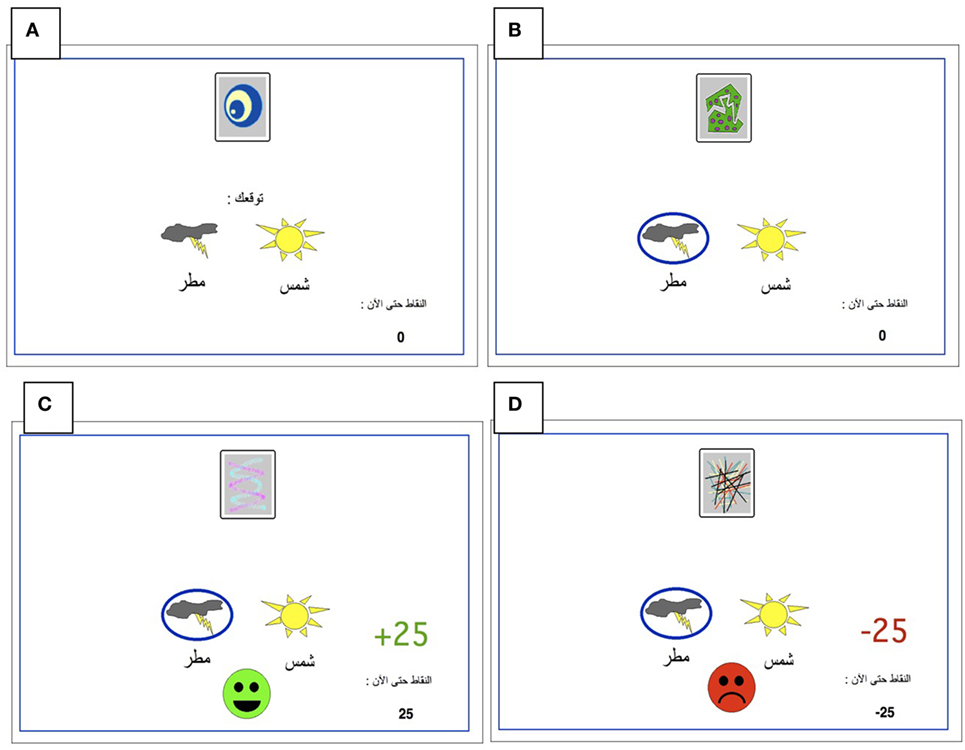
Figure 1. The Arabic-translated feedback-based probabilistic category task. (A) On each trial, the participant sees one of the four stimuli and is asked whether this stimulus predicts rain or sun. (B) No feedback is given for incorrect answers in positive feedback stimuli or correct answers in negative feedback stimuli. (C) For positive feedback stimuli, correct responses get rewarded with visual feedback and 25-point winnings. (D) For negative feedback stimuli, incorrect responses get punished with visual feedback and the loss of 25 points.
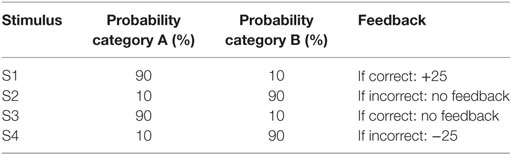
Table 2. Category and feedback structure of probabilistic classification task.
The task was conducted on a Macintosh Macbook, programmed in the SuperCard language. The participant was seated in a quiet testing room at a comfortable viewing distance from the screen. The keyboard was masked except for two keys, labeled “Sun” and “Rain” that the participant could use to enter responses. Participants first completed a practice phase that walked the participant through an example of a correct and an incorrect response to a sample positive-feedback learning trial and an example of a correct and incorrect response to a sample negative-feedback learning trial. These examples used images other than those assigned to S1–S4. The actual task contained 160 trials, separated and randomized into four blocks. Trials were separated by a 2 s interval, during which time the screen was blank. Within each block, each stimulus appeared 10 times, 9 times with the more common outcome (e.g., category A for S1 and S3 and category B for S2 and S4), and once with the less common outcome. Thus, positive-feedback learning trials (S1 and S2) and negative-feedback learning trials (S3 and S4) were intermixed. On each trial, the computer recorded whether the participant made the optimal response (i.e., category A for S1 and S3 and category B for S2 and S4) regardless of the actual outcome.
Mathematical Modeling
Mathematical modeling of the accumulation of evidence toward a decision threshold (the “drift model” of decision-making) offers a formal tool for differentiating between many key variables that underlie the learning process in probabilistic category-learning tasks such as that employed in the current study (31). This model encodes behavioral variables including accuracy, mean RT, and RT distributions into components of cognitive processing. After stimulus onset, a decision is reached via the accumulation of noisy evidence to a decision threshold (the correct decision being reached if the evidence reaches the top threshold). The functioning of this model is illustrated by the schematic in Figure 2 for several different types of learning curves (note: these are not the data from our study, but rather shown for pedagogical purposes only). The drift rate (v) describes the rate at which evidence is accumulated (examples shown by jagged lines in Figure 2) for the correct decision and can be thought of as the efficiency with which evidence is accumulated. The threshold separation (a) describes the amount of evidence required to make a decision, where a larger separation means greater caution in decision-making because more evidence must be accumulated before the decision threshold is reached. The relative starting point (zr) is a bias parameter, where the evidence accumulation process may be more or less biased toward the correct decision when zr is not equal to 0.5. Non-decision time (t0) accommodates for time to execute motor responses (t02, in this case a key press) and sometimes is also thought to include initial stimulus processing (t01), for example, from retina through early occipital cortex. Not shown explicitly on Figure 2 is the difference in decision time for correct and incorrect responses (d); where a positive d indicates faster responding when the correct response is chosen (as would be expected if incorrect decisions were made based on incredibly noisy evidence).
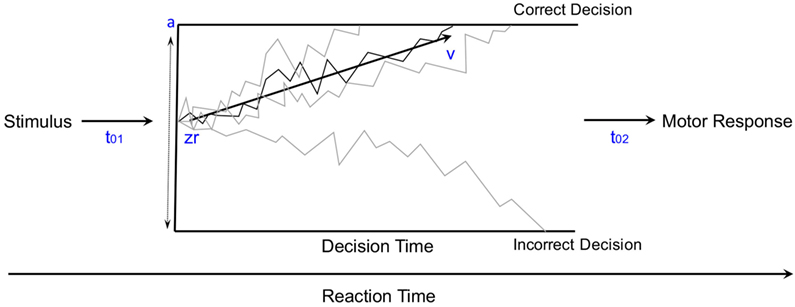
Figure 2. The diffusion model of decision-making illustrated for pedagogical purposes with several different types of learning curves [modified from Ratcliff and McKoon (31)].
Five variants of a diffusion model were fit to the data from our current probabilistic category-learning studies. The basic diffusion model was implemented with five parameters: a (the threshold separation for making a decision), zr (the starting point of the evidence for making a decision—also known as a bias parameter), v (the drift rate or slope of the information accumulation process), t0 (non-decision time or time for response execution), and d (differences in speed of response execution for correct and incorrect responses), as shown in Figure 2. The five variations tested allowed each of these parameters to vary based on whether the stimulus was rewarding or punishing, in order to explain how differences in learning might arise at a cognitive level.
Models were fit using a maximum likelihood approach implemented in fast-dm 30 (40, 41). Data were first cleaned by removing trials where RT was shorter than 0.3 s or longer than 6 s [Ratcliff (42)—although the upper limit on the RT is usually 3 s, here this was raised to accommodate for the PD groups]. The model with the smallest negative log-likelihood was taken as the best fit (since all models contained the same number of parameters). The models are described by one of the five parameters that were varied, one at a time, based on whether the stimulus was rewarding or punishing while the other parameters were not set constant. The average fit is the overall average negative log-likelihood of the model, where smaller values indicate a better fit. The best fitting model was, therefore, the model where we varied the drift rate (v) based on whether the stimulus was rewarding or punishing. The fits are shown in Table 3.
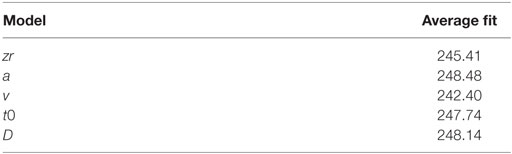
Table 3. Average fit of each model.
Statistical Analysis
The normality of sample distributions (e.g., subject’s accuracy and reaction times) was checked using Kolmogorov–Smirnov tests of the sample’s empirical distribution against a reference normal cumulative distribution function, with the null hypothesis that the sample is from a normal distribution. For the computer-based cognitive task, we used multivariate mixed-design ANOVA, two-way mixed-model ANOVA, one-way ANOVA, independent-samples t-test, and one-sample t-test. The level of significance was set at α = 0.05. Bonferroni corrections were used to protect significance level.
Results
Cognitive Task
We checked the normality of the data used in our analyses. All learning accuracy and RT data were normally distributed according to the Kolmogorov–Smirnov test (p > 0.1). Furthermore, we used one-sample t-test to assess whether subjects in different groups learned from positive and negative feedback better than chance (50%), with Bonferroni corrected α = 0.006 to protect significance level. We used the percentage of optimal responses in the fourth block of trials as the independent variable. Subjects in the HC and PD groups learned significantly better than chance from positive feedback but those in the PD-MDD and MDD groups did not [PD-MDD: t(12) = 1.104, p = 0.291; MDD: t(11) = 0.831, p = 0.424; PD: t(16) = 3.395, p = 0.004; and HC: t(14) = 7.962, p < 0.001]. For negative feedback, subjects in all groups learned significantly better than chance [PD-MDD: t(12) = 4.629, p = 0.001; MDD: t(11) = 3.617, p = 0.004; PD: t(16) = 7.500, p < 0.001; and HC: t(16) = 7.231, p < 0.001].
We used kernel density estimates to qualitatively examine subjects’ learning accuracy and RT in the fourth block of positive and negative feedback trials. As shown in Figure 3A, the MDD groups’ (PD-MDD and MDD) highest density in learning from positive feedback (around 60% optimal responses) was non-overlapping with that of the PD and HC groups, which were almost identical (around 95% optimal responses). In Figure 3B, although the density peaks in learning from negative feedback were not clearly separated as in positive feedback, the MDD groups (PD-MDD and MDD, around 60% optimal responses) were different from the PD (around 90% optimal responses) and HC (around 90% optimal responses) groups.
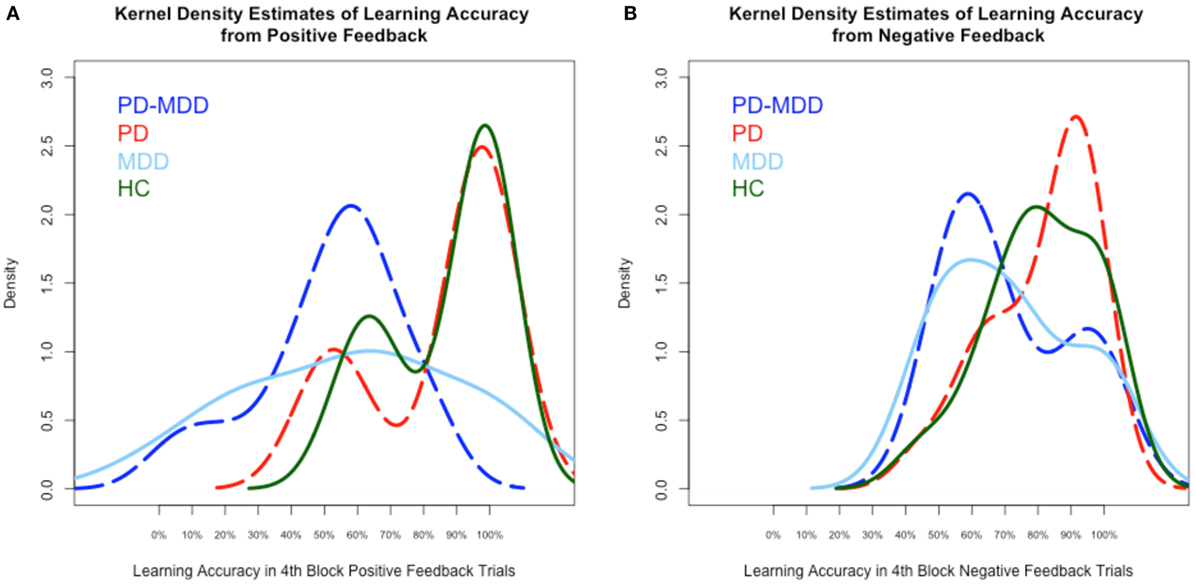
Figure 3. Kernel density estimates of performance on the positive and negative feedback learning task. (A) Density of subject scores in the fourth block of positive feedback stimuli. (B) Density of subject scores in the fourth block of negative feedback stimuli. In this and subsequent graphs, PD, Parkinson’s disease; MDD, major depressive disorder; PD-MDD, PD with comorbid MDD; HC, healthy control.
RT kernel density estimates exhibited a different pattern than learning accuracy, as shown in Figure 4. In the RT to positive feedback, the PD groups’ (PD-MDD and PD) density peaks (around 2,000 ms) were different from the MDD peak (around 1,500 ms) and the HC peak (around 1,000 ms) as shown in Figure 4A. In the RT to negative feedback, as shown in Figure 4B, the density peak of PD-MDD group (around 3,000 ms) was different from the rest of the group peaks (all around 1,500 ms).
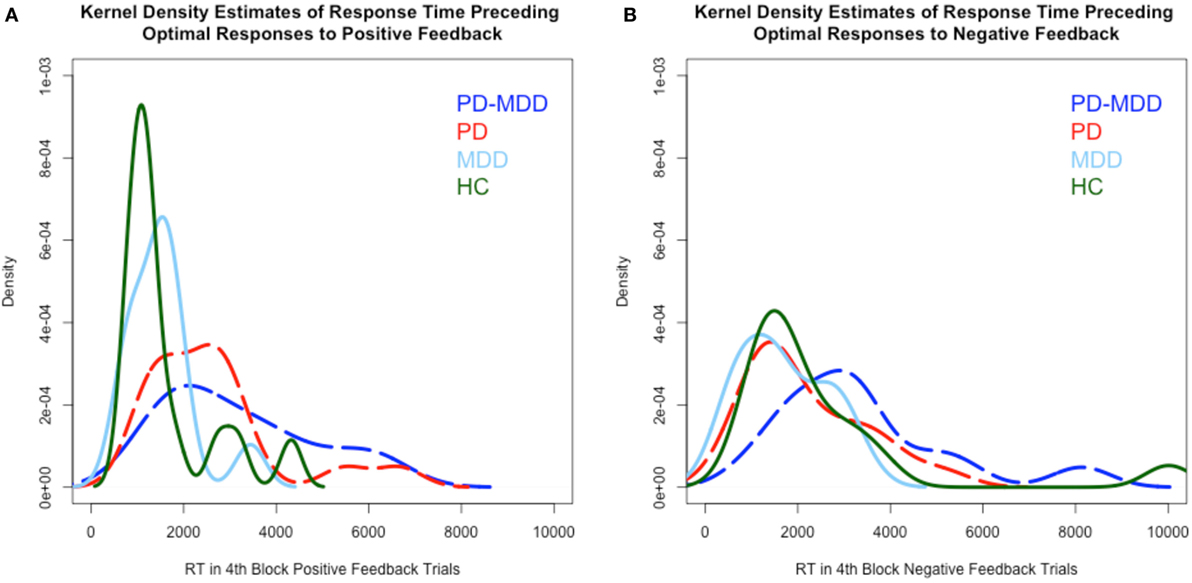
Figure 4. Kernel density estimates of RT in positive and negative feedback trials. (A) Density of subject RT in the fourth block of positive feedback stimuli. (B) Density of subject RT in the fourth block of negative feedback stimuli. In this and subsequent graphs, PD, Parkinson’s disease; MDD, major depressive disorder; PD-MDD, PD with comorbid MDD; HC, healthy control.
We used a multivariate mixed-model ANOVA to analyze our results, with feedback type (positive feedback and negative feedback) as the within-subject variable, groups PD (with PD and without PD) and MDD (with MDD and without MDD) as between-subject variables, and the mean percentage optimal response across blocks (positive feedback accuracy and negative feedback accuracy) as well as the average RT across blocks (RT to positive feedback and RT to negative feedback) as the dependent variables. Box’s test of equality of covariance matrices was significant [Box’s M = 71.565, F(30, 6,029.494) = 2.034, p = 0.001]. Therefore, we used F and p values generated by Pillai’s Trace criterion. Levene’s tests of equality of error variance and Mauchly’s test of sphericity were not significant.
As described below, there was a significant multivariate effect of PD and MDD. Furthermore, there were approaching significance interactions between feedback type and PD, feedback type and MDD, and feedback type and PD and MDD (η2 represents effect size and β represents post hoc statistical power).
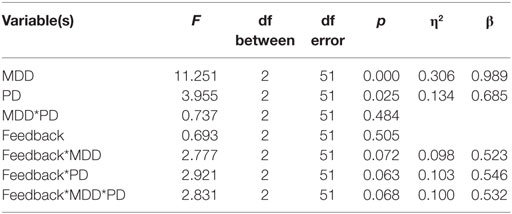
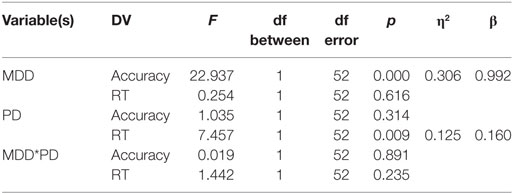
Univariate between-subject tests are summarized in the table below. Results revealed a significant effect of MDD on the accuracy dependent variable but not on the RT-dependent variable. Conversely, PD had a significant effect on the RT-dependent variable but not the accuracy-dependent variable. However, there was no interaction between MDD and PD in either accuracy or RT (η2 represents effect size, β represents post hoc statistical power).
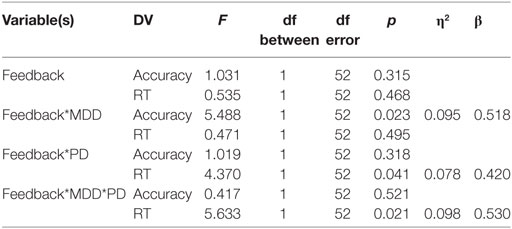
Univariate within-subject comparisons revealed a significant effect of interaction between feedback type and MDD on accuracy, a significant effect of interaction between feedback type and PD on RT, and an effect of the three-way interaction between feedback type, MDD, and PD on RT. Results are summarized below (η2 represents effect size, β represents post hoc statistical power).
To explore the effect of interaction between feedback type and MDD on accuracy, we used two independent-samples t-tests for accuracy feedback type (positive feedback and negative feedback), with the MDD group (with or without MDD) as the between-subject variable, and the mean percentage optimal response across blocks as the dependent variable (positive feedback accuracy and negative feedback accuracy). There was a significant effect of MDD on positive feedback accuracy [t(55) = −4.487, p < 0.001, Cohen’s D = 1.198; Figure 5A] but not on negative feedback accuracy [t(36.404) = −1.636, p = 0.133; Figure 5B].
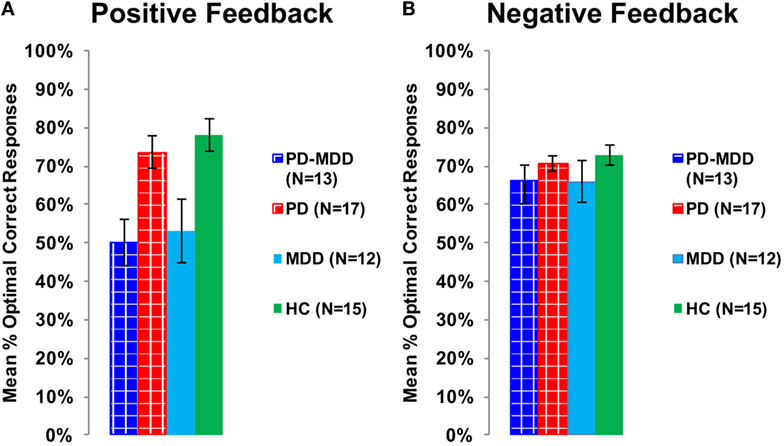
Figure 5. Performance on the positive and negative feedback learning task. (A) The mean percentage of optimal responses for the positive feedback stimuli. (B) The mean number of optimal responses in overall for the negative feedback stimuli. In this and subsequent graphs, PD, Parkinson’s disease; MDD, major depressive disorder; PD-MDD, PD with comorbid MDD; HC, healthy control; error bars show SEM.
Furthermore, we used two independent-samples t-tests on RT to feedback types to study the interaction between feedback type and PD on RT. The PD group (with or without MDD) was the independent variable, while RT to positive or negative feedback was the dependent variable. There was a significant effect of PD on RT to positive feedback [t(48.041) = 3.172, p = 0.002, Cohen’s D = 0.850; Figure 6A] and an approaching-significance effect on RT to negative feedback [t(55) = 1.860, p = 0.068, Cohen’s D = 0.498; Figure 6B].
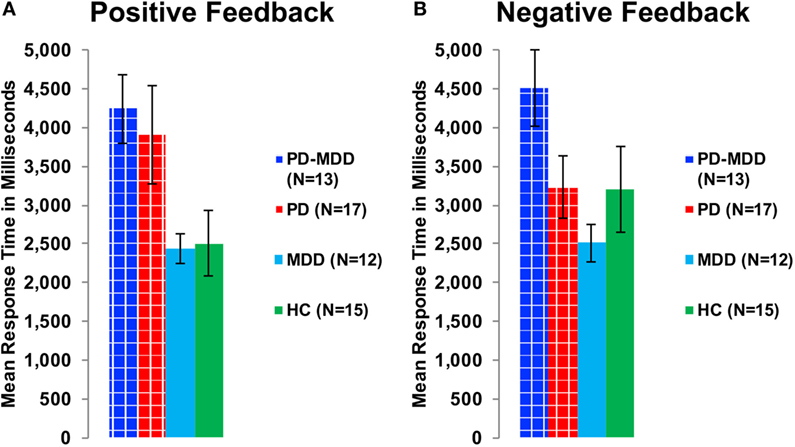
Figure 6. RT in milliseconds during optimally answered positive and negative feedback learning trials. (A) The mean RT during positive feedback trials. (B) The mean RT during negative feedback trials.
To investigate the effect of the three-way interaction between feedback type, MDD and PD on RT, we used two one-way ANOVA tests on RT to positive and negative feedback with group (PD-MDD, MDD, PD, and HC) as the between-subject variable. There was a significant effect of group on response in positive feedback [F(3, 53) = 3.322, p = 0.027, η2 = 0.161] and negative feedback [F(3, 53) = 2.843, p = 0.046, η2 = 0.139]. Post hoc Tukey’s HSD test on RT to positive feedback revealed no significant pairwise comparisons, although differences between PD-MDD, PD, MDD, and HC were approaching significance (<0.1). For RT to negative feedback, there was one post hoc significant difference between PD-MDD and MDD.
Mathematical Modeling
To analyze modeling results similar to cognitive results, we also used two-way mixed-design ANOVA, with extracted parameter type as the within-subject variable [threshold separation (a), non-decision time (s), difference in decision time (d), relative starting point (zr), drift rate for positive feedback (v1), and drift rate for negative feedback (v2)], MDD (present or not) and PD (present or not) as between-subject variables, and values for the six parameters as the dependent variables. Box’s test of equality of covariance matrices was significant [Box’s M = 71.565, F(30, 6,029.494) = 2.034, p = 0.001]. Therefore, we used F and p values generated by the Pillai’s Trace criterion. Levene’s test of equality of error variance was not significant for all dependent variables except for v2 [F(3, 52) = 4.452, p = 0.007]. Mauchly’s test of sphericity also produced a significant result (Mauchly’s W = 0.381, χ2 = 48.334, df = 14, p < 0.001). Therefore, we reported the Greenhouse–Geisser-corrected df in all within-subject comparisons.
There was a significant effect of parameters [F(3.883, 201.908) = 341.341, p < 0.001, η2 = 0.868], a significant interaction between parameters and MDD [F(3.883, 201.908) = 3.939, p = 0.005, η2 = 0.070], and a significant interaction between parameters and PD [F(3.883, 201.908) = 2.550, p = 0.042, η2 = 0.047]. There was no significant interaction between MDD, PD, and parameters [F(3.883, 201.908) = 0.600, p = 0.658]. Furthermore, there was neither a significant effect of MDD [F(1, 52) = 2.171, p = 0.147], PD [F(1, 52) = 1.309, p = 0.258], nor a significant interaction between MDD and PD [F(1, 52) = 1.046, p = 0.311].
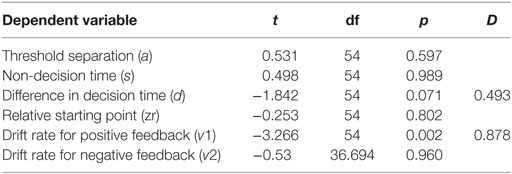
We used six independent-samples t-tests to explore the interaction between parameters and MDD. The t-tests compared parameter values between the two MDD groups (PD-MDD and the MDD). There was a significant effect of MDD on the drift rate for positive feedback stimuli (Figure 7). Furthermore, there was an-approaching significance effect of MDD on the difference in decision time (Figure 7). Results are summarized below. D represents effect size as measured by Cohen’s D.
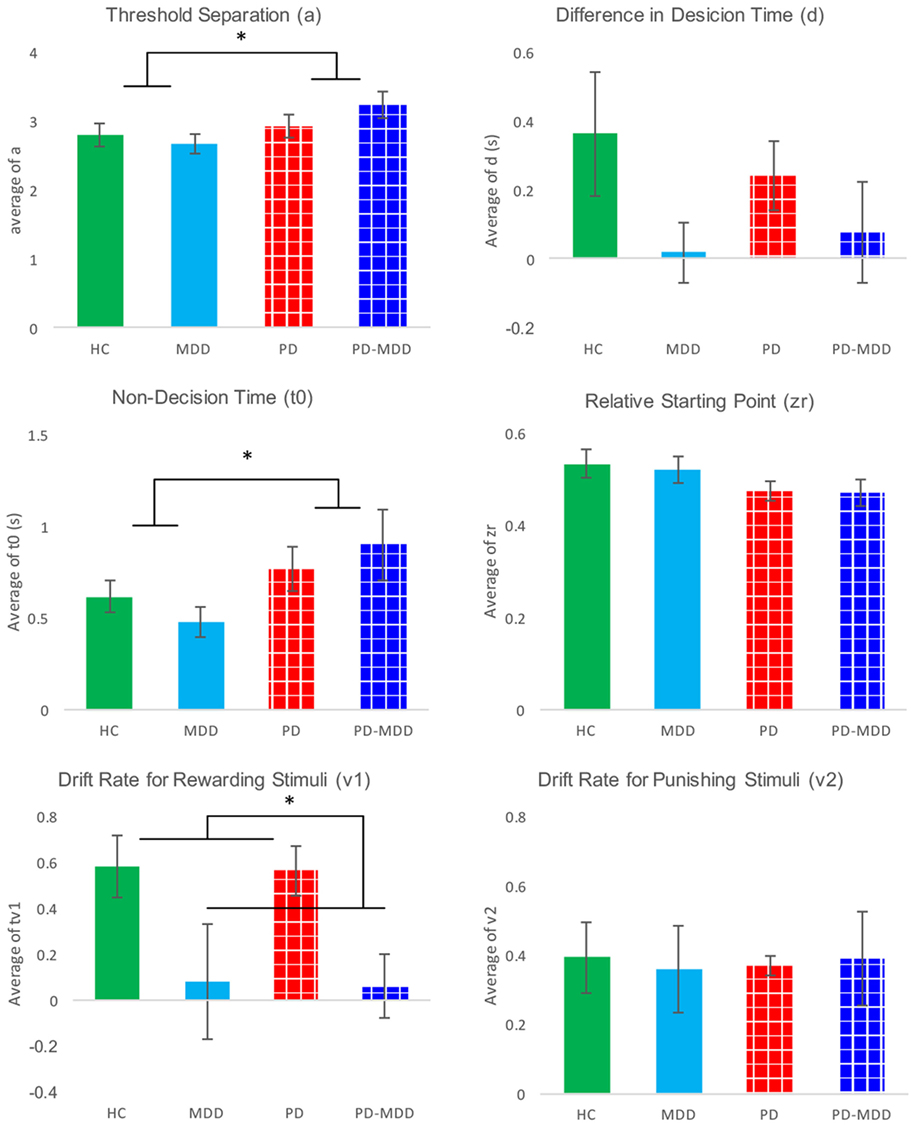
Figure 7. Average parameter values for each group. Significant differences are marked by *. These differences are shown between groups (participants with PD vs. not and participants with MDD vs. not).
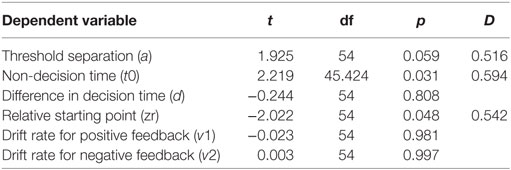
Furthermore, we investigated the interaction between parameters and PD using six independent-samples t-tests. The t-tests compared parameter values between the two PD groups (PD-MDD and the PD). As described below, PD had a significant effect on non-decision time and relative starting point. In addition, there was a short of significance effect of PD on threshold separation (Figure 7). D represents effect size as measured by Cohen’s D.
Discussion
The presence of MDD (in the PD-MDD and MDD groups) was associated with a selective deficit in learning accuracy from positive feedback. Conversely, the presence of PD (in the PD-MDD and PD groups) was associated with slower RT to positive feedback stimuli. Modeling results showed that the MDD groups had similar drift rates toward positive feedback and, therefore, learned less efficiently. On the other hand, the PD groups had higher threshold and, therefore, needed more evidence to make responses. To the best of our knowledge, this is the first study to examine learning from positive and negative feedback in PD with MDD, while properly controlling for the effects of PD and MDD.
It is well established that PD-MDD exacerbates cognitive decline associated with PD (13–16). In particular, our previous research suggests that patients with both PD and MDD were significantly more impaired on associative learning than patients with PD alone (43). Imaging studies found that higher BDI scores in patients with PD were associated with lower ability to utilize positive feedback (44). These results are in agreement with the current findings that patients with PD-MDD are impaired on learning from positive feedback, which also extend previous literature in an Arabic-speaking population.
Our results show that the choice (decision making) performance of patients with PD-MDD resembled that of patients with MDD. Converging evidence suggests that MDD, similar to unmedicated PD, is associated with a selective deficit in learning from positive feedback (19, 22, 23, 45, 46). In our study, medicated patients with PD learned as well as healthy subjects from positive feedback, while medicated PD-MDD and medication-naïve MDD patients did not. This argues that the positive feedback learning deficit in PD-MDD might be attributed to the MDD part of PD-MDD.
Dopaminergic neurotransmission has been associated with various cognitive domains (47). Previous studies found that patients with PD-MDD had more pronounced dopaminergic dysfunction in the substantia nigra pars compacta when compared to PD patients without MDD (48). Furthermore, both patients with PD and MDD showed reduced activation during reward anticipation in the putamen, caudate, nucleus accumbens, and dorsal anterior cingulate (49–51). Conversely, some studies suggested that striatal dopamine deficiency did not correlate with indices of MDD in PD, suggesting an extra striatal or non-dopaminergic mechanism (52, 53). In our study, although patients with PD-MDD were on dopaminergic medications, it does not seem that this remediation of dopamine levels affected cognitive function.
Patients with PD-MDD and patients with PD were significantly slower than MDD and HCs in responding to positive feedback stimuli. It is evident from our data that this deficit in RT is associated with the PD part of PD-MDD, not the MDD part. This could not be attributed to motor slowness in PD (25, 26) given that there was no difference between groups in response to negative feedback stimuli.
Relying on behavioral results only, it is not possible to tease apart the effects of processing speed, accumulation of cognitive evidence, rate of accumulation of cognitive evidence, and valence. Hence, we used a diffusion mathematical model to further analyze our behavioral data. Modeling showed that the RT differences for PD and PD-MDD groups were not simply the result of motor differences, but could also be influenced by patients with PD requiring more evidence to make their responses, as seen by the effect of PD on the estimate of their threshold separation (a) (Figure 7). Patients with PD (both PD and PD-MDD) showed significantly greater non-decision time (t0) as expected. However, their decision-making also differed in their threshold separation (a) revealing them to be more cautious responders, as they require more evidence to be collected before making a response. Patients with PD also tended to show a reduced bias; however, this did not reach significance. The difference in accuracy in learning from positive feedback seen in patients with MDD (MDD and PD-MDD groups) was explained by a significant difference in their drift rate for the positive feedback stimuli (v1). This difference was not present in the drift rate for negative feedback stimuli (v2) (Figure 7). This means that compared to HCs and patients with PD and not MDD, the MDD and PD-MDD groups were accumulating evidence for responses to positive feedback stimuli far slower, which could be the result of an impairment in learning from positive feedback. There was also a trend for a reduced d (difference in speed of response) in patients with MDD; however, this did not reach significance.
As shown in Figure 8, we used average parameter values extracted from our model to calculate predicted RT density functions for the four groups. The peak positions in the density distribution match those in Figure 4 from experimental RT data. As predicted, non-decision time (t0) was found to be significantly longer in PD and PD-MDD groups, this can be seen from the longer time taken for the response distribution to begin reaching threshold (where the distribution “takes off” from the x-axis). Increased threshold separation (a) results in the distribution having a greater variance, as can be seen from the separation of the peaks along the x-axis, where the PD and PD-MDD groups show significantly greater threshold separation. The slope of the evidence accumulation for positive stimuli (v1) also differed between groups where patients with MDD and PD-MDD showed a slower evidence accumulation rate. This can be seen from the height of the peaks of the distributions, with a lower peak for correct responses and a larger peak for incorrect responses in MDD and PD-MDD groups.
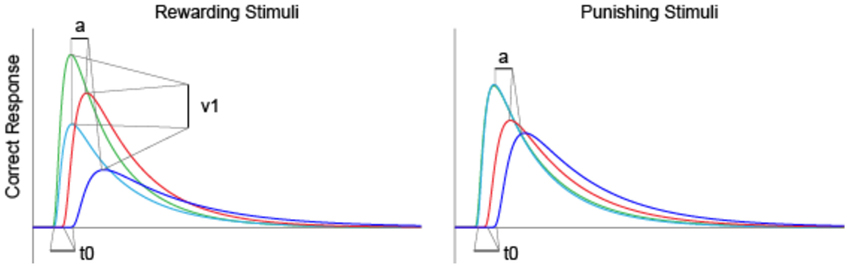
Figure 8. Predicted RT distributions based on average parameter values for each group. Only parameter values that were found to differ significantly between groups are outlined. Area under the curve represents density predicted RT of subjects.
Limitations and Future Directions
All PD patients in our study were maintained on regular doses of dopaminergic medication. Furthermore, the MDD group received no medications. There was no way to examine whether the PD-associated deficit predated the MDD-associated deficit, or the opposite, in the PD-MDD group. Future studies ought to focus on the effects of dopaminergic medications on cognitive function in PD-MDD. Furthermore, MDD should be studied longitudinally in medication-naïve patients with PD to investigate the chronological order of cognitive deficits associated with PD-MDD.
Ethics Statement
This study was carried out in accordance with the research protocol that was approved by the Al-Quds University Research Ethics Committee. Written informed consent was obtained from all subjects in accordance with the Declaration of Helsinki.
Author Contributions
MH: study design, cognitive and modeling data analysis, and manuscript writing. HK: data collection, demographic data analysis, and manuscript writing. AT and AE: data collection, neuropsychological data analysis, and manuscript writing. HM: data collection and manuscript writing. MT: data collection and manuscript writing. ZG, MS, and AM: patient recruitment and clinical assessment. TB: computational modeling, modeling data analysis, and manuscript writing. AM: computational modeling and manuscript writing. CM and MG: manuscript writing.
Conflict of Interest Statement
The authors declare that the research was conducted in the absence of any commercial or financial relationships that could be construed as a potential conflict of interest.
The reviewer, DJ, and handling editor declared their shared affiliation, and the handling editor states that the process nevertheless met the standards of a fair and objective review.
Acknowledgments
We thank Dr. Joman Y. Natsheh for her assistance in data analysis. Also, we thank Dr. Samih Darwazah (Hikma Pharmaceuticals LLC.), Mr. Ghaith Sukhtian (GMS Holdings), and Mr. Fadi Ghandour (Aramex) for supporting personnel involved in this research paper.
References
1. Kadastik-Eerme L, Muldmaa M, Lilles S, Rosenthal M, Taba N, Taba P. Nonmotor features in Parkinson’s disease: what are the most important associated factors? Parkinsons Dis (2016) 2016:4370674. doi: 10.1155/2016/4370674
2. Reichmann H, Brandt MD, Klingelhoefer L. The nonmotor features of Parkinson’s disease: pathophysiology and management advances. Curr Opin Neurol (2016) 29(4):467–73. doi:10.1097/WCO.0000000000000348
3. Cummings JL. Depression and Parkinson’s disease: a review. Am J Psychiatry (1992) 149(4):443–54. doi:10.1176/ajp.149.4.443
4. Slaughter JR, Slaughter KA, Nichols D, Holmes SE, Martens MP. Prevalence, clinical manifestations, etiology, and treatment of depression in Parkinson’s disease. J Neuropsychiatry Clin Neurosci (2001) 13(2):187–96. doi:10.1176/jnp.13.2.187
5. Kulisevsky J, Pagonabarraga J, Pascual-Sedano B, Garcia-Sanchez C, Gironell A. Prevalence and correlates of neuropsychiatric symptoms in Parkinson’s disease without dementia. Mov Disord (2008) 23(13):1889–96. doi:10.1002/mds.22246
6. Weintraub D, Moberg PJ, Duda JE, Katz IR, Stern MB. Effect of psychiatric and other nonmotor symptoms on disability in Parkinson’s disease. J Am Geriatr Soc (2004) 52(5):784–8. doi:10.1111/j.1532-5415.2004.52219.x
7. Visser M, van Rooden SM, Verbaan D, Marinus J, Stiggelbout AM, van Hilten JJ. A comprehensive model of health-related quality of life in Parkinson’s disease. J Neurol (2008) 255(10):1580–7. doi:10.1007/s00415-008-0994-4
8. Gallagher DA, Lees AJ, Schrag A. What are the most important nonmotor symptoms in patients with Parkinson’s disease and are we missing them? Mov Disord (2010) 25(15):2493–500. doi:10.1002/mds.23394
9. Cubo E, Bernard B, Leurgans S, Raman R. Cognitive and motor function in patients with Parkinson’s disease with and without depression. Clin Neuropharmacol (2000) 23(6):331–4. doi:10.1097/00002826-200011000-00006
10. Schrag A, Jahanshahi M, Quinn NP. What contributes to depression in Parkinson’s disease? Psychol Med (2001) 31(1):65–73. doi:10.1017/S0033291799003141
11. Fleminger S. Left-sided Parkinson’s disease is associated with greater anxiety and depression. Psychol Med (1991) 21(3):629–38. doi:10.1017/S0033291700022261
12. Gotham AM, Brown RG, Marsden CD. Depression in Parkinson’s disease: a quantitative and qualitative analysis. J Neurol Neurosurg Psychiatry (1986) 49(4):381–9. doi:10.1136/jnnp.49.4.381
13. Costa A, Peppe A, Carlesimo GA, Pasqualetti P, Caltagirone C. Major and minor depression in Parkinson’s disease: a neuropsychological investigation. Eur J Neurol (2006) 13(9):972–80. doi:10.1111/j.1468-1331.2006.01406.x
14. Stefanova E, Potrebic A, Ziropadja L, Maric J, Ribaric I, Kostic VS. Depression predicts the pattern of cognitive impairment in early Parkinson’s disease. J Neurol Sci (2006) 248(1–2):131–7. doi:10.1016/j.jns.2006.05.031
15. Emre M. What causes mental dysfunction in Parkinson’s disease? Mov Disord (2003) 18(Suppl 6):S63–71. doi:10.1002/mds.10565
16. Kuzis G, Sabe L, Tiberti C, Leiguarda R, Starkstein SE. Cognitive functions in major depression and Parkinson disease. Arch Neurol (1997) 54(8):982–6. doi:10.1001/archneur.1997.00550200046009
17. Robbins TW, Cools R. Cognitive deficits in Parkinson’s disease: a cognitive neuroscience perspective. Mov Disord (2014) 29(5):597–607. doi:10.1002/mds.25853
18. Cools R, Barker RA, Sahakian BJ, Robbins TW. Enhanced or impaired cognitive function in Parkinson’s disease as a function of dopaminergic medication and task demands. Cereb Cortex (2001) 11(12):1136–43. doi:10.1093/cercor/11.12.1136
19. Frank MJ, Seeberger LC, O’Reilly RC. By carrot or by stick: cognitive reinforcement learning in parkinsonism. Science (2004) 306(5703):1940–3. doi:10.1126/science.1102941
20. Myers CE, Shohamy D, Gluck MA, Grossman S, Kluger A, Ferris S, et al. Dissociating hippocampal versus basal ganglia contributions to learning and transfer. J Cogn Neurosci (2003) 15(2):185–93. doi:10.1162/089892903321208123
21. Shohamy D, Myers CE, Geghman KD, Sage J, Gluck MA. l-DOPA impairs learning, but spares generalization, in Parkinson’s disease. Neuropsychologia (2006) 44(5):774–84. doi:10.1016/j.neuropsychologia.2005.07.013
22. Bódi N, Keri S, Nagy H, Moustafa A, Myers CE, Daw N, et al. Reward-learning and the novelty-seeking personality: a between- and within-subjects study of the effects of dopamine agonists on young Parkinson’s patients. Brain (2009) 132(Pt 9):2385–95. doi:10.1093/brain/awp094
23. Herzallah MM, Moustafa AA, Natsheh JY, Abdellatif SM, Taha MB, Tayem YI, et al. Learning from negative feedback in patients with major depressive disorder is attenuated by SSRI antidepressants. Front Integr Neurosci (2013) 7:67. doi:10.3389/fnint.2013.00067
24. Revonsuo A, Portin R, Koivikko L, Rinne JO, Rinne UK. Slowing of information processing in Parkinson’s disease. Brain Cogn (1993) 21(1):87–110. doi:10.1006/brcg.1993.1007
25. Lee AC, Harris JP, Calvert JE. Impairments of mental rotation in Parkinson’s disease. Neuropsychologia (1998) 36(1):109–14. doi:10.1016/S0028-3932(97)00017-1
26. Rogers D. Bradyphrenia in parkinsonism: a historical review. Psychol Med (1986) 16(2):257–65. doi:10.1017/S0033291700009077
27. Majsak MJ, Kaminski T, Gentile AM, Flanagan JR. The reaching movements of patients with Parkinson’s disease under self-determined maximal speed and visually cued conditions. Brain (1998) 121(Pt 4):755–66. doi:10.1093/brain/121.4.755
28. Sawamoto N, Honda M, Hanakawa T, Fukuyama H, Shibasaki H. Cognitive slowing in Parkinson’s disease: a behavioral evaluation independent of motor slowing. J Neurosci (2002) 22(12):5198–203.
29. Sawamoto N, Honda M, Hanakawa T, Aso T, Inoue M, Toyoda H, et al. Cognitive slowing in Parkinson disease is accompanied by hypofunctioning of the striatum. Neurology (2007) 68(13):1062–8. doi:10.1212/01.wnl.0000257821.28992.db
30. Azorin J-M, Benhaim P, Hasbroucq T, Possamaï C-A. Stimulus preprocessing and response selection in depression: a reaction time study. Acta Psychol (1995) 89(2):95–100. doi:10.1016/0001-6918(94)00024-B
31. Ratcliff R, McKoon G. The diffusion decision model: theory and data for two-choice decision tasks. Neural Comput (2008) 20(4):873–922. doi:10.1162/neco.2008.12-06-420
32. Hoehn MM, Yahr MD. Parkinsonism: onset, progression and mortality. Neurology (1967) 17(5):427–42. doi:10.1212/WNL.17.5.427
33. Ramaker C, Marinus J, Stiggelbout AM, Van Hilten BJ. Systematic evaluation of rating scales for impairment and disability in Parkinson’s disease. Mov Disord (2002) 17(5):867–76. doi:10.1002/mds.10248
34. Amorim P, Lecrubier Y, Weiller E, Hergueta T, Sheehan D. DSM-IH-R psychotic disorders: procedural validity of the mini international neuropsychiatric interview (MINI). Concordance and causes for discordance with the CIDI. Eur Psychiatry (1998) 13(1):26–34. doi:10.1016/S0924-9338(97)86748-X
35. Inzelberg R, Schechtman E, Abuful A, Masarwa M, Mazarib A, Strugatsky R, et al. Education effects on cognitive function in a healthy aged Arab population. Int Psychogeriatr (2007) 19(3):593–603. doi:10.1017/S1041610206004327
36. Folstein MF, Folstein SE, McHugh PR. “Mini-mental state”. A practical method for grading the cognitive state of patients for the clinician. J Psychiatr Res (1975) 12(3):189–98. doi:10.1016/0022-3956(75)90026-6
37. Beck AT, Steer RA, Ball R, Ranieri W. Comparison of Beck depression inventories-IA and -II in psychiatric outpatients. J Pers Assess (1996) 67(3):588–97. doi:10.1207/s15327752jpa6703_13
38. Beck AT, Epstein N, Brown G, Steer RA. An inventory for measuring clinical anxiety: psychometric properties. J Consult Clin Psychol (1988) 56(6):893–7. doi:10.1037/0022-006X.56.6.893
39. Schroeder RW, Twumasi-Ankrah P, Baade LE, Marshall PS. Reliable digit span: a systematic review and cross-validation study. Assessment (2012) 19(1):21–30. doi:10.1177/1073191111428764
40. Voss A, Voss J, Lerche V. Assessing cognitive processes with diffusion model analyses: a tutorial based on fast-dm-30. Front Psychol (2015) 6:336. doi:10.3389/fpsyg.2015.00336
41. Voss A, Voss J. Fast-dm: a free program for efficient diffusion model analysis. Behav Res Methods (2007) 39(4):767–75. doi:10.3758/BF03192967
42. Ratcliff R. Methods for dealing with reaction time outliers. Psychol Bull (1993) 114(3):510–32. doi:10.1037/0033-2909.114.3.510
43. Herzallah MM, Moustafa AA, Misk AJ, Al-Dweib LH, Abdelrazeq SA, Myers CE, et al. Depression impairs learning whereas anticholinergics impair transfer generalization in Parkinson patients tested on dopaminergic medications. Cogn Behav Neurol (2010) 23(2):98–105. doi:10.1097/WNN.0b013e3181df3048
44. Ravizza SM, Goudreau J, Delgado MR, Ruiz S. Executive function in Parkinson’s disease: contributions of the dorsal frontostriatal pathways to action and motivation. Cogn Affect Behav Neurosci (2012) 12(1):193–206. doi:10.3758/s13415-011-0066-6
45. Pizzagalli DA, Iosifescu D, Hallett LA, Ratner KG, Fava M. Reduced hedonic capacity in major depressive disorder: evidence from a probabilistic reward task. J Psychiatr Res (2008) 43(1):76–87. doi:10.1016/j.jpsychires.2008.03.001
46. Herzallah MM, Moustafa AA, Natsheh JY, Danoun OA, Simon JR, Tayem YI, et al. Depression impairs learning, whereas the selective serotonin reuptake inhibitor, paroxetine, impairs generalization in patients with major depressive disorder. J Affect Disord (2013) 151(2):484–92. doi:10.1016/j.jad.2013.06.030
47. Arias-Carrion O, Poppel E. Dopamine, learning, and reward-seeking behavior. Acta Neurobiol Exp (Wars) (2007) 67(4):481–8.
48. Walter U, Hoeppner J, Prudente-Morrissey L, Horowski S, Herpertz SC, Benecke R. Parkinson’s disease-like midbrain sonography abnormalities are frequent in depressive disorders. Brain (2007) 130(Pt 7):1799–807. doi:10.1093/brain/awm017
49. Gotlib IH, Hamilton JP, Cooney RE, Singh MK, Henry ML, Joormann J. Neural processing of reward and loss in girls at risk for major depression. Arch Gen Psychiatry (2010) 67(4):380–7. doi:10.1001/archgenpsychiatry.2010.13
50. Olino TM, McMakin DL, Morgan JK, Silk JS, Birmaher B, Axelson DA, et al. Reduced reward anticipation in youth at high-risk for unipolar depression: a preliminary study. Dev Cogn Neurosci (2014) 8:55–64. doi:10.1016/j.dcn.2013.11.005
51. Rowe JB, Hughes L, Ghosh BC, Eckstein D, Williams-Gray CH, Fallon S, et al. Parkinson’s disease and dopaminergic therapy – differential effects on movement, reward and cognition. Brain (2008) 131(Pt 8):2094–105. doi:10.1093/brain/awn112
52. Broussolle E, Dentresangle C, Landais P, Garcia-Larrea L, Pollak P, Croisile B, et al. The relation of putamen and caudate nucleus 18F-DOPA uptake to motor and cognitive performances in Parkinson’s disease. J Neurol Sci (1999) 166(2):141–51. doi:10.1016/S0022-510X(99)00127-6
Keywords: Parkinson’s disease, depression, positive feedback, negative feedback, category learning, dopamine
Citation: Herzallah MM, Khdour HY, Taha AB, Elmashala AM, Mousa HN, Taha MB, Ghanim Z, Sehwail MM, Misk AJ, Balsdon T, Moustafa AA, Myers CE and Gluck MA (2017) Depression Reduces Accuracy While Parkinsonism Slows Response Time for Processing Positive Feedback in Patients with Parkinson’s Disease with Comorbid Major Depressive Disorder Tested on a Probabilistic Category-Learning Task. Front. Psychiatry 8:84. doi: 10.3389/fpsyt.2017.00084
Received: 14 October 2016; Accepted: 28 April 2017;
Published: 12 June 2017
Edited by:
Angie A. Kehagia, King’s College London, United KingdomReviewed by:
Weien Yuan, Shanghai Jiao Tong University, ChinaDan W. Joyce, King’s College London, United Kingdom
Copyright: © 2017 Herzallah, Khdour, Taha, Elmashala, Mousa, Taha, Ghanim, Sehwail, Misk, Balsdon, Moustafa, Myers and Gluck. This is an open-access article distributed under the terms of the Creative Commons Attribution License (CC BY). The use, distribution or reproduction in other forums is permitted, provided the original author(s) or licensor are credited and that the original publication in this journal is cited, in accordance with accepted academic practice. No use, distribution or reproduction is permitted which does not comply with these terms.
*Correspondence: Mohammad M. Herzallah, mohammad.m.herzallah@gmail.com