 Tianhua Niu
 Jingjing Li1
 Jennie Z. Ma
 Ming D. Li
- 1State Key Laboratory for Diagnosis and Treatment of Infectious Diseases, The First Affiliated Hospital, Collaborative Innovation Center for Diagnosis and Treatment of Infectious Diseases, Zhejiang University School of Medicine, Hangzhou, China
- 2Department of Biochemistry and Molecular Biology, Tulane University School of Medicine, New Orleans, LA, United States
- 3School of Biomedical Engineering, Tianjin Medical University, Tianjin, China
- 4Department of Public Health Sciences, University of Virginia, Charlottesville, VA, United States
- 5Research Center for Air Pollution and Health, Zhejiang University, Hangzhou, China
- 6Institute of Neuroimmune Pharmacology, Seton Hall University, South Orange, NJ, United States
Background: Topiramate (TPM) is suggested to be a promising medication for treatment of methamphetamine (METH) dependence, but the molecular basis remains to be elucidated.
Methods: Among 140 METH-dependent participants randomly assigned to receive either TPM (N = 69) or placebo (N = 71) in a previously conducted randomized controlled trial, 50 TPM- and 49 placebo-treated participants had a total 212 RNA samples available at baseline, week 8, and week 12 time points. Following our primary analysis of gene expression data, we reanalyzed the microarray expression data based on a latent class analysis of binary secondary outcomes during weeks 1–12 that provided a classification of 21 responders and 31 non-responders with consistent responses at both time points.
Results: Based on secondary outcomes, 1,381, 576, 905, and 711 differentially expressed genes at nominal P values < 0.05 were identified in responders versus non-responders for week 8 TPM, week 8 placebo, week 12 TPM, and week 12 placebo groups, respectively. Among 1,381 genes identified in week 8 TPM responders, 359 genes were identified in both week 8 and week 12 TPM groups, of which 300 genes were exclusively detected in TPM responders. Of them, 32 genes had nominal P values < 5 × 10⁻³ at either week 8 or week 12 and false discovery rates < 0.15 at both time points with consistent directions of gene expression changes, which include GABARAPL1, GPR155, and IL15RA in GABA receptor signaling that represent direct targets for TPM. Analyses of these 300 genes revealed 7 enriched pathways belonging to neuronal function/synaptic plasticity, signal transduction, inflammation/immune function, and oxidative stress response categories. No pathways were enriched for 72 genes exclusively detected in both week 8 and week 12 placebo groups.
Conclusion: This secondary analysis study of gene expression data from a TPM clinical trial not only yielded consistent results with those of primary analysis but also identified additional new genes and pathways on TPM response to METH addiction.
Introduction
Methamphetamine (METH), a synthetic derivative of amphetamine, is a highly addictive psychostimulant, with escalating rates of use worldwide (1), particularly in East and Southeast Asia, Australia, various regions of Great Britain, as well as Western and Midwestern areas of United States (1). Due to an additional methyl group in its chemical structure, METH has a higher lipid solubility than the unsubstituted amphetamine, allowing a more rapid transport of the drug across the blood–brain barrier than its parent drug (2). Thus, compared with amphetamine, METH exerts more profound effects on central nervous system (CNS) (3). Approximately 45% of METH is metabolized into amphetamine, and both highly addictive drugs are mostly excreted in renal system (4). The half-life of METH is approximately 8–12 h, and during this time, acute effects of METH take place, which include an ecstatic rush that is nearly immediate in those who either smoke or inject this drug (5). Chronic effects of METH include significant functional impairments in a range of cognitive processes, particularly in attention/psychomotor speed, verbal learning and memory, and fluency-based measures of executive systems functioning (6). Cardiovascular effects of METH are manifested by an elevated heart rate and hypertension, which can result in palpitations, arrhythmias, cardiomyopathy, valvular disease, angina, myocardial infarctions, and cerebral vascular events (7), while psychological effects are manifested by increased anxiety, insomnia, aggression and violent tendencies, paranoia, and visual and auditory hallucinations (8).
Topiramate (TPM), a sulfamate-substituted fructose-1,6-diphosphate analog (9), is a structurally novel anticonvulsant with antiepileptic effects (10). TPM is shown to be efficacious in treating alcohol dependence (11), reducing cocaine intake (12), and facilitating smoking cessation in alcohol-dependent smokers (13). TPM has a long half-life (19–25 h), and has a pharmacokinetic profile linear with dose (in a dose range of 100–800 mg) (14–16). TPM induces an enhancement of GABAA-facilitated neuronal activity and concurrently antagonizes ionotropic AMPA and GluR5 kainate glutamate receptor subtypes (17–23), both of which may decrease METH-induced dopamine release in nucleus accumbens. TPM also modulates ionotropic channels by inhibiting L-type calcium channels, limiting the activity of voltage-dependent sodium channels, as well as facilitating potassium conductance (24). Taken together, TPM represents a promising medication for treatment of METH dependence.
To study the efficacy of TPM in treating METH addiction, a multi-center, placebo-controlled randomized trial of 140 METH-dependent subjects was performed (25). This clinical trial generated mixed results such that TPM treatment did not achieve significant METH abstinence (primary outcome), but did decrease weekly median urine METH levels significantly. Genome-wide transcriptomic profiling of peripheral blood (most accessible tissue) has been shown to identify new diagnostic markers for psychiatric disorders (e.g., major depression) (26–28), because of similarities between receptor expression and mechanisms of transduction processes of cells in CNS and in peripheral blood (29). In a previous gene expression study based on the primary outcome of the clinical trial (i.e., weekly abstinence from METH during weeks 1–12) (30), we identified a set of differentially expressed (DE) genes associated with the treatment of TPM on METH dependence, as well as enriched biochemical pathways. However, as shown in the clinical trial, TPM did not significantly increase abstinence from METH use (25), so the numbers of responders with valid gene expression data in the TPM and placebo groups were relatively small, and also were not well balanced (e.g., only four and two responders were included in the placebo group for weeks 8 and 12, respectively) (30). On the other hand, an earlier latent variable analysis study reported by our group (31) showed that the heterogeneity of treatment responses could be better characterized based on six non-longitudinal binary secondary outcomes of METH use, which helped to identify more robust responder and non-responder groups to TPM or placebo, providing larger and more balanced samples. The main objective of this study was to continue a primary analysis of gene expression data based on only primary outcome (30) by conducting a secondary analysis study using the same gene expression data of the same TPM randomized clinical trial (25) but with more samples classified as either responders or non-responders by applying a latent class analysis (LCA) of binary secondary outcomes during weeks 1–12 (31) to obtain a better understanding of the molecular mechanisms associated with the differences between responders and non-responders specifically for TPM.
Materials and Methods
Study Participants and Blood Sample Collection
A detailed description of this double-blind, multicenter, placebo-controlled, randomized, parallel-group trial has been presented elsewhere (25). In brief, after a potential participant provided written informed consent, he or she was screened for up to 14 days based on the inclusion and exclusion criteria reported previously (25). If any participant met the eligibility criteria, he or she would start a 14-day baseline assessment. Exclusion criteria included serious medical illness, psychiatric conditions requiring ongoing medication, pregnancy or lactation, nephrolithiasis or renal impairment, and court-mandated drug abuse treatment. For a detailed delineation of screening and baseline assessments, please see our previous report (25). A total 140 Diagnostic and Statistical Manual of Mental Disorders Fourth Edition (DSM-IV)-diagnosed METH-dependent outpatients who were ≥18 years of age who met the eligibility criteria and were qualified for the study were randomized into either TPM (N = 69) or placebo (N = 71) treatment groups (32). Whole blood was collected in PAXgene Blood RNA tubes (Qiagen, Valencia, CA, USA) from each individual who gave informed content at baseline, week 8, and week 12 time points, respectively. The Institutional Review Boards of each clinical site and the VA Human Rights Committee approved the protocol for conducting of the study and all subjects gave written informed consent in accordance with the Declaration of Helsinki.
RNA Isolation and Gene Expression Microarray Analysis
A full description has been provided in our primary analysis study reported previously (30). In brief, total RNA was isolated using PAXgene Blood RNA Isolation Kit (Qiagen, Valencia, CA, USA) and stored at −80°C. Transcriptomic profiling was performed by hybridizing each RNA sample to Affymetrix Human Genome U-133 Plus 2.0 arrays (Affymetrix Inc., Santa Clara, CA, USA) by Expression Analysis Inc. (Durham, NC, USA) according to the manufacturer’s protocol. Each array contains 54,675 25-mer probe sets that include approximately 47,000 transcripts and variants out of which 38,500 are well-characterized human genes (33). Gene expression data were then submitted to Information Management Consultants (IMC), Inc. (Reston, VA, USA) for data warehousing using IMC’s Pharmacogenomics Knowledge Management System.
Classification of Responders and Non-Responders Based on Secondary Outcomes
Subjects were classified by LCA as responders or non-responders according to six non-longitudinal, binary secondary outcomes of METH use for weeks 1–12 (31): (i) secondary outcome C for weeks 1–12: ≥21 consecutive days of METH abstinence during weeks 1–12 based on urine drug screens only; (ii) secondary outcome D for weeks 1–12: ≥21 consecutive days of METH abstinence during weeks 1–12 based on urine drug screens and self-report; (iii) secondary outcome E for weeks 1–12: ≥25% reduction in proportion of METH use days during weeks 1–12 compared with self-reported METH use during 14-day baseline period; (iv) secondary outcome F for weeks 1–12: ≥50% reduction in proportion of METH use days during weeks 1–12 compared with self-reported METH use during 14-day baseline period; (v) secondary outcome G for weeks 1–12: ≥25% reduction in median quantitative METH urine concentration during weeks 1–12 compared with median quantitative METH urine concentration during 14-day baseline period; and (vi) secondary outcome H for weeks 1–12: ≥50% reduction in median quantitative METH urine concentration during weeks 1–12 compared with median quantitative METH urine concentration during 14-day baseline period. A detailed description of these six binary secondary outcomes is shown in Supplementary Text S1 in Supplementary Material. These six binary secondary outcomes measured different aspects of both attainment of METH abstinence [(i) and (ii)] and attainment of METH use reduction [(iii), (iv), (v), and (vi)], which could be more robust than primary outcome defined only based on weekly METH abstinence during weeks 1–12 (30) to more sensitively define a responder as a study participant who had decreased METH use during the clinical trial in response to either TPM or placebo. LCA was performed using Mplus (34) to identify clinically distinct classes based on observed response patterns according to the above six secondary outcomes (31).
Statistical and Bioinformatics Analysis
The procedures used for outlier array detection, quality control, preprocessing, normalization, and probe set filtering to decrease noise have been described before (30). To adjust for individual variations of gene expression at baseline, each individual’s gene expression level at either week 8 or week 12 time point was first baseline-normalized before identification of DE genes and pathways. Then, significantly modulated genes and enriched biological pathways were detected by the following methods.
Individual Gene Analysis
Similar to the approach taken by Uusküla et al. (35), two different statistical tests for gene expression analyses were applied: (i) an ordinary Student’s t-test, implemented by MATLAB (MathWorks, Natick, MA, USA) and (ii) an empirical Bayes moderated t-test, implemented by LIMMA package of Bioconductor, an R-based open-source software (36).
Pathway Analysis
Ingenuity Pathway Analysis (IPA)1 and Onto-Tools Pathway-Express2 software tools were applied. IPA determines the probability that a given gene set is associated with predefined pathways beyond what would be expected by random chance (37). Further, this software tool computes a right-tailed Fisher’s exact test P value and a Benjamini–Hochberg false discovery rate (FDR) (38) for each relevant pathway in the Ingenuity Pathways Knowledge Base (IPKB). The list of gene identifiers and their fold changes (FCs) was uploaded to the IPA, such that each gene identifier was mapped to its corresponding gene object in the IPKB. Molecular interaction networks were constructed for both direct and indirect interactions using default parameters. Onto-Tools Pathway-Express (39, 40) is a web-based application that automatically finds significantly impacted Kyoto Encyclopedia of Genes and Genomes (KEGG) pathways. For a given pathway in KEGG that includes L input genes, denoted as g1, …, gL, Onto-Tools Pathway-Express first calculates a perturbation factor (PF) for gene i, denoted as PF(gi), for I ∈ (1, …, L), where PF(gi) shows relative importance of gene gi for that pathway. Then, an impact factor of that pathway is calculated, which includes PF(g1), PF(g2), …, PF(gL), and a probabilistic term that takes into account the proportion of input genes of that pathway (39). For a given input gene list, Onto-Tools Pathway-Express calculates a gamma P value and a Benjamini–Hochberg FDR for each relevant KEGG pathway.
Data Access
The chip expression data from this study have been deposited in the NCBI database and are accessible through GEO series accession number GSE107015.3
Results
Description of Responders and Non-Responders Based on Secondary Outcomes
Among the total 140 METH users, 99 (49 in placebo and 50 in TPM group) provided a total 212 chips at baseline (91 chips), week 8 (65 chips), or week 12 (56 chips), of which 209 passed quality control (30). The demographic characteristics of these 99 study participants are presented in Table 1. LCA based on secondary outcomes during weeks 1–12 identified 18 responders and 16 non-responders in week 8 TPM group, and 8 responders and 23 non-responders in week 8 placebo group, 16 responders and 13 non-responders in week 12 TPM group, and 7 responders and 20 non-responders in week 12 placebo group, respectively. However, study subjects could have conflicting efficacy results by being classified as a responder at week 8 but a non-responder at week 12, or vice versa. To remove such discrepancies, a responder (or non-responder) was defined as being a responder (or non-responder) consistently at both time points as classified by LCA. Such a restriction made the responder and non-responder groups more homogeneous. Consequently, in this secondary analysis, 15 responders and 12 non-responders with consistent TPM responses at both week 8 and week 12, and 6 responders and 19 non-responders with consistent placebo responses at both time points were included in statistical analysis, which are more balanced than those of primary analysis: week 8 TPM group (5 responders and 17 non-responders), week 8 placebo group (4 responders and 17 non-responders), week 12 TPM group (6 responders and 11 non-responders), and week 12 placebo group (2 responders and 13 non-responders), and had consistently greater total sample sizes for these 4 respective groups.
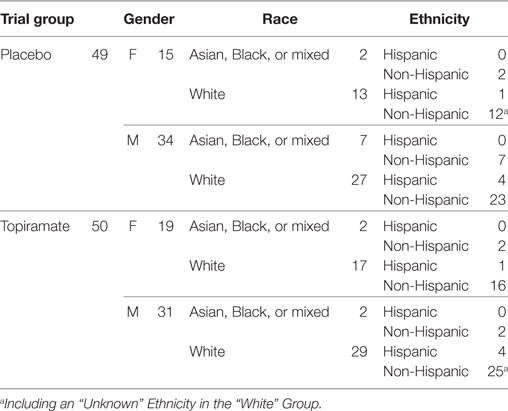
Table 1. Demographic characteristics of 99 study participants with available gene expression microarrays.
Identification of DE Genes in Treatment Responders
We applied two different tests, i.e., an ordinary Student’s t-test and an empirical Bayes moderated t-test, for detecting DE genes (Table S1 in Supplementary Material). By applying an ordinary Student’s t-test, based on a nominal P value < 0.05, we identified 1,186, 513, 758, and 611 genes for week 8 TPM, week 8 placebo, week 12 TPM, and week 12 placebo, respectively. By applying an empirical Bayes moderated t-test, based on a nominal P value < 0.05, we identified 759, 145, 388, and 286 genes for these respective groups, respectively (Tables S2–S5 in Supplementary Material). A total of 564 (74.31%), 82 (56.55%), 241 (62.11%), and 186 (65.03%) genes (using the number of genes detected by the empirical Bayes moderated t-test as a denominator) for week 8 TPM, week 8 placebo, week 12 TPM, and week 12 placebo were also detected by the ordinary Student’s t-test. Because the proportion of overlap is greater than 50% for each of these four groups, genes detected by both tests were pooled together, such that if a gene is selected by either ordinary Student’s t-test or empirical Bayes moderated t-test, and if a gene is detected by both tests, then the test with the smaller nominal P value is chosen along with the corresponding FC and FDR. Together, there are 1,381 (FDR: 0.16 ± 0.059) (Table S2 in Supplementary Material), 576 (FDR: 0.36 ± 0.094) (Table S3 in Supplementary Material), 905 (FDR: 0.25 ± 0.090) (Table S4 in Supplementary Material), and 711 (FDR: 0.29 ± 0.052) (Table S5 in Supplementary Material) for the above four groups, respectively. To identify more likely biologically meaningful DE genes, similar to primary analysis (30), we applied a more stringent statistical significance threshold, i.e., a nominal P value < 0.01, which revealed 380 (FDR: 0.12 ± 0.064), 123 (FDR: 0.30 ± 0.075), 199 (FDR: 0.18 ± 0.095), and 122 (FDR: 0.26 ± 0.060) genes for week 8 TPM, week 8 placebo, week 12 TPM, and week 12 placebo groups, respectively. Of them, week 8 TPM group had the lowest average FDR (0.12), followed by week 12 TPM (0.18), week 8 placebo (0.30), and week 12 placebo (0.26), and these results are better than the results obtained from primary analysis (30), which had an increasing order of week 8 TPM (0.009), week 12 placebo (0.033), week 8 placebo (0.027), and week 12 TPM (0.113), because week 12 TPM group of primary outcome had fewer (total: 17) and more imbalanced (6 responders versus 11 non-responders) samples than week 12 TPM group of secondary outcomes (total: 27, 15 responders versus 12 non-responders). Further, 298, 0, 112, and 10 of the above genes with nominal P values < 0.01 also had FDRs < 0.15 for the above four groups, showing that many more genes’ expressions were significantly changed by TPM than by placebo at each time point, with control for multiple testing. Of 359 genes shared between week 8 TPM and week 12 TPM groups, 300 genes were exclusively detected in TPM responders. Of 106 genes shared between week 8 placebo and week 12 placebo groups, 72 genes were exclusively detected in placebo responders. There is no overlap between these two gene sets.
Among 300 genes exclusively detected in week 8 and week 12 TPM responders, 34 genes had nominal P values < 5 × 10⁻³ at either time point and FDRs < 0.15 at both time points. Of them, two genes, FNIP2 (week 8 TPM Group: FC ± SD = 1.49 ± 0.20, P value = 0.022, FDR = 0.13; week 12 TPM Group: FC ± SD = −1.28 ± 0.10, P value = 0.0032, FDR = 0.13), and TOX4 (week 8 TPM Group: FC ± SD = −1.23 ± 0.090, P value = 0.010, FDR = 0.12; week 12 TPM Group: FC ± SD = 1.28 ± 0.098, P value = 0.0038, FDR = 0.14) had inconsistent directions of gene expression changes, and were subsequently excluded. Therefore, 32 genes (17 down- and 15 upregulated) were selected based on the above statistics criteria showing consistent directions of gene expression changes at both time points (Table 2), which included 12 biologically important genes for drug addiction: CASP4, COX19, CUX1, GABARAPL1, GNG2, GPR155, HSF1, IL15RA, NLRP1, SIL1, SLC25A19, and UBAP2. Also, as shown in Table 2, 12 genes have statistical support from both tests for both week 8 TPM and week 12 TPM groups: ASXL1, CASP4, COX19, FBXL13, GABARAPL1, GPR155, IL15RA, LUZP1, PTCD1, SLC25A19, SUV39H1, and UBAP2. Of them, GABARAPL1, GPR155, and IL15RA in GABA receptor signaling represent direct targets for TPM. By contrast, none of 72 genes exclusively detected in week 8 and week 12 placebo responders contain direct targets for TPM.
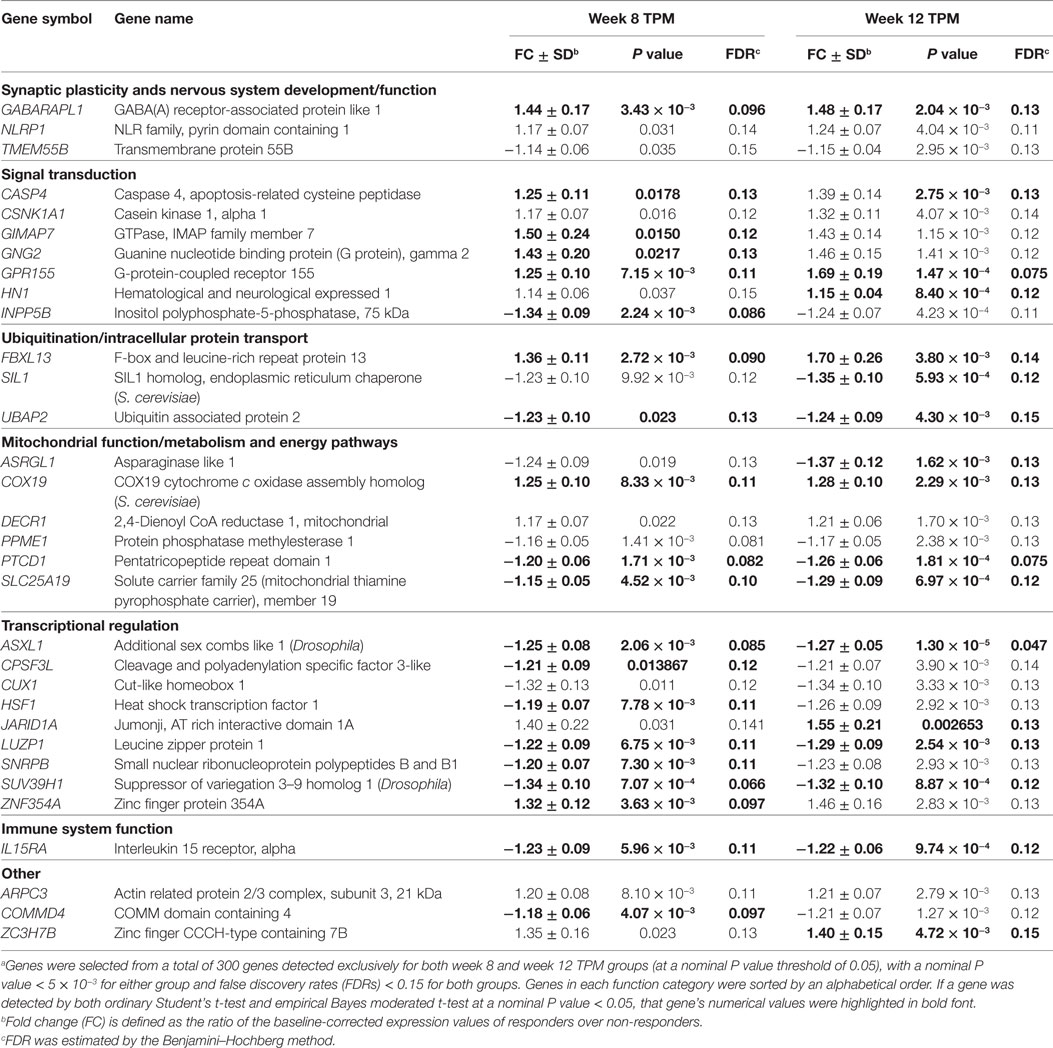
Table 2. A list of 32 representative genes significantly and consistently modulated exclusively in weeks 8 and 12 topiramate (TPM) groups (n = 32) based on secondary outcomes.a
By comparing these above DE genes detected at nominal P values < 0.01 based on secondary outcomes with those DE detected at same statistical significance threshold based on primary outcome for week 8 TPM, week 8 placebo, week 12 TPM, and week 12 placebo groups, respectively (30), 55, 11, 11, and 15 genes were shared between primary analysis and secondary analysis for the above four groups, respectively (Table 3). Of them, SASH1 was detected as a downregulated gene in both week 8 TPM and week 12 TPM groups, and there were no other overlapping genes shared between the two time points for TPM response. The directions of gene expression changes between primary analysis and secondary analysis were different for 8 genes (8.89%) of these 90 unique genes, i.e., TNRC6A and USP16 for week 8 TPM, RBMS1 and WDR68 for week 12 TPM, EIF4B and NACA for week 8 placebo, and FBXL11 and ITM2A for week 12 placebo group, respectively (Table 3). It is noteworthy that 9 of the 55 genes identified by primary analysis and secondary analysis for week 8 TPM—including 4 upregulated genes, i.e., CD164, AKAP11, FGFR1OP2, and PTEN, and 5 downregulated genes, i.e., EMILIN2, DGCR14, BCR, GANAB, and NAGK, were among the 93 (48 up- and 45 downregulated) representative genes selected based on primary analysis (30), and the directions of gene expression changes were all consistent between these two analyses.
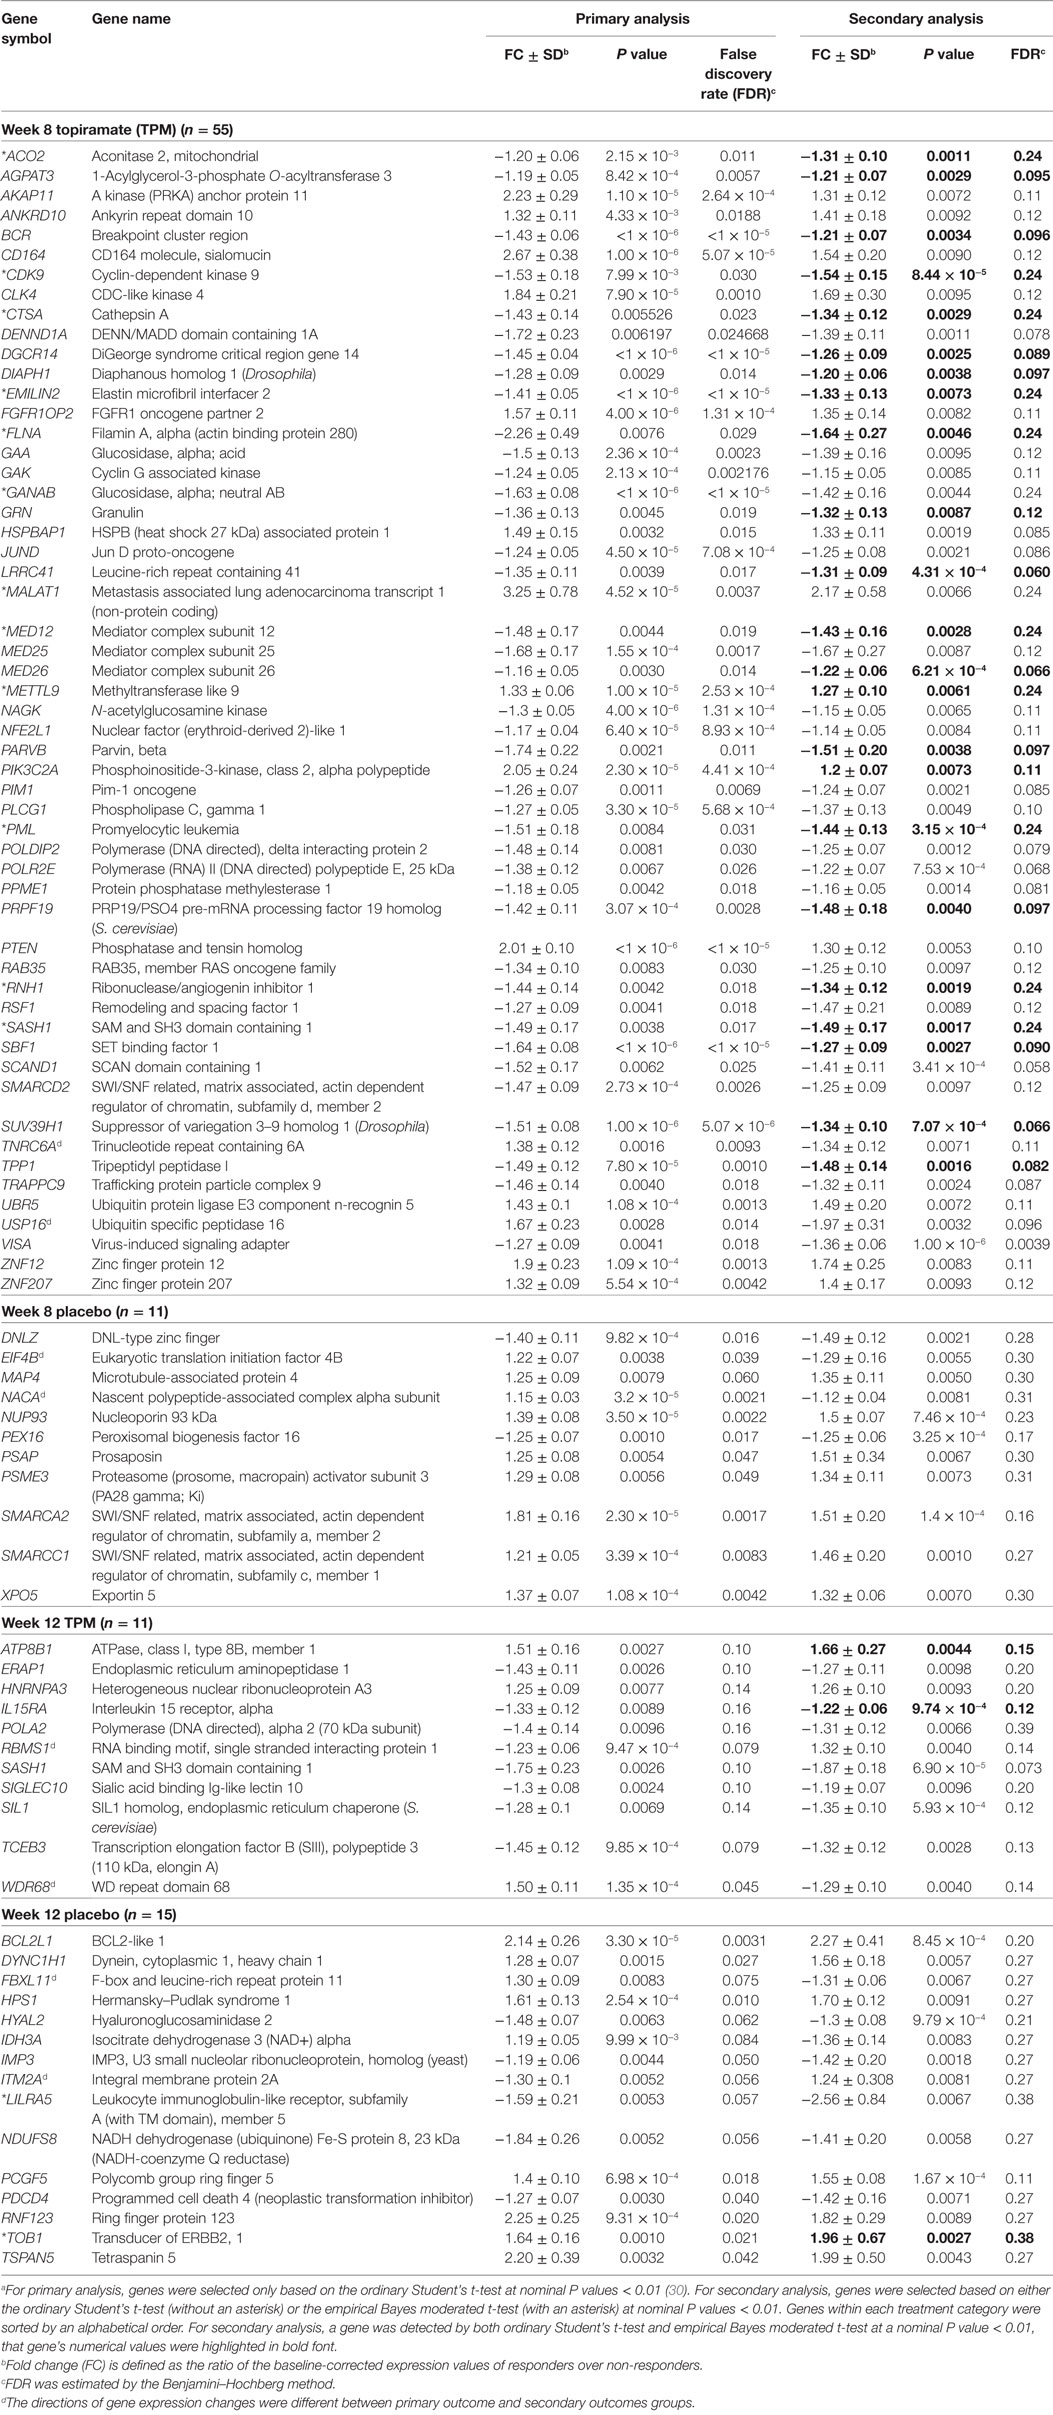
Table 3. A list of significantly modulated genes detected in both primary analysis and secondary analysis (n = 92).a
To pinpoint top genes that were changed in TPM responders compared with TPM non-responders, volcano plots, where the log10(P value)’s are plotted versus log2(FC)’s, were generated for week 8 TPM (Figure 1A) and week 12 TPM group (Figure 1B), respectively. In week 8 TPM group, the top five genes (pink color) changed in TPM responders compared with TPM non-responders were VISA (P value = 1.00 × 10⁻⁶, FC = −1.36, FDR = 0.0039), CHST14 (P value = 2.70 × 10⁻⁵, FC = −1.30, FDR = 0.026), ITGB5 (P value = 2.70 × 10⁻⁵, FC = −1.56, FDR = 0.026), GAS2L1 (P value = 3.20 × 10⁻⁵, FC = −1.70, FDR = 0.026), and ITGA2B (P value = 4.50 × 10⁻⁵, FC = −2.56, FDR = 0.026) (i.e., top five genes shown in Table S2 in Supplementary Material). Of them, none was significantly changed in week 8 placebo group at a nominal P value < 0.01. In week 12 TPM group, the top five genes (pink color) changed in TPM responders compared with TPM non-responders were ASXL1 (P value = 1.30 × 10⁻⁵, FC = −1.27, FDR = 0.0047), VPS24 (P value = 6.20 × 10⁻⁵, FC = 1.19, FDR = 0.073), SASH1 (P value = 6.90 × 10⁻⁵, FC = −1.87, FDR = 0.073), RC3H2 (P value = 8.20 × 10⁻⁵, FC = −1.40, FDR = 0.073), and TCF4 (P value = 1.18 × 10⁻⁴, FC = −1.78, FDR = 0.075), respectively (i.e., top five genes shown in Table S4 in Supplementary Material). Among them, none was significantly changed in week 12 placebo group at a nominal P value < 0.01. Four genes (blue color) were significantly changed in TPM responders compared with TPM non-responders at a nominal P value < 5 × 10⁻³ with a |FC| > 1.40 at both weeks 8 and 12, which include PML (P values = 3.15 × 10⁻⁴ and 1.10 × 10⁻³, FCs = −1.44 and −1.51, FDRs = 0.24 and 0.12 at weeks 8 and 12, respectively), SASH1 (P values = 1.67 × 10⁻³ and 6.90 × 10⁻⁵, FCs = −1.49 and −1.87, FDRs = 0.24 and 0.073 at weeks 8 and 12, respectively), FPR1 (P values = 1.11 × 10⁻³ and 5.57 × 10⁻⁴, FCs = 1.66 and 1.55, FDRs = 0.078 and 0.39 at weeks 8 and 12, respectively), and GABARAPL1 (P values = 3.43 × 10⁻³ and 2.04 × 10⁻³, FCs = 1.44 and 1.48, FDRs = 0.096 and 0.13 at weeks 8 and 12, respectively), and none was significantly changed in placebo responders compared with placebo non-responders at weeks 8 and 12 by using same nominal P value and |FC| thresholds.
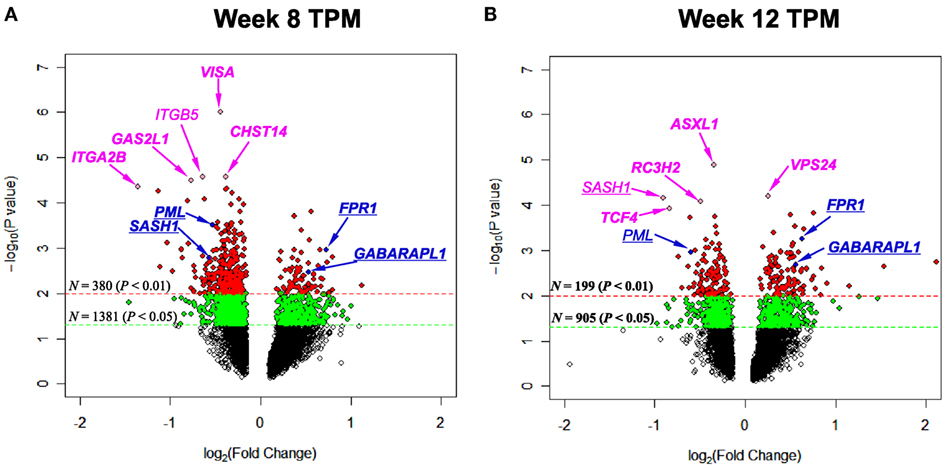
Figure 1. Volcano plots depicting log2(Fold Change) (x-axis) and −log10(P value) (y-axis) for genes of (A) week 8 topiramate (TPM) and (B) week 12 TPM groups. Genes with 0.01 ≤ P values < 0.05 and P values < 0.01 were shown by green and red colors, respectively. Five most statistically significant genes for each group were shown in pink color. Genes with P values < 5 × 10⁻³ and |Fold Change|s > 1.40 for both week 8 and week 12 TPM groups were underlined, and shown in blue color [except in (B), SASH1 was shown in pink color, because this gene was among top five]. For each group, if a gene was detected by both ordinary Student’s t-test and empirical Bayes moderated t-test at a nominal P value < 0.05, that gene’s corresponding symbol was highlighted in bold font. (A) ITGB5 is not in bold font, and all other gene symbols were in bold font; (B) SASH1 and PML are not in bold font, and all other gene symbols were in bold font.
Identification of Enriched Pathways in Treatment Responders
Both IPA and Onto-Tools Pathway-Express were applied to detect enriched pathways for 300 and 72 genes uniquely for TPM and placebo responders, respectively. Together, at nominal P values < 0.05 and further restricting by FDRs < 0.15 at both time points, 44 enriched pathways were detected for TPM responders, and based on the following selection criteria: (i) number of genes ≥3, and (ii) nominal P values < 0.05 at both weeks 8 and 12, and further restricting by FDRs < 0.15 at both time points, 7 selected pathways can be classified into four categories: Neuronal Function/Synaptic Plasticity (protein ubiquitination pathway), Signal Transduction (phosphatidylinositol signaling system and PI3K/AKT signaling), Inflammation/Immune Function (antigen presentation pathway, fMLP signaling in neutrophils, and role of PKR in interferon induction and antiviral response), and Oxidative Stress Response (NRF2-mediated oxidative stress response) (Table 4). Also, two pathways in “Signal Transduction” Category, i.e., Phosphatidylinositol Signaling System and PI3K/AKT Signaling pathways, three pathways in “Inflammation/Immune Function” Category, i.e., Antigen Presentation Pathway, fMLP Signaling in Neutrophils, and Role of PKR in Interferon Induction and Antiviral Response pathways, and the “NRF2-mediated Oxidative Stress Response” pathway in “Oxidative Stress Response” Category, contained >50% genes that were detected by both the ordinary Student’s t-test and the empirical Bayes moderated t-test in either the week 8 TPM group or week 12 TPM group, highlighting that these pathways have more statistical support for their significance. By applying same selection criteria, no enriched pathways were detected for placebo responders, indicating that these pathways are specific to TPM response. Genes of PI3K/AKT signaling pathway changed exclusively in both week 8 and week 12 TPM responders were shown in Figure 2. Whereas 6 genes, i.e., GYS1, HSP90B1, NFKBIE, PPP2R5D, RRAS, and TP53, were downregulated, one gene, i.e., PTEN, was upregulated, which was also the gene shared between the three genes detected for phosphatidylinositol signaling system and the seven genes detected for PI3K/AKT signaling in the Signal Transduction category (Table 4). Because PTEN, a central negative regulator of the PI3K pathway (41), is required for modulating synaptic activity during plasticity (42), a 36-node PTEN-centered molecular interaction network was generated for each of week 8 and week 12 TPM groups (Figures 3A,B), respectively. At week 8, 11 genes, i.e., CENTA1, CHST14, CTDSPL, CTNND1, DTX1, DVL3, MAFK, NFIC, POU2AF1, PSMD1, and TCF3, were downregulated and 8 genes, i.e., BPGM, CSNK1A1, CXCR4, MAPK14, PLEKHF2, PSMB2, PTEN, and SRPK1, were upregulated. At week 12, 11 genes, i.e., CENTA1, CHST14, CTNND1, DTX1, DVL3, MAFK, NFIC, POU2AF1, PSMB2, PSMD1, and TCF3, were downregulated, and 8 genes, i.e., BPGM, CSNK1A1, CTDSPL, CXCR4, MAPK14, PLEKHF2, PTEN, and SRPK1, were upregulated, respectively. Of the 19 DE genes for week 8 TPM and week 12 TPM groups, it is noted that the majority (89.47%; 17/19) of them have consistent directions of gene expression changes between weeks 8 and 12, and only two genes (i.e., CTDSPL and PSMB2) had opposite direction of gene expression changes, and such time-dependent change which may be attributed METH-induced inflammation, prolonged TPM exposure by study participants, and other factors. It is also worth mentioning that comparting these two networks at two different time points, the six hub genes [defined as gene nodes each with a degree ≥4 (excluding self-loops)] i.e., CSNK1A1, CTNND1, CXCR4, MAFK, MAPK14, and PTEN, had consistent directions of gene expression changes for week 8 and week 12 TPM groups, and only two peripheral genes, i.e., CTDSPL and PSMB (shown in dashed blue rectangles), displayed different directions of changes, indicating that this gene network is relatively stable over time. Among these DE genes, CSNK1A1, CTNND1, CXCR4, DTX1, MAPK14, PLEKHF2, PSMB2, PSMD1, and PTEN have biologically important roles for TPM responses.
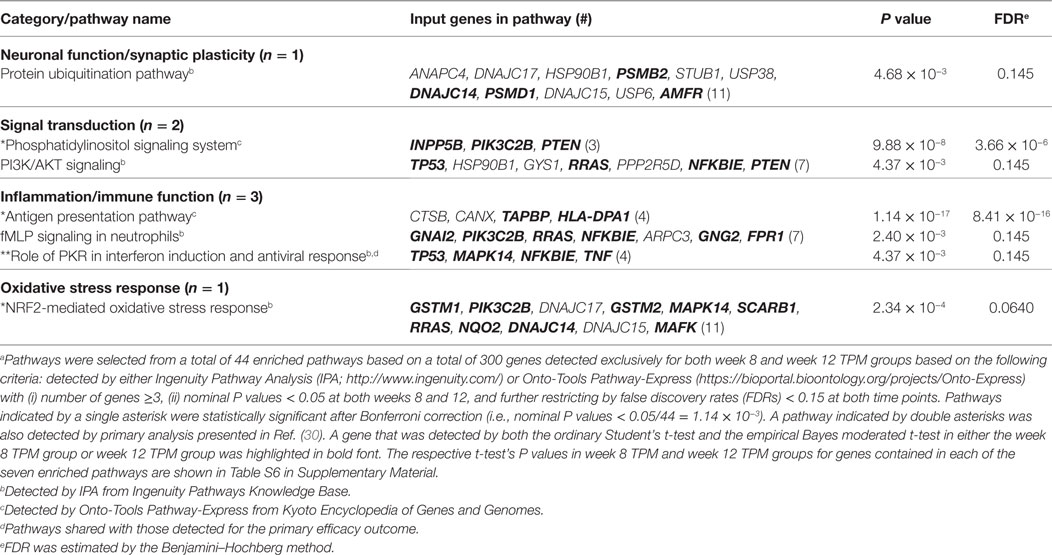
Table 4. Significantly enriched pathways for 300 genes consistently detected exclusively in weeks 8 and 12 topiramate (TPM) groups based on secondary outcomes (n = 7).a
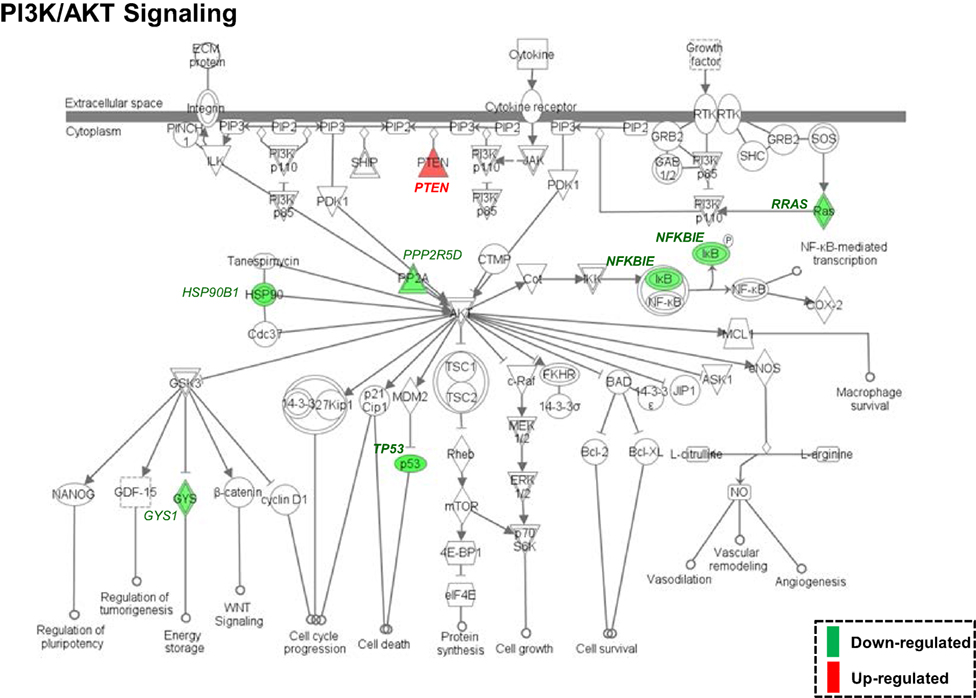
Figure 2. Enriched PI3K/AKT signaling pathway, identified by Ingenuity Pathway Analysis based on 300 differentially expressed genes (nominal P values < 0.05) detected exclusively in both week 8 and week 12 topiramate (TPM) groups. Symbols with a single border indicate single genes. Those with a double border indicate complexes of genes or the possibility that alternative genes might act in the pathway. Red color symbols indicate upregulated gene clusters, and green color symbols represent downregulated gene clusters. At both time points, GYS1, HSP90B1, NFKBIE, PPP2R5D, RRAS, and TP53 were consistently downregulated, and PTEN was consistently upregulated. If a gene was detected by both the ordinary Student’s t-test and the empirical Bayes moderated t-test in either the week 8 TPM group or week 12 TPM group, that gene’s corresponding symbol was highlighted in bold font.
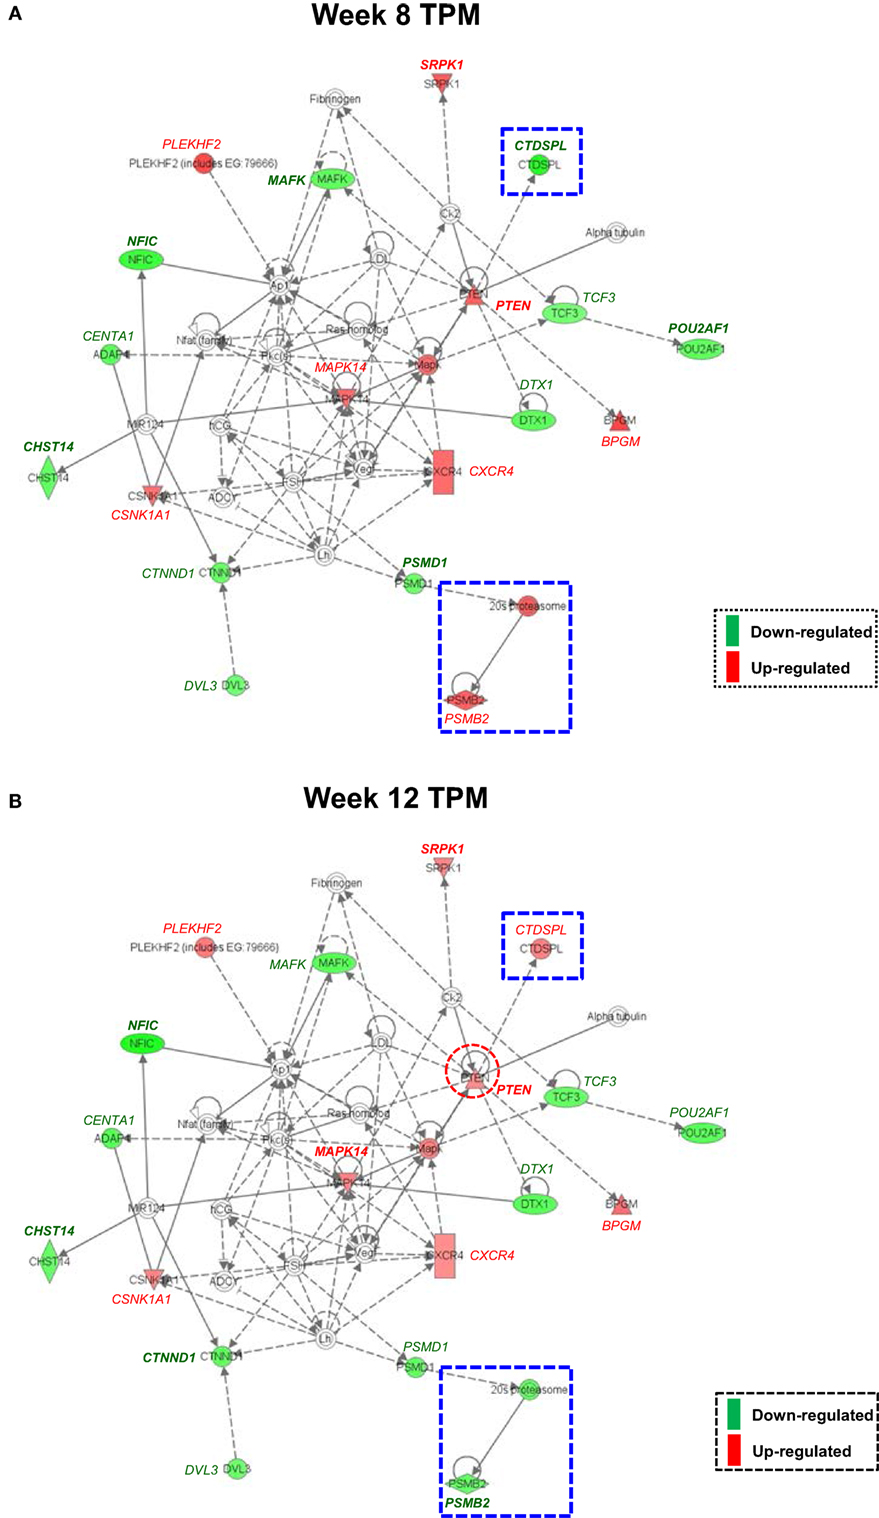
Figure 3. Molecular interaction network revealed by Ingenuity Pathway Analysis detected exclusively for both week 8 and week 12 topiramate (TPM) groups. Solid lines represent direct interactions, and dashed lines represent indirect interactions, with or without filled arrows indicating functional interaction or physical association, respectively. A line with a terminal bar indicates inhibition, whereas filled arrows that are preceded by a terminal bar indicate inhibition as well as functional interaction. Each node’s shape indicates the class of molecule: horizontal ovals are transcription regulators, vertical rectangles are G-protein-coupled receptors, triangles are phosphatases, inverted triangles are kinases, horizontal diamonds are peptidases, double circles are complexes/groups, and single circles are other types of biological molecules. Lines starting and finishing on the same node indicate self-regulation. Arrowheads indicate the directionality of relationship. Nodes are colored according to extent of differential expression, with up- and downregulation represented by red and green colors, respectively. For each group, if a gene was detected by both ordinary Student’s t-test and empirical Bayes moderated t-test at a nominal P value < 0.05, that gene’s corresponding symbol was highlighted in bold font. (A) Week 8 TPM (CENTA1, CHST14, CTDSPL, CTNND1, DTX1, DVL3, MAFK, NFIC, POU2AF1, PSMD1, and TCF3 were downregulated and BPGM, CSNK1A1, CXCR4, MAPK14, PLEKHF2, PSMB2, PTEN, and SRPK1 were upregulated, respectively); and (B) week 12 TPM (CENTA1, CHST14, CTNND1, DTX1, DVL3, MAFK, NFIC, POU2AF1, PSMB2, PSMD1, and TCF3 were downregulated and BPGM, CSNK1A1, CTDSPL, CXCR4, MAPK14, PLEKHF2, PTEN, and SRPK1 were upregulated, respectively).
Discussion
The advent of global gene expression profiling has generated unprecedented insight into our molecular understanding of drug addiction and treatment. We previously have identified genes involved in glutamate receptor and GABA receptor signaling are changed among TPM responders compared with non-responders based on primary outcome (i.e., METH abstinence) and a set of crucial pathways involved in neuronal function/synaptic plasticity, signal transduction, cardiovascular function, and inflammation/immune function are significantly enriched among TPM responders (30). However, the primary analysis was limited to only METH abstinence phenotype (30), and certain significantly modulated genes and pathways could be missed because of the limited sample sizes. This study differed from the primary analysis in several aspects. First, the secondary analysis applied the LCA classifications based on the six non-longitudinal binary secondary outcomes of weeks 1–12 into “responder” and “non-responder” classes, and those in the “responder” class scored consistently better on each of the six secondary outcomes than those in the “non-responder” class, as shown in Ma et al. (31). Such a classification provided greater sample sizes and more balanced comparisons for week 8 TPM, week 8 placebo, week 12 TPM, and week 12 placebo groups, compared with the primary analysis. Second, this secondary analysis applied both ordinary Student’s t-test and the empirical Bayes moderated t-test, which is distinct from the more traditional association analyses utilizing only the ordinary Student’s t-test, and is particularly suitable for small-to-moderate samples sizes. Although the results obtained from this study are from peripheral blood and need further validation and examination in CNS, it is quite striking that our secondary analyses based on six non-longitudinal binary secondary outcomes revealed a rather consistent and meaningful pattern that TPM changed more genes than placebo at both week 8 and week 12, which not only confirmed important genes and pathways revealed by primary analysis based on primary outcome (30) but also extended the results by identifying additional new genes and pathways on TPM response to METH addiction.
At individual gene level, because gene sets detected by both ordinary Student’s t-test and empirical Bayes moderated t-test had relatively high proportions of overlap (64.50 ± 7.43%, range 56.55–74.31%), they were merged together at each time point for TPM and placebo groups, respectively (Table 1). Among 300 genes detected exclusively in TPM responders at weeks 8 and 12, 34 genes had nominal P values < 5 × 10⁻³ at either time point and FDRs < 0.15 at both time points. After excluding two genes with inconsistent directions of gene expression changes, i.e., FNIP2 and TOX4, 32 genes were selected based on the above statistics criteria with consistent directions of gene expression changes at both week 8 and week 12 (Table 2). FDR is expected proportion of erroneously rejected null hypotheses among rejected ones. FDR threshold is determined from observed P value distribution, and hence is adaptive to actual data. An FDR threshold of 0.15 was chosen as significance threshold, which has been used in previous gene expression studies in choosing significant genes, e.g., Ref. (43–48). FDR is defined as the expected number of discoveries that are not truly DE divided by the total number of discoveries. An overly stringent control for FDR can result in a large number of false negatives (49–51). Therefore, determination of an appropriate FDR threshold is critical for effectively identifying truly DE genes, while minimizing both false positives and false negatives. By applying a cross-validation approach, an optimal selection of FDR threshold is shown to provide a good performance on model selection and prediction (52). Twelve of them, i.e., CASP4, COX19, CUX1, GABARAPL1, GNG2, GPR155, HSF1, IL15RA, NLRP1, SIL1, SLC25A19, and UBAP2, could have critical functions for drug addiction. Of them, GABARAPL1 encodes a protein (87% identical, 94% similar) very similar to GABAA-receptor-associated protein (GABARAP) (53) and is expressed at higher levels than GABARAP in CNS (54). Further, GABARAPL1 is suggested to be a major protein interacting with GABAA receptors (54). GPR155, which encodes an integral membrane protein related to G-protein-coupled receptors (GPCRs), is highly expressed in lateral part of striatum and hippocampus (55). Many neurons that are identifiable as GABAergic might express GPR155, implicating its pivotal role in GABAergic neurotransmission (55). GPR155 is dysregulated in lymphoblastoid cells in males with autism spectrum disorders (ASDs) relative to their non-affected siblings, suggesting that the gene is associated with ASD (56). IL15, an important cytokine in immune function, is essential to maintain neurochemical homeostasis (57). IL15RA, which encodes IL15 receptor alpha subunit, has a regulatory function during inflammation. Il15ra knockout mice have deficits in hippocampal-dependent memory and GABA transmission (58). Thus, GABARAPL1, GPR155, and IL15RA in GABA receptor signaling could be direct targets for TPM. By contrast, no genes were identified in placebo responders using same criteria.
In this study, we applied both an ordinary Student’s t-test and an empirical Bayes moderated t-test. The ordinary Student’s t-test is the most commonly used method for comparing the expression levels of genes between two groups, and the computation of the P value for this test is straightforward as long as the assumptions of the test are satisfied. This test has been used in our previous gene expression study based on the primary outcome (30). The empirical Bayes moderated t-test, available in LIMMA package of Bioconductor, is also a popular method for two-group comparisons of gene expressions, which reduces estimated sample variances toward a pooled estimate, producing more stable result when the sample sizes are small (59). Each of ordinary Student’s t-test and empirical Bayes moderated t-test has distinct advantages and disadvantages. The ordinary Student’s t-test is easy to apply, but variance estimates could be skewed by those genes having a very low variance (60). The empirical Bayes moderated t-test is an innovative method that borrows information between genes using an empirical Bayes method to obtain posterior variance estimators, and compute a moderated t statistic that follows a t distribution with augmented degrees of freedom (61), but in this study, this method produces overall higher FDRs compared with ordinary Student’s t-test, indicating a lower statistical power. Nevertheless, the two analyses by ordinary Student’s t-test and empirical Bayes moderated t-test demonstrated largely consistently detected genes. Similar to our study, Uusküla et al. (35) applied two different statistical approaches, i.e., ANOVA and empirical Bayes moderated t-test, and genes identified by these two approaches were shown to be relevant for the clinical outcome. We did not choose to apply nonparametric Wilcoxon rank-sum (i.e., Mann–Whitney U test) because such test has a reduced statistical power and typically detects fewer genes compared with parametric test (62).
By comparing these above DE genes detected at nominal P values < 0.01 based on secondary outcomes with those DE detected at same statistical significance threshold based on primary outcome (30), 55, 11, 11, and 15 genes were shared between primary outcome and secondary outcomes for the week 8 TPM, week 8 placebo, week 12 TPM, and week 12 placebo groups, respectively (Table 3). Among the 55 genes shared between primary outcome and secondary outcomes for week 8 TPM, 9 genes, i.e., 4 upregulated genes, i.e., CD164, AKAP11, FGFR1OP2, and PTEN, and 5 downregulated genes, i.e., EMILIN2, DGCR14, BCR, GANAB, and NAGK, were also among the 93 (48 up- and 45 downregulated) representative genes selected based on primary outcome with consistent directions (30). Therefore, these nine DE genes could be particularly related to TPM treatment response for METH dependence. Of them, PTEN, which encodes a protein that functions as a protein tyrosine phosphatase as well as a lipid phosphatase, is of particular interest. PTEN plays a critical role in both CNS development and maintenance of CNS circuit structure and function (63). PTEN is shown to be a mediator of synaptic plasticity in the adult brain (42, 64) that is required for NMDAR-dependent long-term depression, and alternations of PTEN at synapses could lead to behavioral and cognitive dysfunctions (65).
At week 8, VISA (FDR = 0.0039), CHST14 (FDR = 0.026), GAS2L1 (FDR = 0.026), and ITGA2B (FDR = 0.026) were exclusively changed by TPM, and at week 12, ASXL1 (FDR = 0.0047), VPS24 (FDR = 0.073), SASH1 (FDR = 0.073), and TCF4 (FDR = 0.075) were exclusively changed by TPM, respectively. Based on nominal P values < 5 × 10⁻³ and |FC| > 1.40, PML, SASH1, FPR1, and GABARAPL1 were exclusively changed by TPM at both at week 8 and week 12. Of them, FPR1, which encodes the N-formyl peptide receptor, is a GPCR (66) belonging to the top 50 DE genes in the CNS of schizophrenic patients with long durations of illness (67). GAS2L1 is a susceptibility locus for schizophrenia (68), and SASH1 gene expression was affected by a history of substance dependence/abuse (69). TCF4, which encodes a basic helix-turn-helix transcription factor, regulates gene expression in immune system and in brain development (70) and is significantly associated with schizophrenia (71).
At pathway level, seven biologically important pathways (i.e., Protein Ubiquitination Pathway, Phosphatidylinositol Signaling System, PI3K/AKT Signaling, Antigen Presentation Pathway, fMLP Signaling in Neutrophils, Role of PKR in Interferon Induction and Antiviral Response, and NRF2-mediated Oxidative Stress Response) were significantly enriched in TPM responders compared with non-responders for secondary outcomes (Figure 2). Of them, PI3K/AKT signaling pathway appears to be an important pathway for neuronal survival (72). Six genes (i.e., GYS1, HSP90B1, NFKBIE, PPP2R5D, RRAS, and TP53) were downregulated by TPM in this pathway, and HSP90B1, which encodes an endoplasmic reticulum chaperone gene, is altered in the postmortem brain of bipolar disorder patients (73), and is associated with bipolar disorder (74) and schizophrenia (75–78). PTEN, which encodes a dual-specificity protein phosphatase that negatively regulates the PI3K/AKT signaling pathway (79–81), was upregulated by TPM. PTEN-centered networks of 36 interactors for week 8 and week 12 TPM responders included 19 dysregulated genes (Figures 3A,B). Of them, CSNK1A1, CTNND1, CXCR4, DTX1, MAPK14, PLEKHF2, PSMB2, PSMD1, and PTEN could be important for TPM responses. Besides PTEN, MAPK14, upregulated at both time points, encodes p38 MAPK, which plays an essential role in ROS formation and oxidative stress (82), production of inflammation mediators (83, 84), and neuronal apoptosis (85, 86). Further, CXCR4, also upregulated at both time points, encodes a chemokine receptor critical for anti-inflammatory response (87) and p53-mediated neuronal survival (88). Ubiquitin-mediated proteolysis is involved in the turnover of many short-lived regulatory proteins. Timed destruction of cellular regulators by the ubiquitin–proteasome pathway plays a critical role in ensuring normal cellular processes. Genetic approaches or pharmacological intervention that alters the half-lives of these cellular proteins may have wide therapeutic potential (89). It is worthy of noting that PI3K/AKT signaling and PTEN signaling pathways were detected to be enriched pathways for gene modulated by nicotine (90), and therefore, PI3K/AKT signaling appears to be a crucial pathway affected by various psychoactive drugs.
An integrative model based on enriched pathways has been proposed to explain the molecular mechanisms of TPM’s effect on METH addiction (Figure 4). METH could lead to increased oxidative stress by altering PI3K/AKT signaling pathway, by interacting with vesicular monoamine transporter 2, which leads to accumulated cytoplasmic dopamine with resultant free radical formation (91). The transcription factor NRF2, a guardian of redox homeostasis, regulates a coordinated induction of a set of cytoprotective, antioxidant, and anti-inflammatory genes in response to oxidative stress and inflammation (92, 93). NRF2-mediated oxidative stress response pathway is one of the major intrinsic antioxidant response of the brain, and NRF2 is a therapeutic target for treatment of neurodegenerative diseases, e.g., Alzheimer’s disease and Parkinson’s disease (94). TPM provides neuroplasticity by modulating protein ubiquitination and PI3K/AKT signaling pathways, which in turn, could decrease oxidative stress and increase neuroplasticity, which then could lead to abstinence and reduction of METH use. The integrative model proposed based on primary outcome [i.e., Figure 2 of Ref. (30)] included “PI3K/Akt/GSK-3 signaling” and “Mitochondrial oxidative stress” pathways downstream of “Dopamine receptor signaling” pathway, and the integrative model for this study (i.e., based on secondary outcomes) has substantiated the previous models branch downstream of “Dopamine receptor signaling,” and further the “Protein Ubiquitination” pathway is a newly added pathway downstream of “GABA Receptor Signaling” pathway of the previous integrative model, which then could affect both neuroplasticity and neuronal apoptosis.
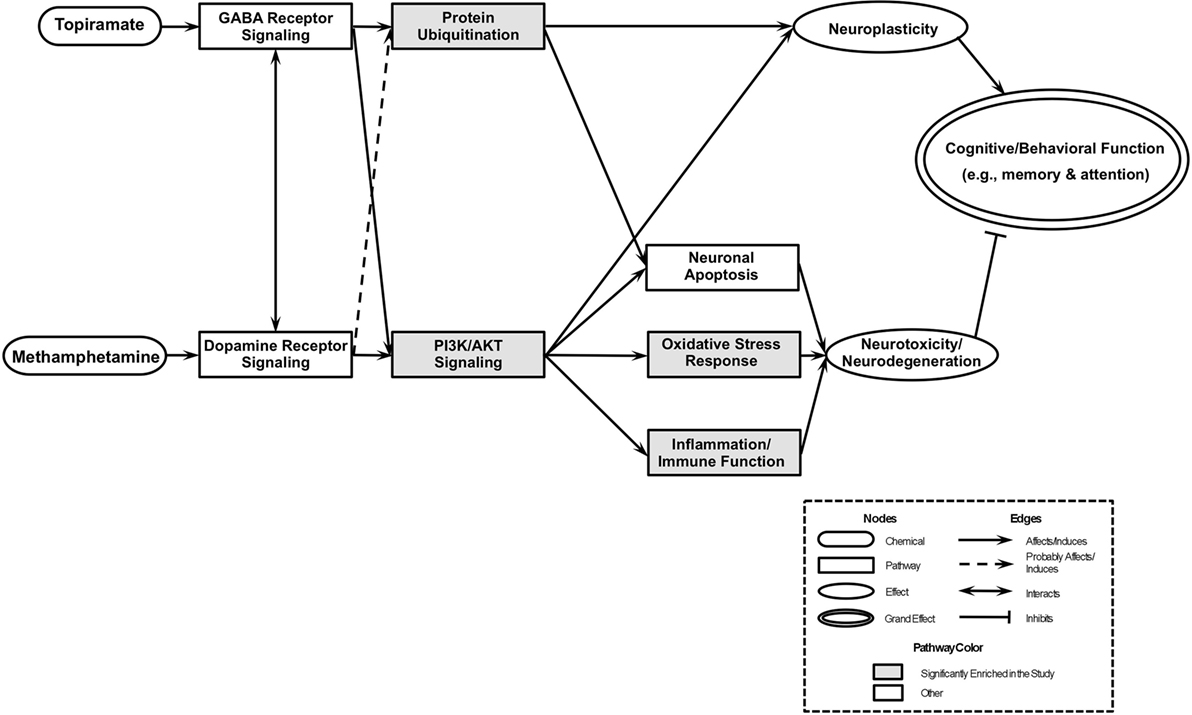
Figure 4. An integrated model of biological pathways related to topiramate (TPM) treatment for methamphetamine (METH) addiction. The joint effects of TPM and METH act on several molecular pathways that eventually lead to modulations of neuroplasticity and neurotoxicity/neurodegeneration, which results in abstinence and reduction of METH use. Pathways enriched exclusively in TPM responder groups at weeks 8 and 12 are highlighted in gray.
In this study, by analyzing gene expression profiling of whole blood, we attempted to define transcriptional patterns that differentiate TPM responders from non-responders. Whole blood has been increasingly used as a more accessible tissue for identifying proxy gene expression biomarkers for CNS, e.g., brain’s circadian phase (95) and ASD (96, 97). As shown in Vawter et al. (98), the use of whole blood for studying gene expression could avoid several important confounding variables associated with postmortem brain studies, e.g., hypoxia, pyrexia, postmortem interval, mRNA integrity, cellular heterogeneity of subcortical and cortical tissues that need to be controlled for in subsequent gene expression analyses. Further, recent studies demonstrate that blood cell-derived RNA could be used to distinguish schizophrenia, bipolar disorder, and control samples with high accuracies (99). The consistency of peripheral gene expression data and the overlap with brain expression has also been evaluated by Rollins et al. (100), which demonstrated that postmortem subjects’ brain and peripheral blood mononuclear cell (PBMC) profiles showed co-expression levels of summarized transcripts for 4,103 of 17,859 (22.9%) RefSeq transcripts. However, because of the concern that whole blood gene expression is not completely correlated with brain gene expression and has a heterogeneous composition (e.g., T-and B-lymphocytes, PBMCs, and other cell types), gene expression patterns identified by this study shall be interpreted with caution and required to be further validated in CNS studies. One of the major limitations of this study is that no quantitative real-time PCR was applied to validate gene expression changes of the 32 gene candidates presented in Table 2, which was primarily due to a lack of sufficient high quality RNA for us to conduct such analysis.
In conclusion, this study of the transcriptome of secondary outcomes provided additional biological insights into TPM treatment response for METH dependence beyond the previous gene expression study based the primary outcome (30). Analyses based on ordinary Student’s t-test and empirical Bayes t-test have not only identified novel sets of genes consistently for week 8 and week 12 TPM responders, but also detected several unique pathways, particularly protein ubiquitination and PI3K/AKT signaling pathways, and also a novel PTEN-centered gene interaction network. Therefore, TPM treatment could lead to a decreased METH dependence by reducing oxidative stress and inflammation and enhancing neuroplasticity, which have extended the integrative model based on primary outcome. Combining results obtained from this study with those of the previous study (30), TPM response in METH-dependent subjects is a highly complex process encompassing a diverse spectrum of biological pathways that can be classified into Neuronal function/Synaptic plasticity, Signal transduction, Cardiovascular function, Inflammation/Immune function, and Oxidative Stress Response categories.
Ethics Statement
The Institutional Review Boards of each clinical site and the VA Human Rights Committee approved the protocol for and conduct of the study.
Author Contributions
Conceived, designed, and performed the experiments: TN, JW, JM, and MDL. Analyzed the data: TN, JL, JW, and JM. Contributed reagents/materials/analysis tools: TN, JW, and MDL. Wrote the paper: TN, JW, and MDL.
Conflict of Interest Statement
The authors declare that the research was conducted in the absence of any commercial or financial relationships that could be construed as a potential conflict of interest.
Acknowledgments
The clinical and expression data used in this study were from a clinical trial, which was conducted through the Department of Veterans Affairs Cooperative Studies Program (Interagency Agreement No. Y1-DA4006) with the financial support from National Institute on Drug Abuse of NIH. The clinical trial data used for this study are registered in www.Clinicaltrials.gov with the identifier: NCT00345371. The authors express our gratitude to invaluable contributions of clinical information and blood samples by all participants in this clinical trial, as well as the dedicated work of many research staff at the clinical sites who participated in the trial. All statistical and bioinformatics analyses of expression data were in part supported by NIH grant DA-137873 to ML and an NIH contract to Information Management Consultations (IMC, Reston, VA).
Funding
Statistical and bioinformatics analyses of expression data were in part supported by National Institutes of Health grant DA-137873 to MDL and an NIH Contract to IMC. The funders had no role in study design, data collection and analysis, decision to publish, or preparation of the manuscript.
Supplementary Material
The Supplementary Material for this article can be found online at http://www.frontiersin.org/articles/10.3389/fpsyt.2017.00271/full#supplementary-material.
Footnotes
- ^https://www.qiagenbioinformatics.com/products/ingenuity-pathway-analysis/.
- ^https://bioportal.bioontology.org/projects/Onto-Express. Note: The original Onto-Express has been developed to iPathwayGuide (Advaita, Plymouth, MI) at website: https://www.advaitabio.com/gene-ontology-pathway-analysis.html.
- ^http://www.ncbi.nlm.nih.gov/geo/query/acc.cgi?acc=GSE107015.
References
1. Elkashef A, Vocci F, Hanson G, White J, Wickes W, Tiihonen J. Pharmacotherapy of methamphetamine addiction: an update. Subst Abus (2008) 29:31–49. doi:10.1080/08897070802218554
2. Nordahl TE, Salo R, Leamon M. Neuropsychological effects of chronic methamphetamine use on neurotransmitters and cognition: a review. J Neuropsychiatry Clin Neurosci (2003) 15:317–25. doi:10.1176/jnp.15.3.317
3. Scott JC, Woods SP, Matt GE, Meyer RA, Heaton RK, Atkinson JH, et al. Neurocognitive effects of methamphetamine: a critical review and meta-analysis. Neuropsychol Rev (2007) 17:275–97. doi:10.1007/s11065-007-9031-0
4. Cho AK, Kumagai Y. Metabolism of amphetamine and other arylisopropylamines. In: Cho AK, Segal DS, editors. Amphetamine and Its Analogs: Psychopharmacology, Toxicology, and Abuse. San Diego: Academic Press (1994). p. 43–77.
5. Matsumoto T, Kamijo A, Miyakawa T, Endo K, Yabana T, Kishimoto H, et al. Methamphetamine in Japan: the consequences of methamphetamine abuse as a function of route of administration. Addiction (2002) 97:809–17. doi:10.1046/j.1360-0443.2002.00143.x
6. Kalechstein AD, Newton TF, Green M. Methamphetamine dependence is associated with neurocognitive impairment in the initial phases of abstinence. J Neuropsychiatry Clin Neurosci (2003) 15:215–20. doi:10.1176/jnp.15.2.215
7. Rose ME, Grant JE. Pharmacotherapy for methamphetamine dependence: a review of the pathophysiology of methamphetamine addiction and the theoretical basis and efficacy of pharmacotherapeutic interventions. Ann Clin Psychiatry (2008) 20:145–55. doi:10.1080/10401230802177656
8. Rawson RA, Condon TP. Why do we need an addiction supplement focused on methamphetamine? Addiction (2007) 102(Suppl 1):1–4. doi:10.1111/j.1360-0443.2006.01781.x
9. Johnson BA. Progress in the development of topiramate for treating alcohol dependence: from a hypothesis to a proof-of-concept study. Alcohol Clin Exp Res (2004) 28:1137–44. doi:10.1097/01.ALC.0000134533.96915.08
10. Angehagen M, Ben-Menachem E, Ronnback L, Hansson E. Novel mechanisms of action of three antiepileptic drugs, vigabatrin, tiagabine, and topiramate. Neurochem Res (2003) 28:333–40. doi:10.1023/A:1022393604014
11. Johnson BA, Ait-Daoud N, Bowden CL, DiClemente CC, Roache JD, Lawson K, et al. Oral topiramate for treatment of alcohol dependence: a randomised controlled trial. Lancet (2003) 361:1677–85. doi:10.1016/S0140-6736(03)13370-3
12. Kampman KM, Pettinati H, Lynch KG, Dackis C, Sparkman T, Weigley C, et al. A pilot trial of topiramate for the treatment of cocaine dependence. Drug Alcohol Depend (2004) 75:233–40. doi:10.1016/j.drugalcdep.2004.03.008
13. Johnson BA, Ait-Daoud N, Akhtar FZ, Javors MA. Use of oral topiramate to promote smoking abstinence among alcohol-dependent smokers: a randomized controlled trial. Arch Intern Med (2005) 165:1600–5. doi:10.1001/archinte.165.14.1600
14. Bialer M, Johannessen SI, Kupferberg HJ, Levy RH, Loiseau P, Perucca E. Progress report on new antiepileptic drugs: a summary of the Fifth Eilat Conference (EILAT V). Epilepsy Res (2001) 43:11–58. doi:10.1016/S0920-1211(00)00171-6
15. Doose DR, Walker SA, Gisclon LG, Nayak RK. Single-dose pharmacokinetics and effect of food on the bioavailability of topiramate, a novel antiepileptic drug. J Clin Pharmacol (1996) 36:884–91. doi:10.1002/j.1552-4604.1996.tb04754.x
16. Garnett WR. Clinical pharmacology of topiramate: a review. Epilepsia (2000) 41(Suppl 1):S61–5. doi:10.1111/j.1528-1157.2000.tb02174.x
17. Angehagen M, Ben-Menachem E, Shank R, Ronnback L, Hansson E. Topiramate modulation of kainate-induced calcium currents is inversely related to channel phosphorylation level. J Neurochem (2004) 88:320–5. doi:10.1046/j.1471-4159.2003.02186.x
18. Angehagen M, Ronnback L, Hansson E, Ben-Menachem E. Topiramate reduces AMPA-induced Ca(2+) transients and inhibits GluR1 subunit phosphorylation in astrocytes from primary cultures. J Neurochem (2005) 94:1124–30. doi:10.1111/j.1471-4159.2005.03259.x
19. Gibbs JW III, Sombati S, DeLorenzo RJ, Coulter DA. Cellular actions of topiramate: blockade of kainate-evoked inward currents in cultured hippocampal neurons. Epilepsia (2000) 41(Suppl 1):S10–6. doi:10.1111/j.1528-1157.2000.tb02164.x
20. Gryder DS, Rogawski MA. Selective antagonism of GluR5 kainate-receptor-mediated synaptic currents by topiramate in rat basolateral amygdala neurons. J Neurosci (2003) 23:7069–74.
21. Poulsen CF, Simeone TA, Maar TE, Smith-Swintosky V, White HS, Schousboe A. Modulation by topiramate of AMPA and kainate mediated calcium influx in cultured cerebral cortical, hippocampal and cerebellar neurons. Neurochem Res (2004) 29:275–82. doi:10.1023/B:NERE.0000010456.92887.3b
22. Qian J, Noebels JL. Topiramate alters excitatory synaptic transmission in mouse hippocampus. Epilepsy Res (2003) 55:225–33. doi:10.1016/S0920-1211(03)00120-7
23. Skradski S, White HS. Topiramate blocks kainate-evoked cobalt influx into cultured neurons. Epilepsia (2000) 41(Suppl 1):S45–7. doi:10.1111/j.1528-1157.2000.tb02171.x
24. Ait-Daoud N, Malcolm RJ Jr, Johnson BA. An overview of medications for the treatment of alcohol withdrawal and alcohol dependence with an emphasis on the use of older and newer anticonvulsants. Addict Behav (2006) 31:1628–49. doi:10.1016/j.addbeh.2005.12.029
25. Elkashef A, Kahn R, Yu E, Iturriaga E, Li SH, Anderson A, et al. Topiramate for the treatment of methamphetamine addiction: a multi-center placebo-controlled trial. Addiction (2012) 107:1297–306. doi:10.1111/j.1360-0443.2011.03771.x
26. Rocc P, De Leo C, Eva C, Marchiaro L, Milani AM, Musso R, et al. Decrease of the D4 dopamine receptor messenger RNA expression in lymphocytes from patients with major depression. Prog Neuropsychopharmacol Biol Psychiatry (2002) 26:1155–60. doi:10.1016/S0278-5846(02)00253-1
27. Iga J, Ueno S, Yamauchi K, Numata S, Kinouchi S, Tayoshi-Shibuya S, et al. Altered HDAC5 and CREB mRNA expressions in the peripheral leukocytes of major depression. Prog Neuropsychopharmacol Biol Psychiatry (2007) 31:628–32. doi:10.1016/j.pnpbp.2006.12.014
28. Iga J, Ueno S, Ohmori T. Molecular assessment of depression from mRNAs in the peripheral leukocytes. Ann Med (2008) 40:336–42. doi:10.1080/07853890802082088
29. Gladkevich A, Kauffman HF, Korf J. Lymphocytes as a neural probe: potential for studying psychiatric disorders. Prog Neuropsychopharmacol Biol Psychiatry (2004) 28:559–76. doi:10.1016/j.pnpbp.2004.01.009
30. Li MD, Wang J, Niu T, Ma JZ, Seneviratne C, Ait-Daoud N, et al. Transcriptome profiling and pathway analysis of genes expressed differentially in participants with or without a positive response to topiramate treatment for methamphetamine addiction. BMC Med Genomics (2014) 7:65. doi:10.1186/s12920-014-0065-x
31. Ma JZ, Johnson BA, Yu E, Weiss D, McSherry F, Saadvandi J, et al. Fine-grain analysis of the treatment effect of topiramate on methamphetamine addiction with latent variable analysis. Drug Alcohol Depend (2013) 130:45–51. doi:10.1016/j.drugalcdep.2012.10.009
32. APA. Diagnostic and Statistical Manual of Mental Disorders. 4th ed. Washington, DC: American Psychiatric Association Publishing (1994).
33. Yusenko MV, Kuiper RP, Boethe T, Ljungberg B, van Kessel AG, Kovacs G. High-resolution DNA copy number and gene expression analyses distinguish chromophobe renal cell carcinomas and renal oncocytomas. BMC Cancer (2009) 9:152. doi:10.1186/1471-2407-9-152
35. Uusküla L, Mannik J, Rull K, Minajeva A, Koks S, Vaas P, et al. Mid-gestational gene expression profile in placenta and link to pregnancy complications. PLoS One (2012) 7:e49248. doi:10.1371/journal.pone.0049248
36. Smyth GK. Limma: linear models for microarray data. In: Gentleman R, Carey V, Dudoit S, Irizarry RA, Huber W, editors. Bioinformatics and Computational Biology Solutions Using R and Bioconductor. New York: Springer (2005). p. 397–420.
37. Nakatani N, Hattori E, Ohnishi T, Dean B, Iwayama Y, Matsumoto I, et al. Genome-wide expression analysis detects eight genes with robust alterations specific to bipolar I disorder: relevance to neuronal network perturbation. Hum Mol Genet (2006) 15:1949–62. doi:10.1093/hmg/ddl118
38. Benjamini Y, Hochberg Y. Controlling the false discovery rate: a practical and powerful approach to multiple testing. J R Stat Soc Series B Stat Methodol (1995) 57:289–300.
39. Draghici S, Khatri P, Tarca AL, Amin K, Done A, Voichita C, et al. A systems biology approach for pathway level analysis. Genome Res (2007) 17:1537–45. doi:10.1101/gr.6202607
40. Khatri P, Voichita C, Kattan K, Ansari N, Khatri A, Georgescu C, et al. Onto-tools: new additions and improvements in 2006. Nucleic Acids Res (2007) 35:W206–11. doi:10.1093/nar/gkm327
41. Fraser MM, Bayazitov IT, Zakharenko SS, Baker SJ. Phosphatase and tensin homolog, deleted on chromosome 10 deficiency in brain causes defects in synaptic structure, transmission and plasticity, and myelination abnormalities. Neuroscience (2008) 151:476–88. doi:10.1016/j.neuroscience.2007.10.048
42. Jurado S, Benoist M, Lario A, Knafo S, Petrok CN, Esteban JA. PTEN is recruited to the postsynaptic terminal for NMDA receptor-dependent long-term depression. EMBO J (2010) 29:2827–40. doi:10.1038/emboj.2010.160
43. Sarrio D, Palacios J, Hergueta-Redondo M, Gomez-Lopez G, Cano A, Moreno-Bueno G. Functional characterization of E- and P-cadherin in invasive breast cancer cells. BMC Cancer (2009) 9:74. doi:10.1186/1471-2407-9-74
44. Wang H, Liu Y, Briesemann M, Yan J. Computational analysis of gene regulation in animal sleep deprivation. Physiol Genomics (2010) 42:427–36. doi:10.1152/physiolgenomics.00205.2009
45. Garcia-Claver A, Lorente M, Mur P, Campos-Martin Y, Mollejo M, Velasco G, et al. Gene expression changes associated with erlotinib response in glioma cell lines. Eur J Cancer (2013) 49:1641–53. doi:10.1016/j.ejca.2013.01.002
46. Ambrogio C, Gomez-Lopez G, Falcone M, Vidal A, Nadal E, Crosetto N, et al. Combined inhibition of DDR1 and Notch signaling is a therapeutic strategy for KRAS-driven lung adenocarcinoma. Nat Med (2016) 22:270–7. doi:10.1038/nm.4041
47. Bossi P, Bergamini C, Siano M, Cossu Rocca M, Sponghini AP, Favales F, et al. Functional genomics uncover the biology behind the responsiveness of head and neck squamous cell cancer patients to cetuximab. Clin Cancer Res (2016) 22:3961–70. doi:10.1158/1078-0432.CCR-15-2547
48. Taylor S, Huang Y, Mallett G, Stathopoulou C, Felizardo TC, Sun MA, et al. PD-1 regulates KLRG1+ group 2 innate lymphoid cells. J Exp Med (2017) 214:1663–78. doi:10.1084/jem.20161653
49. Ishwaran H, Rao JS, Kogalur UB. BAMarraytrade mark: Java software for Bayesian analysis of variance for microarray data. BMC Bioinformatics (2006) 7:59. doi:10.1186/1471-2105-7-59
50. Ploner A, Calza S, Gusnanto A, Pawitan Y. Multidimensional local false discovery rate for microarray studies. Bioinformatics (2006) 22:556–65. doi:10.1093/bioinformatics/btk013
51. Jiao S, Zhang S. The t-mixture model approach for detecting differentially expressed genes in microarrays. Funct Integr Genomics (2008) 8:181–6. doi:10.1007/s10142-007-0071-6
52. Graf AC, Bauer P. Model selection based on FDR-thresholding optimizing the area under the ROC-curve. Stat Appl Genet Mol Biol (2009) 8:Article 31. doi:10.2202/1544-6115.1462
53. Wang H, Bedford FK, Brandon NJ, Moss SJ, Olsen RW. GABA(A)-receptor-associated protein links GABA(A) receptors and the cytoskeleton. Nature (1999) 397:69–72. doi:10.1038/16264
54. Nemos C, Mansuy V, Vernier-Magnin S, Fraichard A, Jouvenot M, Delage-Mourroux R. Expression of gec1/GABARAPL1 versus GABARAP mRNAs in human: predominance of gec1/GABARAPL1 in the central nervous system. Brain Res Mol Brain Res (2003) 119:216–9. doi:10.1016/j.molbrainres.2003.09.011
55. Trifonov S, Houtani T, Shimizu J, Hamada S, Kase M, Maruyama M, et al. GPR155: gene organization, multiple mRNA splice variants and expression in mouse central nervous system. Biochem Biophys Res Commun (2010) 398:19–25. doi:10.1016/j.bbrc.2010.05.162
56. Nishimura Y, Martin CL, Vazquez-Lopez A, Spence SJ, Alvarez-Retuerto AI, Sigman M, et al. Genome-wide expression profiling of lymphoblastoid cell lines distinguishes different forms of autism and reveals shared pathways. Hum Mol Genet (2007) 16:1682–98. doi:10.1093/hmg/ddm116
57. Wu X, Hsuchou H, Kastin AJ, He Y, Khan RS, Stone KP, et al. Interleukin-15 affects serotonin system and exerts antidepressive effects through IL15Ralpha receptor. Psychoneuroendocrinology (2011) 36:266–78. doi:10.1016/j.psyneuen.2010.07.017
58. He Y, Hsuchou H, Wu X, Kastin AJ, Khan RS, Pistell PJ, et al. Interleukin-15 receptor is essential to facilitate GABA transmission and hippocampal-dependent memory. J Neurosci (2010) 30:4725–34. doi:10.1523/JNEUROSCI.6160-09.2010
59. Smyth GK. Linear models and empirical bayes methods for assessing differential expression in microarray experiments. Stat Appl Genet Mol Biol (2004) 3:Article 3. doi:10.2202/1544-6115.1027
60. Jeanmougin M, de Reynies A, Marisa L, Paccard C, Nuel G, Guedj M. Should we abandon the t-test in the analysis of gene expression microarray data: a comparison of variance modeling strategies. PLoS One (2010) 5:e12336. doi:10.1371/journal.pone.0012336
61. Ritchie ME, Phipson B, Wu D, Hu Y, Law CW, Shi W, et al. limma powers differential expression analyses for RNA-sequencing and microarray studies. Nucleic Acids Res (2015) 43:e47. doi:10.1093/nar/gkv007
62. Thomas JG, Olson JM, Tapscott SJ, Zhao LP. An efficient and robust statistical modeling approach to discover differentially expressed genes using genomic expression profiles. Genome Res (2001) 11:1227–36. doi:10.1101/gr.165101
63. Garcia-Junco-Clemente P, Golshani P. PTEN: a master regulator of neuronal structure, function, and plasticity. Commun Integr Biol (2014) 7:e28358. doi:10.4161/cib.28358
64. Knafo S, Sanchez-Puelles C, Palomer E, Delgado I, Draffin JE, Mingo J, et al. PTEN recruitment controls synaptic and cognitive function in Alzheimer’s models. Nat Neurosci (2016) 19:443–53. doi:10.1038/nn.4225
65. Knafo S, Esteban JA. PTEN: local and global modulation of neuronal function in health and disease. Trends Neurosci (2017) 40:83–91. doi:10.1016/j.tins.2016.11.008
66. Murphy PM, Tiffany HL, McDermott D, Ahuja SK. Sequence and organization of the human N-formyl peptide receptor-encoding gene. Gene (1993) 133:285–90. doi:10.1016/0378-1119(93)90653-K
67. Narayan S, Tang B, Head SR, Gilmartin TJ, Sutcliffe JG, Dean B, et al. Molecular profiles of schizophrenia in the CNS at different stages of illness. Brain Res (2008) 1239:235–48. doi:10.1016/j.brainres.2008.08.023
68. Saito A, Fujikura-Ouchi Y, Ito C, Matsuoka H, Shimoda K, Akiyama K. An association study on polymorphisms in the PEA15, ENTPD4, and GAS2L1 genes and schizophrenia. Psychiatry Res (2011) 185:9–15. doi:10.1016/j.psychres.2009.09.018
69. Klempan TA, Sequeira A, Canetti L, Lalovic A, Ernst C, ffrench-Mullen J, et al. Altered expression of genes involved in ATP biosynthesis and GABAergic neurotransmission in the ventral prefrontal cortex of suicides with and without major depression. Mol Psychiatry (2009) 14:175–89. doi:10.1038/sj.mp.4002110
70. Blake DJ, Forrest M, Chapman RM, Tinsley CL, O’Donovan MC, Owen MJ. TCF4, schizophrenia, and Pitt-Hopkins syndrome. Schizophr Bull (2010) 36:443–7. doi:10.1093/schbul/sbq035
71. Stefansson H, Ophoff RA, Steinberg S, Andreassen OA, Cichon S, Rujescu D, et al. Common variants conferring risk of schizophrenia. Nature (2009) 460:744–7. doi:10.1038/nature08186
72. Kwak YD, Ma T, Diao S, Zhang X, Chen Y, Hsu J, et al. NO signaling and S-nitrosylation regulate PTEN inhibition in neurodegeneration. Mol Neurodegener (2010) 5:49. doi:10.1186/1750-1326-5-49
73. Bown C, Wang JF, MacQueen G, Young LT. Increased temporal cortex ER stress proteins in depressed subjects who died by suicide. Neuropsychopharmacology (2000) 22:327–32. doi:10.1016/S0893-133X(99)00091-3
74. Kakiuchi C, Ishiwata M, Nanko S, Kunugi H, Minabe Y, Nakamura K, et al. Association analysis of HSP90B1 with bipolar disorder. J Hum Genet (2007) 52:794–803. doi:10.1007/s10038-007-0188-4
75. Curtis D, Kalsi G, Brynjolfsson J, McInnis M, O’Neill J, Smyth C, et al. Genome scan of pedigrees multiply affected with bipolar disorder provides further support for the presence of a susceptibility locus on chromosome 12q23-q24, and suggests the presence of additional loci on 1p and 1q. Psychiatr Genet (2003) 13:77–84. doi:10.1097/01.ypg.0000056684.89558.d2
76. Ekholm JM, Kieseppa T, Hiekkalinna T, Partonen T, Paunio T, Perola M, et al. Evidence of susceptibility loci on 4q32 and 16p12 for bipolar disorder. Hum Mol Genet (2003) 12:1907–15. doi:10.1093/hmg/ddg199
77. Green E, Elvidge G, Jacobsen N, Glaser B, Jones I, O’Donovan MC, et al. Localization of bipolar susceptibility locus by molecular genetic analysis of the chromosome 12q23-q24 region in two pedigrees with bipolar disorder and Darier’s disease. Am J Psychiatry (2005) 162:35–42. doi:10.1176/appi.ajp.162.1.35
78. Maziade M, Roy MA, Chagnon YC, Cliche D, Fournier JP, Montgrain N, et al. Shared and specific susceptibility loci for schizophrenia and bipolar disorder: a dense genome scan in Eastern Quebec families. Mol Psychiatry (2005) 10:486–99. doi:10.1038/sj.mp.4001594
79. Rickle A, Behbahani H, Ankarcrona M, Winblad B, Cowburn RF. PTEN, Akt, and GSK3beta signalling in rat primary cortical neuronal cultures following tumor necrosis factor-alpha and trans-4-hydroxy-2-nonenal treatments. J Neurosci Res (2006) 84:596–605. doi:10.1002/jnr.20970
80. Stambolic V, Suzuki A, de la Pompa JL, Brothers GM, Mirtsos C, Sasaki T, et al. Negative regulation of PKB/Akt-dependent cell survival by the tumor suppressor PTEN. Cell (1998) 95:29–39. doi:10.1016/S0092-8674(00)81780-8
81. Maehama T, Taylor GS, Dixon JE. PTEN and myotubularin: novel phosphoinositide phosphatases. Annu Rev Biochem (2001) 70:247–79. doi:10.1146/annurev.biochem.70.1.247
82. Ku BM, Lee YK, Jeong JY, Mun J, Han JY, Roh GS, et al. Ethanol-induced oxidative stress is mediated by p38 MAPK pathway in mouse hippocampal cells. Neurosci Lett (2007) 419:64–7. doi:10.1016/j.neulet.2007.03.049
83. Kaminska B. MAPK signalling pathways as molecular targets for anti-inflammatory therapy – from molecular mechanisms to therapeutic benefits. Biochim Biophys Acta (2005) 1754:253–62. doi:10.1016/j.bbapap.2005.08.017
84. Kaminska B, Gozdz A, Zawadzka M, Ellert-Miklaszewska A, Lipko M. MAPK signal transduction underlying brain inflammation and gliosis as therapeutic target. Anat Rec (Hoboken) (2009) 292:1902–13. doi:10.1002/ar.21047
85. Segura Torres JE, Chaparro-Huerta V, Rivera Cervantres MC, Montes-Gonzalez R, Flores Soto ME, Beas-Zarate C. Neuronal cell death due to glutamate excitotocity is mediated by p38 activation in the rat cerebral cortex. Neurosci Lett (2006) 403:233–8. doi:10.1016/j.neulet.2006.04.063
86. Yeste-Velasco M, Folch J, Pallas M, Camins A. The p38(MAPK) signaling pathway regulates neuronal apoptosis through the phosphorylation of the retinoblastoma protein. Neurochem Int (2009) 54:99–105. doi:10.1016/j.neuint.2008.10.004
87. Savarin-Vuaillat C, Ransohoff RM. Chemokines and chemokine receptors in neurological disease: raise, retain, or reduce? Neurotherapeutics (2007) 4:590–601. doi:10.1016/j.nurt.2007.07.004
88. Khan MZ, Shimizu S, Patel JP, Nelson A, Le MT, Mullen-Przeworski A, et al. Regulation of neuronal P53 activity by CXCR 4. Mol Cell Neurosci (2005) 30:58–66. doi:10.1016/j.mcn.2005.05.007
89. Rolfe M, Chiu MI, Pagano M. The ubiquitin-mediated proteolytic pathway as a therapeutic area. J Mol Med (1997) 75:5–17. doi:10.1007/s001090050081
90. Wang J, Cui W, Wei J, Sun D, Gutala R, Gu J, et al. Genome-wide expression analysis reveals diverse effects of acute nicotine exposure on neuronal function-related genes and pathways. Front Psychiatry (2011) 2:5. doi:10.3389/fpsyt.2011.00005
91. Vocci FJ, Appel NM. Approaches to the development of medications for the treatment of methamphetamine dependence. Addiction (2007) 102(Suppl 1):96–106. doi:10.1111/j.1360-0443.2007.01772.x
92. Jaiswal AK. Nrf2 signaling in coordinated activation of antioxidant gene expression. Free Radic Biol Med (2004) 36:1199–207. doi:10.1016/j.freeradbiomed.2004.02.074
93. Nguyen T, Nioi P, Pickett CB. The Nrf2-antioxidant response element signaling pathway and its activation by oxidative stress. J Biol Chem (2009) 284:13291–5. doi:10.1074/jbc.R900010200
94. Johnson JA, Johnson DA, Kraft AD, Calkins MJ, Jakel RJ, Vargas MR, et al. The Nrf2-ARE pathway: an indicator and modulator of oxidative stress in neurodegeneration. Ann N Y Acad Sci (2008) 1147:61–9. doi:10.1196/annals.1427.036
95. Laing EE, Moller-Levet CS, Poh N, Santhi N, Archer SN, Dijk DJ. Blood transcriptome based biomarkers for human circadian phase. Elife (2017) 6:e20214. doi:10.7554/eLife.20214
96. Glatt SJ, Tsuang MT, Winn M, Chandler SD, Collins M, Lopez L, et al. Blood-based gene expression signatures of infants and toddlers with autism. J Am Acad Child Adolesc Psychiatry (2012) 51:934–44.e2. doi:10.1016/j.jaac.2012.07.007
97. Pramparo T, Pierce K, Lombardo MV, Carter Barnes C, Marinero S, Ahrens-Barbeau C, et al. Prediction of autism by translation and immune/inflammation coexpressed genes in toddlers from pediatric community practices. JAMA Psychiatry (2015) 72:386–94. doi:10.1001/jamapsychiatry.2014.3008
98. Vawter MP, Ferran E, Galke B, Cooper K, Bunney WE, Byerley W. Microarray screening of lymphocyte gene expression differences in a multiplex schizophrenia pedigree. Schizophr Res (2004) 67:41–52. doi:10.1016/S0920-9964(03)00151-8
99. Tsuang MT, Nossova N, Yager T, Tsuang MM, Guo SC, Shyu KG, et al. Assessing the validity of blood-based gene expression profiles for the classification of schizophrenia and bipolar disorder: a preliminary report. Am J Med Genet B Neuropsychiatr Genet (2005) 133B:1–5. doi:10.1002/ajmg.b.30161
Keywords: topiramate, methamphetamine dependence, gene expression profiling, clinical trial, microarray analysis
Citation: Niu T, Li J, Wang J, Ma JZ and Li MD (2017) Identification of Novel Signal Transduction, Immune Function, and Oxidative Stress Genes and Pathways by Topiramate for Treatment of Methamphetamine Dependence Based on Secondary Outcomes. Front. Psychiatry 8:271. doi: 10.3389/fpsyt.2017.00271
Received: 23 July 2017; Accepted: 20 November 2017;
Published: 13 December 2017
Edited by:
Chad A. Bousman, University of Calgary, CanadaReviewed by:
Marek Schwendt, University of Florida, United StatesJennifer C. Felger, Emory University, United States
Andrew S. Gibbons, University of Melbourne, Australia
Copyright: © 2017 Niu, Li, Wang, Ma and Li. This is an open-access article distributed under the terms of the Creative Commons Attribution License (CC BY). The use, distribution or reproduction in other forums is permitted, provided the original author(s) or licensor are credited and that the original publication in this journal is cited, in accordance with accepted academic practice. No use, distribution or reproduction is permitted which does not comply with these terms.
*Correspondence: Ming D. Li, ml2km@zju.edu.cn, limd586@outlook.com