 Afra Wohlschläger
 Harish Karne2
 Denis Jordan
 Stephen E. Jones
 Amit Anand
- 1Department of Diagonistic and Interventional Neuroradiology and TUMNIC, Technische Universität München, Munich, Germany
- 2Center for Behavioral Health, Cleveland Clinic, Cleveland, OH, United States
- 3Department of Anesthesiology, Klinikum Rechts der Isar, Technische Universität München, Munich, Germany
- 4Radiology Institute, Cleveland Clinic, Cleveland, OH, United States
Background: Dorsal raphe nucleus (DRN) and ventral tegmental area (VTA) are major brainstem monamine nuclei consisting of serotonin and dopamine neurons respectively. Animal studies show that firing patterns in both nuclei are altered when animals exhibit depression like behaviors. Functional MRI studies in humans have shown reduced VTA activation and DRN connectivity in depression. This study for the first time aims at investigating the functional integrity of local neuronal firing concurrently in both the VTA and DRN in vivo in humans using spectral analysis of resting state low frequency fluctuation fMRI.
Method: A total of 97 medication-free subjects—67 medication-free young patients (ages 18–30) with major depressive disorder and 30 closely matched healthy controls were included in the study to detect aberrant dynamics in DRN and VTA. For the investigation of altered localized dynamics we conducted power spectral analysis and above this spectral cross correlation between the two groups. Complementary to this, spectral dependence of permutation entropy, an information theoretical measure, was compared between groups.
Results: Patients displayed significant spectral slowing in VTA vs. controls (p = 0.035, corrected). In DRN, spectral slowing was less pronounced, but the amount of slowing significantly correlated with 17-item Hamilton Depression Rating scores of depression severity (p = 0.038). Signal complexity as assessed via permutation entropy showed spectral alterations inline with the results on spectral slowing.
Conclusion: Our results indicate that altered functional dynamics of VTA and DRN in depression can be detected from regional fMRI signal. On this basis, impact of antidepressant treatment and treatment response can be assessed using these markers in future studies.
Introduction
The three major Brain stem monoamine nuclei (BSMN)—ventral tegmental area (VTA), dorsal raphe nucleus (DRN), and locus coeruleus (LC) consist of clusters of dopaminergic (DA), serotonergic (5-HT) and noradrenergic (NE) producing neurons respectively. Though they consist of a few thousand of neurons their broad projections to nearly all cortico-limbic regions have significant modulatory effects on brain regions and circuits. The involvement of the monoamine in reward, arousal, vegetative and cognitive functions is well established. Depression is frequently associated with abnormalities in these functions and therefore monoamine dysfunction has been investigated in detail in animal and human models of depression (1, 2). Depletion of monoamines leads to development of depression like symptoms and reverses the therapeutic effects of antidepressants (3). Most antidepressants act on monoamine reuptake mechanisms or monoamine post-synaptic receptors (4). Despite the generally accepted critical role that the BSMN play in the pathophysiology of depression the functional integrity of BSMN pathways have been less well studied. This study is focused on the study of VTA and DRN as LC is too small size to be studied with the methods used in this study.
The VTA is located in the midbrain and primarily consists of dopaminergic neurons with mesocortical and mesolimbic pathways project to cortical and limbic areas respectively (5). The mesolimbic pathway, a part of the medial forebrain bundle (MFB), connects to the limbic areas, particularly the NAcc and constitutes a major reward activated pathway and has been implicated in addictions as well as anhedonia frequently seen in depression (6). Importantly, in recent studies of deep brain stimulation (DBS) for treatment of depression direct or indirect stimulation of the VTA has been hypothesized (7, 8). Lewy bodies in the VTA have been associated with significant depressive symptoms (9). Therefore, regional functional abnormalities are likely to be present in depression.
The DRN is the largest of the raphe nuclei is responsible for majority of the 5-HT transmission to the brain. It is located in the midbrain in the ventral part of the periaqueductal gray matter in the midline. Its rostral end is at the level of the oculomotor nucleus and its caudal subdivision reaches well into the periventricular gray matter of the rostral pons. It primarily consists of serotonergic neurons though other neurotransmitters are also present. Through its ventral ascending pathways, it innervates many limbic and cortical areas involved in mood regulation such as amygdala and the anterior cingulate cortex (ACC). One study reported a 31% decrease in neurons in depressed patients (10) though another study did not (11). Post-mortem studies have reported 5HT1A receptor and tryptophan hydroxylase abnormalities in DRN in depressed suicide subjects (12, 13). Single photon emission computerized imaging (SPECT) and positron emission tomography (PET) studies have reported 5-HT transporter uptake abnormality in the midbrain (14) as well as prediction of antidepressant response based on the mid brain 5-HTT uptake (15, 16). PET scan studies have reported reduction in 5HT1A binding after SSRI treatment (17). Furthermore, baseline elevated 5HT1A binding in the raphe nucleus was reported to be a predictor of treatment response while binding in the cortical and subcortical regions was not (18). Functional connectivity of the DRN has been reported to be decreased when symptoms of depression are mimicked by tryptophan depletion (19).
Several studies prove that DRN as well as VTA possess distinct BOLD representations which allow for detecting characteristic connectivity patterns in the brain (DRN: (20), VTA: (21)). Changed integration of DRN and VTA into overall brain orchestration in psychiatric diseases is observable via fMRI, like in ADHD (22) and in affective disorders (23, 24).
Until now functional integrity of VTA and DRN has been difficult to study because of lack of an appropriate localized metric. In resting-state fMRI, in the absence of an external paradigm, regional signal can be inspected for power spectral differences, differences in spectral cross-correlation, or differences in information content using entropy measures. Both VTA and DRN nuclei show pathological alterations in their firing patterns in MDD in rodent studies (25–29). In VTA, simulations show that timing relations between tonic and phasic firing directly relate to D1 vs. D2 receptor occupancy (30) and therefore seems to be an integral part of the disease mechanism. Therefore, spectral changes can be used to measure changes in the functional integrity of these nuclei. Appearance of bursts in phasic firing of the mesolimbic dopamine system has been shown to occur down to a frequency range of 0.1–0.15 Hz (31–33). This range falls well into the domain which might be observable by fMRI (0.01–0.17 Hz) (34, 35). Also, a small portion of serotonergic neurons in DRN seem to exhibit slow frequency activity (36, 37). Although, BOLD signal from fMRI cannot provide information on precise neuronal timing, changes in the slow regime accessible by BOLD fMRI are indicative of altered neuronal dynamics on a quicker scale.
Furthermore, shifts in spectral cross correlation i.e., correlation of the amplitude of frequency bands of resting state low frequency BOLD fluctuations (rLFBF) between groups allows for the examination of differences in dynamic signal properties within regions of interest. Similarly, a complementary approach of permutation entropy, analyzes the signal complexity at certain frequency bands explicitly ignoring absolute spectral power values (overview in Figure 1).
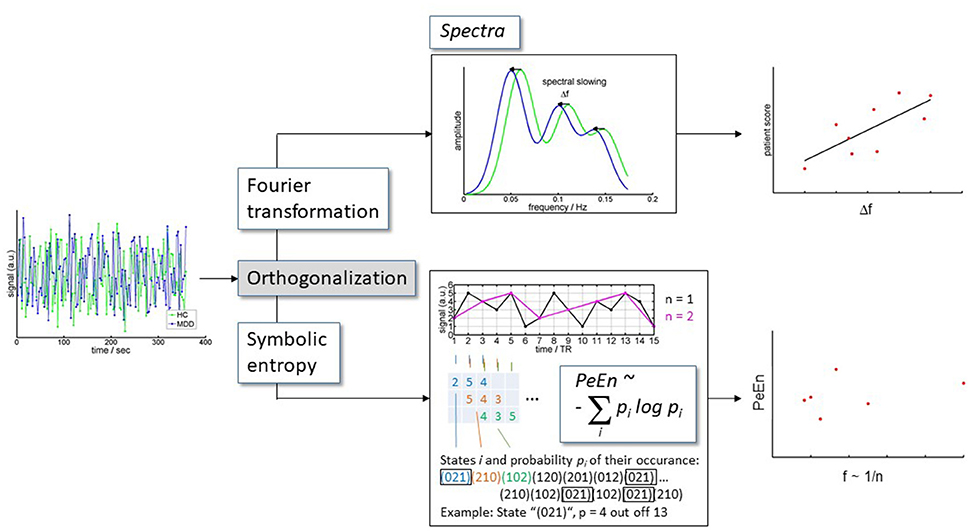
Figure 1. Analysis scheme. BOLD time series extracted from DRN and VTA were orthogonalized toward each other for each subject. Subsequently, the orthogonalized time courses were (i) converted to spectra, and (ii) were analyzed for information content.
We hypothesized that pathological malfunctioning of DRN and VTA has detectable correlates in their BOLD fMRI representations. We therefore aimed at understanding the representation of DRN and VTA via rs-fmri in terms of time course variance, frequency spectra, and spectral information content. We hypothesized that in depression spectral slowing of the BOLD signal will be present in the VTA and DRN and that the degree of slowing will correlate with severity of depressive symptoms.
Methods
Participants
Subjects for this study were derived from a study of depression in young adults (Age 18–30). Subjects were recruited from the outpatient clinic at Cleveland Clinic, Center for Behavioral Health and by advertisement from the community. A total of 91 depressed and 39 healthy controls were included in the study. Out of the 91 depressed subjects some subjects were removed for the following reasons: 5 subjects did not do the scan, 6 subjects due to motion, 5 subjects slept during the scan, 7 subjects for processing and image quality, 1 subject was not used due to other reason. Out of the 39 healthy subjects were removed for the following reasons 2 subjects did not do the scan, 1 subject due to motion, 2 subjects for family history, 3 for image quality and processing, 1 for sleep. Therefore, data from 97 subjects—67 MDD and 30 HC was included in the analysis. This young age group (18–30 years) population was thought to be ideal to study physiological aspects of depression as confound of age related effects can be minimized. All subjects took part in the study after signing an informed consent form approved by the Investigational Review Board (IRB) at Cleveland Clinic Foundation. Both patients and HC were paid $25 for screening and $75 for MRI scan. All subjects underwent a detailed structured diagnostic interview—Mini Neuropsychiatric Interview (MINI) that generated a DSM-IV diagnosis.
Inclusion criteria for patients were: Ages 15–30 years and ability to give voluntary informed consent; (1) Satisfy criteria for DSM-IV-TR Major Depressive Episode using a Structured Interview; (2) Never met criteria for mania or hypomania; (3) 17-item Hamilton Depression Rating Scale score (HDRS) > 18 and < 25; (4) Young Mania Rating Scale (YMRS) score < 10; (5) Satisfy safety criteria to undergo an MRI scan; (6) Able to be managed as outpatients during the study as ascertained by the following—(i) Clinical Global Severity Scale < 5 i.e., moderately ill, (ii) No significant suicidal or homicidal ideation or grossly disabled. Exclusion criteria for all patients were: (1) meeting DSM-IV criteria for schizophrenia, schizoaffective disorder, or an anxiety disorder as a primary diagnosis; (2) use of psychotropics in the past 2 weeks; use of fluoxetine in the past 5 weeks; (3) acutely suicidal or homicidal or requiring inpatient treatment; (4) meeting DSM-IV criteria for substance dependence within the past year, except caffeine or nicotine; (5) positive urinary toxicology screening at baseline; (6) use of alcohol in the past 1 week; serious medical or neurological illness; (7) current pregnancy or breast feeding; (8) metallic implants or other contraindications to MRI.
Inclusion criteria for healthy subjects were: (1) ages 18–30 years and ability to give voluntary informed consent; (2) no history of psychiatric illness or substance abuse or dependence; (3) no significant family history of psychiatric or neurological illness; (4) not currently taking any prescription or centrally acting medications; (5) no use of alcohol in the past 1 week; and no serious medical or neurological illness. Exclusion criteria for healthy subjects were: (1) pregnant or breast-feeding and (2) metallic implants or other contraindication to MRI.
Functional MRI Acquisition
Imaging data consists of T1- and T2-weighted structural scans and resting state fMRI (RS-fMRI). All imaging data was acquired at the Cleveland Clinic Main Campus imaging center using a Siemens 3T Trio and Prisma MR Scanner (Siemens AG, Berlin, Germany) with a 32 receive channel head coil (Nova Medical, Inc., Wilmington, MA) and electronically transferred to the Cleveland Clinic imaging archive system.
Anatomic scans: T1-weighted structural images were acquired with a MPRAGE sequence (echo time = 2.98 ms, repetition time = 2,300 ms, inversion time = 900 ms, flip angle = 9°, field of view = 240 × 256 mm, slice thickness = 1.2 mm).
RS-fMRI scans: 6:16 min scan with eyes open looking at a fixation cross. 39 3.5 mm-thick slices, 2.5 × 2.5 mm voxels in-plane resolution, TR/TE = 2,800/29 ms.
All participants were fitted for a bite bar to restrict head motion during scanning. All EPI data was corrected for spatial distortion using a fieldmap-based shiftmap before further analysis. This step allows matching anatomy to warped regions of brain, including the amygdala and OFC. For resting state functional connectivity, 132 image volumes were acquired in 6:16 min. The first 4 volumes were discarded and data was analyzed on the resulting 128 volumes. Functional connectivity image volumes were acquired while subjects were in the resting state with eyes open looking at a fixation cross, instructed to think nothing in particular. After the resting state scan was completed, the subjects were asked whether they stayed awake and complied with instructions and only those who reported complying with the instructions were included in the analysis.
Data Analyses
Image Analysis
Pre-processing including motion correction
The images were corrected for physiologic noise (38–40) using signals obtained with PESTICA (Physiologic Estimation by Temporal ICA) (41). Special attention was paid to motion correction because both linear and non-linear motion artifacts have been shown to affect functional result (42, 43). Motion correction was performed using SLice-Oriented MOtion COrrection (SLOMOCO) (39). SLOMOCO first performs an in-plane slicewise motion registration followed by an out-of-plane motion parameter estimation and regularization. The regularized out-of-plane and residual in-plane motion parameters are used in a slice-specific second-order motion model that accounts for the effect of adjacent slice motion into or out of the slice of interest as well as the present slice. Finally, the software regresses the physiologic noise model in parallel with the slice-wise second-order motion model, and this regression correction comprises the last stage of SLOMOCO to produce data that has been corrected for physiologic noise and motion.
After motion correction, images were corrected for non-neural sources of variance using a regression-based correction with time series obtained from eroded white matter and ventricular mask (44). The corrected images were normalized to Montreal Neurological Institute (MNI) space, resampled to 2 mm isotropic voxels and finally, bandpass filtered to retain low-frequency fluctuations [0.008–0.175 Hz (upper limit of sampling bandwidth)] using 3dBandpass, from AFNI (Analysis of Functional Neuroimages) (45). For every scan the number of motion-corrupted volumes was identified using the Jiang average voxel displacement measurement (46) computed from the slice-wise motion parameters from SLOMOCO. A corrupted volume was defined as a volume where at least one slice within that volume experienced greater than 1 mm of out of plane motion. Any subject with 13 or more volumes (i.e., more than 10% of volumes) with greater than 1 mm of out of plane motion were excluded from the analysis (39, 46).
Derivation of ROIs for DRN and VTA
Due to limited contrast resolution of small brainstem nuclei in brain MRIs and the lack of a standard corresponding MRI atlas, regions of interest (ROI) were identified using operationalized anatomical criteria developed by an experienced neuroradiologist (S.E.J) for the brainstem based on two well-established brainstem atlases (47 and Duvernoy's Atlas of the Human Brainstem and Cerebellum: High-Field MRI, Surface Anatomy, Internal Structure, Vascularization, and 3D Sectional Anatomy, 2009) (47, 48) for defining the DRN and VTA ROIs.
The procedure has three steps: (1) Define a brainstem axis that will form the perpendicular to axial planes; (2) Defining the superior and inferior extents of the DRN and VTA; (3) Manually drawing the extents of the DRN and VTA in the axial plane. The brainstem axis and axial planes are defined as perpendicular to the mid-sagittal plane and parallel to the line between the central mammillary bodies and the intercollicular fossa. The Paxinos atlas is used to determine the superior and inferior extents because of its uniform axial spacing and well-marked measured longitudinal reference of the axial image with respect to the obex (Paxinos, Figures 50–59) (47). For the DRN, we define the inferior extent as the plane containing the inferior edge of the inferior colliculus (IC) and the superior extent as the plane halfway between the central superior colliculus (SC) and the intercollicular fossa—a superior-inferior distance of typically 7 mm. For the VTA we define the inferior extent as the plane containing the center of the IC and the most superior extent as the plane continuing the center of the superior colliculus (SC)—a superior-inferior distance of typically 6 mm. We use the Duverney atlas to draw the DRN and VTA ROIs in the axial plane, as the Paxinos atlas has more detail than can be seen in the MRIs (Duverney chapter 4, page 55; and Figures 2.18–2.20) (48). In each axial slice, the midline periaquaductal gray matter (PaqGM) is marked off as a strip 1 mm anterior to the cerebral aqueduct. Extending anteriorly from the PaqGM toward the interpeduncular fossa (IpF), all the voxels on either side of the midline are split between the DRN and VTA. For the superior two thirds of DRN axial slices, the posterior two thirds of midline voxels between the IpF and PAq are DRN. For the inferior one third of DRN slices, the posterior half of midline voxels are DRN. Conversely, for the superior two thirds of VTA axial slices, the anterior one third of voxels between the IpF and PAq is VTA. For the inferior one third, the anterior half of midline voxel is VTA. Regarding lateral extent of the DRN, for the inferior two thirds of DRN axial slices a second line of DRN voxels are laterally added to the para-midline voxels from the most posterior DRN voxel to one third (anteriorly) up the midline strip of DRN voxels. Regarding lateral extent of the VTA, in all axial slices the VTA extends diagonally along the IpF border. The most superior slice extends 1 voxel, the next extends 2 voxels, and the remaining slices extend 3 voxels. A second row of VTA voxels adjoins lateral and parallel to the first diagonal along the IpF border for the inferior two thirds of axial VTA slices.
Region of interest templates and time course extraction
DRN & VTA ROI templates were constructed as described above individually for each of 17 healthy subjects. The overlapping areas from these 17 subjects was then used as the two templates for DRN and VTA respectively. These templates were then normalized to the MNI space using Statistical Parametric Mapping (SPM) version 12 software and then the normalized ROIs were used to extract resting state time series from all subjects.
Analysis of variance and time course characteristics
Time courses were analyzed in terms of their variance across time quantified by their standard deviations. Additionally, intra-subject correlations of the time courses between the two regions of interest were analyzed.
Analysis of frequency spectra (FFT and clipping)
Signal time courses for each subject were Fourier transformed using matlab (www.mathworks.com). This resulted in a frequency resolution of 2.8 * 10−3 Hz. Significance of group differences in spectral amplitudes were assessed via Wilcoxon rank sum test.
In the spectra we did not find a 1/f decay of power with frequency f. Efficient noise removal and head motion correction might have led to minimizing the scale free properties, which are partly attributed to noise effects (49). Spectral cross correlation could be directly performed without any normalization procedure. The fact that spectra were flat across frequencies may be due to maximally reduced movement of the subjects, which could have helped in isolating unblurred signal from the ROIs of DRN and VTA. Spectral slowing in the patients was assessed by calculating the correlation between the spectra of each patient shifted toward the spectra of each of the 30 controls (Figure 2). Shifts by 1 to 8 resolution units in both directions (toward higher and lower frequencies) were included as well as zero shift, resulting in 17 different shifts. Pearson R-values were then Fisher-Z transformed to normal distribution and averaged per patient. This resulted in one value per patient. An identical procedure was performed for each control subject toward each of the other control subjects. Significance of these (Fisher-Z transformed) average correlation coefficients was then tested by Wilcoxon signed rank test toward zero correlation. In order to rule out effects of the signal filter on the spectra, 8 data points (0.0223 Hz) and 4 data points (0.0112 Hz) at the lower and upper limits, respectively, of the spectra were excluded from all subsequent analyses (see Figure 2, not from the figures). A spectral range of (0.0223–0.1646) Hz was therefore analyzed.
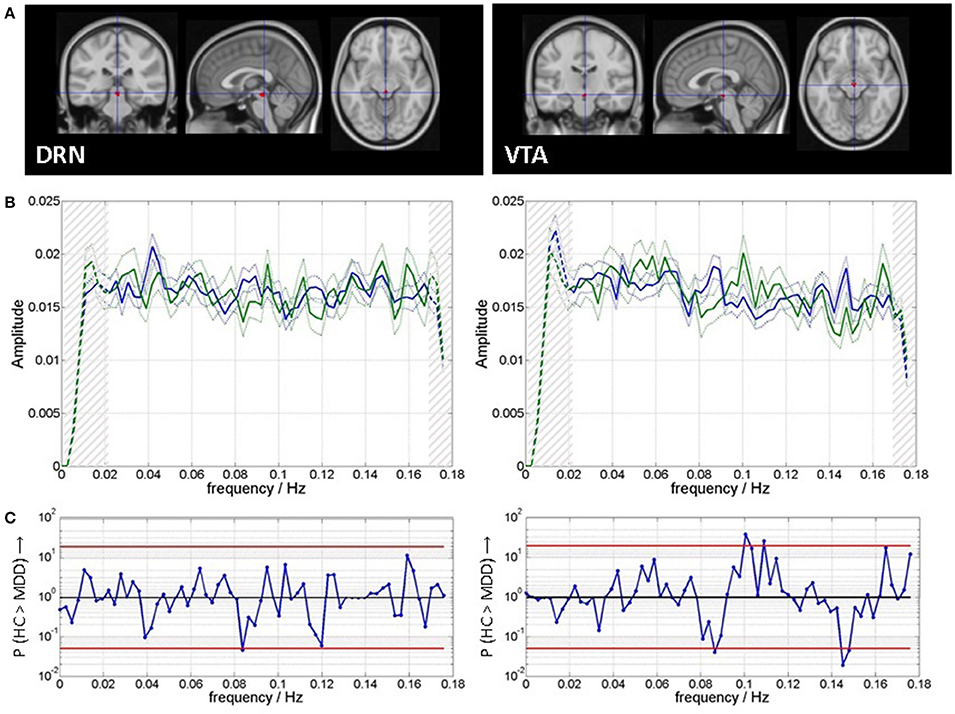
Figure 2. (A) Regions of interest for time course extraction and (B) mean and standard error of mean of spectra for patients (blue) and healthy controls (green). Clipping of spectra in subsequent analyses is indicated by hatching on both ends of the spectra. (C) Spectral group differences are indicated as P-values from Wilcoxon rank sum tests the red lines indicate P = 0.05, uncorrected for multiple comparisons.
For each individual patient, the shift with peak correlation was determined per region of interest (Figure 2). This shift was then correlated to the clinical score of that patient (HamD) across patients per region. Regressors coding for scanner type, slice-wise mean motion, volume-wise mean motion, average cardiac rate, and variance of cardiac rate were included as nuisance regressors into the analysis, in order to find effects over and above independent variance sources.
Spectral information content [permutation entropy (PeEn)]
PeEn analyzes amplitude orders instead of absolute amplitudes. PeEn quantifies the regularity structure in these orders of the signal values in a time series as measure of signal complexity or “information content” (50). The basic strategy of PeEn calculation is indicated in Figure 1. PeEn therefore is non-parametric and (a) is more robust against signal distortions, and poorly known characteristics of the underlying dynamics (51, 52), and (b) aims at complementary aspects to the analysis of spectral power based on signal amplitudes. The analysis requires the specification of so called embedding parameters. These are the dimension m, i.e., the number of time points in each time window used for assigning the order ranking, and the sampling rate. An embedding dimension m = 3 was used matching the duration of the canonical hemodynamic response function. Maximal accessible sampling rate equals the inverse of the TR. Variance on a slower time scale can be investigated by choosing the sampling rate as inverses of multiples n of TR and disregarding the respective values in between. We investigated n in the range of 1 to 7 roughly corresponding to a frequency range calculated by f = 1/(n * 2 * TR) of 0.026 to 0.179 Hz. We used the implementation in LabView as published for EEG data by Jordan et al. (52).
Results
Scanning Parameters and Physiological Parameters
As can be seen from Table 1 motion parameters as well as physiological parameters did not differ systematically between groups.
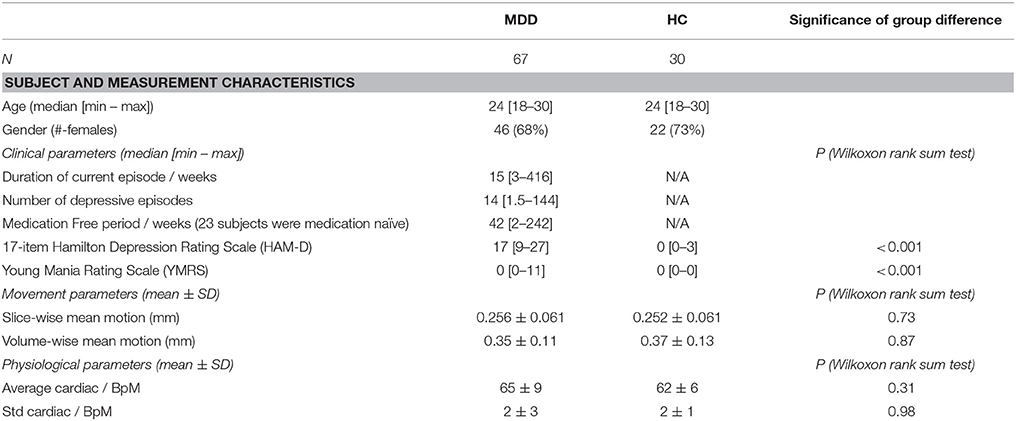
Table 1. Group demographic, illness and scanning characteristics.
Descriptives of Time Courses
An analysis of the standard deviation the time course variance across the whole run of DRN and VTA was correlated across all subjects (Pearson correlation: R = 0.32, p = 0.002, N = 67). This means variance of one ROI was high in those subjects in which also that of the other ROI was high and vice versa. Variance was higher in DRN than in VTA across all subjects (P < 0.001, Wilcoxon rank sum test). Importantly, there were no group differences in magnitude of variance (pDRN = 0.466, pVTA = 0.376, t-tests).
Time courses between the two ROIs were highly correlated within subject as assessed on the Fisher-Z transformed Pearson correlation coefficients (p < 0.001, t-test). These correlations might be due to residual artifacts such as motion, although care was taken to minimize these effects. To exclude those common artifactual contributions, data from each of the ROIs were orthogonalized toward each other in the subsequent analyses in order to focus on region specific dynamics. There was no difference in the within subject interregional correlation between the two groups (p = 0.70, two-sample t-test).
In summary, the description of the time courses of VTA and DRN does not reveal any systematic differences between patient and control group. Orthogonalized time courses of the two ROIs were further investigated with regards to spectral differences and differences in information content.
Spectral Differences and Spectral Slowing
Figure 2A shows the ROI templates used for extraction of time series. Figure 2B shows the spectra of VTA and DRN for both groups. Figure 2C shows that there are moderate between group differences significant at a level of Pu < 0.05 (Wilcoxon rank sum test, uncorrected for multiple comparisons): for DRN at 0.08 Hz (MDD > HC), and for VTA at 0.09 Hz (MDD > HC), at 0.10–0.11 Hz (HC > MDD), and at 0.15–0.18 Hz (MDD > HC).
Figure 3 shows the results of the spectral shift correlation analysis. In VTA the only significance in cross correlation occurs at a shift of 0.014 Hz (Pc = 0.035, Wilcoxon signed rank test, corrected for 17 tests on all shifts under concern) of patient' spectra toward healthy controls‘, i.e., patients spectra resemble those of healthy controls but at slower frequencies (Figure 3A). While the same analysis in healthy controls produces symmetric results, in MDD generally the correlation toward spectra of healthy controls improves when patient spectra are shifted toward higher frequencies, i.e., they are initially shifted toward lower frequencies. In DRN, no shift in cross-correlation showed significant correlation.
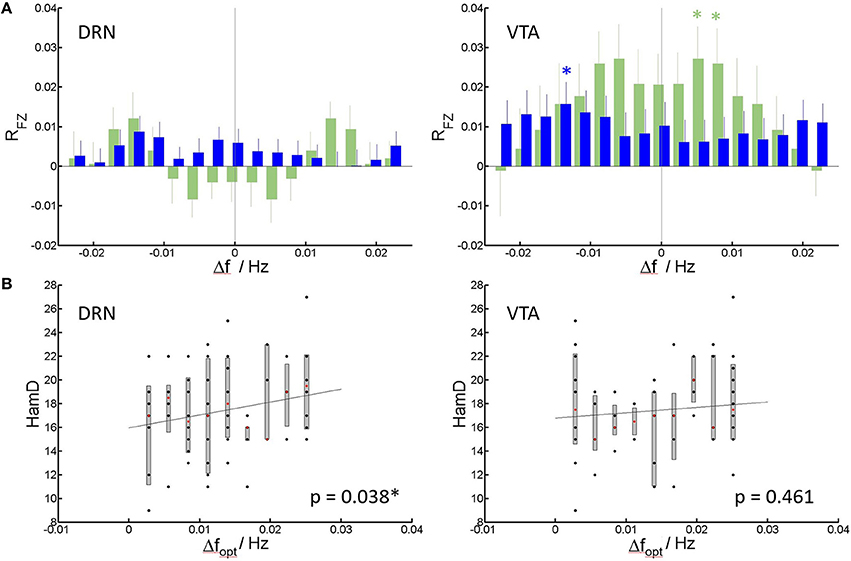
Figure 3. Spectral slowing. (A) Mean and standard error of mean of correlation coefficients RFZ (Fisher Z-transformed) of individual patients (blue) and controls (green) to the group of healthy controls (see Methods) vs. shift in frequency. Significant correlations at Pc < 0.05, corrected for multiple comparisons (Bonferroni-factor = 17) are indicated by an asterisk. (B) HamD score per patient vs. the frequency shift creating the highest (optimal) average correlation of patient spectra to spectra of healthy controls (Dfopt). Median, 75% confidence intervals and outliers are given for all realized shifts. Least square lines to the individual data are added as guide to the eye. Significance of the correlation (corrected for nuisance variables), is indicated within the panels.
For each individual patient, the frequency shift to higher frequencies for optimal match to controls can be determined, and correlation to HamD can be calculated. For DRN, this shift positively correlates with the HamD scores of the individual patients (p = 0.038, Pearson correlation) (Figure 3B). This means higher HamD scores are associated to an increased spectral slowing in DRN. In VTA, there was no significant correlation (p = 0.461, Pearson correlation). Shift data were linearly corrected for nuisance regressors (see Methods section) prior to correlation to rule out possible effects of nuisances. The dependence is displayed in Figure 3C for uncorrected shift data (for clarity).
Spectral Information Content
Figure 4 shows the information content as assessed via permutation entropy in DRN and VTA per group. Information content is within a comparable range across ROIs and groups. In healthy controls information content in DRN is, at trend, higher than in VTA at a frequency of about 0.045 Hz (Pu = 0.051, Wilcoxon signed rank test, uncorrected for multiple comparisons). In MDD, similarly information content is higher in DRN than in VTA, but at lower frequencies of 0.030 Hz (Pu = 0.028) and 0.036 Hz (Pu = 0.035). At two of those frequencies group x ROI interaction is significant (red asterisks) at 0.030 Hz (Pu = 0.017, Wilcoxon rank sum test on inter-regional differences), and at 0.045 Hz (Pu = 0.019).
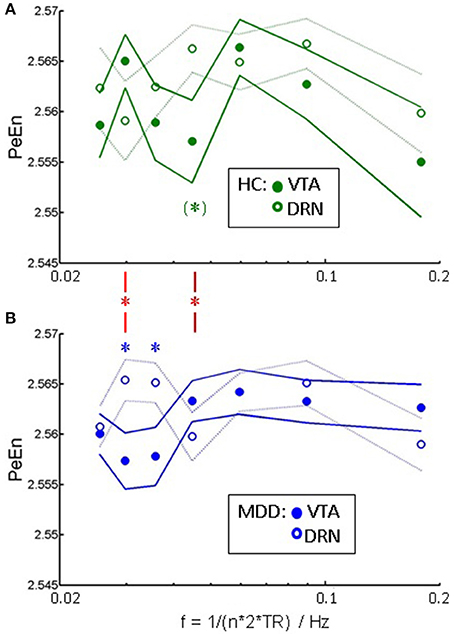
Figure 4. Signal complexity: PeEn vs. a correlate of frequency ~ 1/n in (A) healthy controls, and (B) patients as mean and standard error of mean. Significant within-group differences between the PeEn of the two ROIs at P < 0.05, uncorrected for multiple comparisons (Wilcoxon signed rank test) are indicated by asterisks. Red asterisks indicate significant interactions of group × ROI at the same significance level.
Discussion
In the present study, we analyzed the dynamics of resting state fMRI time courses from VTA and DRN and their pathological alterations in a group of young unmedicated MDD patients. We found a characteristic slowing of VTA and DRN dynamics in the frequency range accessible to fMRI. This slowing was significant but not dependent on clinical scores in VTA. In DRN the slowing was less pronounced but correlated with disease severity as assessed via the HamD score. Analysis of permutation entropy revealed an aberrant frequency distribution of signal complexity in MDD. Based on the underlying notion, that complexity is related to richness (or reduction) in information processing, the results on entropy strengthen a slowing of neuronal processing in VTA (trough in PeEn at lower frequencies) and DRN in MDD. Therefore, two independent measures, i.e., signal amplitude and signal complexity, provide a consistent picture.
As these abnormalities were seen in young adults with depression they are unlikely to be due to neurodgeneration associated with age of long-term effects of chronic depression. Several studies investigated the BOLD reflexion of DRN function (53, 54). Solomon and colleagues investigated tryptophan depletion, as model for the effect of low serotonin in the human brain (53). They reported pontine raphé enhancement in different frequency bands of BOLD signal upon tryptophane depletion. They found a significant increase in power in the ultralow frequency of below 0.033 Hz. A massive increase in the high frequencies of 0.125 to 0.25 Hz is in a range beyond the one accessible in this current study. Also, Weinstein et al. (54) show that raphé functional connectivity in acute tryptophan depletion changes selectively in different frequency bands. These findings highlight the ability of BOLD imaging to bridge the gap between system level functional connectivity investigations and analyses of biochemical effects in MDD.
VTA function is characterized by tonic and phasic activity. By its temporal characteristics, apart from larger scale feedback loops, candidates for BOLD visible activity could be envelopes of phasic burst train activity. These fall into the range 0.1–0.15 Hz (31–33). Although, generally evidence points at an increase in average phasic firing in MDD (25, 26, 55, 56), envelopes of phasic firing might be affected in a different way.
Generally, the hemodynamic response to the very diverse kinds of neuronal activity in brainstem nuclei is not known. It is assumed that metabolic demands elicit a BOLD response following the balloon model (57) and that variations to that time course are minor throughout the brain. Nevertheless, variable hemodynamic responses underlying the BOLD response are possible (58), so direct inference on any underlying neuronal dynamics can not be performed in a straight forward way. Although uncertainty about the exact shape of a hemodynamic response or folding effects due to low sampling rates in fMRI reduce precision of quantitative timing information, a change in BOLD dynamics is indicative of a change in underlying neuronal firing patterns.
Interpretation of BOLD spectral properties in context of inter-regional communication is established usually within a specific spectral range (54, 59). Deviating from these approaches, in the present study, we find a spectral shift rather than a lack in a specific spectral range. By its nature this rather points at reflecting regional alterations in neuronal firing.
The slowing of the spectra may be indicative of regional dysfunction. In the case of DRN this would relate to dysfunction of serotonergic neurons. Here we found that the slowing goes along with increased depression severity which is inline with the serotonergic dysfunction hypothesis of depression (60). Translational studies highlight the importance of establishing a link between transmitter physiology and BOLD representation to connect animal studies and human imaging studies especially focusing on MDD (61). Temporal dysbalance in depression toward slower rather than faster portions of the spectra both from fMRI as well as EEG have been discussed in context with altered experience of subjective time judgments in depression (62). Studies from electrophysiology and fMRI demonstrate that the brain actively exploits matched or nested oscillations for proper functioning (63). A selective slowing in central modules of brain function therefore must impact on interregional communication and information spread. Selective slowing of activity in major BSMN might be a linking piece between animal studies on transmitter systems, functional connectivity analysis in human and behavior.
Our findings of abnormalities in the VTA are consistent with that of other studies in depression where VTA abnormalities were found but not necessarily of the DRN. For example, Wilson and colleagues reported lower density tyrosine hydroxylase in the VTA in the postmortem brains of patients with late life depression but not in the DRN or locus coeruleus. VTA phasic firing has also been reported to be associated with development of depression in a social defeat paradigm in a mouse model. However, our findings also indicate that abnormalities of the DRN are more closely related to the severity of depressive symptoms underscoring the importance of sertonergic abnormalities. Together these findings support the hypothesis that sertonergic function may have a modulatory role on dopaminergic abnormalities and increase or decrease depression severity (2). This study is focused on the study of VTA and DRN as LC is too small size to be imaged with the methods used in this study. In future studies using higher resolution MRI techniques investigation of LC may also be possible and may give a better picture of the contribution of each of the BSMN in the pathophsophysiology of depression.
In conclusion we found systematic changes in the activity dynamics of the BSMN DRN and VTA via fMRI in major depression. In the low frequency regime of BOLD fMRI, spectral slowing occurs in both nuclei, being associated to clinical scores for DRN. Our results constitute an important step in linking altered neuronal activity in these nuclei to system-level integration patterns observed via functional connectivity assessment via fMRI.
Author Contributions
AA and AW were involved in the conception and design of the study. AW, DJ, ML, SJ, and AA developed the methods. AA, HK, ML, and SJ involved in the acquisition of the data; AW, AA, and HK performed the analyses. AW, DJ, SJ, ML, and AA were involved in the preparation of the manuscript.
Conflict of Interest Statement
The authors declare that the research was conducted in the absence of any commercial or financial relationships that could be construed as a potential conflict of interest.
The reviewer NY and handling Editor declared their shared affiliation.
Acknowledgments
This project was funded by the NIMH to AA (R01MH075025).
References
1. Cooper JR, Bloom FE, Roth RH. The Biochemical Basis of Neuropharmacology. New York, NY: Oxford University Press (1991). p. 250–2.
2. Hamon M, Blier P. Monoamine neurocircuitry in depression and strategies for new treatments. Prog Neuro Psychopharmacol Biol Psychiatry (2013) 45:54–63. doi: 10.1016/j.pnpbp.2013.04.009
3. Delgado PL, Price LH, Miller HL, Salomon RM, Licinio J, Krystal JH, et al. Rapid serotonin depletion as a provocative challenge test for patients with major depression: relevance to antidepressant action and the neurobiology of depression. Psychopharmacol Bull. (1991) 27:321–30.
4. Anand A, Charney DS. Catecholamines in depression. In: van Praag HM, Honig A, editors. Depression: Neurobiological, Psychopahthological and Therapeutic Advances. London: John Wiley & Sons Ltd (1997). p. 147–78.
5. Aransay A, Rodríguez-López C, García-Amado M, Clascá F, Prensa L. Long-range projection neurons of the mouse ventral tegmental area: a single-cell axon tracing analysis. Front Neuroanat. (2015) 9:59. doi: 10.3389/fnana.2015.00059
6. Kalivas PW. Neurotransmitter regulation of dopamine neurons in the ventral tegmental area. Brain Res. (1993) 18:75–113. doi: 10.1016/0165-0173(93)90008-N
7. Friedman A, Franke M, Flaumenhaft Y, Merenlender A, Pinhasov A, Feder Y, et al. Programmed acute electrical stimulation of ventral tegmental area alleviates depressive-like behavior. Neuropsychopharmacology (2008) 34:1057–66. doi: 10.1038/npp.2008.177
8. Schlaepfer TE., Bewernick BH, Kayser S, Mädler B, Coenen VA. Rapid effects of deep brain stimulation for treatment-resistant major depression. Biol Psychiatry (2013) 73:1204–12. doi: 10.1016/j.biopsych.2013.01.034
9. Wilson RS, Nag S, Boyle PA, Loren P, Hizel BA, Yu L, et al. Brainstem aminergic nuclei and late-life depressive symptoms. JAMA Psychiatry (2013) 70:1320–28. doi: 10.1001/jamapsychiatry.2013.2224
10. Baumann B, Bielau H, Krell D, Agelink M, Diekmann S, Wurthmann C, et al. Circumscribed numerical deficit of dorsal raphe neurons in mood disorders. Psychol Med. (2002) 32:93–103. doi: 10.1017/S0033291701004822
11. Hendricksen M, Thomas AJ, Ferrier IN, Ince P, O'Brien JT. Neuropathological study of the dorsal raphe nuclei in late-life depression and Alzheimer's disease with and without depression. Am J Psychiatry (2004) 161:1096–102. doi: 10.1176/appi.ajp.161.6.1096
12. Arango V, Underwood MD, Boldrini M, Tamir H, Kassir SA, Hsiung S, et al. Serotonin 1A receptors, serotonin transporter binding and serotonin transporter mRNA expression in the brainstem of depressed suicide victims. Neuropsychopharmacology (2001) 25:892–903. doi: 10.1016/S0893-133X(01)00310-4
13. Boldrini M, Underwood MD, Mann JJ, Arango V. More tryptophan hydroxylase in the brainstem dorsal raphe nucleus in depressed suicides. Brain Res. (2005) 1041:19–28. doi: 10.1016/j.brainres.2005.01.083
14. Malison RT, Price LH, Berman R, van Dyck CH, Pelton GH, Carpenter L, et al. Reduced brain serotonin transporter availability in major depression as measured by [123I]-2β-carbomethoxy-3β -(4-iodophenyl)tropane and single photon emission computed tomography [see comments]. Biol Psychiatry (1998) 44:1090–8. doi: 10.1016/S0006-3223(98)00272-8
15. Kugaya A, Seneca NM, Snyder PJ, Williams SA, Malison RT, Baldwin RM, et al. Changes in human in vivo serotonin and dopamine transporter availabilities during chronic antidepressant administration. Neuropsychopharmacology (2003) 28:413–20. doi: 10.1038/sj.npp.1300036
16. Lanzenberger R, Kranz GS, Haeusler D, Akimova E., Savli M, Hahn A, et al. Prediction of SSRI treatment response in major depression based on serotonin transporter interplay between median raphe nucleus and projection areas. Neuroimage (2012) 63:874–81. doi: 10.1016/j.neuroimage.2012.07.023
17. Gray NA, Milak MS, DeLorenzo C, Ogden RT, Huang YY, Mann JJ, et al. Antidepressant treatment reduces serotonin-1A autoreceptor binding in major depressive disorder. Biol Psychiatry (2013) 74:26–31. doi: 10.1016/j.biopsych.2012.11.012
18. Miller JM, Hesselgrave N, Ogden RT, Zanderigo F, Oquendo MA, Mann JJ, et al. Brain serotonin 1A receptor binding as a predictor of treatment outcome in major depressive disorder. Biol Psychiatry (2013) 74:760–7. doi: 10.1016/j.biopsych.2013.03.021
19. Salomon RM, Miller HL, Krystal JH, Heninger GR, Charney DS. Lack of behavioral effects of monoamine depletion in healthy subjects. Biol Psychiatry (1997) 41:58–64. doi: 10.1016/0006-3223(95)00670-2
20. Beliveau V, Svarer C, Frokjaer VG, Knudsen GM, Greve DN, Fisher PM. Functional connectivity of the dorsal and median raphe nuclei at rest. Neuroimage (2015) 116:187–95. doi: 10.1016/j.neuroimage.2015.04.065
21. Zhang S, Hu S, Chao HH, Li CS. Resting-state functional connectivity of the locus coeruleus in humans: in comparison with the ventral tegmental area/substantia nigra pars compacta and the effects of age. Cereb Cortex (2016) 26:3413–27. doi: 10.1093/cercor/bhv172
22. Tomasi D, Volkow ND. Functional connectivity of substantia nigra and ventral tegmental area: maturation during adolescence and effects of ADHD. Cereb Cortex (2014) 24:935–44. doi: 10.1093/cercor/bhs382
23. Wagner G, de la Cruz F, Köhler S, Bär KJ. Treatment associated changes of functional connectivity of midbrain/brainstem nuclei in major depressive disorder. Sci Rep. (2017) 7:8675. doi: 10.1038/s41598-017-09077-5
24. Wagner G, Krause-Utz A, de la Cruz F, Schumann A, Schmahl C, Bär KJ. Resting-state functional connectivity of neurotransmitter producing sites in female patients with borderline personality disorder. Prog Neuropsychopharmacol Biol Psychiatry (2018) 83:118–26. doi: 10.1016/j.pnpbp.2018.01.009
25. Berton O, McClung CA, Dileone RJ, Krishnan V, Renthal W, Russo SJ, et al. Essential role of BDNF in the mesolimbic dopamine pathway in social defeat stress. Science (2006) 311:864–8. doi: 10.1126/science.1120972
26. Cao JL, Covington HE III, Friedman AK, Wilkinson MB, Walsh JJ, Cooper DC, et al. Mesolimbic dopamine neurons in the brain reward circuit mediate susceptibility to social defeat and antidepressant action. J Neurosci. (2010) 30:16453–8. doi: 10.1523/JNEUROSCI.3177-10.2010
27. Chaudhury D, Walsh JJ, Friedman AK, Juarez B, Ku SM, Koo JW, et al. Rapid regulation of depression-related behaviours by control of midbrain dopamine neurons. Nature (2013) 493:532–6. doi: 10.1038/nature11713
28. Polter AM, Kauer JA. Stress and VTA synapses: implications for addiction and depression. Eur J Neurosci. (2014) 39:1179–88. doi: 10.1111/ejn.12490
29. Yavari P, Vogel GW, Neill DB. Decreased raphe unit activity in a rat model of endogenous depression. Brain Res. (1993) 611:31–6. doi: 10.1016/0006-8993(93)91773-L
30. Dreyer JK, Herrik KF, Berg RW, Hounsgaard JD. Influence of phasic and tonic dopamine release on receptor activation. J Neurosci. (2010) 30:14273–83. doi: 10.1523/JNEUROSCI.1894-10.2010
31. Friedman A, Yadid G, Deri I, Dremencov E, Friedman Y, Goutkin S, et al. Decoding of dopaminergic mesolimbic activity and depressive behavior. J Mol Neurosci. (2007) 32:72–9. doi: 10.1007/s12031-007-0016-5
32. Hyland BI, Reynolds JN, Hay J, Perk CG, Miller R. Firing modes of midbrain dopamine cells in the freely moving rat. Neuroscience (2002) 114:475–92. doi: 10.1016/S0306-4522(02)00267-1
33. Yadid G, Friedman, A. Dynamics of the dopaminergic system as a key component to the understanding of depression. Prog Brain Res. (2008) 172:265–86. doi: 10.1016/S0079-6123(08)00913-8
34. Chen JE, Glover GH. Functional magnetic resonance imaging methods. Neuropsychol Rev. (2015) 25:289–313. doi: 10.1007/s11065-015-9294-9
35. Handwerker DA, Gonzalez-Castillo J, D'Esposito M, Bandettini PA. The continuing challenge of understanding and modeling hemodynamic variation in fMRI. Neuroimage (2012) 62:1017–23. doi: 10.1016/j.neuroimage.2012.02.015
36. Mlinar B, Montalbano A, Piszczek L, Gross C, Corradetti R. Firing properties of genetically identified dorsal raphe serotonergic neurons in brain slices. Front Cell Neurosci. (2016) 10:195. doi: 10.3389/fncel.2016.00195
37. Salomon RM, Cowan RL. Oscillatory serotonin function in depression. Synapse (2013) 67:801–20. doi: 10.1002/syn.21675
38. Beall EB. Adaptive cyclic physiologic noise modeling and correction in functional MRI. J Neurosci Methods (2010) 187:216–28. doi: 10.1016/j.jneumeth.2010.01.013
39. Beall EB, Lowe MJ. A New, Highly Effective Slicewise Motion Correction for BOLD MRI: SLOMOCO. Milan: ISMRM (2014).
40. Glover GH, Li TQ, Ress D. Image-based method for retrospective correction of physiological motion effects in fMRI: RETROICOR. Magnet Reson Med. (2000) 44:162–7. doi: 10.1002/1522-2594(200007)44:1<162::AID-MRM23>3.0.CO;2-E
41. Beall EB, Lowe MJ. Isolating physiologic noise sources with independently determined spatial measures. Neuroimage (2007) 37:1286–300. doi: 10.1016/j.neuroimage.2007.07.004
42. Power JD, Mitra A, Laumann TO, Snyder AZ, Schlaggar BL, Petersen SE. (2012). Methods to detect, characterize, and remove motion artifact in resting state fMRI. Neuroimage 84C:320–41. doi: 10.1016/j.neuroimage.2013.08.048
43. Van Dijk KR, Sabuncu MR, Buckner RL. The influence of head motion on intrinsic functional connectivity MRI. Neuroimage (2012) 59:431–8. doi: 10.1016/j.neuroimage.2011.07.044
44. Jo HJ, Saad ZS, Simmons WK, Milbury LA, Cox RW. Mapping sources of correlation in resting state FMRI, with artifact detection and removal. Neuroimage (2010) 52:571–82. doi: 10.1016/j.neuroimage.2010.04.246
45. Cox RW. AFNI: software for analysis and visualization of functional magnetic resonance neuroimages. Comput Biomed Res. (1996) 29:162–73. doi: 10.1006/cbmr.1996.0014
46. Jiang A, Kennedy DN, Baker JR, Weisskoff RM, Tootell RBH, Woods RP, et al. Motion detection and correction in functional MR imaging. Hum Brain Mapp. (1995) 3:224–35. doi: 10.1002/hbm.460030306
47. Paxinos G, Huang XF. Atlas of the Human Brainstem. San Diego, CA: Elsevier Science Publishing Co Inc. (1995).
48. Naidich TP, Duvernoy HM, delman BN, Sorensen AG, Kollias SS, Haacke EM. Duvernoy's Atals of the Human Brian Stem and Cerebellum: High Field MRI, Surface Anatomy, Internal Structure, Vascularization ad 3D Sectional Anatomy. Vienna: Springer (2008).
49. Zarahn E, Aguirre GK, D'Esposito M. Empirical analyses of BOLD fMRI statistics. I. Spatially unsmoothed data collected under null hypothesis conditions. Neuroimage (1997) 5:179–97.
50. Bandt C, Pompe B. Permutation entropy: a natural complexity measure for time series. Phys Rev Lett. (2002) 88:174102. doi: 10.1103/PhysRevLett.88.174102
51. Cao Y, Tung WW, Gao JB, Protopopescu VA, Hively LM. Detecting dynamical changes in time series using the permutation entropy. Phys Rev E (2004) 70:046217. doi: 10.1103/PhysRevE.70.046217
52. Jordan MSD, Stockmanns PDG, Kochs MD, Eberhard F, Pilge MDS, Schneider MDG. Electroencephalographic order pattern analysis for the separation of consciousness and unconsciousnessan analysis of approximate entropy, permutation entropy, recurrence rate, and phase coupling of order recurrence plots. Anesthesiology (2008) 109:1014–22. doi: 10.1097/ALN.0b013e31818d6c55
53. Salomon RM, Cowan RL, Rogers BP, Dietrich MS, Bauernfeind AL, Kessler RM, et al. Time series fMRI measures detect changes in pontine raphé following acute tryptophan depletion. Psychiatry Res. (2011) 191:112–21. doi: 10.1016/j.pscychresns.2010.10.007
54. Weinstein JJ, Rogers BP, Taylor WD, Boyd BD, Cowan RL, Shelton KM, et al. Effects of acute tryptophan depletion on raphé functional connectivity in depression. Psychiatry Res. (2015) 234:164–71. doi: 10.1016/j.pscychresns.2015.08.015
55. Anstrom KK, Miczek KA, Budygin EA. Increased phasic dopamine signaling in the mesolimbic pathway during social defeat in rats. Neuroscience (2009) 161:3–12. doi: 10.1016/j.neuroscience.2009.03.023
56. Razzoli M, Andreoli M, Michielin F, Quarta D, Sokal DM. Increased phasic activity of VTA dopamine neurons in mice 3 weeks after repeated social defeat. Behav Brain Res. (2011) 218:253–7. doi: 10.1016/j.bbr.2010.11.050
57. Buxton RB, Wong E C, Frank LR. Dynamics of blood flow and oxygenation changes during brain activation: the balloon model. Magnet Reson Med (1998) 39:855–64. doi: 10.1002/mrm.1910390602
58. Lauritzen M, Mathiesen C, Schaefer K, Thomsen KJ. Neuronal inhibition and excitation, and the dichotomic control of brain hemodynamic and oxygen responses. Neuroimage (2012) 62:1040–50. doi: 10.1016/j.neuroimage.2012.01.040
59. Goelman G, Dan R, Ruzicka F, Bezdicek O, Ruzicka E, Roth J, et al. Frequency-phase analysis of resting-state functional MRI. Sci Rep. (2017) 7:43743. doi: 10.1038/srep43743
60. Delgado PL, Price LH, Miller HL, Salomon RM, Aghajanian GK, Heninger GR, et al. Serotonin and the neurobiology of depression. Effects of tryptophan depletion in drug-free depressed patients. Arch Gen Psychiatry (1994) 51:865–74. doi: 10.1001/archpsyc.1994.03950110025005
61. Alcaro A, Panksepp J, Witczak J, Hayes DJ, Northoff G. Is subcortical-cortical midline activity in depression mediated by glutamate and GABA? A cross-species translational approach. Neurosci Biobehav Rev. (2010) 34:592–605. doi: 10.1016/j.neubiorev.2009.11.023
62. Northoff G. Spatiotemporal psychopathology I: no rest for the brain's resting state activity in depression? Spatiotemporal psychopathology of depressive symptoms. J Affect Disord. (2016) 190:854–66. doi: 10.1016/j.jad.2015.05.007
Keywords: dorsal raphe nucleus, ventral tegmental nucleus, resting state fMRI, resting state, serotonin, dopamine, depression
Citation: Wohlschläger A, Karne H, Jordan D, Lowe MJ, Jones SE and Anand A (2018) Spectral Dynamics of Resting State fMRI Within the Ventral Tegmental Area and Dorsal Raphe Nuclei in Medication-Free Major Depressive Disorder in Young Adults. Front. Psychiatry 9:163. doi: 10.3389/fpsyt.2018.00163
Received: 21 November 2017; Accepted: 11 April 2018;
Published: 11 May 2018.
Edited by:
Paul Stokes, King's College London, United KingdomReviewed by:
Georg Northoff, University of Ottawa, CanadaNefize Yalin, King's College London, United Kingdom
Copyright © 2018 Wohlschläger, Karne, Jordan, Lowe, Jones and Anand. This is an open-access article distributed under the terms of the Creative Commons Attribution License (CC BY). The use, distribution or reproduction in other forums is permitted, provided the original author(s) and the copyright owner are credited and that the original publication in this journal is cited, in accordance with accepted academic practice. No use, distribution or reproduction is permitted which does not comply with these terms.
*Correspondence: Amit Anand, ANANDA@ccf.org