 Hope Landrine
 Irma Corral
- 1Center for Health Disparities, Brody School of Medicine, East Carolina University, Greenville, NC, USA
- 2Department of Psychiatry and Behavioral Medicine, Brody School of Medicine, East Carolina University, Greenville, NC, USA
To conduct meaningful, epidemiologic research on racial–ethnic health disparities, racial–ethnic samples must be rendered equivalent on other social status and contextual variables via statistical controls of those extraneous factors. The racial–ethnic groups must also be equally familiar with and have similar responses to the methods and measures used to collect health data, must have equal opportunity to participate in the research, and must be equally representative of their respective populations. In the absence of such measurement equivalence, studies of racial–ethnic health disparities are confounded by a plethora of unmeasured, uncontrolled correlates of race–ethnicity. Those correlates render the samples, methods, and measures incomparable across racial–ethnic groups, and diminish the ability to attribute health differences discovered to race–ethnicity vs. to its correlates. This paper reviews the non-equivalent yet normative samples, methodologies and measures used in epidemiologic studies of racial–ethnic health disparities, and provides concrete suggestions for improving sample, method, and scalar measurement equivalence.
Introduction
The term health disparities refers to patterns of health that mirror patterns of social status. Health disparities exist when those who occupy high social status positions enjoy superior health, while those who occupy low social status positions suffer inferior health (1–4). Social status refers to a socially defined group’s position (rank) in a hierarchical (stratified) society in terms of their power (possession and control of goods and resources), privilege (access to said goods and resources), and prestige [social-moral evaluation, with some people viewed as “better” than others (5–7)]. The social status hierarchies examined in health disparities research in the United States include those based on race–ethnicity, socioeconomic status (SES) position, and other factors (1). Within these hierarchies, those who occupy low status positions [e.g., racial–ethnic minorities (REMs), the low-SES] exhibit significantly poorer health than their higher-status counterparts (1–4). There are well-known racial–ethnic and SES disparities in cardiovascular disease (8), diabetes (9), asthma (10), and cancer (11), as well as in obesity, mortality, self-rated health, birth outcomes, health behaviors, and other aspects of health (12).
Epidemiologic studies compare the health of high and low status groups and supply the basic data (e.g., above) on health disparities. Those data shape population forecasts, motivate new programs and policies, and guide the allocation of resources and the evaluation of health services. In short, epidemiologic studies of health disparities are fundamental to plans to reduce disparities and are the evidence of progress in so doing (13, 14).
The Importance of Measurement Equivalence
To conduct meaningful studies of health disparities, the social status groups compared (e.g., racial–ethnic groups) must be rendered equal on other status and social-contextual variables via statistical controls of such extraneous factors. Likewise, all status groups must have similar responses to the methods and measures, must have equal opportunity to participate in the research, and must be equally representative of their populations. In the absence of such measurement equivalence, group comparisons are confounded by a variety of variables that are correlated with group-membership, and render findings uninterpretable (15–17); group differences in health cannot be attributed to group-membership if the samples, methods, and measures are incomparable across groups because of uncontrolled, correlated factors (15–17).
Thus, the problem of measurement equivalence in health disparities research “is not an esoteric, psychometric issue that has little or no consequences for science, policy, or medicine,” [(15), p. S205)]. Instead, measurement equivalence is fundamental to knowledge of health disparities, and to scientific, policy, and public opinions and decisions based on that knowledge (2). This paper explains and provides detailed examples of the lack of measurement equivalence in health disparities research conducted in the US, and presents concrete strategies for improving equivalence. Because of space limitations, we address Sample, Method, and Scalar equivalence only, and omit the many other types of equivalence (18–20). Likewise, space permits us to address these three forms of equivalence only for REMs (i.e., African-, Latino-, Asian-, and Native Americans). We emphasize, however, that the problems of measurement equivalence in studies of racial–ethnic health disparities apply to studies of health disparities among all other social status groups (e.g., gender, SES groups).
Sample Equivalence
Sample equivalence exists when the status groups examined have been rendered equivalent on social, contextual, and other important correlates of race–ethnicity via statistical control of those correlates (21–24). Studies of racial–ethnic health disparities compare the health of REMs to that of whites, and attribute the differences found to race–ethnicity (i.e., they report racial–ethnic disparities) in the absence of evidence that race–ethnicity, rather than its many correlates, accounts for the differences, i.e., in the absence of evidence of sample equivalence (15–24).
Correlates of Race–Ethnicity
Racial–ethnic groups differ on numerous social, cultural, and contextual variables that are relevant to health, but these usually are not measured (or are not measured adequately) and controlled in epidemiologic studies. Three of the many known correlates of race–ethnicity are SES (21–24), residential segregation [e.g., Ref. (25–29)], and numerous cultural variables (discussed later here). These correlates are universal in that they apply to all racial–ethnic groups, including whites. In the absence of control of these and other known correlates of race–ethnicity, racial–ethnic differences in health cannot be attributed to race–ethnicity rather than to its correlates with reasonable certainty.
Among the many known correlates of race–ethnicity, social-demographic variables are most often measured in epidemiology. The focus on such correlates (e.g., income, education) reflects a narrow understanding of the nature and production of racial–ethnic hierarchies in the US, and diverts attention from the health-relevant but usually unmeasured variables (e.g., segregation, discrimination) that maintain and are the core of racial–ethnic inequality (30–33). Likewise, the focus on cultural–demographic correlates (e.g., nativity, language) reflects a similarly narrow view of the nature and survival of REM cultures in a white-dominated society, and ignores the complexities of acculturation (adaptation) involved (31–33). Moreover, the range of social- and cultural–demographic correlates measured is itself narrow, with many important variables usually excluded.
For example, possessing a landline telephone (discussed later) is one social–demographic correlate of race–ethnicity (and SES) that contributes to health but is not measured in racial–ethnic health disparities research. Wage theft is another social–demographic correlate that also contributes to health (34). Wage theft refers to being paid less than the mandatory minimum wage, non-payment of overtime, refusal of meal and other breaks, confiscation of tips, pay deductions for being sick and for taking meals, and other illegal but common employment practices (34). Low-SES REMs are significantly more likely than other groups to be subjected to wage theft (34), yet neither wage theft nor (its associated) hazardous-working conditions is measured and controlled in normative studies of racial–ethnic health disparities. Similarly, religion is merely one of many cultural–demographic correlates of race–ethnicity that contributes to health: Members of the same racial–ethnic group who participate in different religions differ significantly in their health status and health behaviors (35), yet religion rarely is included in studies of racial–ethnic health disparities.
Moreover, many other correlates of race–ethnicity remain unknown. Indeed, the research of race–ethnicity scholars in anthropology, sociology, and other disciplines [e.g., Ref. (2–7, 30–33)] in part consists of the ongoing discovery of new correlates and processes of race–ethnicity. Because these unknown correlates cannot be included in studies, the correlates that epidemiologists measure and control cannot be assumed to be sufficient to render racial–ethnic samples equivalent.
Lack of adequate measurement and control of the known correlates of race–ethnicity, and the presence of unmeasured, unknown or newly discovered correlates together mean that racial–ethnic samples in studies of health disparities are by definition non-equivalent (incomparable). Strategies for improving racial–ethnic sample equivalence can be used, however, and enhance tentative attributions of racial–ethnic health differences to race–ethnicity. The two examples below illustrate the problems of racial–ethnic sample non-equivalence and provide concrete suggestions for improving it.
Measuring and controlling SES to improve racial–ethnic sample equivalence
All racial–ethnic groups occupy SES positions, and those positions contribute to their health (8–12, 21). Thus, epidemiologists often (but not always) measure and control SES in studies of racial–ethnic health disparities (21, 36–40). The normative practice for the past several decades has been to measure SES as household income, and (less often) as education and occupation as well. Income is by far the most frequently used measure of SES in US research (21, 24, 37–40). This is evident in the Behavioral Risk Factor Surveillance System (BRFSS), the National Health Interview Survey (NHIS), the National Health and Nutrition Examination Survey (NHANES), and other population studies in which income is measured in many different ways (39).
As shown in Table 1, there are large, statistically significant, racial–ethnic differences in income. Such differences hold across levels of education and occupation (2, 6, 33, 34, 41, 42); because of employment discrimination, REMs have significantly lower incomes than whites of the same education (39) and same occupation (41, 42). After controlling for income, racial–ethnic health disparities invariably remain. There is substantial variation in health unexplained by income, and the normative practice has been to attribute that to race–ethnicity (21, 24, 36–40). The problem with doing so is that income is an inadequate measure of the meaning and complexity of SES by race–ethnicity, and is non-equivalent across racial–ethnic groups (21–24, 37–40), in the five ways summarized below.
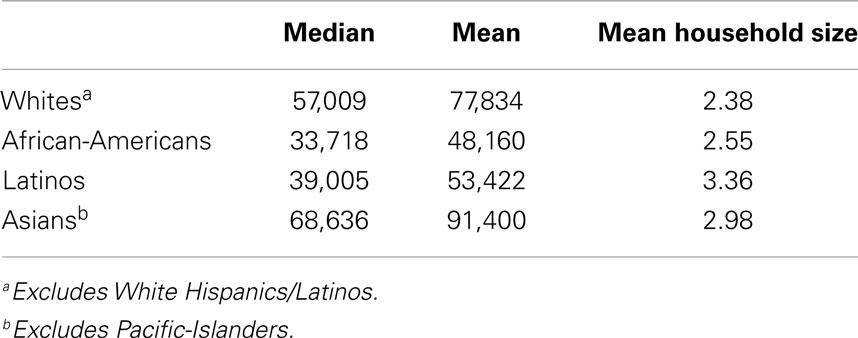
Household size. Income does not take household size into account (43, 44). An income of $30,000 for a one-person household is usually treated as the same as an income of $30,000 for a five-person household even though the larger household has higher expenses and is poorer; the same income is non-equivalent across household size. Studies that measure SES as income rarely control for household size, yet the household sizes of REMs often are significantly larger than those of whites [Table 1; (44)]. Controlling for income without controlling for household size underestimates income differences between REMs and whites, and does not control for income. REMs not only have lower incomes but also often support more people with them.
Housing discrimination. One manifestation of pervasive housing discrimination is that the cost of housing (renting or buying) is significantly higher for REMs than for whites (45–51). REMs are twice as likely as whites to spend 50% or more of their incomes on housing alone (37, 45–51). Consequently, REMs have less money available for food, utilities and other essentials, and for savings accounts than whites of matched income (37, 45–51). The same income does not go as far for REMs as it does for whites, meaning that income is non-equivalent across race–ethnicity (37, 45–51). The significantly higher cost of housing for REMs results in greater financial hardships among them than among whites of the same income (37), and these (and lack thereof) are one aspect of the lived experience of SES in the US. The higher cost of housing for REMs also has been shown to contribute causally to their higher rates of poverty (47).
Credit and retail discrimination. Moreover, as a result widespread racial–ethnic discrimination, REMs also pay significantly more than whites for goods and services such as cars, car insurance, home loans, and other forms of credit, and for groceries, gasoline, and water and sewer services in their neighborhoods [e.g., Ref. (52–57)]. The same income involves lower ability to meet basic needs (and save money) among REMs than whites. This example further underscores the non-equivalence of income across racial–ethnic groups.
Single time-point measures. In addition, income is unreliable because it fluctuates considerably during the year. More than 50% of the US population experiences a significant change (an increase or decrease of ≥30%) in income during a year, with such changes more likely for REMs and low-SES groups (37). This means that the single time-point (cross-sectional) measure of income commonly used reflects that time-point only, and overlooks periodic poverty among REMs (36, 58, 59). Moreover, although income fluctuates during the year, it also tends to be somewhat stable over the lifetime (58–63). REMs are more likely than whites to experience long-term and lifetime exposure to financial disadvantage and poverty at the household and neighborhood levels (58–63). Such long-term exposure has greater negative impacts on health than short-term exposure, and accounts for variance in racial–ethnic health disparities that short-term exposures do not (38, 58–63). Cross-sectional measures of income thereby underestimate the contribution of income to racial–ethnic health disparities (58–63).
Non-response bias and income imputation. Finally, non-response rates to income questions are notoriously high, with REMs (African-Americans in particular) most likely to be non-responders (37, 64). Consequently, response bias characterizes income data from REMs insofar as the small percentage of REM responders are likely to differ in health (and other factors) from the majority of REM non-responders. Because of their high non-response rates, income often is imputed for substantial percentages of REMs; such imputations can yield inaccurate (i.e., higher) estimates of REM income (36, 64) and thereby underestimate the role of income in racial–ethnic health disparities.
Income is not the only normative measure of SES that is non-equivalent across racial–ethnic groups in terms of money available for basic needs and exposure to disadvantage (21–24, 37–40, 58–63). Education and occupation present similar problems: REMs who have the same education (39) and identical occupation (41, 42) as whites receive significantly lower incomes and have poorer life circumstances, such that neither education nor occupation is equivalent across race–ethnicity (21–24, 37–42, 58–63). Thus, controlling for income and education and occupation does not control for SES (21–24, 37–40, 58–63). Attributing racial–ethnic health disparities to race–ethnicity rather than to SES because one has controlled for these normative, non-equivalent SES measures is premature at best.
Alternatives to income
Many alternative measures of SES that improve SES measurement equivalence have been proposed. These facilitate controlling for SES, and enhance racial–ethnic sample equivalence to permit tentative attributions of health differences to race–ethnicity. Three of the many alternatives to income are equivalence-adjusted income, wealth, and area-based SES.
Equivalence-adjusted income. Equivalence-adjusted income is an income measure that takes household size into account (43), and thereby controls for racial–ethnic differences on that variable (Table 1). An equivalence-adjusted income of $30,000 for one person is more than twice that of an equivalence-adjusted income of $30,000 for a four-person household of two adults and two children [(43), p. 9–10]. Data on equivalence-adjusted income and how it is calculated by the U.S. Census Bureau are presented elsewhere (43). Although this measure is superior to income as a measure of SES, it is rarely used in health disparities research. Moreover, equivalence-adjusted income does not resolve the non-equivalence of income in terms of the higher housing and other prices that REMs pay (55).
Wealth. Wealth refers to financial resources such as property (homes), savings accounts, stocks, cars, and other assets (65–67). Racial–ethnic differences in wealth are several magnitudes larger than differences in income (65–67); whites have significantly greater wealth (net worth) than REMs of matched income (65). The median, overall wealth of whites ($111,740) is 15 times higher than that of African-Americans ($7,113) and 13 times higher than that of Latinos [$8,113; (65), p. 3].
Home ownership is the key component of wealth and plays an important role in financial security, i.e., in the lived experience of SES (65–67). As shown in Table 2, 98% of whites own their place of residence, compared to less than 60% of Asians and less than 45% of African-Americans and Latinos. Home ownership alone reveals that whites have significantly higher SES than all REMs, independent of income. In addition, significantly greater percentages of REMs than of whites lost home-value (Table 2) during the housing-market crash of 2005–2010 (65). This is because larger percentages of Latino and Asian populations (40% each) than of whites (20%) reside in the five states hit hardest by the housing recession: Arizona, California, Florida, Michigan, and Nevada (65). Yet, most of the wealth of REMs, unlike that of whites, stems from home ownership (Table 2). This means that REMs are experiencing ongoing decreases in wealth that exceed those of whites. Indeed, a larger percentage of REMs than of whites are underwater in their mortgages (owe more than their home is worth) in part because of where REMs’ homes are located (65), and in part because REMs pay significantly higher mortgage interest rates (45–51, 55). African-Americans are 86% more likely and Latinos 36% more likely than whites to be underwater in their mortgages (65). Thus, for REMs, owning a home often leads to poverty instead of to financial security (45–51, 55, 65–67).
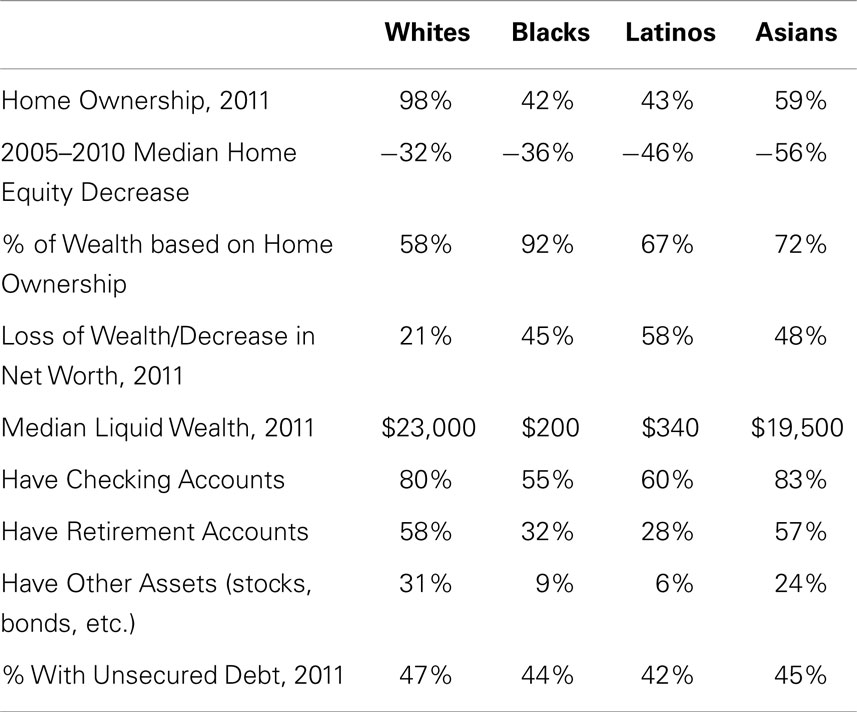
Table 2. Racial–ethnic differences in wealth (65).
Home ownership is just one aspect of wealth. Other assets such as checking, savings, and retirement accounts also contribute. REMs are significantly less likely than whites to possess such assets and have significantly lower liquid wealth. Liquid wealth refers to assets that quickly can be converted into cash (liquidated). As shown in Table 2, the median liquid wealth of whites is 100 times that of African-Americans and 65 times that of Latinos. Liquid wealth “is largely non-existent within Black and Latino households,” [(65), p. 3]. If faced with a crisis in which cash assets must be used (e.g., checking and savings accounts) and other assets (e.g., retirement accounts, cars) sold for cash, Latinos and African-Americans have little. When subtracting retirement account dollars from the numbers shown in Table 2, African-Americans have $25, Latinos $100, and Whites $3,000 in liquid wealth (65). Two-thirds (67%) of African-Americans and 71% of Latinos (vs. 34% of Whites) are liquid asset poor, i.e., liquidating their assets is not sufficient to survive a crisis such as a death in the family or an accident or illness requiring expensive treatment, hospitalization, or long-term care (65–67).
Why do REMs have lower wealth and liquid wealth than whites? Do these differences reflect irresponsible financial behavior on the part of REMs, such as accumulating large unsecured debts (school loans, credit card, and medical bills) that render savings and other investment accounts difficult to build? As shown in Table 2, there are no racial–ethnic differences in unsecured debt (65). Instead, racial–ethnic differences in wealth reflect REMs’ lower incomes, combined with REMs paying more for housing, goods, and services with those lower incomes, and with the absence of banks in REM neighborhoods in which to establish checking and savings accounts (68). Like major department stores and chain-supermarkets (69, 70), banks began their flight from REM neighborhoods in the 1950s, and were replaced by predatory payday lenders and check-cashing houses (68).
Thus, unlike income, wealth captures the experience of SES in the US, i.e., being financially secure vs. insecure and vulnerable to minor (increased utility bills) or major (illness, death) crises (37, 65). Racial–ethnic differences in wealth hold across income (65), and wealth is a reliable measure that does not fluctuate monthly (65). Wealth is also a stronger predictor than income of health for all racial–ethnic groups (whites included), and wealth contributes to health independent of income (24, 37, 38, 67). In addition, REMs might exhibit lower non-response rates to questions about wealth (savings accounts, home ownership) than to questions about income. Moreover, wealth is an SES measure that is equivalent across racial–ethnic groups because it reflects rather than ignores the role of racial–ethnic discrimination in SES. Consequently, wealth is regarded as superior to income as a measure of SES in health disparities research (24, 37–39, 65, 67). Many have argued that the failure to measure wealth underestimates racial–ethnic differences in SES, and thereby underestimates the contribution of SES to racial–ethnic health disparities (24, 37, 38, 67).
Area measures of SES. The SES of a geographic area is another alternative to income. Area-SES can be assessed at any area level, i.e., census tracts (CT), zip-codes, counties, and states. Area-SES measures at the CT level are more robust than those at larger (zip-code, county) levels for examining racial–ethnic and other health disparities (71–75). The relationship between area-SES and health tends to be strongest when small areas (CTS) are used because larger areas contain small areas within them that vary considerably in area-SES and thereby reduce area-SES effects (71–75).
Irrespective of area level used, area-SES can be measured in a variety of ways. These include area median household income, area median home values, and composite measures such as the Townsend Index (71–75). When comparing 18 area-SES measures on their ability to predict health disparities, Krieger and her colleagues found that the percentage of CT residents below the federal poverty line (% BPL) is superior to other measures (71–74). For example, after controlling for household income, CT% BPL remains a strong predictor of racial–ethnic disparities in tuberculosis (73), smoking (76, 77), reproductive health and birth outcomes (78, 79), breast and cervical cancer screening (80), hypertension (81), cancer incidence, mortality and survival (82), and other health outcomes (73, 83). Poor health and health behaviors are significantly more prevalent in poor areas, i.e., where CT%BPL ≥ 20% (a federal poverty area) than in higher SES areas (CT%BPL ≤ 5% or 10%).
In general, SES measured at the CT level is a stronger predictor of racial–ethnic and other health disparities than SES measured at the household level (71–75). This is because area-SES captures the differences between low- and higher-SES areas in the hazards and resources that are known social-determinants of health (71–75). For example, compared to higher-SES areas, low-SES areas have significantly more prevalent hazards (84–100) including higher exposures to environmental toxins (84–89); poorer housing quality and higher indoor exposures to lead paint, carbon monoxide and other hazards (90–95); higher access to fast-food (96, 97); and greater prevalence of negative physical conditions such as garbage-filled vacant lots, wild dogs, abandoned buildings, and the absence of trees and sidewalks (98–100). In terms of resources, low-SES areas have significantly fewer grocery stores selling fresh fruit and vegetables (101–104) and fewer recreational facilities (101, 105–108), and lower availability and quality of healthcare (109–112).
These area-SES differences contribute to the higher prevalence of hypertension, diabetes, obesity, and other health problems (noted above) in low-SES areas (71–83, 90, 91, 95). Consequently, when people move out of low-SES areas into higher-SES areas, their health significantly improves even though their incomes remain unchanged. Evidence for this stems from the Moving to Opportunity (MTO) Experiment (113–116) and the many studies based on it (117–122).
Moving to opportunity (MTO). The U.S. Department of Housing and Urban Development (HUD) conducted the MTO study between 1994 and 1998 in five cities: Baltimore, Boston, Chicago, Los Angeles, and New York. The study involved 4,604 low-income urban households (4,499 women and their 6,300 children) who resided in public-housing in extremely high poverty (CT%BPL ≥ 40%), high-segregated areas. The majority (93–96%) of the households were African-American (51–54%) and Latino (39–45%); all household incomes were below the federal poverty line; most (51–75%) households were receiving public assistance (AFDC, TANF); and few (22–30%) were employed. In the MTO study, a random half of these households (MTO group) received housing vouchers that could be used only to reside in higher-SES neighborhoods (≤10% CT% BPL), and half (non-MTO) remained in their poverty settings [see Ref. (113, 114) for details of the study design]. Measures of physical and mental health were taken at enrollment and at all follow-up years, and included height, weight (and calculation of BMI), glycated hemoglobin (HBA1c) tests for diabetes, and assessment of substance abuse and psychiatric disorders (via interviews using DSM diagnostic procedures and categories). The MTO and non-MTO groups were equal on all measures at baseline.
HUD’s 2001 (113, 114), 2003 (115), and 2012 follow-up analyses (116), as well as analyses conducted by others at 2-, 3-, 5-, 7-, and 10–15-year follow-up (115–122) all revealed the same results: Those who moved out of high-poverty areas (MTO group) exhibited significantly better physical and mental health than their counterparts who did not move, and exhibited positive changes over baseline (114–122). For example, significant decreases in the prevalence of morbid- and severe-obesity and in HbA1c were found among the MTO group (120, 122). The MTO study demonstrates that area income (rather than household income) predicts health among REMs. This is evident because the incomes of the REMs who moved did not change. Indeed, in the course of the study, the incomes, education levels, and employment of the REMs who relocated remained unchanged and similar to those of the non-MTO group (123, 124). Moving to a higher-SES area had positive effects on REM health, but had no effect on power, privilege or prestige because area-residence does not alter rigid status hierarchies based on race–ethnicity or SES, nor end racial–ethnic and SES discrimination (123, 124).
The area-SES of REMs. Area-SES and the MTO experiment are relevant because significantly greater percentages of REMs than of whites reside in low-SES areas (125). One in every four African-Americans, 1 in every 6 Latinos, and 1 in every 8 American Indians (vs. 1 in 25 whites) resides in a high-poverty area (CT%BPL ≥ 30%). Indeed, as a result of housing discrimination, many higher income REMs also reside in low-SES areas while their white counterparts with similar incomes do not (41, 45, 47, 51, 55, 125). Moreover, REMs are more likely than whites to reside in low-SES areas for all or most of their lifetimes, and thus are more likely to be subject to low-SES area health hazards and lack of health resources throughout the life course (58–63).
Because residence in poor areas predicts health better than income in general (71–75) and among African-Americans and Latinos in particular (MTO study), it is essential to measure area-SES in racial–ethnic health disparities research (71–75). Studies that fail to do so profoundly underestimate racial–ethnic differences in SES, and thereby underestimate the contribution of SES to racial–ethnic health disparities (71–75). Area-SES measures are also more valid and reliable than income because they are not subject to non-response bias, household size, or monthly fluctuations and the problem of cross-sectional SES measures. Moreover, area measures are equivalent across racial–ethnic groups because they reflect rather than ignore the racial–ethnic discrimination that relegates REMs to low-SES areas based on race–ethnicity and often irrespective of their incomes. Area-SES data (i.e., CT% BPL for every CT in the US) are publically and readily available to be included in studies of racial–ethnic health disparities (at www.hsph.harvard.edu/thegeocodingproject) (71–75).
Suggestions for measuring SES
Racial–ethnic groups differ on a variety of demographic variables that must be (but often are not) controlled in studies of health disparities (e.g., age, gender, and marital status, see our calculations in Table 3). Of all demographic correlates of race–ethnicity, SES is the most important to control. To do so, adequate measures of SES that are equivalent across racial–ethnic groups must be used. As shown here, wealth and area-SES are two such measures. Hence, we recommend using wealth and area-SES, along with household income, education, and household size to control for SES in studies of racial–ethnic health disparities, and improve the equivalence (comparability) of racial–ethnic samples. To our knowledge, no epidemiologic study has used all five measures. We also encourage those who found racial–ethnic health disparities to re-analyze their data using these five SES measures and examine the variability in health remaining after so doing. Use of all five measures does not guarantee that all variance in health due to SES will be accounted for, however, because other SES variables that correlate with race–ethnicity (e.g., wage theft, hazardous-working conditions, health insurance, and landline telephones) have not been controlled. It is beneficial to state this as a limitation of the recommended five measures, and to use tentative language in conclusions about racial–ethnic vs. SES health disparities.
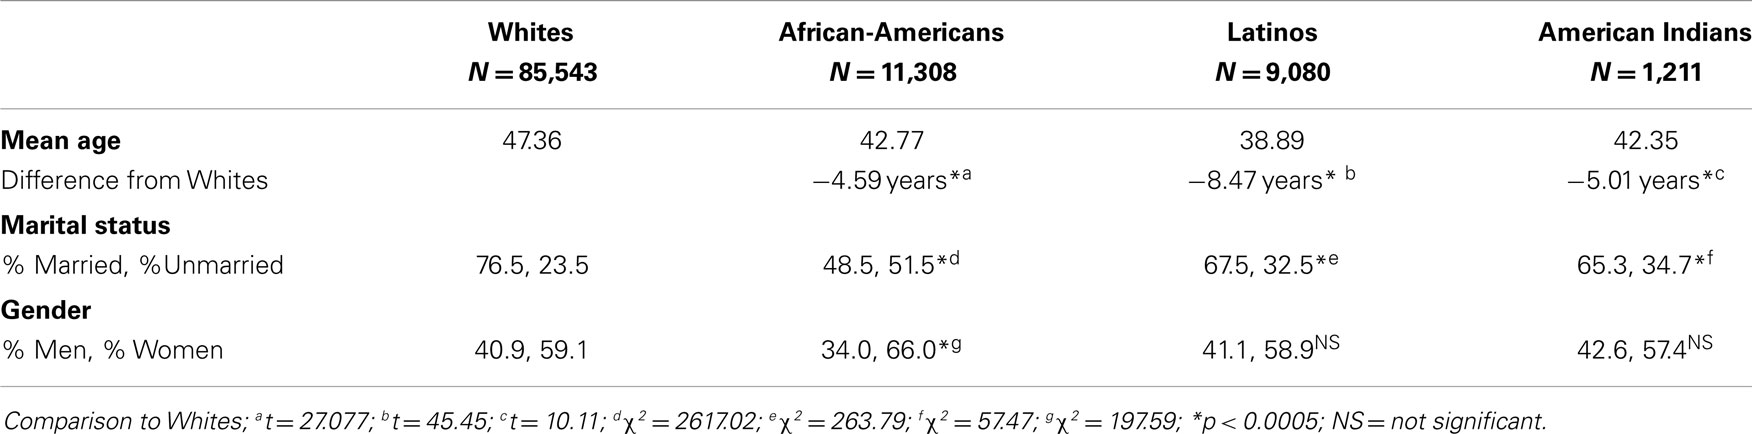
Table 3. Racial–ethnic differences in demographics among adults in the 2000 BRFSS.
Measuring and controlling segregation to improve sample equivalence
All racial–ethnic groups reside in areas that differ in area-SES and in racial–ethnic segregation as well. Segregation contributes significantly to the health of whites and of all REMs (126–129), but most research has focused on blacks. Thus, many examples here focus on black–white segregation.
Residential segregation refers to the geographic separation of whites from REMs in residential areas (130–132). Like area-SES, segregation can be measured at any area level such as CTS, states, and metropolitan statistical areas (MSAs). Measuring segregation in smaller (CTS) areas is preferred because large areas (e.g., counties) contain both highly segregated and integrated smaller areas within them. Measuring segregation at the CT level, or at the MSA level (with MSA-segregation calculated from CT data) is widely regarded as superior and is generally preferred (130–132). Irrespective of area level used, however, segregation can be measured in many ways (Table 4), including dissimilarity, isolation, concentration, clustering, centralization, and hypersegregation (133–139). Of these, dissimilarity is most often used, but Isolation has better validity and interpretability (134, 138, 139). Crude measures of questionable validity (e.g., area-percentage of blacks) often are used as well. The segregation–health relationship varies with the segregation measure used (133–139).
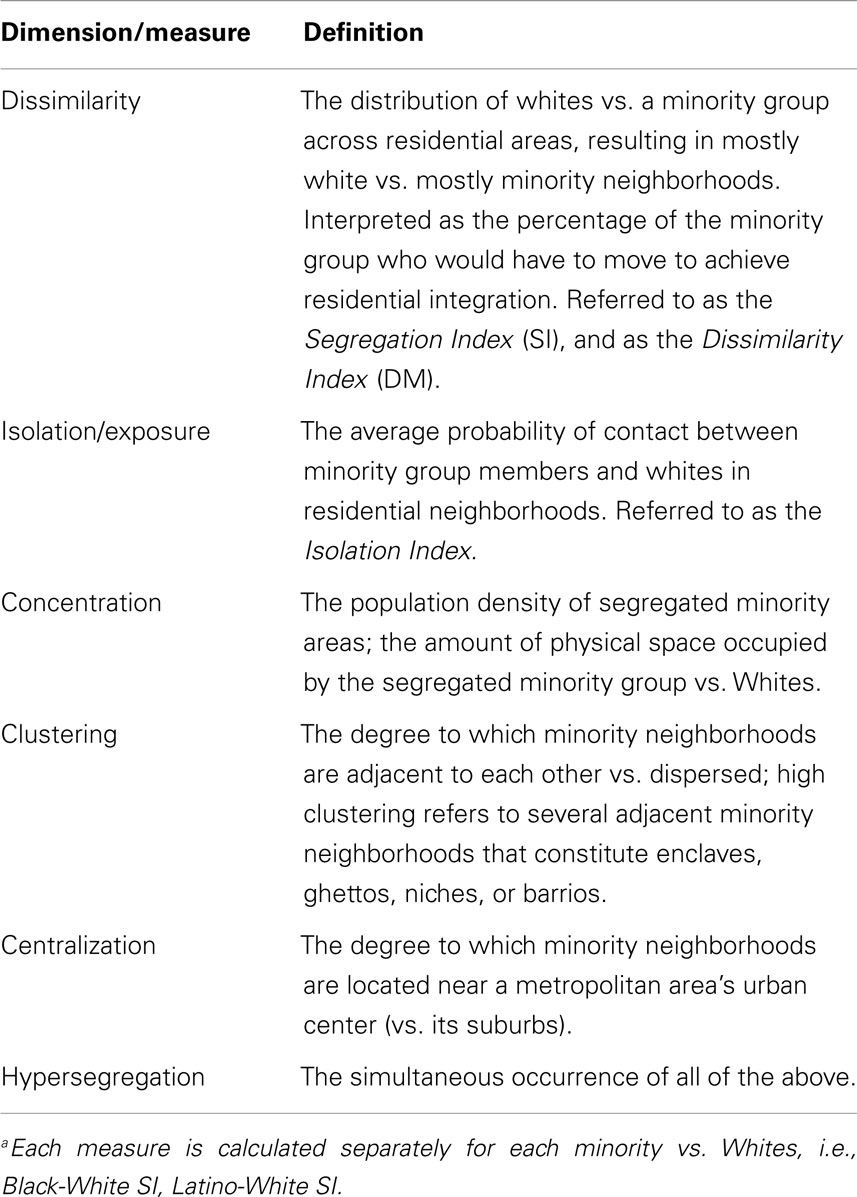
Table 4. Dimensions and measures of residential segregationa (133).
Dissimilarity (SI) data are calculated by the U.S. Census Bureau and are available in census datasets. SI ranges from 0 (a fully integrated city in which blacks and whites reside in all areas) to 100 (a totally segregated city in which all blacks and whites reside in separate neighborhoods). Hence, SI is interpreted as the percentage of blacks who would have to move to achieve city-wide integration. SI data indicate that the US continues to be characterized by high black–white segregation: Nationwide, 60-70% (most) of blacks and 70–90% of whites reside in mostly black and mostly white areas (respectively), meaning that 60–70% of blacks would have to move to integrate most US cities.
For example, as shown in Table 5 (2010 column for Black–White SI), 81.5% of the blacks in Milwaukee would have to move to integrate that city, as would 75.3% of blacks in Detroit, and 76.4% of blacks in Chicago. A high (>60) or very high (>70) SI means that irrespective of their representation in a city’s population, most blacks and whites reside in more or less racially homogenous areas where they are isolated from and rarely exposed to each other. For example, as shown by the Isolation – Exposure data in Table 6 blacks comprise about 23% of Detroit’s population, but live in neighborhoods that are 80% black. Likewise, blacks constitute about 18% of Chicago’s population, but live in neighborhoods that are 75% black. If Chicago were an integrated city, every neighborhood would consist of 58% whites, 18.6% blacks, and 17.1% Latinos in manner matching their representation in that city’s population (Table 6); in the absence of racial segregation, Chicago blacks would reside in neighborhoods that are 18.6% rather than 75% black.
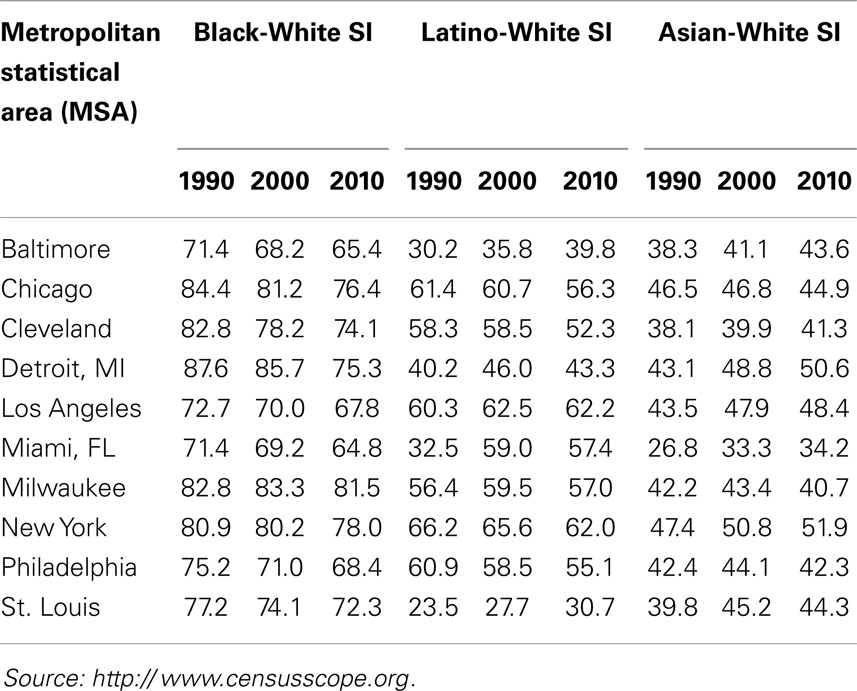
Table 5. Segregation Index (SI) data for 10 metropolitan statistical areas (MSAs): 1990, 2000, and 2010 US Census.
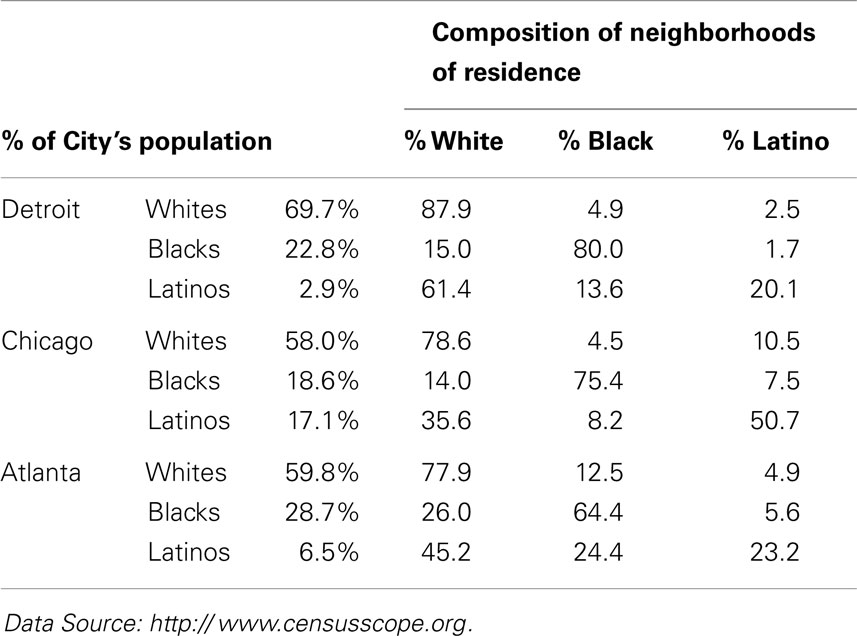
Table 6. Exposure/isolation in three major US cities, 2000.
These segregation levels have been somewhat stable for all REMs for decades (Table 5), with the exception of increases in the segregation of Latinos (1990–2000) and Asians (1990–2010) in large cities (25, 127, 131, 140), and declines in the segregation of blacks (125, 127). The decreases in black segregation, however, have been small each decade, and black segregation nonetheless remains high or very high, i.e., SI > 60 or 70 [Table 5; (125, 127, 130, 131)]. Likewise, although all REMs are segregated to some extent, the segregation levels of blacks continue to be significantly higher than those of all other REMs (Table 5). Likewise, blacks are more racially isolated than other REMs. For example, as shown in Table 6, blacks and Latinos both constitute about 18% of Chicago’s population, but blacks live in neighborhoods that are 75% black and 14% white, whereas Latinos live in (more integrated) areas that are 50% Latino and 36% white. Moreover, although all REMs are segregated along one or more dimensions of segregation (Table 4), blacks are more likely than others to be hypersegregated, i.e., along all 5 dimensions (137): Blacks are more likely than other REMs to live in densely populated (Concentration), mostly black (Dissimilarity) neighborhoods that are adjacent to similar neighborhoods (Clustering), in the center of cities (Centralization), and isolated from whites (Exposure/Isolation). About 60–70% of the black population resides in segregated black areas, and 40–50% reside in hypersegregated black areas (137, 141).
This “American Apartheid” (132) generally does not reflect a black preference to live in black neighborhoods (142, 143), but instead is primarily the result of the discriminatory housing practices noted previously here (45–51). In large surveys, most blacks indicate a preference to live (and raise their children) in integrated neighborhoods, but Whites do not want them (142–145) and threaten to move out (of affluent areas in particular) if blacks move in (142–145). Real estate agents actualize these white preferences by steering black home-buyers and renters away from mostly white areas via the false message that the property is no longer available and the failure to show the property to blacks (45–51). The discriminatory housing practices that relegate most blacks to mostly black neighborhoods hold across black household income, and most strongly affect high income blacks who attempt to purchase homes in affluent, white suburbs (146–148). High income blacks often are as segregated as their low income cohorts but reside in affluent rather than in poor black neighborhoods (146–148). Thus, residential racial segregation does not mirror residential income segregation and is not an artifact of black–white differences in income (142–149). Indeed, if the US population was distributed into residential areas based solely on income, the US would be very integrated (144, 149). For example, based on income (not race), the SI for St. Louis, MO would be 11 rather than 78 (149).
Segregation and black health. Numerous studies have found that the health of blacks who reside in high-segregated black neighborhoods is significantly worse than that of their less-segregated counterparts. Compared to blacks who reside in low-segregated areas, high-segregated blacks have significantly higher: adult mortality (150, 151) and infectious diseases rates (152); prevalence of adverse birth outcomes such as low birth-weight and preterm birth (27, 141, 153–155); prevalence of obesity (138, 156–159); cardiovascular disease mortality (160, 161); prevalence of asthma (162, 163) and hypertension (164, 165); breast and lung cancer mortality (166, 167); cancer risks due to exposure to air toxics (168, 169); prevalence of poor self-rated health (170) and of drug use (171); lower rates of physical activity (172) and of fruit/vegetable consumption (157), and other health problems (126–129, 134, 173). Most of the health problems on which black–white disparities have been found are significantly more prevalent among high- than among low-segregated blacks.
The poorer health of high-segregated African-Americans is generally understood as a function of the significantly higher exposures to health hazards and the significantly lower availability of health-enhancing resources in high-segregated black neighborhoods (28, 29, 126–128). High-segregated black areas, compared to low-segregated ones, are characterized by higher exposure to air toxics and persistent organic pollutants (173, 174); few grocery stores selling fresh fruit/vegetables and a higher prevalence of food deserts (175–178); lower availability of recreational facilities (106, 107); poorer quality housing (92–95, 179) and neighborhood physical conditions (98–100, 180); higher prevalence and density of fast-food places (96, 97, 181, 182); and low access to specialized and to high-quality physicians and healthcare facilities (128, 183–186).
Effects of black segregation on whites’ health. Residing in a segregated black neighborhood is associated with poor health and health behavior among all residents irrespective of their race–ethnicity [e.g., Ref. (129, 172, 187)]. For example, residing in a segregated black neighborhood is associated with increased physical inactivity (172), and with lower cancer screening (11, 129) among blacks and whites alike. Similarly, in a recent study, we found that black cancer survivors had significantly poorer health-related quality of life than white survivors (187) even after controlling for income and area-SES (%BPL). When segregation (black Isolation Index) was added to the regressions, however, racial differences disappeared; health-related quality of life was poor among all cancer survivors who resided in mostly black areas. Such findings highlight that the black-segregation effect is not a function of the people but of the place, i.e., of high health hazards and low health resources that affect all residents.
Segregation and health among other REMs. There are relatively few studies of segregation and health among other REMs. The growing literature on Latinos, however, reveals that many findings for segregated blacks hold for segregated Latinos as well. For example, Latinos who reside in high-segregated Latino neighborhoods (compared to those who reside in low-segregated areas) have significantly higher prevalence of preterm birth (155) and of obesity (158, 188), and lower levels of physical activity (189). Moreover, the cancer risk associated with exposure to air toxics is higher in black, Latino, Native American, and Asian neighborhoods than in white neighborhoods (29). Indeed, such exposure and risk are highest in extremely segregated Latino neighborhoods and lowest in extremely segregated white neighborhood as shown in Figure 1 [(29), p. 391].
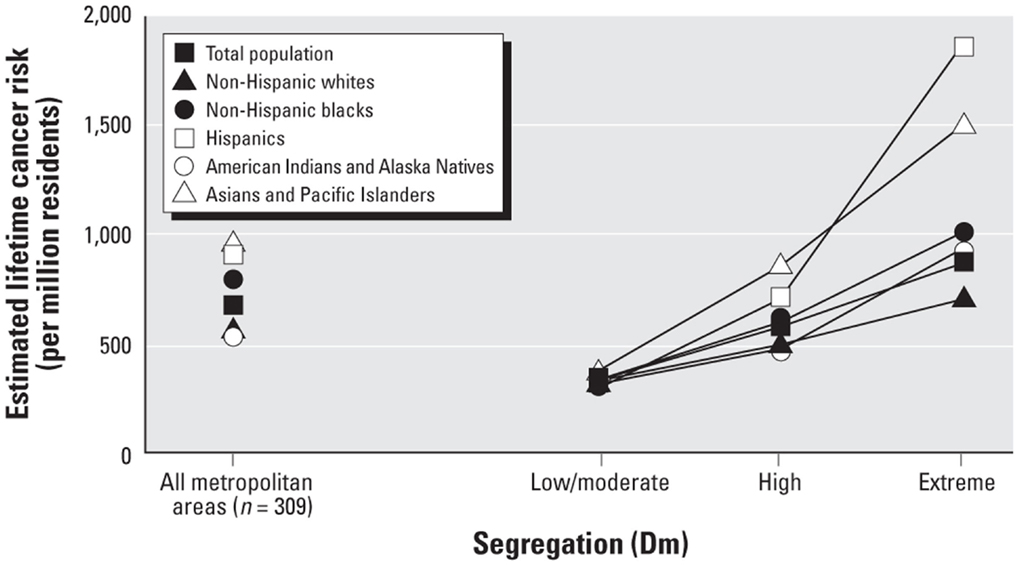
Figure 1. Estimated lifetime cancer risk associated with exposure to ambient air toxics in low, high, and extremely-high segregated neighborhoods.
Although many of the negative health outcomes associated with high segregation for blacks hold for high-segregated Latinos (29, 155, 158, 188), some studies have found that residing in a segregated Latino area has no or has positive effects on Latino health (190, 191). This is in part due to blacks’ higher segregation than that of Latinos ((140, 192, 193); Tables 5 and 6), and the significant differences between segregated Latino areas in nativity (percent foreign-born), Latino ethnic group (e.g., Mexican vs. Puerto Rican), and language spoken (190, 191). Nonetheless, however, studies of segregation and health among other REMs have revealed that the resource-poor and hazard-rich conditions found in high-segregated black areas characterize high-segregated Latino and Asian neighborhoods as well (180, 185, 186, 193), and contribute to the health disparities of Latinos and Asians (173, 194).
Suggestions for including segregation
Data strongly suggest that it is useful to measure and control for the segregation of REMs and of whites in research on racial–ethnic health disparities (29, 30, 140, 155, 158, 188–194). Doing so controls for the health-relevant area hazards and built environments experienced by REMs vs. whites (29, 140, 167–174, 180–193, 195, 196), and thereby improves racial–ethnic sample equivalence. Dissimilarity or isolation at the CT or MSA level is the common strategy for including segregation in health disparities research [e.g., Ref. (29, 187)]. However, controlling for segregation does not guarantee that all racial–ethnic differences in place (e.g., urban vs. suburban residence) are controlled. Thus, it is beneficial to state this as a limitation of controlling for segregation, and to use tentative language in conclusions about racial–ethnic vs. place-related health disparities.
Method Equivalence
Method equivalence is the extent to which the methodology used to acquire health data is equal for the status groups in the research; method equivalence exists when all status groups are equally familiar with the methods and have equal opportunity to participate in the study (197–201). Here, we focus on only two of the types of method equivalence.
Familiarity-Related Method Equivalence
Familiarity-related method equivalence exists when all status groups are equally familiar with research methods such as reading, writing, taking tests, being timed, being interviewed (i.e., one-sided conversations), answering multiple-choice and Likert-type items, etc. (198–201). Racial–ethnic (and SES) groups always differ in their familiarity with at least one of these methods because they differ in their frequency of engaging in these activities outside of the study (198–201). Thus, some degree of familiarity-related method bias is present in all research with diverse samples, and is evident in participants’ questions about the tasks as well as in the tendency of REMS to ask interviewers how they would answer the interview questions (198–201).
Improving equivalence
An effective way to test and control for lack of familiarity-related method equivalence is test–retest, i.e., the repeated administration of the task. On retest, all groups are likely to exhibit slight increases in performance or more consistent responses as a function of practice effects. However, when lack of method equivalence across racial–ethnic groups exists, the changes in responses for REMs significantly exceed those for Whites, and indicate that prior REM responses were in part an artifact of lack of familiarity with the methods (198–201). Statistically significant racial–ethnic differences in test–retest reliability coefficients are used to assess familiarity-related method equivalence (198–201), and hence we recommended its use with all (or a subset of) participants.
Inclusion-Related Method Equivalence: Language
Inclusion-related method equivalence exists when all groups have equal opportunity to participate in the study. Methodologies that differentially exclude REMs and low-SES groups from participation lack this type of method equivalence. Two such normative methods are English-only studies, and random digit-dial telephone surveys (RDDTS).
English-only studies
More than 80% of the studies in medical and public health journals were conducted in English-only, with non-English speakers excluded (202–204). The vast majority of epidemiologic studies of health disparities, ranging from small studies to state- and nationwide population-health surveys (e.g., Current Population Survey, BRFSS) are conducted in English, or at best in English and Spanish (202–204). The exclusion of non-English speakers decreases racial–ethnic sample equivalence and the validity of data from REMs, and also yields non-representative REM samples from whom generalization to their populations is severely limited (202–204).
Specifically, English-fluent samples exclude the approximately 40% of Asians and of Latinos who do not speak English well (202–204). Because English proficiency is a proxy for nativity, years of residence in the US, education, and income (205, 206), the 40% of Asians and Latinos excluded tend to be the recent-immigrant, low-SES, and low-educated members of these groups (203). English-fluent samples thereby provide estimates of Asian and Latino SES that are significantly higher than those of their populations, and hence underestimate the contribution of SES to health disparities among Latinos and Asians (202–204). Moreover, lack of fluency in English is a known barrier to health care (203). Non-English speaking Latinos and Asians are significantly less likely than their English-fluent cohorts to have had immunizations, cancer-screening tests, preventive services, or even adequate physical and mental health treatments, irrespective of their SES and health insurance (109, 186, 206–208). Studies of English-fluent Asians and Latinos thus provide not only grossly inaccurate demographic data but also erroneous estimates of the health of these groups as well. Data from the 2003 California Health Interview Survey (CHIS) illustrate these points.
The CHIS was a statewide, RDDTS of the physical and mental health and health behaviors of California adults (www.CHIS.ucla.edu). Unlike other population-health surveys, the CHIS was conducted in English, Spanish, Chinese (Mandarin and Cantonese), Korean, and Vietnamese. Table 7 compares Asians and Latinos who participated in the CHIS in English (English-fluent) vs. another language (non-fluent). As shown, Asians and Latinos interviewed in English had incomes (mean $70,500) nearly three times higher than those of their cohorts interviewed in other languages (mean $24,700), a difference of $45,800 annually. Likewise, English-fluent Asians and Latinos were significantly more educated than those non-fluent, and had spent a significantly greater percentage of their lives in the US. English-fluent Asians also were significantly younger (by as much as 15 years) than their non-fluent cohorts, and the English-fluent Asian samples contained significantly lower percentages of women (i.e., the differential exclusion of REM women).
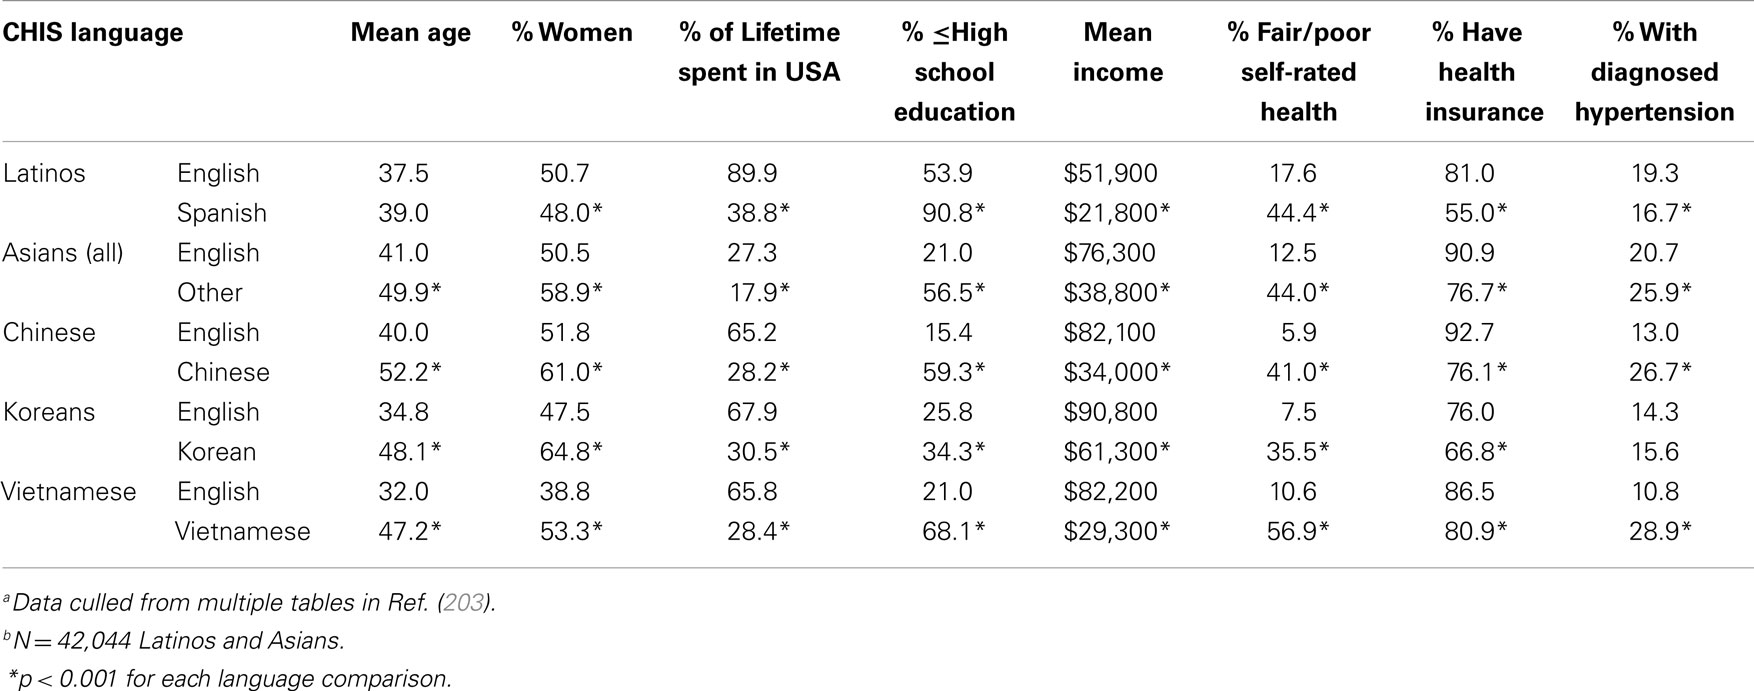
Table 7. Differences between English-fluent and non-fluent Latinos and Asians in the 2003 California Health Interview Survey (CHIS)a,b.
Where health is concerned, a significantly greater percentage of English-fluent Asians and Latinos had health insurance, and significantly fewer rated their health as fair/poor. For example, a mere 5.9% of English speaking vs. 41% of Chinese-speaking Chinese rated their health as fair/poor, and 17.6% of English speaking vs. 44.4% of Spanish-speaking Latinos rated their health as fair/poor. Non-English speakers also often had a significantly higher prevalence of hypertension (Table 7); they often had higher rates of diabetes, had never seen a dentist, and reported greater discrimination in health care as well (data not shown). Such findings highlight that English-speaking Asian and Latino samples do not represent their populations’ demographics or health, underestimate Asian and Latino health disparities, and underestimate the contribution of SES to those disparities (203, 204, 206–209).
Reducing language-related method bias
Non-participation in research because it is conducted in English-only requires correction to increase the validity of data on Asians and Latinos, and improve the representativeness of such samples (203, 209). The obvious solution is to translate epidemiologic surveys into the non-English languages spoken most often in the US, i.e., Spanish and Chinese, and perhaps Vietnamese and Korean as well. Although such translations increase the cost of the research, cost is not an acceptable reason for excluding REMs and their sub-populations (those not fluent in English) according to NIH guidelines for inclusion of women and minorities in research (210). Those guidelines however refer to clinical trials rather than to epidemiologic studies of health disparities. Hence, reducing language-related method bias (increasing method equivalence for all REMs) inevitably may require revision of the NIH guidelines to address language-related exclusion in all NIH-supported research. We strongly recommend such revision.
Inclusion-Related Method Equivalence: RDDTS
The RDDTS method involves telephoning randomly selected household landline telephone numbers and administering a standardized health survey. The method has been used in population-health surveys (e.g., BRFSS) since the 1980s and 1990s to acquire random, representative samples, and hence RDDTS data provide much of the evidence on population racial–ethnic health disparities.
20th century non-coverage bias
Since the 1980s and 1990s, however, data from NHIS and NHANES samples (i.e., people interviewed in person at home) revealed that REMs and low-SES groups were significantly more likely than others to lack landline phones (to be phoneless), and hence were being differentially excluded from RDDTS (211–215). For example, Anderson et al. (215) analyzed 1991–1994 NHIS data and found that 5% were phoneless: 10% of blacks and Latinos (vs. 3% of Whites) interviewed at home, 17% of those at and below the poverty line, and 21% of blacks at and below the poverty line were phoneless. The Census Bureau (216) similarly found that 5% of the 1990 population was phoneless, with American Indians (23%), blacks (13%), and Latinos (12%) most likely to lack phones. The data also indicated that minority RDDTS samples from the 1990s had higher SES levels than their phoneless cohorts, and hence were not representative of their populations (211–215).
21st century non-coverage bias
In the 2000s, the prevalence of non-coverage (lack of landlines) increased for the US population as people began substituting less expensive cellular phones for landlines (217–220). The percentage of US wireless (cell phone only) households was 7.2% in 2004, 8.4% in 2005, 12.8% in 2006 (217–220), and 40.6% in 2012 (221). Data in the 2000s reveal that wireless households are significantly more likely to live in poverty and to be REMs than landline households, and than households with landlines and cell phones (217–220). Demographic data on wireless US households in 2012 are shown in Table 8. Moreover, health among wireless and phoneless households continues to be significantly poorer than that of landline households. For example, Blumberg et al. (218) compared 2004–2005 NHIS participants who had vs. lacked landlines. Those without landlines were significantly more likely to lack health insurance (e.g., landline = 14.8%, wireless only = 31.1%, phoneless = 43.9%), engage in binge drinking, report serious psychological distress, and be current smokers (landline = 19.7%, wireless = 32.9%, phoneless = 36.9%). Likewise, 2012 data (221) revealed that wireless only households continue to have a higher prevalence of binge drinking (wireless = 30.5%, landline = 17.5%), cigarette smoking (wireless = 24.3%, landline = 17.5%), lack of health insurance (wireless = 27.9%, landline = 15.1%), and failure to obtain health care because of financial barriers (wireless = 12.2%, landline = 6.0%).
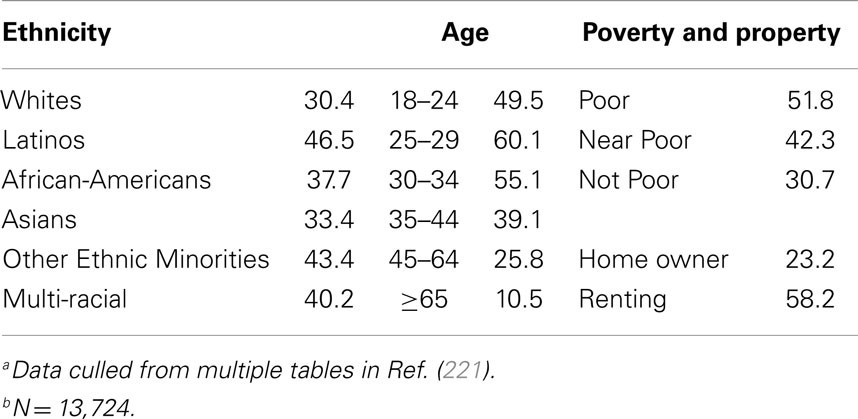
Table 8. Demographics of wireless only households, 2012a,b.
Such data highlight the non-equivalence of the RDDTS method by race–ethnicity and SES, i.e., the differential exclusion of REMs and low-SES groups due to their lack of landlines. As noted, the result of such exclusion is that REM RDDTS samples have significantly higher SES levels and better health than their wireless counterparts who cannot participate in RDDTS (211–221). This has led to questions about the validity and the population-representativeness of demographic and health data from REM RDDTS samples. Of greatest concern is that REM RDDTS samples underestimate the contribution of SES to racial–ethnic health disparities by excluding the poorest and least educated REMs. For example, in a recent study (222), we compared the demographics and cigarette smoking of a random, statewide, California (CA) sample of black adults surveyed door to door in person (N = 2218), to those of a random, statewide, CA RDDTS (i.e., CHIS) sample of blacks (N = 2315) acquired simultaneously. Results revealed that the in-person black sample was significantly younger, poorer, and less-educated than the RDDTS sample, and had significantly higher smoking prevalence, 32.6% (in-person sample) vs. 19.1% (RDDTS sample), even when controlling for demographics. Moreover, 13% of the in-person black sample was phoneless/wireless only, and hence could not participate in the RDDTS study. The in-person, phoneless/wireless group of blacks was the youngest, poorest, and least educated of all groups, and had the highest smoking prevalence – 50.2% overall, 47.7% for wireless/phoneless black men, and 53.4% for wireless/phoneless black women.
Other studies have revealed that REMs are more likely than whites to refuse to participate in RDDTS (with response rates ranging from 0.2 to 10%), and that REMs who reside in segregated areas are less likely to be phoned and less likely to participate if telephoned (202, 222, 223).
Reducing RDDTS exclusion-related method bias
Increasing concerns regarding non-coverage bias led the Centers for Disease Control (CDC) to begin to include wireless phone numbers in the BRFSS (224). Unfortunately, this change was not implemented until 2011. Moreover, the percentage of wireless phone numbers called remains too small to overcome the differential exclusion of REMs and of the low-SES. The median percentage of wireless numbers (of all phone numbers) called was 11% in the 2011 BRFSS, and 20% in the 2012 BRFSS (224). The RDDTS method thereby remains a biased one that acquires REM samples whose higher SES and superior health do not represent their populations, and the method continues to underestimate the role of SES in racial–ethnic health disparities. Hence, we urge epidemiologists who analyze and cite RDDTS data (e.g., 2000 BRFSS) as evidence of racial–ethnic health disparities to highlight the non-representativeness of the REM samples, and to draw extremely tentative conclusions about racial–ethnic health disparities – particularly given that the majority of RDDTS are conducted in English and Spanish only (i.e., exhibit language-related method bias as well). We also urge the CDC to include more wireless households in the BRFSS, and recommend that wireless households be over-sampled until the percentage that participates in the BRFSS is equal to the percentage of wireless households in the US.
Scalar Equivalence
Scalar (scaling) equivalence refers to the extent to which the response categories provided for items (e.g., true/false, Likert-type scales) are responded to in the same way by all status groups, such that group differences found are responses to item content rather than item scaling (225–229).
High vs. Low-Frequency Scales and Item Order
Studies indicate that everyone’s responses to scaled items are partially a function of the response categories (the numbers and their labels) provided. For example, people assume that scale numbers and labels represent the researcher’s knowledge of the distribution of behaviors and symptoms, and assume that the midpoint of the scale is the norm. Hence, people report significantly higher frequencies of behaviors, symptoms, and events on scales with high-frequency (e.g., 1–10) than on scales with low-frequency (0–5) numbers (228, 229) because a higher-frequency is the norm (midpoint) on high-frequency scales. The high- vs. low-frequency scaling effect has been found in self-reports of the frequency of physical symptoms, psychiatric symptoms, health behaviors, and negative emotions, each higher on high-frequency scales (228, 229).
High- vs. low-frequency scaling also shapes self-perceptions and subsequent health-behavior intentions. For example, in one study, the number of sexual partners was presented on a low-frequency (0, 1, 2, 3 or more) and on a high-frequency (2, 3, 4, 5, 6, 7, 8, 9, 10 or more) scale. People who had 3 or more sexual partners rated their sexual behavior as risky and reported future intentions to use condoms when they received the low-frequency scale on which they understood 3 to be extreme and abnormal (230). Because scaling provides tacit information about norms, low-frequency scaling can be used unobtrusively to increase risk perceptions and healthy behavioral intentions (230). Scaling influences self-reports and self-perceptions because responding to quantitatively scaled items is a complex cognitive process involving interpreting each item’s content and its response categories; estimating one’s frequency of the behavior, symptom, or event in the past; using the response categories as a clue to norms; editing one’s response in a manner consistent with norms and with social desirability, and then finally answering the question (229–233). The order in which questions appear also influences responses to scaled items (234). As discussed later here, item order (context) influences REM but not white responses to the self-rated health item.
REM responses to scaled items
Scaling contributes to racial–ethnic differences on items, with REMs affected more strongly than whites (225, 226, 234–237). Likert-scales that range from 1 to 5, with labels that range from Strongly Disagree to Strongly Agree, or from Poor to Excellent, are often used in health research and are the most troublesome. This is because racial–ethnic differences in responses to scaling occur most often to such scales, and such scales are non-equivalent across racial–ethnic groups. Specifically, numerous studies have documented three, reliable ethnic-minority response styles to Likert-scales, the Acquiescent, Extreme, and Middle Response Styles (236–244). The Acquiescent Response Style is the tendency to agree/strongly agree with items irrespective of their content; the Extreme Response Style is the tendency to choose the extreme response (highest and lowest numbers) irrespective of item content; and the Middle Response Style is the tendency to select the midpoint of Likert-scales irrespective of item content (236–244). African-Americans and Latinos tend to exhibit Extreme, Asian Americans tend to exhibit Middle, and Latinos also often exhibit Acquiescent responses to five-point (in particular) and seven-point Likert-scales (236–244).
Many have suggested that the Extreme style reflects the REM-cultural value of providing clear, unambiguous responses; that the Acquiescent style reflects REM-cultural valuing of being polite, agreeable, and respectful; and that the Middle style reflects the REM-cultural desire to conform to norms and be similar to others (236–244). Thus, it has been hypothesized that all three response styles are manifestations of the universal cultural values and tendencies of Individualism–Collectivism, Uncertainty Avoidance, and Power Distance on which REMs generally tend to differ from whites (236–244). These terms are defined in Table 9.
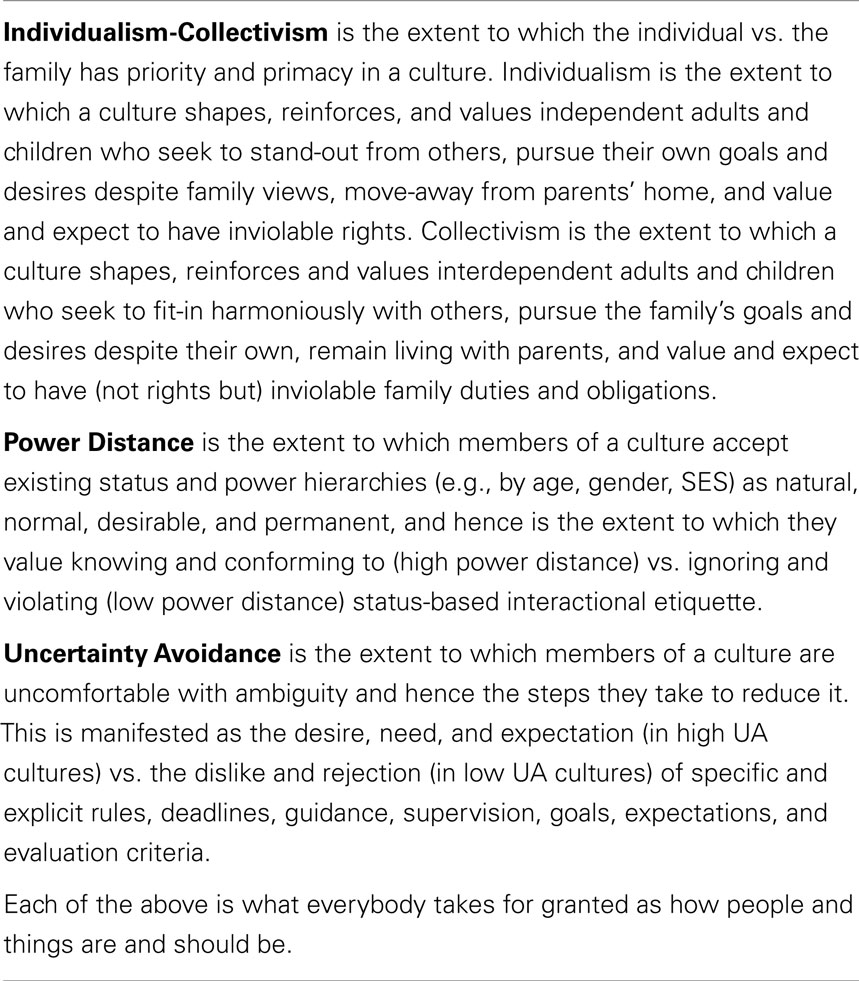
Individualism–Collectivism, Uncertainty Avoidance, and Power Distance tendencies are found among the members of all cultures in the US and worldwide, i.e., for example, every culture contains people who are Individualists or Collectivists. However, on the whole and for the most part, western-Europeans and European-Americans (US whites) tend to be high on Individualism and low on both Power Distance and Uncertainty Avoidance (Table 10). Hispanic and African people worldwide (Table 10), and Latinos and Native- and African-Americans in the US tend to be high on Collectivism, Power Distance, and Uncertainty Avoidance. Asians in the US and abroad (Table 10) tend to be high on Collectivism and high on Power Distance, but vary considerably (from low to very high) on Uncertainty Avoidance (239–248), as shown in the examples provided in Table 10.
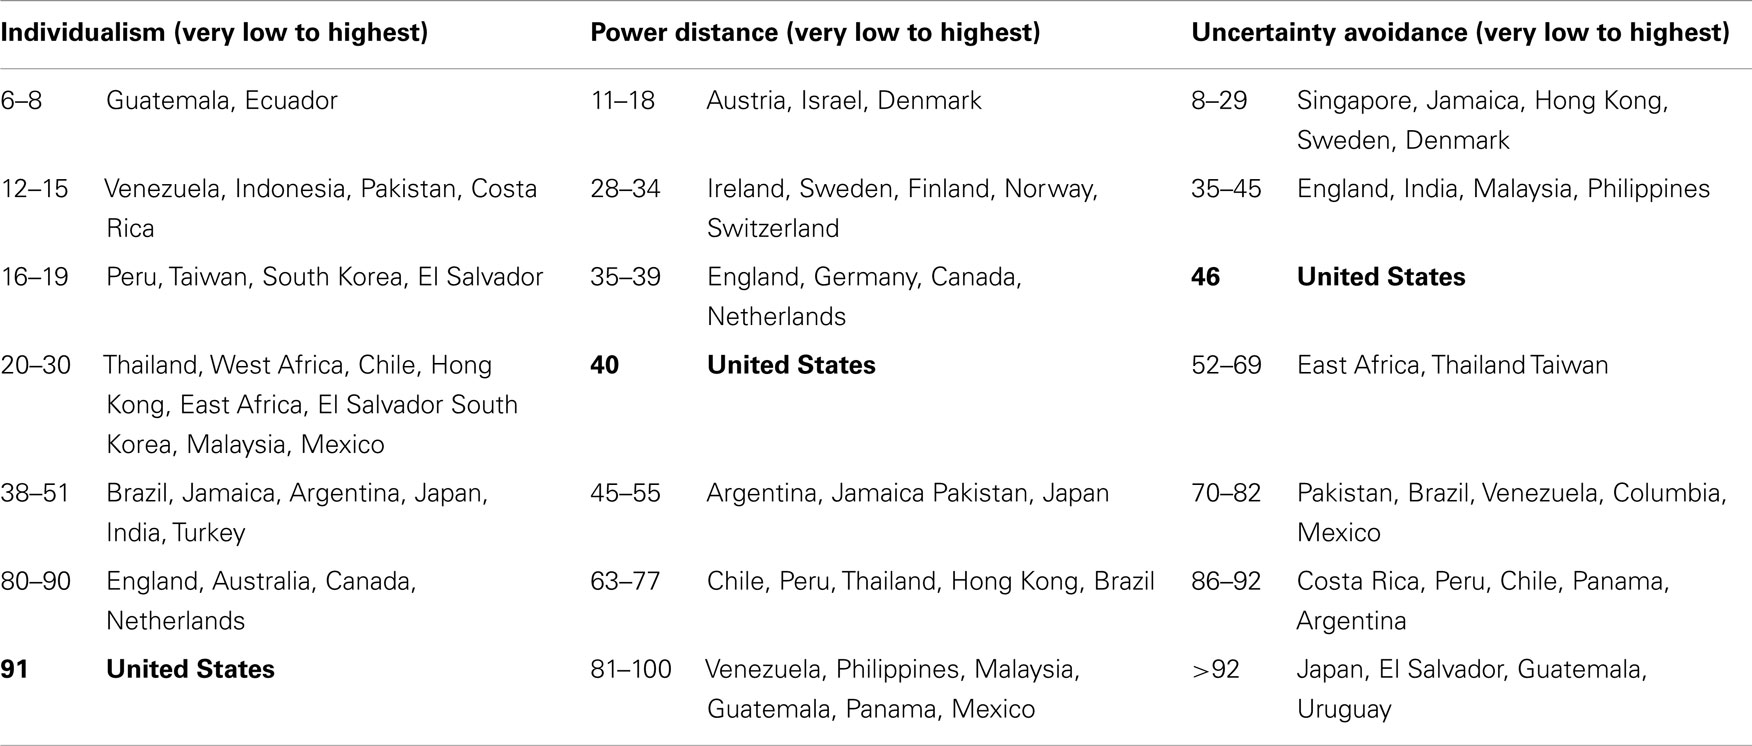
Table 10. Mean individualism, power distance, and uncertainty avoidance survey scores of 88,000 IBM employees in selected countries (245–247).
Researchers have theorized that the Acquiescent, Extreme, and (especially) the Middle Response Styles reflect high Collectivism, and that the Extreme style also reflects high uncertainty avoidance and high power distance (236–244). There is growing empirical support for the relationship between high Collectivism and the three response styles among US REMs and among people in Asian, African, and Latinos cultures worldwide (236–244). Data on the relationships between the response styles and power distance and uncertainty avoidance are less consistent (236–244, 249, 250). In addition, several studies have found that US low-SES, older (≥65 years), and low-educated populations also tend to exhibit the Acquiescent style on Likert-scales (234, 238, 241, 249, 250).
Response-style effects on REM health data
Irrespective of their sociocultural genesis and correlates, the Extreme, Acquiescent, and Middle Response Styles reveal that five-point Likert-scales are non-equivalent across racial–ethnic groups, and are a threat to the validity of health data from REMs (225, 226, 228, 238, 240–244). This is because REM response styles can be misinterpreted as substantive and yield false group differences. Likewise, statistical analyses are undermined by the response styles. The Extreme Style inflates standard deviations and decreases correlations, whereas the Acquiescent Style can yield a spurious factor composed of negatively keyed items, and result in failed confirmatory factor analyses with REMs (225, 226, 228, 238, 240–244). Epidemiologic studies of health disparities do not test or control for REM response styles, and thereby continue to raise the question of whether racial–ethnic disparities on the Likert-scaled items in health surveys are genuine differences or are simply artifacts of REM response styles (225, 226, 228, 238, 240–244).
Testing and controlling for response styles
Several strategies have been suggested to test and control for response styles. Foremost among these is changing the scaling used. Likert-scales that range from 1 to 5 (or 1 to 7) are most likely to elicit the response styles because they provide extreme anchors around a midpoint (225, 226, 235, 240, 249–253). Studies have demonstrated empirically that four- or six-point Likert-scales (i.e., without a midpoint) diminish all three response styles (235, 240, 249–253). Likewise, a mix of positive and negative-phrased items decreases the Acquiescent Style because people cannot simply agree with all items (225, 226, 228, 238, 240–244). In addition, several standardization methods and use of standardized instead of raw scores have been suggested (249, 251–255). Other suggestions include computing the proportion of items endorsed (agreed with) to measure Acquiescent responding, and the proportion of extreme responses to measure Extreme responding, administering the Greenleaf Extreme Response Scale along with the study measures (256, 257), and use of structural equation modeling and item-response theory (225, 226, 240–244, 249, 251–255).
The trouble with self-rated health
A question on self-rated health is included in almost all epidemiologic studies, such as the BRFSS, NHANES, NHIS, CHIS, and international population-health surveys (258–261). In general, self-rated health has a strong relationship to adult mortality (260, 261), although the strength of that relationship varies by SES (262), marital status (263), education (264), race–ethnicity and gender (265), and residential segregation (26, 170, 266). Nonetheless, self-rated health is widely regarded as a valid, valuable measure of population health and health trajectories, and hence often is used in studies of racial–ethnic health disparities (26, 170, 258–266). One reason for this is that self-rated health appears to be a simple, straightforward question. People are asked to rate their health on a five-point Likert-scale of poor, fair, good, very good, and excellent. Because five-point Likert-scales are non-equivalent across racial–ethnic groups and tend to elicit REM response styles, questions have been raised about the equivalence and validity of self-rated health across racial–ethnic groups.
An enormous number of studies [e.g., Ref. (26, 170, 266–276)] have found that Latinos (primarily) and Asians (and to a lesser extent, African-Americans as well) tend to rate their health as fair or poor despite health indicators to the contrary, and seem reluctant to rate their health as very good or excellent. This is most striking by language: Latinos and Asians who answer the self-rated health question in their native languages give significantly poorer ratings than their cohorts who answer in English [(259, 268–276); Table 7]. For example, Latinos answering the question in Spanish are seven times more likely than whites to report fair/poor health, whereas those answering in English are only twice as likely to do so (276). This has raised questions about whether the words “very good” and “excellent” have exact equivalents in other languages (259, 268). Moreover, self-rated health among Latinos and Asians also varies with nativity, years of US residence, acculturation (measured by acculturation scales), education, and income (26, 170, 258–276). Consequently, it is unclear if Latino and Asian disparities in self-rated health reflect lack of translation-equivalence, or the lower SES associated with low-English fluency (Table 7), or differences in their responses to Likert-scales (26, 170, 258–277).
Some have suggested that REMs’ fair/poor self-rated health and disparities in self-rated health reflect a cultural response-style specific to the self-rated health question, and that this style is a function of Collectivism (265, 277). White (and western-European) health questions presume that each person experiences him/herself in an Individualistic framework as an autonomous entity that one can reflect on to make statements about health, behaviors, and emotions (278). If people do not experience themselves in this manner, if they instead are Collectivists who are deeply intertwined with their families, how do they answer the self-rated health question? To whom do they refer? As Shweder and Sullivan [(278), p. 507] noted,
“in standard questions such as ‘How would you rate your overall health?’ it is not just the interpretation of the words ‘health’ and ‘overall’ that is problematic. The meaning of ‘your’ presents some fascinating problems as well. It is a plausible hypothesis that individuals in some ethnic groups are less willing to state that they are in excellent health or are less able to experience themselves in excellent health when other members of the family are suffering; new research is needed on cultural variations in the degree to which personal health and collective health are experienced as separate issues” (italics in the original).
Item order and improving equivalence of self-rated health
To complicate matters, Latino (in particular) and Asian self-rated health vary with where the question appears, i.e., with item order (258, 279). The normative practice in epidemiologic surveys is to place the self-rated health question before questions about specific health conditions (i.e., health without a context) to remove context effects. However, when asked to rate their health after (instead of before) answering questions about health conditions, Latinos (in particular) report better (more positive) health, whereas order has no effect on whites; this is especially the case for Spanish-speaking Latinos (258, 279). Such data suggest that rating one’s health without a context may be difficult for REMs, perhaps because of high Collectivism. Thus, some have empirically demonstrated and subsequently suggested that self-rated health should be asked after questions on specific health conditions to increase the equivalence and the validity of self-rated health across racial–ethnic groups (258, 279).
Socially desirable responding to scaled items
Socially desirable responding is the tendency to provide answers that one assumes to be consistent with social norms and expectations (desirable) irrespective of their veracity (280, 281). REMs exhibit significantly higher socially desirable responding than whites on Likert-scaled and yes/no-scaled items, and these racial–ethnic differences often are large, i.e., effect sizes ranging from d = 0.37 to 1.04 (280, 281). This socially desirable responding manifests as REM denial and under-reporting of the frequency of undesirable behaviors such as cigarette smoking (282–284), and as over-reporting the frequency of desirable behaviors such as cancer screening (285–288). For example, in the NHANES-III (in-person health survey with biologic measures taken), African-American cotinine-determined smokers were (OR) 4–9 times more likely than whites to deny smoking, with 68% of cotinine-determined Black-women smokers self-reporting non-smoking (282). Socially desirable responding is highest in household (in-person interviews), next highest in RDDTS, and lowest in anonymous mail or written surveys (281, 289). This has raised questions about the validity of racial–ethnic minority responses to scaled items in household interviews such as the NHIS and NHANES (281, 282).
African-American socially desirable responding has been theorized to reflect distrust of researchers, i.e., fear of the possible racist uses of their health data (30, 280, 281). This explanation is consistent with the finding that African-Americans omit significantly more items in health surveys and interviews than whites and other REMs as well (280, 281). Socially desirable responding among Latinos and Asians has been theorized to reflect Collectivism and its need to being viewed as conforming to others’ expectations (280, 281). Irrespective of its source, high socially desirable responding among REMs, like the response styles, undermines the validity of REM health data; can be misinterpreted as substantive group differences or the lack of them; and highlights the non-equivalence of Likert-scaled and of yes/no-scaled items across racial–ethnic groups (280, 281).
Reducing socially desirable responding
Many have suggested using social-desirability scales to detect and control for socially desirable responding (280, 281). The most widely used scales are the Balanced Inventory of Desirable Responding (290), and the Marlow–Crowne Social Desirability Scale (291, 292), the latter available in English and Spanish (293). These scales should be used with caution in light of ongoing debate regarding their validity (280, 281), and the fact that they contain Likert-scaled items. Alternatively, others have highlighted the benefits of cognitive-pretesting of surveys and interviews to improve item and scalar equivalence for diverse groups (231–233, 294, 295). Cognitive-pretesting involves verbal probing and interviewing of participants from diverse populations to assure that items and scaling are understood in the manner that researchers intend. Such techniques are simple (e.g., people read items and scaling aloud and talk about what they are thinking) and are well-established procedures for increasing both scalar and item equivalence across racial–ethnic and SES groups (295).
Summary and Conclusion
This paper presented a review of the problem of measurement non-equivalence in epidemiologic research on racial–ethnic health disparities and provided concrete suggestions for improving sample, method, and scalar equivalence. Because our focus was delineating and illuminating non-equivalence and then suggesting strategies to improve equivalence, comprehensive reviews of topics (e.g., cultural variables, segregation) with all inconsistent findings reported were not presented. Although providing comprehensive, topical literature reviews is beyond the scope and purpose of this paper, the absence of those nonetheless is a limitation. Likewise, some variables that are highly relevant to racial–ethnic health disparities and therefore should be measured and controlled in studies could not be discussed due to space limitations – e.g., racial–ethnic discrimination (30, 42).
Moreover, due to space limitations, other important types of measurement equivalence (e.g., item, construct, translation, impact, etc.) could not be addressed, item equivalence in particular. Item equivalence refers to the extent to which the items in surveys and interviews are understood to mean the same thing by all social status groups; it is the extent to which the experiences (e.g., sadness), objects (e.g., cigars), and behaviors (e.g., smoking, vigorous physical activity, fruit/vegetable consumption) have the same referents for everyone (296–298). Although we could not cover the multitude of issues surrounding item equivalence, we highlight here that many of the ostensibly simple, straightforward questions in health surveys and interviews do not mean the same thing to diverse racial–ethnic groups, and have been demonstrated to be non-equivalent across those groups.
For example, when asked about ever and frequency of cigar use, REMs (youth in particular) often do not interpret the word “cigar” in the manner that researchers intend. Hence they significantly under-report cigar use unless specific cigar brand names are used (299–301). REMs’ self-reported cigar smoking nearly doubles when brand names are used (299), with the greatest increases found among African-Americans (300). Similar problems of the non-equivalence of items across race–ethnicity have been found for ostensibly simple questions about physical activity (302–304) and physical functioning (305, 306), and for a variety of other questions as well (225, 228, 307). Thus, the problems of non-equivalence across racial–ethnic groups extend well beyond what we could address here, and hence this presentation is limited in scope.
Likewise, due to space limitations, some relevant topics were not discussed. Specifically, Native Americans were included in the data on REMs presented here and were mentioned specifically, but studies of their health disparities were not separately addressed. In addition, propensity-scoring has been suggested as one possible solution to problems of equivalence (308) but was not addressed. Moreover, some forms of equivalence may be more important than others in specific types of health disparities research and with specific REMs but this issue could not be addressed here. Finally, some of our suggested measurement strategies for improving equivalence might be inter-related – e.g., measures of wealth might be correlated with measures of segregation and with prevalence of non-English proficiency, and REM response styles might be more prevalent among non-English speakers or in segregated communities. If and how some of these measures might interact is by and large unknown at present, and discussion of the few known interactions is beyond the purpose and scope of this paper. We recommend that researchers examine potential interactions among these measures just as they do among more normative measures.
Despite these limitations, issues of sample, method, and scalar non-equivalence were described in detail with explanations and examples presented as well. Likewise, a wide variety of concrete, simple strategies for improving measurement equivalence were provided to enhance epidemiologic studies of racial–ethnic health disparities. The challenge for epidemiologists is to cease using non-equivalent measures and methods, begin using alternatives that are equivalent across racial–ethnic groups, and define measurement equivalence as the gold standard in health disparities research. Doing so is critical because epidemiologic data on health disparities determine population forecasts, guide resource allocation, and shape efforts to reduce health disparities (13, 14).
Conflict of Interest Statement
The authors declare that the research was conducted in the absence of any commercial or financial relationships that could be construed as a potential conflict of interest.
References
1. Braveman P. Health disparities and health equity: concepts and measurement. Annu Rev Public Health (2006) 27:167–94. doi:10.1146/annurev.publhealth.27.021405.102103
Pubmed Abstract | Pubmed Full Text | CrossRef Full Text | Google Scholar
2. Navarro V. The Political Economy of Social Inequalities: Consequences for Health and Quality of Life. Amityville, NY: Baywood (2000).
3. Navarro V. Special report on the political and social contexts of health. Int J Health Serv (2003) 33:407. doi:10.2190/34DH-R3GA-GKDU-09P2
Pubmed Abstract | Pubmed Full Text | CrossRef Full Text | Google Scholar
6. Marger M. Social Inequality: Patterns and Processes. New York, NY: Russell Sage Foundation (2002).
8. Davis AM, Vinci LM, Okwuosa TM, Chase AR, Huang ES, et al. Cardiovascular health disparities. Med Care Res Rev (2007) 64:29S–100S. doi:10.1177/1077558707305416
9. Peek ME, Cargill A, Huang ES. Diabetes health disparities. Med Care Res Rev (2007) 64:101S–56S. doi:10.1177/1077558707305409
10. Gold DR, Wright R. Population disparities in asthma. Annu Rev Public Health (2005) 26:89–113. doi:10.1146/annurev.publhealth.26.021304.144528
12. Barr D. Health Disparities in the U.S.: Social Class, Race, Ethnicity, and Health. Baltimore, MD: Johns Hopkins University Press (2008).
13. Satcher D. From the surgeon general: eliminating global health disparities. JAMA (2000) 284(22):2864.
14. Benjamin R. Reflections on addressing health disparities and the national agenda. Am J Public Health (2010) 100(Suppl 1):S7. doi:10.2105/AJPH.2010.195503
15. McHorney CA, Fleishman JA. Assessing and understanding measurement equivalence in health outcome measures. Med Care (2006) 44(11 Suppl 3):S205–10. doi:10.1097/01.mlr.0000245451.67862.57
16. Stewart AL, Napoles-Springer AM. Advancing health disparities research: can we afford to ignore measurement issues? Med Care (2003) 41(11):1207–20. doi:10.1097/01.MLR.0000093420.27745.48
Pubmed Abstract | Pubmed Full Text | CrossRef Full Text | Google Scholar
17. Ramirez M, Ford ME, Stewart AL, Teresi JA. Measurement issues in health disparities research. Health Serv Res (2005) 40(5):1640–57. doi:10.1111/j.1475-6773.2005.00450.x
18. Byrne BM, Watkins D. The issue of measurement invariance revisited. J Cross Cult Psychol (2003) 34:155–75. doi:10.1177/0022022102250225
19. Harachi TW, Choi Y, Abbott RD, Catalano RF, Bliesner SL. Examining equivalence of concepts and measures in diverse samples. Prev Sci (2006) 7:359–68. doi:10.1007/s11121-006-0039-0
Pubmed Abstract | Pubmed Full Text | CrossRef Full Text | Google Scholar
20. Vandenberg RJ. Toward a further understanding of and improvement in measurement invariance methods and procedures. Organ Res Methods (2002) 5(2):139–58. doi:10.1177/1094428102005002001
21. Kaufman JS. Epidemiologic analysis of racial/ethnic disparities: some fundamental issues and a cautionary example. Soc Sci Med (2008) 66(8):1659–69. doi:10.1016/j.socscimed.2007.11.046
22. Do DP, Frank R, Finch BK. Does SES explain more of the Black/White health gap than we thought? Revisiting our approach toward understanding racial disparities in health. Soc Sci Med (2012) 74(9):1385–93. doi:10.1016/j.socscimed.2011.12.048
Pubmed Abstract | Pubmed Full Text | CrossRef Full Text | Google Scholar
23. Orsi JM, Margellos-Anast H, Whitman S. Black-White health disparities in the United States and Chicago: a 15-year progress analysis. Am J Public Health (2010) 100(2):349–56. doi:10.2105/AJPH.2009.165407
Pubmed Abstract | Pubmed Full Text | CrossRef Full Text | Google Scholar
24. Williams DR, Mohammed SA, Leavell J, Collins C. Race, socioeconomic status, and health: complexities, ongoing challenges, and research opportunities. Ann N Y Acad Sci (2010) 1186:69–101. doi:10.1111/j.1749-6632.2009.05339.x
Pubmed Abstract | Pubmed Full Text | CrossRef Full Text | Google Scholar
25. Kershaw KN, Albrecht SS. Metropolitan-level ethnic residential segregation, racial identity, and body mass index among U.S. Hispanic adults. BMC Public Health (2014) 14:283. doi:10.1186/1471-2458-14-283
Pubmed Abstract | Pubmed Full Text | CrossRef Full Text | Google Scholar
26. Gibbons J, Yang TC. Self-rated health and residential segregation. J Urban Health (2014) 91(4):648–60. doi:10.1007/s11524-013-9863-2
27. Anthopolos R, Kaufman JS, Messer LC, Miranda ML. Racial residential segregation and preterm birth: built environment as a mediator. Epidemiology (2014) 25(3):397–405. doi:10.1097/EDE.0000000000000079
Pubmed Abstract | Pubmed Full Text | CrossRef Full Text | Google Scholar
28. Landrine H, Corral I. Separate and unequal: residential segregation and Black health disparities. Ethn Dis (2009) 19(2):179–84.
29. Morello-Frosch R, Jesdale BM. Separate and unequal: residential segregation and estimated cancer risks associated with ambient air toxics in U.S. metropolitan areas. Environ Health Perspect (2006) 114:386–93. doi:10.1289/ehp.8500
Pubmed Abstract | Pubmed Full Text | CrossRef Full Text | Google Scholar
30. Smedley BD. The lived experience of race and its health consequences. Am J Public Health (2012) 102(5):933–5. doi:10.2105/AJPH.2011.300643
Pubmed Abstract | Pubmed Full Text | CrossRef Full Text | Google Scholar
31. Frazier JW. Race, Ethnicity, and Place in a Changing America. New York, NY: State University of New York Press (2011).
32. Anderson SK. Explorations in Diversity: Examining Privilege and Oppression in a Multicultural Society. Belmont, CA: Brooks/Cole (2011).
33. Bonilla-Silva E. Racism Without Racists: Color-Blind Racism and the Persistence of Racial Inequality in America. Lanham, MD: Rowman & Littlefield (2009).
34. Minkler M, Salvatore AL, Chang C, Gaydos M, Liu SS, Lee PT, et al. Wage theft as a neglected public health problem. Am J Public Health (2014) 104(6):1010–20. doi:10.2105/AJPH.2013.301813
Pubmed Abstract | Pubmed Full Text | CrossRef Full Text | Google Scholar
35. Karlsen S, Nazroo JY. Religious and ethnic differences in health. Ethn Health (2010) 15(6):549–68. doi:10.1080/13557858.2010.497204
36. Franks P, Muennig P, Lubetkin E, Jia H. The burden of disease associated with being African-American in the United States and the contribution of socio-economic status. Soc Sci Med (2006) 62:2469–78. doi:10.1016/j.socscimed.2005.10.035
Pubmed Abstract | Pubmed Full Text | CrossRef Full Text | Google Scholar
37. Krieger N, Williams DR, Moss NE. Measuring social class in US public health research: concepts, methodologies, and guidelines. Annu Rev Public Health (1997) 18:341–78. doi:10.1146/annurev.publhealth.18.1.341
Pubmed Abstract | Pubmed Full Text | CrossRef Full Text | Google Scholar
38. Adler NE, Stewart J. Health disparities across the lifespan: meaning, methods, and mechanisms. Ann N Y Acad Sci (2010) 1186:5–23. doi:10.1111/j.1749-6632.2009.05337.x
Pubmed Abstract | Pubmed Full Text | CrossRef Full Text | Google Scholar
39. Braveman PA, Cubbin C, Egerter S, Chideya S, Marchi KS, Metzler M, et al. Socioeconomic status in health research: one size does not fit all. JAMA (2005) 294(22):2879–88. doi:10.1001/jama.294.22.2879
Pubmed Abstract | Pubmed Full Text | CrossRef Full Text | Google Scholar
40. Shavers VL. Measurement of socioeconomic status in health disparities research. J Natl Med Assoc (2007) 99(9):1013–23.
41. Darity WA. Employment discrimination, segregation, and health. Am J Public Health (2003) 93:226–31. doi:10.2105/AJPH.93.2.226
42. Nazroo JY. The structuring of ethnic inequalities in health: economic position, racial discrimination, and racism. Am J Public Health (2003) 93(2):277–84. doi:10.2105/AJPH.93.2.277
Pubmed Abstract | Pubmed Full Text | CrossRef Full Text | Google Scholar
43. DeNavas-Walt C, Proctor BD, Smith JC. Income, poverty, and health insurance coverage in the United States, 2012. Current Population Reports, P60-245. Washington, DC: U.S. Government Printing Office (2013). p. 1–88.
44. U.S. Census Bureau. Current Population Survey 2012. Annual Social and Economic Supplement (2014).
45. Silverman RM, Patterson K. The four horsemen of the fair housing apocalypse: a critique of fair housing policy in the USA. Crit Sociol (2012) 38(1):123–40. doi:10.1177/0896920510396385
46. Roscigno VJ, Karafin DL, Tester G. The complexities and processes of racial housing discrimination. Soc Probl (2009) 56(1):49–69. doi:10.1525/sp.2009.56.1.49
47. Yinger J. Housing discrimination and residential segregation as causes of poverty. In: Danzinger SH, Haveman RH, editors. Understanding Poverty. New York, NY: Russell Sage Foundation (2001). 382 p.
48. US Department of Housing and Urban Development. Housing Discrimination Study. Washington, DC: US Government Printing Office (2002).
49. Ross SL, Turner MA. Housing discrimination in metropolitan America. Soc Probl (2005) 52:148–51. doi:10.1525/sp.2005.52.2.152
50. Yinger J. Closed Doors Opportunities Lost: The Continuing Cost of Housing Discrimination. New York, NY: Russell Sage Foundation (1998).
51. South SJ, Crowder KD. Housing discrimination and residential mobility: impacts for Blacks and Whites. Popul Res Policy Rev (1998) 17(4):369–87. doi:10.1023/A:1005917328257
52. Dunn RA, Sharkey JR, Lotade-Manje J, Bouhlal Y, Nayga RM Jr. Socio-economic status, racial composition and the affordability of fresh fruits and vegetables in neighborhoods of a large rural region in Texas. Nutr J (2011) 10:6. doi:10.1186/1475-2891-10-6
Pubmed Abstract | Pubmed Full Text | CrossRef Full Text | Google Scholar
53. Talukdar D. Cost of being poor: retail price and consumer price search differences across inner-city and suburban neighborhoods. J Consum Res (2008) 35:457–71. doi:10.1086/589563
54. Butts R, Gasteyer S. More cost per drop: water rates, structural inequality, and race in the United States – the case of Michigan. Environ Pract (2011) 3(4):386–95. doi:10.1017/S1466046611000391
55. Pager D, Shepherd H. The sociology of discrimination: racial discrimination in employment, housing, credit, and consumer markets. Annu Rev Sociol (2008) 34:181–209. doi:10.1146/annurev.soc.33.040406.131740
Pubmed Abstract | Pubmed Full Text | CrossRef Full Text | Google Scholar
56. Goldberg PK. Dealer price discrimination in new car purchases. J Polit Econ (1996) 104(3):75–92. doi:10.1086/262035
57. Myers CK, Close G, Fox L, Meyer JW, Niemi M. Retail redlining: are gasoline prices higher in poor and minority neighborhoods? Econ Inq (2011) 49(3):795–809. doi:10.1111/j.1465-7295.2010.00317.x
58. McDonough P, Sackerb A, Wiggins RD. Time on my side? Life course trajectories of poverty and health. Soc Sci Med (2005) 61:1795–808. doi:10.1016/j.socscimed.2005.03.021
Pubmed Abstract | Pubmed Full Text | CrossRef Full Text | Google Scholar
59. Stevens AH. Climbing out of poverty, falling back in: measuring the persistence of poverty over multiple spells. J Hum Resour (1999) 34:557–88. doi:10.2307/146380
60. Do DP. The dynamics of income and neighborhood context for population health: do long term measures of socioeconomic status explain more of the Black/White health disparity than single-point-in-time measures? Soc Sci Med (2009) 68:1368–75. doi:10.1016/j.socscimed.2009.01.028
Pubmed Abstract | Pubmed Full Text | CrossRef Full Text | Google Scholar
61. Rank MR, Hirschl TA. Rags or riches: estimating the probabilities of poverty and affluence across the adult American life span. Soc Sci Q (2001) 82:651–69. doi:10.1111/0038-4941.00049
62. Quillian DL. How long are exposures to poor neighborhoods? The long-term dynamics of entry and exit from poor neighborhoods. Popul Res Policy Rev (2003) 22:221–49. doi:10.1023/A:1026077008571
63. Sharkey EP. The intergenerational transmission of context. Am J Sociol (2008) 13(4):931–69. doi:10.1086/522804
64. Kim S, Egerter S, Cubbin C, Takahashi ER, Braveman P. Potential implications of missing income data in population-based surveys. Public Health Rep (2007) 122(6):753–63.
65. Tippett R, Jones-DeWeever A, Rockeymoore M, Hamilton D, Darity W. Beyond Broke: Why Closing the Racial Wealth Gap is a priority for National Economic Security. Durham, NC: Duke University Center for Global Policy Solutions (2014).
66. Akresh IR. Wealth accumulation among U.S. immigrants: a study of assimilation and differentials. Soc Sci Res (2011) 40:1390–401. doi:10.1016/j.ssresearch.2009.08.004
67. Pollack CE, Chideya S, Cubbin C, Williams B, Dekker M, Braveman P. Should health studies measure wealth? A systematic review. Am J Prev Med (2007) 33(3):250–64. doi:10.1016/j.amepre.2007.04.033
Pubmed Abstract | Pubmed Full Text | CrossRef Full Text | Google Scholar
68. Graves SM. Landscapes of predation, landscapes of neglect: a location analysis of payday lenders and banks. Prof Geogr (2003) 55:303–17.
69. Eisenhauer E. In poor health: supermarket redlining and urban nutrition. GeoJournal (2001) 53:125–33. doi:10.1023/A:1015772503007
70. Small M, McDermott M. The presence of organizational resources in poor urban neighborhoods. Soc Forces (2006) 84:1697–724. doi:10.1353/sof.2006.0067
71. Krieger N, Chen JT, Waterman PD, Soobader MJ, Subramanian SV, Carson R. Geocoding and monitoring US socioeconomic inequalities in mortality and cancer incidence: does choice of area-based measure and geographic level matter? The public health disparities geocoding project. Am J Epidemiol (2002) 156:471–82. doi:10.1093/aje/kwf068
Pubmed Abstract | Pubmed Full Text | CrossRef Full Text | Google Scholar
72. Krieger N, Chen JT, Waterman PD, Soobader MJ, Subramanian SV, Carson R. Choosing area-based socioeconomic measures to monitor social inequalities in low birth weight and childhood lead poisoning: the public health disparities geocoding project. J Epidemiol Community Health (2003) 57:186–99. doi:10.1136/jech.57.3.186
Pubmed Abstract | Pubmed Full Text | CrossRef Full Text | Google Scholar
73. Krieger N, Chen JT, Waterman PD, Soobader MJ, Subramanian SV. Monitoring socioeconomic inequalities in sexually transmitted infections, tuberculosis, and violence. Geocoding and choice of area-based socioeconomic measures – the public health disparities geocoding project. Public Health Rep (2003) 118:240–60. doi:10.1093/phr/118.3.240
Pubmed Abstract | Pubmed Full Text | CrossRef Full Text | Google Scholar
74. Krieger N, Chen JT, Waterman PD, Rehkopf DH, Subramanian SV. Race/ethnicity, gender, and monitoring socioeconomic gradients in health: a comparison of area-based socioeconomic measures – the public health disparities geocoding project. Am J Public Health (2003) 93:1655–71. doi:10.2105/AJPH.93.10.1655
Pubmed Abstract | Pubmed Full Text | CrossRef Full Text | Google Scholar
75. Krieger N, Chen JT, Waterman PD, Rehkopf DH, Subramanian SV. Painting a truer picture of US socioeconomic and racial/ethnic health inequalities: the public health disparities geocoding project. Am J Public Health (2005) 95(2):312–23. doi:10.2105/AJPH.2003.032482
Pubmed Abstract | Pubmed Full Text | CrossRef Full Text | Google Scholar
76. Chuang Y-C, Cubbin C, Ahn D, Winkleby MA. Effects of neighborhood socioeconomic status and convenience store concentration on individual level smoking. J Epidemiol Community Health (2005) 59:568–73. doi:10.1136/jech.2004.029041
Pubmed Abstract | Pubmed Full Text | CrossRef Full Text | Google Scholar
77. Datta GD, Subramanian SV, Colditz GA, Kawaachi I, Palmer JR, Rosenberg L. Individual, neighborhood, and state-level predictors of smoking among US Black women. Soc Sci Med (2006) 63:1034–44. doi:10.1016/j.socscimed.2006.03.010
Pubmed Abstract | Pubmed Full Text | CrossRef Full Text | Google Scholar
78. O’Campo P, Burke JG, Culhane J, Elo IT, Eyster J, Holzman C, et al. Neighborhood deprivation and preterm birth among non-Hispanic Black and White women in eight geographic areas in the United States. Am J Epidemiol (2008) 167(2):155–63. doi:10.1093/aje/kwm277
Pubmed Abstract | Pubmed Full Text | CrossRef Full Text | Google Scholar
79. Pearl M, Braveman P, Abrams B. The relationship of neighborhood socioeconomic characteristics to birth-weight among 5 ethnic groups in California. Am J Public Health (2001) 91:1808–14. doi:10.2105/AJPH.91.11.1808
Pubmed Abstract | Pubmed Full Text | CrossRef Full Text | Google Scholar
80. Coughlin S, Leadbetter S, Richards T, Sabatino S. Contextual analysis of breast and cervical cancer screening and factors associated with health care access among United States women, 2002. Soc Sci Med (2008) 66(2):260–75. doi:10.1016/j.socscimed.2007.09.009
Pubmed Abstract | Pubmed Full Text | CrossRef Full Text | Google Scholar
81. Cozier YC, Palmer JR, Horton NJ, Fredman L, Wise LA, Rosenberg L. Relationship between neighborhood median housing value and hypertension risk among Black women in the US. Am J Public Health (2007) 97(4):718–24. doi:10.2105/AJPH.2005.074740
Pubmed Abstract | Pubmed Full Text | CrossRef Full Text | Google Scholar
82. Singh GK, Miller BA, Hankey BF, Edwards BK. Area Socioeconomic Variations in U.S. Cancer Incidence, Mortality, Stage, Treatment, and Survival. Bethesda, MD: NCI Cancer Surveillance Monograph Series No. 4, National Cancer Institute, NIH Pub. No. 03-5417 (2003).
84. Centers for Disease Control. Third National Report on Human Exposure to Environmental Chemicals (NCEH Pub. No. 05-0570). Atlanta, GA: Centers for Disease Control (2005).
85. Payne-Sturges D, Gee GC. National environmental health measures for minority and low-income populations: tracking social disparities in environmental health. Environ Res (2006) 102(2):154–71. doi:10.1016/j.envres.2006.05.014
Pubmed Abstract | Pubmed Full Text | CrossRef Full Text | Google Scholar
86. Jerrett M, Finkelstein M. Geographies of risk in studies linking chronic air pollution exposure to health outcomes. J Toxicol Environ Health A (2005) 68:1207–42. doi:10.1080/15287390590936085
Pubmed Abstract | Pubmed Full Text | CrossRef Full Text | Google Scholar
87. Jones OA, Maguire ML, Griffin JL. Environmental pollution and diabetes: a neglected association. Lancet (2008) 371:287–8. doi:10.1016/S0140-6736(08)60147-6
88. Gee G, Payne-Sturges D. Environmental health disparities: a framework integrating psychosocial and environmental concepts. Environ Health Perspect (2004) 1123:1645–53. doi:10.1289/ehp.7074
Pubmed Abstract | Pubmed Full Text | CrossRef Full Text | Google Scholar
89. Ponce N, Hoggatt K, Wilhelm M, Ritz B. Preterm birth: the interaction of traffic-related air pollution with economic hardship in Los Angeles neighborhoods. Am J Epidemiol (2005) 162:140–8. doi:10.1093/aje/kwi173
90. Institute of Medicine. Clearing the Air: Asthma and Indoor Air Exposures. Washington, DC: National Academy Press (2001).
91. Burton A. Does poor housing raise diabetes risk? Environ Health Perspect (2007) 115(11):534. doi:10.1289/ehp.115-a534
92. Jacobs DE, Kelly T, Sobolewski J. Linking public health, housing, and indoor environmental policy. Environ Health Perspect (2007) 115(6):976–82. doi:10.1289/ehp.8990
Pubmed Abstract | Pubmed Full Text | CrossRef Full Text | Google Scholar
93. Evans J, Hydman S, Stewart-Brown S, Smith D, Petersen S. An epidemiologic study of the relative importance of damp housing in relation to adult health. J Epidemiol Community Health (2000) 54:677–86. doi:10.1136/jech.54.9.677
Pubmed Abstract | Pubmed Full Text | CrossRef Full Text | Google Scholar
94. Jacobs DE, Clickner RP, Zhou JY, Viest SM, Marker DA, Rogers JW, et al. The prevalence of lead-based paint hazards in U.S. housing. Environ Health Perspect (2002) 110:A599–606. doi:10.1289/ehp.021100599
Pubmed Abstract | Pubmed Full Text | CrossRef Full Text | Google Scholar
95. Schootman M, Andersen E, Wolinsky F, Malmstrom T, Miller J, Yan Y, et al. The effect of adverse housing and neighborhood conditions on the development of diabetes mellitus among middle-aged African Americans. Am J Epidemiol (2007) 166(4):379–379. doi:10.1093/aje/kwm190
Pubmed Abstract | Pubmed Full Text | CrossRef Full Text | Google Scholar
96. Block J, Scribner R, DeSalvo K. Fast food, race/ethnicity, and income: a geographic analysis. Am J Prev Med (2004) 27(3):211–7. doi:10.1016/S0749-3797(04)00139-4
Pubmed Abstract | Pubmed Full Text | CrossRef Full Text | Google Scholar
97. Powell LM, Chaloupka FJ, Bao Y. The availability of fast food and full-service restaurants in the United States: associations with neighborhood characteristics. Am J Prev Med (2007) 33(Suppl 4):S240–5. doi:10.1016/j.amepre.2007.07.005
Pubmed Abstract | Pubmed Full Text | CrossRef Full Text | Google Scholar
98. Cohen DA, Mason K, Bedimo A, Scribner R, Basolo V, Farley TA. Neighborhood physical conditions and health. Am J Public Health (2003) 93:467–71. doi:10.2105/AJPH.93.3.467
99. Accordino JJ, Gary T. Addressing the abandoned and vacant property problem. J Urban Aff (2000) 22:301–15. doi:10.1111/0735-2166.00058
100. Cohen DA, Spear S, Scribner R, Kissinger P, Mason K, Wildgen J. Broken windows and risk of gonorrhea. Am J Public Health (2000) 90(2):230–6. doi:10.2105/AJPH.90.2.230
Pubmed Abstract | Pubmed Full Text | CrossRef Full Text | Google Scholar
101. Auchincloss AH, Diez Roux AV, Brown DG, Erdmann CA, Bertoni AG. Neighborhood resources for physical activity and healthy foods and their association with insulin resistance. Epidemiology (2008) 19(1):146–57. doi:10.1097/EDE.0b013e31815c480
Pubmed Abstract | Pubmed Full Text | CrossRef Full Text | Google Scholar
102. Moore LV, Diez Roux AV. Associations of neighborhood characteristics with the location and type of food stores. Am J Public Health (2006) 96(2):325–31. doi:10.2105/AJPH.2004.058040
Pubmed Abstract | Pubmed Full Text | CrossRef Full Text | Google Scholar
103. Powell LM, Slater S, Mirtcheva D, Bao Y, Chaloupka FJ. Food store availability and neighborhood characteristics in the United States. Prev Med (2007) 44(3):189–95. doi:10.1016/j.ypmed.2006.08.008
104. Zenk SN, Schulz AJ, Israel BA, James SA, Shuming B, Wilson ML. Neighborhood racial composition, neighborhood poverty, and the spatial accessibility of supermarkets in metropolitan Detroit. Am J Public Health (2005) 95(4):660–7. doi:10.2105/AJPH.2004.042150
Pubmed Abstract | Pubmed Full Text | CrossRef Full Text | Google Scholar
105. Powell LM, Slater S, Chaloupka FJ, Harper D. Availability of physical-activity-related facilities and neighborhood demographic and socioeconomic characteristics: a national study. Am J Public Health (2006) 96:1676–80. doi:10.2105/AJPH.2005.065573
Pubmed Abstract | Pubmed Full Text | CrossRef Full Text | Google Scholar
106. Moore LV, Diez Roux AV, Evenson KR, McGinn AP, Brines SJ. Availability of recreational resources in minority and low socioeconomic status areas. Am J Prev Med (2008) 34(1):16–22. doi:10.1016/j.amepre.2007.09.021
Pubmed Abstract | Pubmed Full Text | CrossRef Full Text | Google Scholar
107. Estabrooks PA, Lee RE, Gyurcsik NC. Resources for physical activity participation: does availability and accessibility differ by neighborhood socioeconomic status? Ann Behav Med (2003) 25:100–4. doi:10.1207/S15324796ABM2502_05
Pubmed Abstract | Pubmed Full Text | CrossRef Full Text | Google Scholar
108. Giles-Corti B, Donovan RJ. Socioeconomic status differences in recreational physical activity levels and real and perceived access to a supportive physical environment. Prev Med (2002) 35:601–11.
109. Fiscella K, Franks P, Gold MR, Clancy CM. Inequality in quality: addressing socioeconomic, racial, and ethnic disparities in health care. JAMA (2000) 283:2579–84. doi:10.1001/jama.283.19.2579
Pubmed Abstract | Pubmed Full Text | CrossRef Full Text | Google Scholar
110. Fiscella K, Williams DR. Health disparities based on socioeconomic inequities: implications for urban health care. Acad Med (2004) 79(12):1139–47. doi:10.1097/00001888-200412000-00004
Pubmed Abstract | Pubmed Full Text | CrossRef Full Text | Google Scholar
111. Cooper RA. Geographic variation in health care and the affluence-poverty nexus. Adv Surg (2011) 45:63–82. doi:10.1016/j.yasu.2011.03.004
Pubmed Abstract | Pubmed Full Text | CrossRef Full Text | Google Scholar
112. Kirby JB, Kaneda T. Neighborhood socioeconomic disadvantage and access to health care. J Health Social Behav (2005) 46:15–31. doi:10.1177/002214650504600103
Pubmed Abstract | Pubmed Full Text | CrossRef Full Text | Google Scholar
113. Moving to Opportunity (MTO) for Fair Housing Demonstration Program. Available from: https://mtoresearch.org
114. Shroder M. Moving to opportunity: an experiment in social and geographic mobility. Cityscape (2001) 5(2):57–67.
115. Shroder M, Orr LL. Moving to Opportunity for Fair Housing Demonstration: Interim Impacts Evaluation. Washington, DC: U.S. Department of Housing & Urban Development (2003).
116. U.S. Department of Housing and Urban Development. Moving to Opportunity for Fair Housing Demonstration Program – Final Impacts Evaluation. Washington, DC: U.S. Department of Housing and Urban Development (2012).
117. Leventhal T, Brooks-Gunn J. Moving to opportunity: an experimental study of neighborhood effects on mental health. Am J Public Health (2003) 93(9):1576–82. doi:10.2105/AJPH.93.9.1576
Pubmed Abstract | Pubmed Full Text | CrossRef Full Text | Google Scholar
118. Fauth RC, Leventhal T, Brooks-Gunn J. Short-term effects of moving from public housing in poor to middle class neighborhoods on low-income, minority adults’ outcomes. Soc Sci Med (2004) 59(11):2271–84. doi:10.1016/j.socscimed.2004.03.020
Pubmed Abstract | Pubmed Full Text | CrossRef Full Text | Google Scholar
119. Fauth RC, Leventhal T, Brooks-Gunn J. Seven years later: effects of a neighborhood mobility program on poor Black and Latino adults’ well-being. J Health Soc Behav (2008) 49:119–30. doi:10.1177/002214650804900201
Pubmed Abstract | Pubmed Full Text | CrossRef Full Text | Google Scholar
120. Zhao Z, Kaestner R, Xu X. Spatial mobility and environmental effects on obesity. Econ Hum Biol (2014) 14:128–40. doi:10.1016/j.ehb.2013.12.001
121. Ludwig J, Duncan GJ, Gennetian LA, Katz LF, Kessler RC, Kling JR, et al. Neighborhood effects on the long-term well-being of low-income adults. Science (2012) 337(6101):1605–1510. doi:10.1126/science.1224648
Pubmed Abstract | Pubmed Full Text | CrossRef Full Text | Google Scholar
122. Ludwig J, Sanbonmatsu L, Gennetian L, Adam E, Duncan GJ, Katz LF, et al. Neighborhoods, obesity, and diabetes – a randomized social experiment. N Engl J Med (2011) 365(16):1509–19. doi:10.1056/NEJMsa1103216
Pubmed Abstract | Pubmed Full Text | CrossRef Full Text | Google Scholar
123. Clampet-Lundquist S, Massey DS. Neighborhood effects on economic self-sufficiency: a reconsideration of the moving to opportunity experiment. Am J Sociol (2008) 114(1):107–43. doi:10.1086/588740
124. Sampson RJ. Moving to inequality: neighborhood effects and experiments meet social structure. Am J Sociol (2008) 114(1):189–231. doi:10.1086/589843
Pubmed Abstract | Pubmed Full Text | CrossRef Full Text | Google Scholar
125. Joint Center for Political & Economic Studies. Place Matters. Washington, DC: Joint Center for Political & Economic Studies (0000). www.jointcenter.org
126. Williams DR, Collins C. Racial residential segregation: a fundamental cause of racial disparities in health. Public Health Rep (2001) 116(5):404–16. doi:10.1016/S0033-3549(04)50068-7
Pubmed Abstract | Pubmed Full Text | CrossRef Full Text | Google Scholar
127. LaVeist T, Gaskin D, Trujillo A. Separate Spaces, Risky Places: The Effects of Racial Segregation on Health Inequalities. Washington, DC: Joint Center for Political and Economic Studies (2011).
128. Acevedo-Garcia D, Osypuk TL, McArdle N, Williams DR. Toward a policy-relevant analysis of geographic and racial-ethnic disparities in child health. Health Aff (Millwood) (2008) 27(2):321–33. doi:10.1377/hlthaff.27.2.321
Pubmed Abstract | Pubmed Full Text | CrossRef Full Text | Google Scholar
129. Landrine H, Corral I, Hao Y, Kaw C, King J, Fondren J. Cancer geography: the role of neighborhoods in cancer and cancer disparities. In: Elk R, Landrine H, editors. Cancer Disparities. New York, NY: Springer (2012). p. 141–66.
130. Iceland J, Weinberg DH, Steinmetz E. Racial and Ethnic Segregation in the United States, 1980-2000. Washington, DC: U.S. Government Printing Office, U.S. Census Bureau (2002).
131. Johnston R, Poulsen M, Forrest J. Ethnic and racial segregation in U.S. metropolitan areas, 1980-2000. Urban Aff Rev Thousand Oaks Calif (2007) 42(4):479–504. doi:10.1177/1078087406292701
132. Massey DS, Denton NA. American Apartheid: Segregation and the Making of the Underclass. Cambridge, MA: Harvard University Press (1993).
133. Massey DS, White MJ, Phua VC. The dimensions of segregation revisited. Sociol Methods Res (1996) 25:172–206. doi:10.1177/0049124196025002002
134. Acevedo-Garcia D, Lochner K, Osypuk T, Subramanian SV. Future directions in residential segregation and health research. Am J Public Health (2003) 93:215–20. doi:10.2105/AJPH.93.2.215
135. Brown LA, Chung SY. Spatial segregation, segregation indices and the geographical perspective. Popul Space Place (2006) 12(2):125–43. doi:10.1002/psp.403
136. Kramer MR, Cooper HL, Drews-Botsch CD, Waller LA, Hogue CR. Do measures matter? Comparing surface-density-derived and census-tract-derived measures of racial residential segregation. Int J Health Geogr (2010) 3:3–21. doi:10.1186/1476-072X-9-29
Pubmed Abstract | Pubmed Full Text | CrossRef Full Text | Google Scholar
137. Wilkes R, Iceland J. Hypersegregation in the 21st century. Demography (2004) 41:23–36. doi:10.1353/dem.2004.0009
Pubmed Abstract | Pubmed Full Text | CrossRef Full Text | Google Scholar
138. Chang VW, Hillier AE, Mehta NK. Neighborhood racial isolation, disorder and obesity. Soc Forces (2009) 87:2063–92. doi:10.1353/sof.0.0188
Pubmed Abstract | Pubmed Full Text | CrossRef Full Text | Google Scholar
139. Kramer MR, Hogue CR. Is segregation bad for your health? Epidemiol Rev (2009) 31:178–94. doi:10.1093/epirev/mxp001
Pubmed Abstract | Pubmed Full Text | CrossRef Full Text | Google Scholar
140. Wahl A, Breckenridge R, Gunkel S. Latinos, residential segregation and spatial assimilation in micropolitan areas. Soc Sci Res (2007) 36(3):995–1020. doi:10.1016/j.ssresearch.2006.07.004
141. Osypuk TL, Acevedo-Garcia D. Are racial disparities in preterm birth larger in hypersegregated areas? Am J Epidemiol (2008) 167(11):1295–304. doi:10.1093/aje/kwn043
Pubmed Abstract | Pubmed Full Text | CrossRef Full Text | Google Scholar
142. Krysan M, Farley R. The residential preferences of Blacks: do they explain persistent segregation? Soc Forces (2002) 80:937–80. doi:10.1353/sof.2002.0011
143. Dawkins CJ. Recent evidence on the continuing causes of Black-White residential segregation. J Urban Aff (2004) 26:379–400. doi:10.1111/j.0735-2166.2004.00205.x
144. Charles CZ. Processes of racial residential segregation. In: O’Connor A, Tilly C, Bobo LD, editors. Urban Inequality. New York, NY: Russell Sage Foundation (2001). p. 217–71.
145. Grant-Meyer S. As Long as they Don’t Move Next Door: Segregation and Racial Conflict in American Neighborhoods. Lanham, MD: Rowman & Littlefield (2000).
146. Logan JR, Alba RD. Does race matter less for the truly advantaged? In: Durr M, editor. New Politics of Race. Westport, CT: Greenwood Publishing (2002). p. 71–88.
147. Adelman RM. Neighborhood opportunities, race, and class: the Black middle-class and residential segregation. City Community (2004) 3:43–63. doi:10.1111/j.1535-6841.2004.00066.x
148. Alba RD, Logan JR, Stults BJ. How segregated are middle-class African Americans? Soc Probl (2000) 47:43–58. doi:10.1525/sp.2000.47.4.03x0307u
149. Farley JE. Race not class: explaining racial housing segregation in the St. Louis metropolitan area. Soc Forces (2005) 38:133–50.
150. Jackson SA, Anderson RT, Johnson NJ, Sorlie PD. The relation of residential segregation to all-cause mortality. Am J Public Health (2000) 90(4):615–7.
151. Nuru-Jeter AM, LaVeist TA. Racial segregation, income inequality, and mortality in US metropolitan area. J Urban Health (2011) 88(2):270–82. doi:10.1007/s11524-010-9524-7
Pubmed Abstract | Pubmed Full Text | CrossRef Full Text | Google Scholar
152. Acevedo-Garcia D. Residential segregation and the epidemiology of infectious diseases. Soc Sci Med (2000) 51:1143–61. doi:10.1016/S0277-9536(00)00016-2
Pubmed Abstract | Pubmed Full Text | CrossRef Full Text | Google Scholar
153. Bell JF, Zimmerman FJ, Almgren GR, Mayer JD, Huebner CE. Birth outcomes among urban African American women: a multilevel analysis of the role of racial residential segregation. Soc Sci Med (2006) 63:3030–45. doi:10.1016/j.socscimed.2006.08.011
Pubmed Abstract | Pubmed Full Text | CrossRef Full Text | Google Scholar
154. Grady SC. Racial disparities in low birthweight and the contribution of residential segregation. Soc Sci Med (2006) 63:3013–29. doi:10.1016/j.socscimed.2006.08.017
Pubmed Abstract | Pubmed Full Text | CrossRef Full Text | Google Scholar
155. Britton ML, Shin H. Metropolitan residential segregation and very preterm birth among African American and Mexican-origin women. Soc Sci Med (2013) 98:37–45. doi:10.1016/j.socscimed.2013.08.039
Pubmed Abstract | Pubmed Full Text | CrossRef Full Text | Google Scholar
156. Chang VW. Racial segregation and weight status among US adults. Soc Sci Med (2006) 63(5):1289–303. doi:10.1016/j.socscimed.2006.03.049
Pubmed Abstract | Pubmed Full Text | CrossRef Full Text | Google Scholar
157. Corral I, Landrine H, Zhao L, Hao Y, Mellerson J, Cooper D. Residential segregation, health behavior, and overweight/obesity among a national sample of Black adults. J Health Psychol (2012) 17:371–8. doi:10.1177/1359105311417191
Pubmed Abstract | Pubmed Full Text | CrossRef Full Text | Google Scholar
158. Kershaw KN, Albreach SS, Carnethon MR. Racial and ethnic residential segregation, the neighborhood socioeconomic environment, and obesity among Blacks and Mexican Americans. Am J Epidemiol (2013) 177(4):299–309. doi:10.1093/aje/kws372
Pubmed Abstract | Pubmed Full Text | CrossRef Full Text | Google Scholar
159. Boardman JD, Saint Onge JM, Rogers RG, Denney JT. Race differentials in obesity: the impact of place. J Health Soc Behav (2005) 46(3):229–43. doi:10.1177/002214650504600302
Pubmed Abstract | Pubmed Full Text | CrossRef Full Text | Google Scholar
160. Greer S, Kramer MR, Cook-Smith JN, Casper ML. Metropolitan racial residential segregation and cardiovascular mortality. J Urban Health (2014) 91(3):499–509. doi:10.1007/s11524-013-9834-7
Pubmed Abstract | Pubmed Full Text | CrossRef Full Text | Google Scholar
161. Cooper RS. Social inequality, ethnicity and cardiovascular disease. Int J Epidemiol (2001) 30(Suppl 1):s48–52. doi:10.1093/ije/30.suppl_1.S48
Pubmed Abstract | Pubmed Full Text | CrossRef Full Text | Google Scholar
162. Gupta RS, Zhang X, Sharp LK, Shannon JJ, Weiss KB. Geographic variability in childhood asthma prevalence in Chicago. J Allergy Clin Immunol (2008) 121(3):639–45. doi:10.1016/j.jaci.2007.11.036
Pubmed Abstract | Pubmed Full Text | CrossRef Full Text | Google Scholar
163. Wright RJ, Subramanian SV. Advancing a multilevel framework for epidemiologic research on asthma disparities. Chest (2007) 132(Suppl 5):757S–69S. doi:10.1378/chest.07-1904
Pubmed Abstract | Pubmed Full Text | CrossRef Full Text | Google Scholar
164. Jones A. Segregation and cardiovascular illness. Health Place (2013) 22:56–67. doi:10.1016/j.healthplace.2013.02.009
165. Kershaw KN, Diez Roux AV, Burgard SA, Lisabeth LD, Mujahid MS, Schulz AJ. Metropolitan-level racial residential segregation and Black-White disparities in hypertension. Am J Epidemiol (2011) 174(5):537–45. doi:10.1093/aje/kwr116
Pubmed Abstract | Pubmed Full Text | CrossRef Full Text | Google Scholar
166. Hayanga AJ, Zeliadt SB, Backlus LM. Residential segregation and lung cancer mortality in the United States. JAMA Surg (2013) 48(1):37–42. doi:10.1001/jamasurgery.2013.408
Pubmed Abstract | Pubmed Full Text | CrossRef Full Text | Google Scholar
167. Russell EF, Kramer MR, Cooper HL, Gabram-Mendola S, Senior-Crosby D, Jacob Arriola KR. Metropolitan area racial residential segregation, neighborhood racial composition, and breast cancer mortality. Cancer Causes Control (2012) 23(9):1519–27. doi:10.1007/s10552-012-0029-4
Pubmed Abstract | Pubmed Full Text | CrossRef Full Text | Google Scholar
168. Morello-Frosch RA, Woodruff TJ, Axelrad DA, Caldwell JC. Air toxics and health risks in California: the public health implications of outdoor concentrations. Risk Anal (2000) 20:273–91. doi:10.1111/0272-4332.202026
Pubmed Abstract | Pubmed Full Text | CrossRef Full Text | Google Scholar
169. Rice LJ, Jiang C, Wilson SM, Burwell-Naney K, Samantapudi A, Zhang H. Use of segregation indices, Townsend index, and air toxics data to assess lifetime cancer risk disparities in metropolitan Charleston, South Carolina, USA. Int J Enviorn Res Public Health (2014) 11:5510–26. doi:10.3390/ijerph110505510
Pubmed Abstract | Pubmed Full Text | CrossRef Full Text | Google Scholar
170. Subramanian SV, Acevedo-Garcia D, Osypuk TL. Racial residential segregation and geographic heterogeneity in Black/White disparity in poor self-rated health in the US: a multilevel statistical analysis. Soc Sci Med (2005) 60:1667–79. doi:10.1016/j.socscimed.2004.08.040
Pubmed Abstract | Pubmed Full Text | CrossRef Full Text | Google Scholar
171. Cooper H, Friedman S, Tempalski B, Friedman R. Residential segregation and injection drug use prevalence among Black adults in US metropolitan areas. Am J Public Health (2007) 97(2):344–52. doi:10.2105/AJPH.2005.074542
Pubmed Abstract | Pubmed Full Text | CrossRef Full Text | Google Scholar
172. Lopez R. Black-White residential segregation and physical activity. Ethn Dis (2006) 16:495–502.
173. Acevedo-Garcia D, Lochner K. Residential segregation and health. In: Kawachi I, Berkman L, editors. Neighborhoods and Health. New York, NY: Oxford University Press (2003). p. 265–87.
174. Lopez R. Segregation and Black-White differences in exposure to air toxics in 1990. Environ Health Perspect (2002) 110(Suppl 2):289–95. doi:10.1289/ehp.02110s2289
Pubmed Abstract | Pubmed Full Text | CrossRef Full Text | Google Scholar
175. Bower KM, Thorpe JR Jr, Rohde C, Gaskin DJ. The intersection of neighborhood racial segregation, poverty, urbanicity and its impact on food store availability in the United States. Prev Med (2014) 58:33–9. doi:10.1016/j.ypmed.2013.10.010
Pubmed Abstract | Pubmed Full Text | CrossRef Full Text | Google Scholar
176. Walker RE, Keane CR, Burke JG. Disparities and access to health food in the United States: a review of food deserts literature. Health Place (2010) 16:876–84. doi:10.1016/j.healthplace.2010.04.013
Pubmed Abstract | Pubmed Full Text | CrossRef Full Text | Google Scholar
177. Morland K, Wing S, Diez-Roux A, Poole C. Neighborhood characteristics associated with the location of food stores and food service places. Am J Prev Med (2002) 22:23–9. doi:10.1016/S0749-3797(01)00403-2
Pubmed Abstract | Pubmed Full Text | CrossRef Full Text | Google Scholar
178. Morland K, Filomena S. Disparities in the availability of fruits and vegetables between racially segregated urban neighborhoods. Public Health Nutr (2007) 21:1–9.
179. Rosenbaum E. Racial/ethnic differences in asthma prevalence: the role of housing and neighborhood environments. J Health Soc Behav (2008) 49:131–45. doi:10.1177/002214650804900202
Pubmed Abstract | Pubmed Full Text | CrossRef Full Text | Google Scholar
180. Massey DS. Residential segregation and neighborhood conditions in U.S. metropolitan areas. In: Smelser NJ, Wilson WJ, Mitchell F, editors. America Becoming: Racial Trends and Their Consequences. Washington, DC: National Academy Press (2001). p. 391–434.
181. Burdette HL, Whitaker RC. Neighborhood playgrounds, fast food restaurants, and crime: relationships to overweight in low-income preschool children. Prev Med (2004) 38:57–63. doi:10.1016/j.ypmed.2003.09.029
Pubmed Abstract | Pubmed Full Text | CrossRef Full Text | Google Scholar
182. Kwate NO. Fried chicken and fresh apples: racial segregation as a fundamental cause of fast food density in Black neighborhoods. Health Place (2008) 14(1):32–44. doi:10.1016/j.healthplace.2007.04.001
Pubmed Abstract | Pubmed Full Text | CrossRef Full Text | Google Scholar
183. White K, Haas JS, Williams DR. Elucidating the role of place in health care disparities: the example of racial-ethnic residential segregation. Health Serv Res (2012) 47(3Part2):1278–99. doi:10.1111/j.1475-6773.2012.01410.x
Pubmed Abstract | Pubmed Full Text | CrossRef Full Text | Google Scholar
184. Hayanga AJ, Kaiser HE, Sinha R, Berenholtz SM, Makary M, Chang D. Residential segregation and access to surgical care by minority populations in US counties. J Am Coll Surg (2009) 208(6):1017–22. doi:10.1016/j.jamcollsurg.2009.01.047
Pubmed Abstract | Pubmed Full Text | CrossRef Full Text | Google Scholar
185. Hayanga AJ, Waljee AK, Kaiser HE, Chang DC, Morris AM. Racial clustering and access to colorectal surgeons, gastroenterologists, and radiation oncologists by African Americans and Asian Americans in the United States: a county-level data analysis. Arch Surg (2009) 144(6):532–5. doi:10.1001/archsurg.2009.68
Pubmed Abstract | Pubmed Full Text | CrossRef Full Text | Google Scholar
186. Smedley BD, Stith AY, Nelson AR. Unequal Treatment: Confronting Racial and Ethnic Disparities in Health Care. Washington, DC: National Academies Press, Institute of Medicine (2003).
187. Hao Y, Landrine H, Smith T, Kaw C, Corral I, Stein K. Residential segregation and disparities in health-related quality of life among Black and White cancer survivors. Health Psychol (2011) 30(2):137–44. doi:10.1037/a0022096
Pubmed Abstract | Pubmed Full Text | CrossRef Full Text | Google Scholar
188. Corral I, Landrine H, Zhao L. Residential segregation and obesity among a national sample of Hispanic adults. J Health Psychol (2014) 19(4):503–8. doi:10.1177/1359105312474912
Pubmed Abstract | Pubmed Full Text | CrossRef Full Text | Google Scholar
189. Mellerson J, Landrine H, Hao Y, Zhao L, Corral I, Cooper D. Residential segregation and physical activity among a national sample of Hispanic adults. Health Place (2010) 16:613–5. doi:10.1016/j.healthplace.2009.12.013
Pubmed Abstract | Pubmed Full Text | CrossRef Full Text | Google Scholar
190. Lee M, Ferraro KF. Neighborhood residential segregation and physical health among Hispanic Americans: good, bad, or benign? J Health Soc Behav (2007) 48:131–48. doi:10.1177/002214650704800203
Pubmed Abstract | Pubmed Full Text | CrossRef Full Text | Google Scholar
191. White K, Borrell LN. Racial/ethnic residential segregation: framing the context of health risk and health disparities. Health Place (2011) 17(2):438–48. doi:10.1016/j.healthplace.2010.12.002
Pubmed Abstract | Pubmed Full Text | CrossRef Full Text | Google Scholar
192. Iceland J, Scopilliti M. Immigrant residential segregation in US metropolitan areas, 1990-2000. Demography (2008) 45(1):79–94. doi:10.1353/dem.2008.0009
Pubmed Abstract | Pubmed Full Text | CrossRef Full Text | Google Scholar
193. Massey DS, Fong E. Segregation and neighborhood quality: Blacks, Hispanics, and Asians in the San Francisco metropolitan area. Soc Forces (1990) 69:15–32. doi:10.1093/sf/69.1.15
194. Massey DS. Segregation and stratification: a biosocial perspective. Du Bois Rev (2004) 1:7–25. doi:10.1017/S1742058X04040032
195. Morello-Frosch R, Lopez R. The riskscape and the color line: examining the role of segregation in environmental health disparities. Environ Res (2006) 102:181–96. doi:10.1016/j.envres.2006.05.007
Pubmed Abstract | Pubmed Full Text | CrossRef Full Text | Google Scholar
196. Morello-Frosch R, Shenassa ED. The environmental ‘riskscape’ and social inequality: implications for explaining maternal and child health disparities. Environ Health Perspect (2006) 114:1150–3. doi:10.1289/ehp.8930
Pubmed Abstract | Pubmed Full Text | CrossRef Full Text | Google Scholar
197. Boehnke K, Lietz P, Schreier M, Wilhelm A. Sampling: the selection of cases for culturally comparative psychological research. In: Matsumoto D, Van de Vijver FJR, editors. Cross-Cultural Research Methods in Psychology. New York, NY: Cambridge University Press (2011). p. 101–29.
198. He J, van de Vijver FJR. Bias and equivalence in cross-cultural research. Online Read Psychol Cult (2012). doi:10.9707/2307-0919.1111
199. Harkness JA, van de Vijver FJR, Mohler PP. Cross-Cultural Survey Methods. Hoboken, NJ: John Wiley & Sons (2003).
200. van de Vijver FJR, Leung K. Methodological issues in psychological research on culture. J Cross Cult Psychol (2000) 31:33–51. doi:10.1177/0022022100031001004
201. van de Vijver FJR, Leung K. Methods and Data Analysis of Cross-Cultural Research. Thousand Oaks, CA: Sage (1997).
202. Link MW, Mokdad AH, Stackhouse HF, Flowers NT. Race, ethnicity, and linguistic isolation as determinants of participation in public health surveillance surveys. Prev Chronic Dis (2006) 3(1):1–12.
203. Lee S, Nguyen HA, Jawad M, Kurata J. Linguistic minorities in a health survey. Public Opin Q (2008) 72:470–86. doi:10.1093/poq/nfn036
204. Frayne SM, Burns RB, Hardt EJ, Rosen AK, Moskowitz MA. The exclusion of non-English speaking persons from research. J Gen Intern Med (1996) 11:39–43. doi:10.1007/BF02603484
205. Corral I, Landrine H. Acculturation and ethnic-minority health behavior. Health Psychol (2008) 27(6):737–45. doi:10.1037/0278-6133.27.6.737
Pubmed Abstract | Pubmed Full Text | CrossRef Full Text | Google Scholar
206. Jacobs DH, Tovar JM, Hung OL, Kim M, Ye P, Chiang WK, et al. Behavioral risk factor and preventive health care practice survey of immigrants in the emergency department. Acad Emerg Med (2002) 9(6):599–608. doi:10.1111/j.1553-2712.2002.tb02297.x
Pubmed Abstract | Pubmed Full Text | CrossRef Full Text | Google Scholar
207. Yu SM, Nyman RM, Kogan MD, Huang ZJ, Schwalberg RH. Parent’s language of interview and access to care for children with special health care needs. Ambul Pediatr (2004) 4:181–7. doi:10.1367/A03-094R.1
Pubmed Abstract | Pubmed Full Text | CrossRef Full Text | Google Scholar
208. Fiscella K, Franks P, Doescher MP, Saver BG. Disparity in health care by race, ethnicity, and language among the insured. Med Care (2002) 40:52–9. doi:10.1097/00005650-200201000-00007
Pubmed Abstract | Pubmed Full Text | CrossRef Full Text | Google Scholar
209. Killien M, Bigby JA, Champion V, Fernandez-Repollet E, Jackson RD, Kagawa-Singer M, et al. Involving minority and under-represented women in clinical trials. J Womens Health Gend Based Med (2000) 9:1061–70. doi:10.1089/152460900445974
Pubmed Abstract | Pubmed Full Text | CrossRef Full Text | Google Scholar
210. Available from: http://grants.nih.gov/grants/funding/women_min/guidelines_amended_10_2001.htm
211. Anda RF, Dodson DL, Williamson DF, Remington PL. Health promotion data for state health departments: telephone vs. in-person survey estimates of smoking and alcohol use. Am J Health Promot (1989) 4:32–6. doi:10.4278/0890-1171-4.1.32
Pubmed Abstract | Pubmed Full Text | CrossRef Full Text | Google Scholar
212. Thornberry OT, Massey JT. Trends in United States telephone coverage across time and subgroups. In: Groves RM, Biemer PP, Lyberg LE, Massey JT, Nicholls WL, Waksberg J, editors. Telephone Survey Methodology. New York, NY: Wiley (1988). p. 25–49.
213. Ford ES. Characteristics of survey participants with and without a telephone: findings from the third national health and nutrition examination survey. J Clin Epidemiol (1998) 51(1):55–60. doi:10.1016/S0895-4356(97)00225-4
Pubmed Abstract | Pubmed Full Text | CrossRef Full Text | Google Scholar
214. Mishra S, Dooley D, Catalano R, Serxner S. Telephone health surveys: potential bias from non-completion. Am J Public Health (1993) 83:94–9. doi:10.2105/AJPH.83.1.94
Pubmed Abstract | Pubmed Full Text | CrossRef Full Text | Google Scholar
215. Anderson JE, Nelson DE, Wilson RW. Telephone coverage and measurement of health risk indicators: data from the national health interview survey. Am J Public Health (1998) 88:1392–5. doi:10.2105/AJPH.88.9.1392
Pubmed Abstract | Pubmed Full Text | CrossRef Full Text | Google Scholar
216. U.S. Bureau of the Census. Statistical Brief: Phoneless in America. Washington, DC: Department of Commerce, Economics and Statistics Administration (1994).
217. Blumberg SJ, Luke JV. Coverage bias in traditional telephone surveys of low-income and young adults. Public Opin Q (2007) 71(5):734–49. doi:10.1093/poq/nfm047
218. Blumberg SJ, Luke JV, Cynamon ML. Telephone coverage and health survey estimates: evaluating the need for concern about wireless substitution. Am J Public Health (2006) 96:926–31. doi:10.2105/AJPH.2004.057885
Pubmed Abstract | Pubmed Full Text | CrossRef Full Text | Google Scholar
219. Keeter S, Kennedy C, Clark A, Tompson T, Mokrzycki M. What’s missing from national landline RDD surveys? The impact of the growing cell-only population. Public Opin Q (2007) 71(5):772–92. doi:10.1093/poq/nfm053
220. Kempf AM, Remington PL. New challenges for telephone survey research in the 21st century. Annu Rev Public Health (2007) 28:113–26. doi:10.1146/annurev.publhealth.28.021406.144059
Pubmed Abstract | Pubmed Full Text | CrossRef Full Text | Google Scholar
221. Blumberg SJ, Luke JV. Wireless Substitution: Early Release Estimates from the National Health Interview Survey. National Center for Health Statistics (102). Available from: http://www.cdc.gov/nchs/nhis.htm
222. Landrine H, Corral I, Simms D, Roesch S, Pichon L, Ake D, et al. Telephone surveys underestimate cigarette smoking African Americans. Front Epidemiol (2013) 1:36. doi:10.3389/fpubh.2013.00036
Pubmed Abstract | Pubmed Full Text | CrossRef Full Text | Google Scholar
223. Liao Y, Tucker P, Okoro CA, Giles WH, Mokdad AH, Harris VB. REACH 2010 surveillance for health status in minority communities – United States, 2001-2002. MMWR Surveill Summ (2004) 53(6):1–36.
224. Centers for Disease Control. Methodologic changes in the behavioral risk factor surveillance system in 2011 and potential effects on prevalence estimates. MMWR Morb Mortal Wkly Rep (2012) 61:410–3.
225. Gregorich SE. Do self-report instruments allow meaningful comparisons across diverse population groups? Med Care (2006) 44(11 Suppl 3):s78–94. doi:10.1097/01.mlr.0000245454.12228.8f
Pubmed Abstract | Pubmed Full Text | CrossRef Full Text | Google Scholar
226. Heine SJ, Lehman DR, Peng K, Greenholtz J. What’s wrong with cross-cultural comparisons of subjective Likert scales? J Pers Soc Psychol (2002) 82:903–13. doi:10.1037/0022-3514.82.6.903
Pubmed Abstract | Pubmed Full Text | CrossRef Full Text | Google Scholar
227. Schwarz N. Self reports: how the questions shape the answers. Am Psychol (1999) 54(2):93–105. doi:10.1037/0003-066X.54.2.93
228. Schwarz N. Frequency reports of physical symptoms and health behaviors: how the questionnaire determines the results. In: Park DC, Morrell R, Shifren K, editors. Processing Medical Information in Aging Patients. Mahwah, NJ: Erlbaum (1999). p. 93–108.
229. Sudman S, Bradburn N, Schwarz N. Thinking About Answers: The Application of Cognitive Processes to Survey Methodology. San Francisco, CA: Jossey-Bass (1996).
230. Rothman AJ, Haddock G, Schwarz N. How many partners is too many? Shaping perceptions of personal vulnerability. J Appl Soc Psychol (2001) 31:2195–214. doi:10.1111/j.1559-1816.2001.tb00171.x
231. Karabenick SA, Woolley ME, Friedel JM, Ammon BV, Blazevski J, Bonney CR, et al. Cognitive processing of self-report items in educational research: do they think what we mean? Educ Psychol (2007) 42(3):139–51. doi:10.1080/00461520701416231
232. Tourangeau R. Cognitive aspects of survey measurement and mismeasurement. Int J Public Opin Res (2003) 15:3–7. doi:10.1093/ijpor/15.1.3
233. Tourangeau R, Rips LJ, Rasinski KA. The Psychology of Survey Response. Cambridge: Cambridge University Press (2000).
234. Schwarz N. Self-reports in consumer research: the challenge of comparing cohorts and cultures. J Consum Res (2003) 29:588–94. doi:10.1086/346253
235. Chang L. A psychometric evaluation of 4-point and 6-point Likert-type scales in relation to reliability and validity. Appl Psychol Meas (1994) 18(3):205–15.
236. Davis RE, Resnico K, Couper MP. Survey response styles, acculturation, and culture among a sample of Mexican American adults. J Cross Cult Psychol (2011) 42(7):1219–36. doi:10.1177/0022022110383317
Pubmed Abstract | Pubmed Full Text | CrossRef Full Text | Google Scholar
237. Johnson T, O’Rourke D, Chavez N, Sudman S, Warnecke R, Lacey L, et al. Social cognition and responses to survey questions among culturally diverse populations. In: Lyberg L, Biemer P, Collins P, et al., editors. Survey Measurement and Process Quality. New York, NY: Wiley (1997). p. 87–113.
238. Baumgartner H, Steenkamp JB. Response styles in marketing research: a cross-national investigation. J Market Res (2001) 38:143–56. doi:10.1509/jmkr.38.2.143.18840
239. Coon HM, Kemmelmeier M. Cultural orientations in the United States: (Re) examining differences among ethnic groups. J Cross Cult Psychol (2001) 32:348–64. doi:10.1177/0022022101032003006
240. van Herk H, Poortinga YH, Verhallen TM. Response styles in rating scales: evidence of method bias in data from six EU countries. J Cross Cult Psychol (2004) 35:346–60. doi:10.1177/0022022104264126
241. Arce-Ferrer AJ. An investigation into the factors influencing extreme response style. Educ Psychol Meas (2006) 66(3):374–92. doi:10.1177/0013164405278575
242. Johnson T, Kulesa P, Cho YI, Shavitt S. The relation between culture and response styles: evidence from 19 countries. J Cross Cult Psychol (2005) 36:264–77. doi:10.1177/0022022104272905
243. Smith PB. Acquiescent response bias as an aspect of cultural communication style. J Cross Cult Psychol (2004) 35:50–61. doi:10.1177/0022022103260380
244. Cheung GW, Rensvold RB. Assessing extreme and acquiescence response sets in cross-cultural research using structural equation modeling. J Cross Cult Psychol (2000) 31:187–212. doi:10.1177/0022022100031002003
246. Hofstede GH, Bond M. Hofstede’s cultural dimensions. J Cross Cult Psychol (1984) 15:417–33. doi:10.1177/0022002184015004003
248. Schwartz SH. Value Orientations: Measurement, Antecedents and Consequences Across Nations. London: Sage (2007).
249. Smith PB, Fischer R. Acquiescence, extreme response bias and culture: a multilevel analysis. In: van de Vijver DA, van Hemert YH, Poortinga YH editors. Multilevel Analysis of Individuals and Cultures. New York, NY: Taylor & Francis Group (2008). p. 285–314.
250. Harzing AW. Response styles in cross-national survey research: a 26-country study. Int J Cross Cult Manag (2006) 6:243–66. doi:10.1177/1470595806066332
251. Smith T. Developing comparable questions in cross-national surveys. In: Harkness JA, van de Vijver FJR, Mohler PP, editors. Cross Cultural Survey Methods. New York, NY: Wiley (2003). p. 69–92.
252. van de Vijver FJR, Tanzer NK. Bias and equivalence in cross-cultural assessment: an overview. Eur Rev Appl Psychol (2004) 54:119–35. doi:10.1016/j.erap.2003.12.004
253. Weijters B, Cabooter E, Schillewaert N. The effect of rating scale format on response styles: the number of response categories and response category labels. Int J Res Market (2010) 27:236–47. doi:10.1016/j.ijresmar.2010.02.004
254. Fischer R. Standardization to account for cross-cultural response bias. J Cross Cult Psychol (2004) 35:263–82. doi:10.1177/0022022104264122
Pubmed Abstract | Pubmed Full Text | CrossRef Full Text | Google Scholar
255. Hanges P. Response bias correction procedure used in GLOBE. In: House RJ, Hanges PI, Javidan M, Dorfman PJ, editors. Culture, Leadership, and Organizations: The GLOBE Study of 62 Cultures. Thousand Oaks, CA: Sage Publications (2004). p. 737–52.
256. Greenleaf EA. Improving rating scale measures by detecting and correcting bias components in response styles. J Market Res (1992) 29:176–88. doi:10.2307/3172568
257. Greenleaf EA. Measuring extreme response style. Public Opin Q (1992) 56:328–51. doi:10.1158/1055-9965.EPI-08-0241
Pubmed Abstract | Pubmed Full Text | CrossRef Full Text | Google Scholar
258. Lee S, Grant D. The effect of question order on self-rated general health status in a multilingual survey context. Am J Epidemiol (2009) 169(12):1525–30. doi:10.1093/aje/kwp070
Pubmed Abstract | Pubmed Full Text | CrossRef Full Text | Google Scholar
259. Kandula NR, Lauderdale DS, Baker DW. Differences in self-reported health among Asians, Latinos, and non-Hispanic Whites: the role of language and nativity. Ann Epidemiol (2007) 17(3):191–208. doi:10.1016/j.annepidem.2006.10.005
Pubmed Abstract | Pubmed Full Text | CrossRef Full Text | Google Scholar
260. Idler EL, Angel RJ. Self-rated health and mortality in the NHANES-I epidemiologic follow-up study. Am J Public Health (1990) 80:446–52. doi:10.2105/AJPH.80.4.446
Pubmed Abstract | Pubmed Full Text | CrossRef Full Text | Google Scholar
261. Jylhä M. What is self-rated health and why does it predict mortality? Towards a unified conceptual model. Soc Sci Med (2009) 69:307–16. doi:10.1016/j.socscimed.2009.05.013
262. Regidor E, Guallar-Castillón P, Gutiérrez-Fisac JL, Banegas JR, Rodríguez-Artalejo F. Socioeconomic variation in the magnitude of the association between self-rated health and mortality. Ann Epidemiol (2010) 20:395–400. doi:10.1016/j.annepidem.2010.01.007
Pubmed Abstract | Pubmed Full Text | CrossRef Full Text | Google Scholar
263. Zheng H, Thomas PA. Marital status, self-rated health, and mortality: overestimation of health or diminishing protection of marriage? J Health Soc Behav (2013) 54(1):128–43. doi:10.1177/0022146512470564
Pubmed Abstract | Pubmed Full Text | CrossRef Full Text | Google Scholar
264. Huisman M, van Lenthe F, Mackenbach JP. The predictive ability of self-assessed health for mortality in different educational groups. Int J Epidemiol (2007) 36:1207–13. doi:10.1093/ije/dym095
Pubmed Abstract | Pubmed Full Text | CrossRef Full Text | Google Scholar
265. Jylhä M, Guralnik JM, Ferrucci L, Jokela J, Heikkinen E. Is self-rated health comparable across cultures and genders? J Gerontol B Psychol Sci Soc Sci (1998) 53B:S144–52.
266. White K, Borrel LN. Racial/ethnic neighborhood concentration and self-reported health in New York City. Ethn Dis (2006) 16(4):900–8.
267. Su D, Wen M, Makides KS. Is self-rated health comparable between non-Hispanic Whites and Hispanics? J Gerontol B Psychol Sci Soc Sci (2013) 68(4):622–32. doi:10.1093/geronb/gbt037
Pubmed Abstract | Pubmed Full Text | CrossRef Full Text | Google Scholar
268. Seo S, Chung S, Shumway M. How good is ‘very good’? Translation effect in the racial/ethnic variation in self-rated health status. Qual Life Res (2014) 23(2):593–600. doi:10.1007/s11136-013-0522-6
Pubmed Abstract | Pubmed Full Text | CrossRef Full Text | Google Scholar
269. Borrell LN, Dallo FJ. Self-rated health and race among Hispanic and non-Hispanic adults. J Immigr Minor Health (2008) 10(3):229–38. doi:10.1007/s10903-007-9074-6
Pubmed Abstract | Pubmed Full Text | CrossRef Full Text | Google Scholar
270. Acevedo-Garcia D, Bates LM, Osypuk TL, McArdle N. The effect of immigrant generation and duration on self-rated health among US adults 2003-2007. Soc Sci Med (2010) 71(6):1161–72. doi:10.1016/j.socscimed.2010.05.034
Pubmed Abstract | Pubmed Full Text | CrossRef Full Text | Google Scholar
271. Bzostek S, Goldman N, Pebley A. Why do Hispanics in the USA report poor health? Soc Sci Med (2007) 65(5):990–1003. doi:10.1016/j.socscimed.2007.04.028
Pubmed Abstract | Pubmed Full Text | CrossRef Full Text | Google Scholar
272. Huh J, Prause JA, Dooley CD. The impact of nativity on chronic diseases, self-rated health and comorbidity status of Asian and Hispanic immigrants. J Immigr Minor Health (2008) 10(2):103–18. doi:10.1007/s10903-007-9065-7
Pubmed Abstract | Pubmed Full Text | CrossRef Full Text | Google Scholar
273. Jerant A, Arellanes R, Franks P. Health status among US Hispanics: ethnic variation, nativity, and language moderation. Med Care (2008) 46(7):709–17. doi:10.1097/MLR.0b013e3181789431
Pubmed Abstract | Pubmed Full Text | CrossRef Full Text | Google Scholar
274. Johnson KL, Carroll JF, Fulda KG, Cardarelli K, Cardarelli R. Acculturation and self-reported health among Hispanics using a socio-behavioral model: the North Texas Healthy Heart Study. BMC Public Health (2010) 10:53. doi:10.1186/1471-2458-10-53
Pubmed Abstract | Pubmed Full Text | CrossRef Full Text | Google Scholar
275. Benjamin MR, Hirchsman J, Hirschtick J, Whitman S. Exploring differences in self-rated health among Blacks, Whites, Mexicans, and Puerto Ricans. Ethn Health (2012) 17(5):463–76. doi:10.1080/13557858.2012.654769
Pubmed Abstract | Pubmed Full Text | CrossRef Full Text | Google Scholar
276. Brewer JV, Miyasato GS, Gates MA, Curto TM, Hall SA, McKinlay JB. Contributions to self-reported health in a racially and ethnically diverse population: focus on Hispanics. Ann Epidemiol (2013) 23(1):19–24. doi:10.1016/j.annepidem.2012.09.013
Pubmed Abstract | Pubmed Full Text | CrossRef Full Text | Google Scholar
277. Jürges H. True health vs response styles: exploring cross-country differences in self-reported health. Health Econ (2007) 16:163–78. doi:10.1002/hec.1134
Pubmed Abstract | Pubmed Full Text | CrossRef Full Text | Google Scholar
278. Shweder R, Sullivan MA. Cultural psychology: who needs it? Annu Rev Psychol (1993) 44:397–523. doi:10.1146/annurev.ps.44.020193.002433
279. Lee S, Schwarz N. Question context and priming meaning of health: effect on differences in self-rated health between Hispanics and non-Hispanic Whites. Am J Public Health (2014) 104(1):179–85. doi:10.2105/AJPH.2012.301055
Pubmed Abstract | Pubmed Full Text | CrossRef Full Text | Google Scholar
280. Dudley NM, McFarland LA, Goodman SA, Hunt ST, Sydell EJ. Racial differences in socially desirable responding in selection contexts. J Pers Assess (2005) 85:50–64. doi:10.1207/s15327752jpa8501_05
Pubmed Abstract | Pubmed Full Text | CrossRef Full Text | Google Scholar
281. Johnson T, van de Vijver FJR. Social desirability in cross-cultural research. In: Harkenss JA, van de Vijver FJR, Mohler P, editors. Cross-Cultural Survey Methods. New York, NY: Wiley (2003). p. 193–202.
282. Fisher MA, Taylor GW, Shelton BJ, Debanne SM. Age and race/ethnicity-gender predictors of denying smoking, United States. J Health Care Poor Underserved (2008) 19:75–89. doi:10.1353/hpu.2008.0000
Pubmed Abstract | Pubmed Full Text | CrossRef Full Text | Google Scholar
283. Gorber SC, Schofiled-Hurwitz S, Hardt J, Levasseur G, Trembly M. The accuracy of self-reported smoking. Nicotine Tob Res (2009) 11(1):12–24. doi:10.1093/ntr/ntn010
284. Fisher MA, Taylor GW, Shelton BJ, Debanne SM. Sociodemographic characteristics and diabetes predict invalid self-reported non-smoking in a population-based study of U.S. adults. BMC Public Health (2007) 7:33. doi:10.1186/1471-2458-7-33
Pubmed Abstract | Pubmed Full Text | CrossRef Full Text | Google Scholar
285. Rauscher GH, Johnson TP, Cho YI, Walk JA. Accuracy of self-reported cancer-screening histories: a meta-analysis. Cancer Epidemiol Biomarkers Prev (2008) 17(4):748–57. doi:10.1158/1055-9965.EPI-07-2629
Pubmed Abstract | Pubmed Full Text | CrossRef Full Text | Google Scholar
286. McPhee SJ, Nguyen TT, Shema SJ, Nguyen B, Somkin C, Vo P, et al. Validation of recall of breast and cervical cancer screening by women in an ethnically diverse population. Prev Med (2002) 35:463–73. doi:10.1006/pmed.2002.1096
Pubmed Abstract | Pubmed Full Text | CrossRef Full Text | Google Scholar
287. Vernon SW, Briss PA, Tiro JA, Warnecke RB. Some methodologic lessons learned from cancer screening research. Cancer (2004) 101(Suppl 5):1131–45. doi:10.1002/cncr.20513
Pubmed Abstract | Pubmed Full Text | CrossRef Full Text | Google Scholar
288. Johnson T, O’Rourke DB, Burris JE, Warnecke RB. An investigation of the effects of social desirability on the validity of self-reports of cancer screening behaviors. Med Care (2005) 43:565–73. doi:10.1097/01.mlr.0000163648.26493.70
Pubmed Abstract | Pubmed Full Text | CrossRef Full Text | Google Scholar
289. Nelson DE, Powell-Griner E, Town M, Kovar MG. A comparison of national estimates from the national health interview survey and the behavioral risk factor surveillance system. Am J Public Health (2003) 93(8):1335–41.
290. Li A, Bagger J. The balanced inventory of desirable responding (BIDR). Educ Psychol Meas (2007) 67:525–44. doi:10.1177/0013164406292087
291. Beretvas SN, Meyers JL, Leite WL. A reliability generalization of the Marlowe-Crowne Social Desirability Scale. Educ Psychol Meas (2002) 62:570–89. doi:10.1177/0013164402062004003
292. Leite WL, Beretvas SN. Validation of scores on the Marlowe-Crowne Social Desirability Scale and the Balanced Inventory of Desirable Responding. Educ Psychol Meas (2005) 65:140–54. doi:10.1177/0013164404267285
Pubmed Abstract | Pubmed Full Text | CrossRef Full Text | Google Scholar
293. Collazo AA. Translation of the Marlowe-Crowne Social Desirability Scale into an equivalent, Spanish version. Educ Psychol Meas (2005) 65:780–806. doi:10.1177/0013164405275660
294. Schwarz N, Oyserman D. Asking questions about behavior: cognition, communication, and questionnaire construction. Am J Evaluation (2001) 22:127–60. doi:10.1016/S1098-2140(01)00133-3
295. Willis GB. Cognitive Interviewing: A Tool for Improving Questionnaire Design. Thousand Oaks, CA: Sage (2005).
296. Hambleton RK. Good practices for identifying differential item functioning. Med Care (2006) 44(11 Suppl 3):S182–6. doi:10.1097/01.mlr.0000245443.86671.c4
297. Hambleton RK, Merenda P, Spielberger C. Adapting Educational and Psychological Tests for Cross Cultural Assessment. Mahwah, NJ: Erlbaum (2005).
298. Hambleton RK, Swaminathan H, Rogers HJ. Fundamentals of Item Response Theory. Newbury Park, CA: Sage (1991).
299. Terchek JJ, Larkin EM, Male ML, Frank SH. Measuring cigar use in adolescents: inclusion of a brand-specific item. Nicotine Tob Res (2009) 11(7):842–6. doi:10.1093/ntr/ntp074
Pubmed Abstract | Pubmed Full Text | CrossRef Full Text | Google Scholar
300. Trapl ES, Terchek JJ, Danosky L, Brooks-Russell A, Frank SH. Complexity of measuring cigar use in adolescents: results from a split sample experiment. Nicotine Tob Res (2011) 13:291–5. doi:10.1093/ntr/ntq247
Pubmed Abstract | Pubmed Full Text | CrossRef Full Text | Google Scholar
301. Corey CG, Dube SR, Ambrose BK, King BA, Apelberg BJ, Husten CG. Cigar smoking among U.S. students: reported use after adding brand names to survey items. Am J Prev Med (2014) 47(Suppl 1):S28–35. doi:10.1016/j.amepre.2014.05.004
Pubmed Abstract | Pubmed Full Text | CrossRef Full Text | Google Scholar
302. Wolin KY, Heil DP, Askew S, Matthews CE, Bennett GG. Validation of the international physical activity questionnaire-short form among Blacks. J Phys Act Health (2008) 5(5):746–60.
303. Hoos T, Espinoza N, Marshall S, Arrendondo EM. Validity of the global physical activity questionnaire (GPAQ) in adult Latinas. J Phys Act Health (2012) 9(5):698–705.
304. Bull FC, Maslin TS, Armstrong T. Global physical activity questionnaire (GPAQ): nine country reliability and validity study. J Phys Act Health (2009) 6:790–804.
305. Fleishman JA, Lawrence WF. Demographic variation in SF-12 scores: true differences or differential item functioning? Med Care (2003) 41(Suppl 7):III75–86. doi:10.1097/00005650-200307001-00009
Pubmed Abstract | Pubmed Full Text | CrossRef Full Text | Google Scholar
306. Perkins AJ, Stump TE, Monahan PO, McHorney CA. Assessment of differential item functioning for demographic comparisons in the MOS SF-36 health survey. Qual Life Res (2006) 15:331–48. doi:10.1007/s11136-005-1551-6
Pubmed Abstract | Pubmed Full Text | CrossRef Full Text | Google Scholar
307. Burlew AK, Weekes MA, Montgomery L, Feaster DJ, Robbins MS, Rosa CL, et al. Conducting research with racial/ethnic minorities: methodological lessons from the NIDA clinical trials network. Am J Drug Alcohol Abuse (2011) 37(5):324–32. doi:10.3109/00952990.2011.596973
Pubmed Abstract | Pubmed Full Text | CrossRef Full Text | Google Scholar
Keywords: health disparities, race–ethnicity, measurement equivalence, scaling, methods
Citation: Landrine H and Corral I (2014) Advancing research on racial–ethnic health disparities: improving measurement equivalence in studies with diverse samples. Front. Public Health 2:282. doi: 10.3389/fpubh.2014.00282
Received: 04 September 2014; Accepted: 04 December 2014;
Published online: 22 December 2014.
Edited by:
Xin Gao, Food and Drug Administration, USAReviewed by:
Jingjing Ye, Food and Drug Administration, USATerri Kang Johnson, Food and Drug Administration, USA
Copyright: © 2014 Landrine and Corral. This is an open-access article distributed under the terms of the Creative Commons Attribution License (CC BY). The use, distribution or reproduction in other forums is permitted, provided the original author(s) or licensor are credited and that the original publication in this journal is cited, in accordance with accepted academic practice. No use, distribution or reproduction is permitted which does not comply with these terms.
*Correspondence: Hope Landrine, Center for Health Disparities, Brody School of Medicine, East Carolina University, 1800 W. 5th Street, Medical Pavilion Suite 6, Greenville, NC 27858, USA e-mail: landrineh@ecu.edu