 Robert G. Berger1
 Payam Ashtiani2
 Christopher A. Ollson3
 Melissa Whitfield Aslund3
 Lindsay C. McCallum3,4Geoff Leventhall5
 Loren D. Knopper3*
- 1Intrinsik Health Sciences Inc., Mississauga, ON, Canada
- 2Aercoustics Engineering Limited, Mississauga, ON, Canada
- 3Intrinsik Environmental Sciences Inc., Mississauga, ON, Canada
- 4Department of Physical and Environmental Sciences, University of Toronto, Toronto, ON, Canada
- 5H.G. Leventhall – Consultancy, Surrey, UK
Setbacks for wind turbines have been established in many jurisdictions to address potential health concerns associated with audible noise. However, in recent years, it has been suggested that infrasound (IS) and low-frequency noise (LFN) could be responsible for the onset of adverse health effects self-reported by some individuals living in proximity to wind turbines, even when audible noise limits are met. The purpose of this paper was to investigate whether current audible noise-based guidelines for wind turbines account for the protection of human health, given the levels of IS and LFN typically produced by wind turbines. New field measurements of indoor IS and outdoor LFN at locations between 400 and 900 m from the nearest turbine, which were previously underrepresented in the scientific literature, are reported and put into context with existing published works. Our analysis showed that indoor IS levels were below auditory threshold levels while LFN levels at distances >500 m were similar to background LFN levels. A clear contribution to LFN due to wind turbine operation (i.e., measured with turbines on in comparison to with turbines off) was noted at a distance of 480 m. However, this corresponded to an increase in overall audible sound measures as reported in dB(A), supporting the hypothesis that controlling audible sound produced by normally operating wind turbines will also control for LFN. Overall, the available data from this and other studies suggest that health-based audible noise wind turbine siting guidelines provide an effective means to evaluate, monitor, and protect potential receptors from audible noise as well as IS and LFN.
Introduction
Wind-based energy production has been identified as a clean and renewable resource that does not produce any known emissions or harmful wastes (1). As a result, wind power has become the fastest growing source of new electric power generation, with several countries achieving high levels of wind power capacity and overall penetration (2). Within the last decade, wind power generation has increased substantially in Canada. In the province of Ontario alone, 1,700 MW (5% of Ontario’s energy generation) have been installed since 2006, with an additional 2,000 MW expected to be installed by the end of 2014 (3). Public support for the use of wind energy is typically high; however, acceptance of projects at the local level does not always reflect this trend. While support is found in some locations, strong opposition stemming from concerns of visual esthetics, health risk perception, and noise levels can be found in others (4–7).
Currently, there exists an ongoing debate surrounding the relationship between wind turbines and human health within both the public and the scientific communities (8). This debate is driven by the fact that some people that live near wind turbines have reported adverse health effects such as (but not limited to) ringing in ears, headaches, lack of concentration, vertigo, and sleep disruption that they attribute to the wind turbines. Some argue that reported health effects are related to wind turbine operational effects [e.g., electromagnetic fields (EMF), shadow flicker from rotor blades, audible noise, low-frequency noise (LFN), and infrasound (IS)]; others suggest that when turbines are sited correctly, reported effects are more likely attributable to a number of subjective variables, including nocebo responses, where the etiology of the self-reported effect is in beliefs and expectations rather than a physiologically harmful entity (9–13). Indeed, there are numerous peer-reviewed studies on the issue and governmental reviews of these studies (14–16).
It is well known that exposure to excessive levels of audible noise, regardless of the source, can cause annoyance, sleep disturbance, cognitive impairment, and other serious health effects. According to the World Health Organization (WHO), nighttime exposure to noise levels above 55 dB(A) outdoors averaged over the year is considered increasingly dangerous for public health and a sizeable proportion of the population will be highly annoyed and sleep-disturbed (17). As a result, jurisdictions across the globe have developed noise regulations specific to wind turbine projects to protect the public from potential noise-related health effects (Table 1). Guidelines are found at various levels of governmental structure including country, state/province, and county/municipality. The list in Table 1 is not globally comprehensive yet is wide-ranging and inclusive of numerous jurisdictions. Though some variability exists among jurisdictions, the majority of the guidelines center around an outdoor limit between 35 and 45 dB(A). This limit coincides with the WHO Europe nighttime noise guideline of 40 dB(A) outdoors, a health-based value derived to “protect the public, including the most vulnerable groups such as children, the chronically ill and the elderly, from the adverse health effects of night noise” (17).
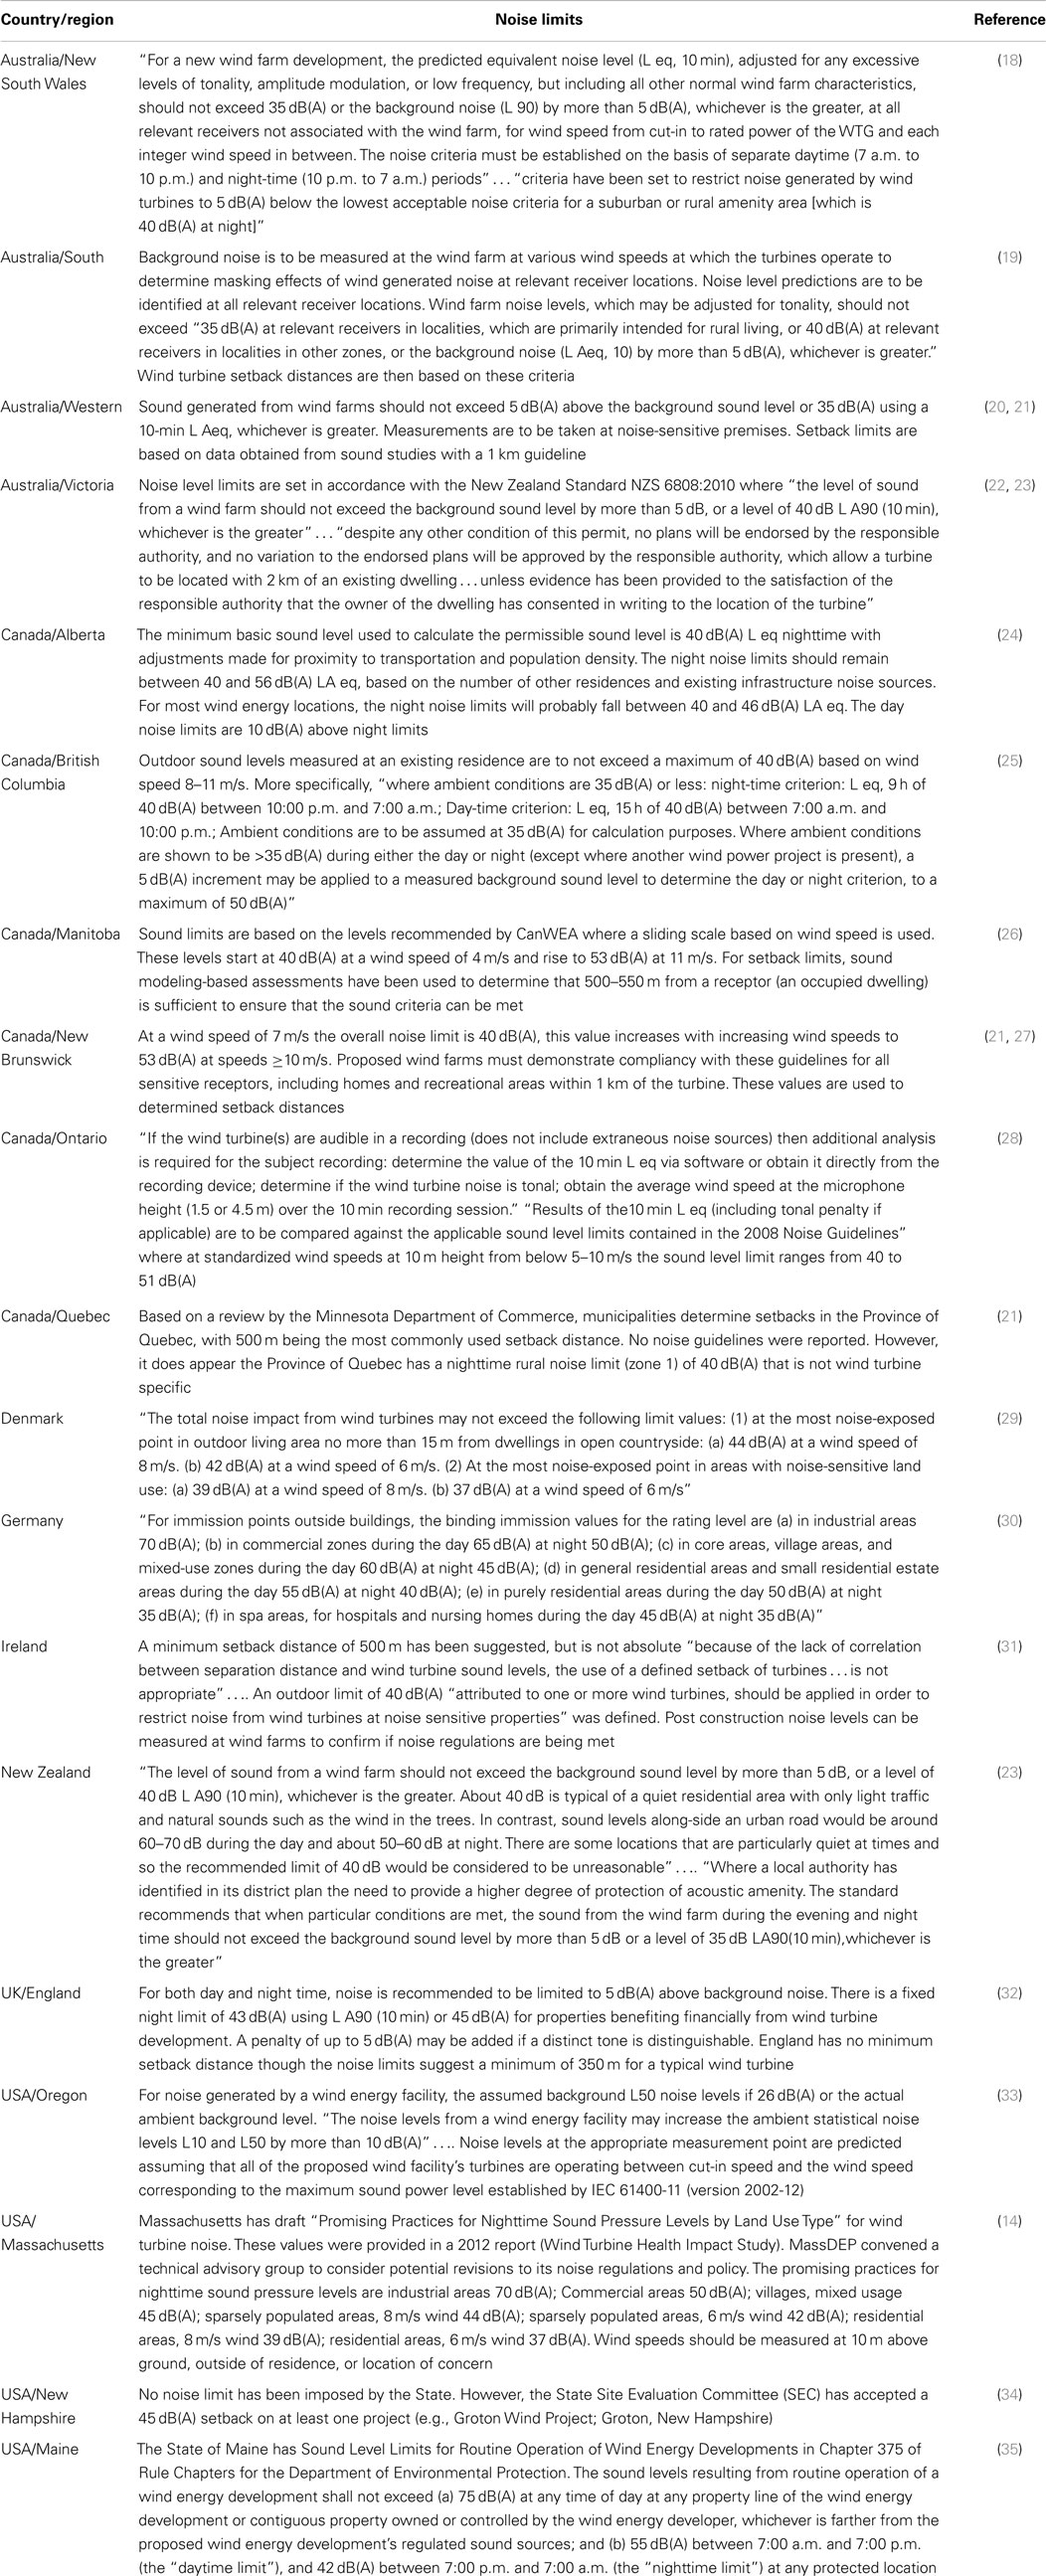
Table 1. Current or proposed wind turbine noise limits per jurisdiction.
Even when these health-based noise limits are met, some people living near wind turbines self-report a variety of adverse health effects that they attribute to living near the wind turbines (8, 16). As a result, the etiology of these health effects has been hypothesized by some to stem from exposure to low-frequency sounds, including IS (0.01–20 Hz) and LFN (10–200 Hz) (36–38), both of which are known components of the broad-band sound associated with normal wind turbine operation (9, 39, 40). For example, in 2011 Møller and Pedersen (38) stated “Even when A-weighted levels are considered, a substantial part of the noise is at low frequencies, and for several of the investigated large turbines, the one-third-octave band with the highest level is at or below 250 Hz. It is thus beyond any doubt that the low-frequency part of the spectrum plays an important role in the noise ….” In response to these concerns, a number of investigations (published since 2010) have measured IS and LFN associated with modern wind turbine operation at a variety of distances, operating scenarios, and geographic and meteorological conditions (Tables 2 and 3). Collectively, these reports suggest that sound associated with well-functioning wind turbines has measurable energy within the IS and LFN spectra. However, IS levels, which are often described in dB(G), are consistently well below auditory perceptual levels (41–45) and LFN is below available guidelines (42). Furthermore, IS levels at relatively close distances to wind turbines are equivalent to or less than those produced by a number of natural or engineered sources that individuals are exposed to on a regular basis (43, 44, 46). The physical characteristics of sounds emitted from wind turbines have been recognized to influence the perception and annoyance to wind turbine associated sounds; however, this generally refers to sounds that are above the auditory level of perception (10, 47, 48).
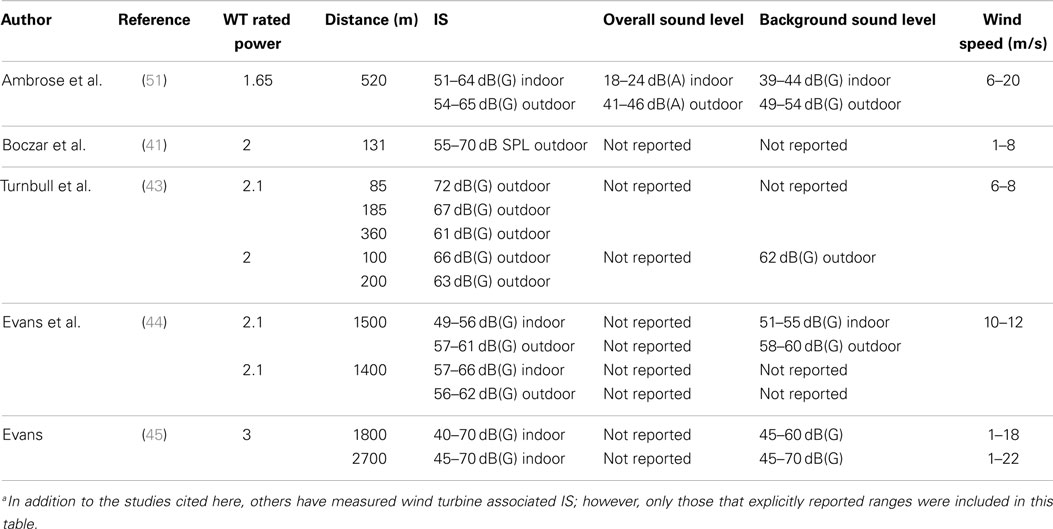
Table 2. Review of reported wind turbine IS emissions (reported after 2010a).
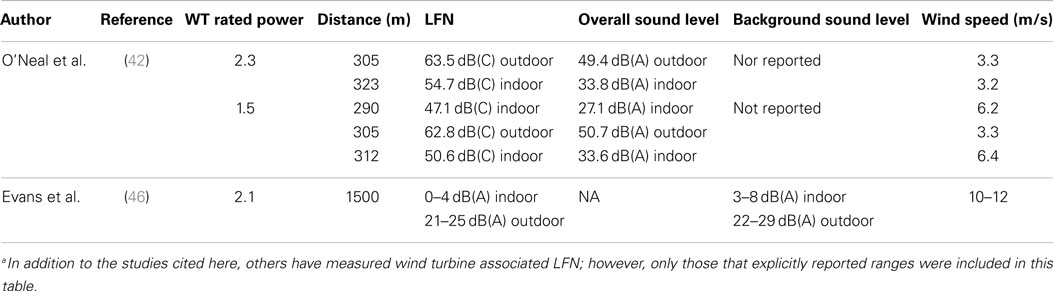
Table 3. Review of reported wind turbine LFN emissions (reported after 2010a).
It has been suggested that wind turbine noise limits set in dB(A), which simulates the sensitivity of human hearing and perception, may underestimate the contribution of IS and LFN from wind turbines (37). Alternative sound weightings, including G-weighting [dB(G)] and C-weighting [dB(C)], have been proposed as more appropriate metrics for noise limits when LFN and IS are present, respectively (37, 49). However, Health Canada recently suggested that, in the case of wind turbine noise, there was “no additional benefit in assessing LFN as C- and A-weighted levels were so highly correlated (r = 0.94) that they essentially provided the same information” (50). Accordingly, the purpose of this paper is to examine further IS, LFN, and overall sound levels typically produced by wind turbines and provide discussion as to whether concerns regarding wind turbine associated IS and LFN are warranted. Field measurements of outdoor LFN and overall sound levels and indoor IS at locations between 400 and 900 m from the nearest wind turbine, which were previously underrepresented in the scientific literature, are reported. The results of these measurements are put into context with existing published works and current available guidelines based on dB(A) to provide a weight-of-evidence conclusion.
Materials and Methods
Indoor Infrasound Measurements
Sound measurements were conducted in three residences, two at 450 m and one at 900 m from the nearest wind turbine. These turbines were part of an operating wind farm with over 40 turbines, each with a power capacity of 1.5 MW. The measurements were carried out using Class 1 instrumentation with sufficiently low-frequency range and noise floor. Measurements were carried out on a ground plane fitted with a double windscreen. The double wind screen consisted of the thin hemispherical wireframe (450 mm diameter) covered with a thin layer (approximately 10 mm) of open cell foam. This setup is consistent with that defined in IEC 61400-11 with the exception that the measurement location was at a dwelling rather than close to a wind turbine. Although not in a windy environment, a double windscreen helps protect very low frequency and infrasonic measured levels against pressure fluctuations within a dwelling caused by moving air from ventilation and opening/closing doors.
For these measurements, access was not available to turbines in order to conduct on/off tests for quantifying ambient levels. Additionally, turbine power performance was not made available during the study. In order to identify whether the turbines in the facility were operating, an autocorrelation technique was used in the signal analysis in order to detect characteristics in the sound signal attributable to the turbine operation. This autocorrelation technique (52) exploits the periodicity in the signal attributable to the wind turbine operation and uses this feature to detect when the turbines were operating. IS levels measured during wind turbine operation were compared to those when the wind turbines were unlikely to be operational (i.e., at wind speeds below turbine cut-in at 3 m/s). Data were collected from 1 to 1000 Hz and subsequently weighted using dB(G) to focus the analysis on the IS component, and allow for comparison to other studies.
The data presented in this report represent the periods where 1-min interval recordings showed the existence of the wind turbine noise (i.e., characteristic blade passage frequencies) the clearest out of the entire measurement period, which was 3–4 weeks. Because the nature of the signal detection mechanism, and the averaging over a minute, the Type A uncertainty for the measured value is difficult to quantify. The Type B uncertainty of the measurement is that of a Class 1 instrumentation, which is typically ±1 dB.
Outdoor Low-Frequency Noise and Overall Sound Measurements
Sound levels were measured near two different wind turbine facilities, both with more than 30 wind turbines each. The turbines had a power capacity between 1.5 and 2.4 MW. Measurements were carried out outdoors at 4.5 m height, and at a distance between 400 and 800 m. Meteorological data were also recorded at a height of 10 m at the same location. The sound measurements were carried out using Class 1 instrumentation with sufficiently low noise floor. A large 450 mm diameter spherical secondary windscreen was employed in addition to a commercially available 7 cm primary wind screen to minimize pseudo-noise from wind flowing over the microphone. Field sound measurements of wind turbines are highly susceptible to contamination from extraneous noise such as from human activity, fauna, insects, and wind-induced noise. To control for these sources of contamination, the following methods were used:
• sound measurements were only collected during nighttime, between 10 p.m. and 5 a.m.;
• measurements were conducted in 1 min intervals;
• measurements were binned by wind speed for each 1 min interval;
• intervals within 1 h of rainfall or snowfall were not used; and
• intervals with gusty winds (>2 m/s above the mean wind speeds) were not used as these periods are more susceptible to wind-induced pseudo-noise.
Measurements were carried out in the vicinity of the wind facility during wind turbine operation as well as with the turbines off. The same filtering and data quality management methods were applied to both data sets. A minimum of 60 data points in each wind bin were gathered. To isolate only the LFN portion of the spectrum, data between 20 and 200 Hz were analyzed and summed. Once tallied, the mean spectrum for the 3 and 6 m/s integer wind speeds was calculated. For each of those cases, the calculation was made from spectra where the mean wind speeds were within 0.5 m/s of the stated value and was relatively steady during the entire interval. The gust filtering ensures that no gust was more than 2 m/s above the mean. The mean spectrum was calculated by computing the energy averaged sound level for each 1/3rd octave band between 20 and 200 Hz, and then computing an A-weighted sum of the spectrum.
The self-noise emitted by the system itself was assessed using the measurements conducted during periods when the wind turbines in the vicinity were not operating. The mean spectrum at various wind speeds was compared to those found in other literature comparing measured ambient levels with respect to wind speed. The most applicable study, conducted by the Japanese Ministry of Environment and reported by Tachibana (53) compared sound levels measured with various windscreens ranging from naked microphone to a specialized dodecahedron double windscreen. Measured low-frequency levels were at or below those reported in the double windscreen case in the Japanese study for most wind speeds and locations. It should be noted that although the measured ambient levels are consistent with those measured with high degree of windscreen protection, pseudo-noise contamination of the signal cannot be fully avoided.
Based on the measurements conducted, the typical measured SD for the A-weighted level was ±3 dB for the turbines ON, and ±2 dB when the turbines were OFF. The SD was higher at lower wind speeds and decreased with increasing wind speed. This is due to wind-induced ambient noise (which is fairly steady) dominating the signal at the higher wind speed. At lower wind speeds, because the ambient levels are lower, individual non-turbine related events such as vehicular traffic, faunal noise, or other intermittent noises increase the variability in background noise. Additionally, during lower wind speeds, the wind turbine noise source would be more susceptible to changes in wind speed at the hub. For example, for two cases where the ground level wind speed is 3 m/s, the hub height wind speed could be 4 m/s in one case and 8 m/s in another. This would result in a difference in the amount of noise produced by the turbine. It is the authors’ view that given the above variability, wind turbine noise measurements at far field distances should carry a nominal uncertainty value of ±3 to ±5 dB.
Results and Discussion
Indoor Infrasound Measurements
Infrasound levels in the homes at 450 m were relatively similar, measuring 59 and 58 dB(G) (Table 4). IS measured at the furthest location of 900 m was comparable to the measurements at 450 m, measuring 60 dB(G). These data indicate that IS levels were relatively constant with increased distance from the nearest wind turbine and were approximately 25 dB below the level of human perception [approximately 95 dB(G) (54)], which may be indicative of non-wind turbine associated distant sources of IS. The results reported here are consistent with previous measurements at varying distances (41–45). For instance, IS measurements from 290 to 323 m from wind turbines were 20–30 dB below the human auditory threshold levels (42). Additional measurements of IS in the 1–30 Hz range at a distance of 200 m from the wind turbines also remained below the human auditory threshold (41). Other investigations have shown that at further distances (1.5 km) indoor IS levels in two residences were between 49 and 61 dB(G), with no reported difference between operational and shutdown periods, also suggesting that there are other sources of IS contributing to these results (44). The same group (55) also showed that indoor IS levels were between 50 and 70 dB(G) at distances of 1.8 and 2.7 km from the nearest wind farm. In conjunction with these reports, the results from the current field investigation indicate that wind turbines are a source of IS; however, sound levels are well below the human auditory threshold.
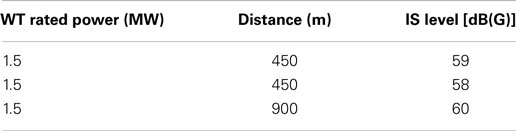
Table 4. Indoor infrasound measured at three homes at two different distances to 1.5 MW turbines.
Only two jurisdictions have developed clear guidelines for IS and neither is specific to wind turbine noise (Table 5). This may be partly a result of the highly sophisticated equipment and analyses required to accurately measure IS and distinguish between the IS generated from wind turbines and other natural and engineered sources (56). The Queensland Department of Environment and Resource Management’s Draft ECOACCESS Guideline-Assessment of Low Frequency Noise proposed an interior IS limit of 85 dB(G) (57). This value was derived based on a 10 dB protection level from the average 95 dB(G) hearing threshold (54) and previous Danish recommendations for IS limits (58). The Japanese Handbook on Low Frequency Noise provides an IS reference value of 92 dB(G) at 10 Hz and 1/3-octave bands up to 80 Hz (59). These values were derived from investigations that monitored complaints of mental and physical discomfort from healthy adults exposed to low-frequency sounds in a room (59). Though the Japanese guidelines were derived through short-term monitoring experiments and are not equivalent to the long-term exposure associated with living in proximity of wind turbines, the levels of IS measured as part of this current study (Table 4) are 20–30 dB below these guidelines.
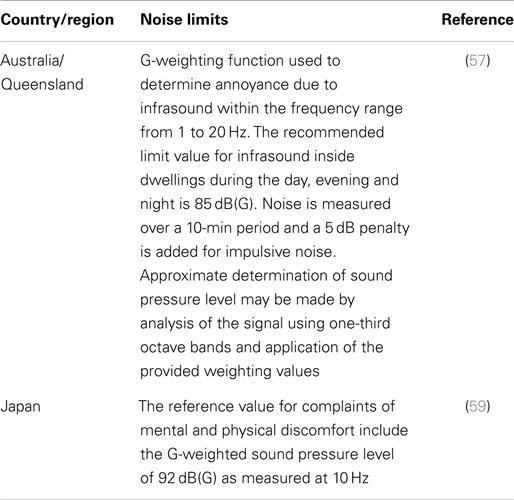
Table 5. Infrasound noise limits per jurisdiction (not wind turbine specific).
A limited number of reports have suggested that the IS component of wind turbine noise is the cause of self-reported adverse health effects (51, 60, 61). Mechanisms within the inner ear that are sensitive to low levels of IS stimulation have been proposed to be associated with adverse health responses (36, 37, 62). However, functional magnetic resonance imaging has provided powerful evidence that IS is perceived via similar auditory pathways as audible sounds when above the level of perception with no indication of cortical activation at sub-threshold values (63). Furthermore, exposure to IS is known to originate from other engineered or natural processes, including wind and weather systems (64), volcanic (65) and auroral activity (66), and mountain ranges (67); this would arguably also induce stimulation of the inner ear. Recent outdoor measurements have provided an indication of IS levels from a number of natural sources, including sea waves at 25 m from the coast [75 dB(G)], 250 m from a coastal cliff face [69 dB(G)] and 8 km inland from the coast [57 dB(G)] (43). The authors reported that wind turbine IS levels, which were between 61 and 72 dB(G) at distances of 85–360 m, were lower than many of the natural sources measured (43). IS is also generated in urban environments as a result of human activity and engineered sources such as industrial processes, ventilation systems, and vehicles (43, 44). Measurements of IS in a typical urban setting have been reported to be up to 70 dB(G) during the daytime and 63 dB(G) at night (44). In comparison, studies reporting biological responses to IS exposure were at sound pressure levels that were above the level of auditory perception, much higher than those produced by wind turbines [e.g., 145 dB and 165 dB (68, 69)]. Collectively, these reports and the measurements from the current investigation indicate that humans are regularly exposed to IS from several natural and engineered sources at levels that exceed those produced by wind turbines. Although sounds with impulsive characteristics (e.g., wind turbines) generate greater levels of annoyance than non-impulsive sources, annoyance levels have only been associated with noises that are above the threshold of auditory perception (9, 70). Our measurements of IS, and those from the literature, are all well below the threshold of auditory perception.
Outdoor Low-Frequency Noise and Overall Sound Measures
Outdoor LFN levels were assessed through 1/3-octave band measurements with wind turbines operational (on) and during scheduled shutdown periods (off) at distances of 480, 490, 611, and 810 m (Figure 1). The most evident result is the similarity between measured LFN levels with wind turbines on and off (ambient) from 20 to 100 Hz, at which point sound levels began to deviate from one another. This deviation was most apparent at measurements taken nearest the turbines (Figures 1A,B) where levels of LFN from turbines on differed from ambient by 6 and 9 dB at wind speeds of 3 and 6 m/s, respectively. As distance from the turbines increased, the amount by which LFN levels measured with turbines on and off differed compared those observed at 480 m. At 490 and 611 m, the maximum difference between on and off was between 3 and 4 dB. At the furthest observation point of 810 m (3 m/s), there was no difference in LFN levels measured during wind turbine operation and shutdown (Figure 1G). At lower frequencies within the LFN spectrum (20–100 Hz), the contribution of the wind turbines was negligible when compared to ambient levels at distances ≥490 m (Figures 1C–G). At all distances and wind speeds, irrespective of wind turbine operation, LFN exceeded the ISO-defined audible threshold at frequencies >40–50 Hz (71). These results indicate that the observed increase in LFN during wind turbine operation was found primarily in the frequency range consistent with the audible range of hearing, namely 20–20,000 Hz, and not in the IS range (<20 Hz). It is also noted that the same applies to ambient noise levels, namely that the levels cross the auditory threshold at frequencies between 40 and 50 Hz and higher.
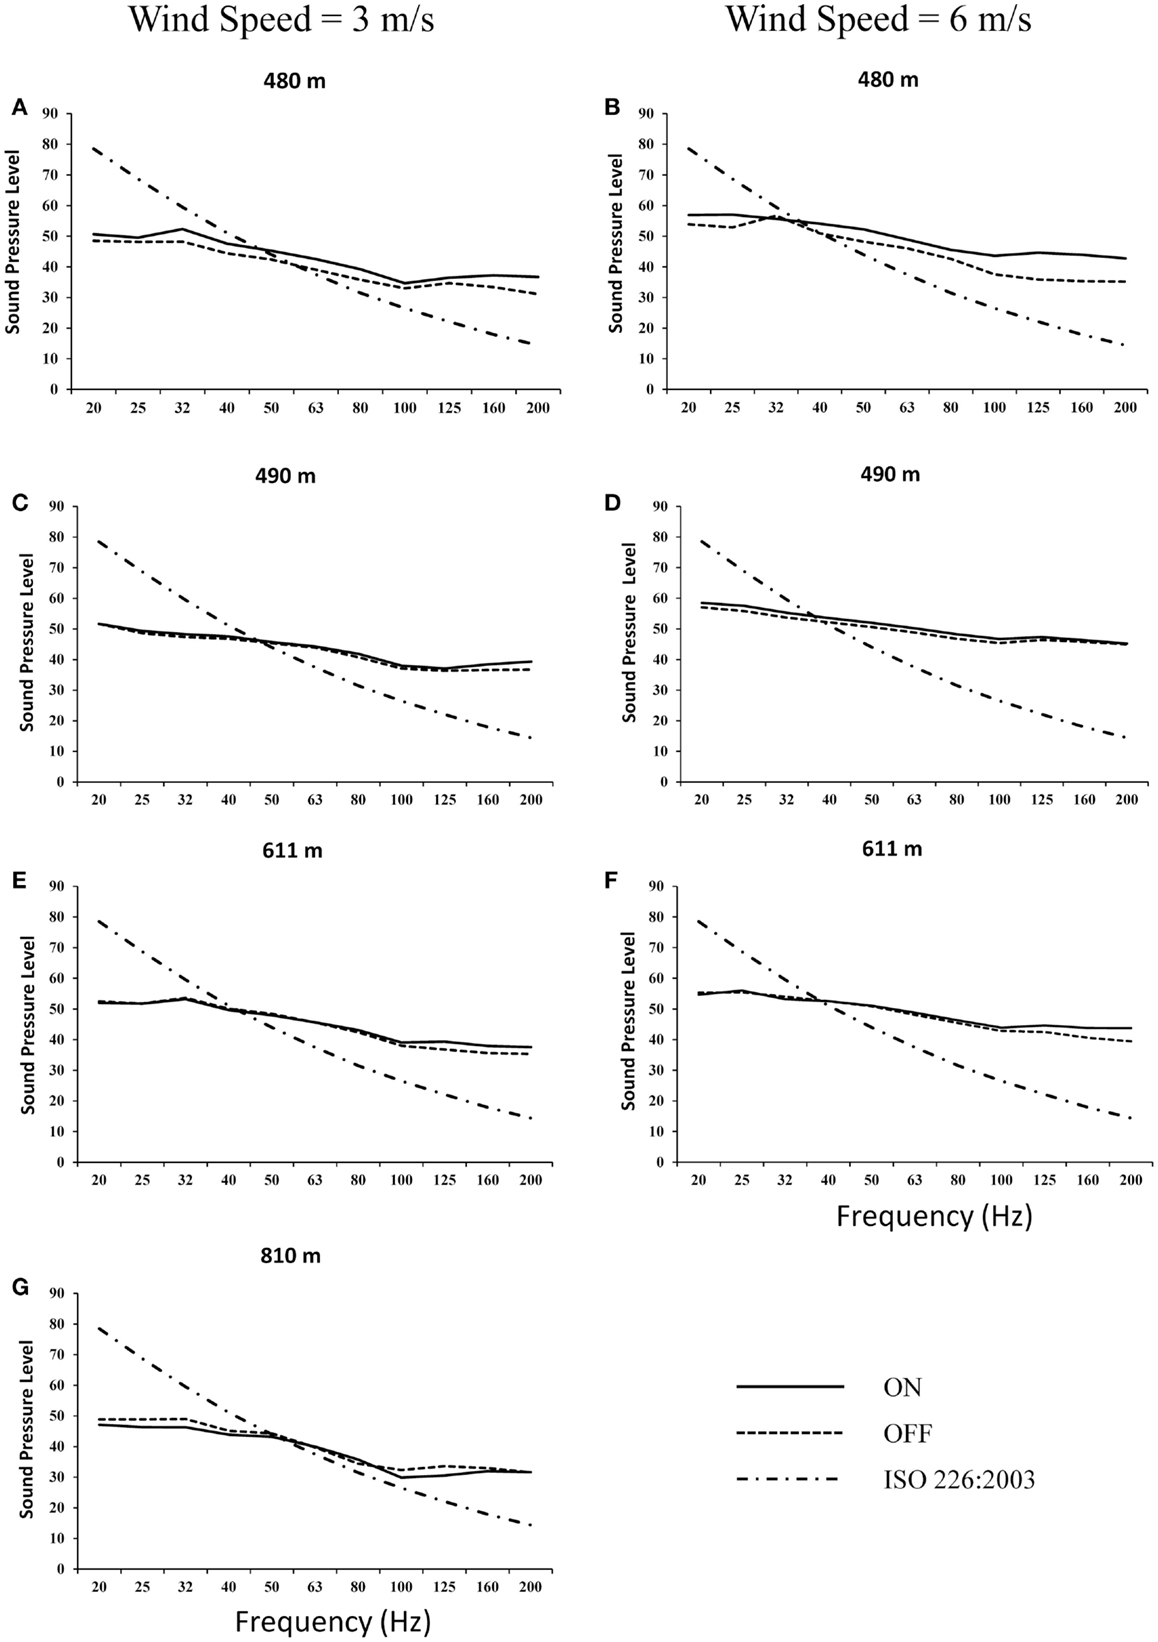
Figure 1. Outdoor low-frequency noise measurements at 480 m (A,B), 490 m (C,D), 611 m (E,F), and 810 m (G) from 1.5 MW wind turbines with wind speeds of 3 m/s (A,C,E,G) and 6 m/s (B,D,F) with turbines on and off. Hearing threshold (ISO 226:2003) is also provided.
Through the 1/3-octave band analysis of overall sound levels (20–20,000 Hz; Figure 2), it was apparent that the increase in LFN from wind turbine operation was accompanied by increased sound levels at higher frequencies (i.e., >200 Hz). This was particularly evident at 480 m where wind turbine associated sound levels continued to be above ambient levels until approximately 3150 Hz (Figures 2A,B). At further distances, sound levels were above ambient levels at frequencies between 125 and 1000 Hz, but not easily distinguishable from ambient levels below 125 Hz or above 1 kHz (Figures 2C–F). These results indicate that though there was an observed increase in LFN levels during wind turbine operation at the 480 m location this increase was accompanied by an increase in sound levels up to 3 kHz.
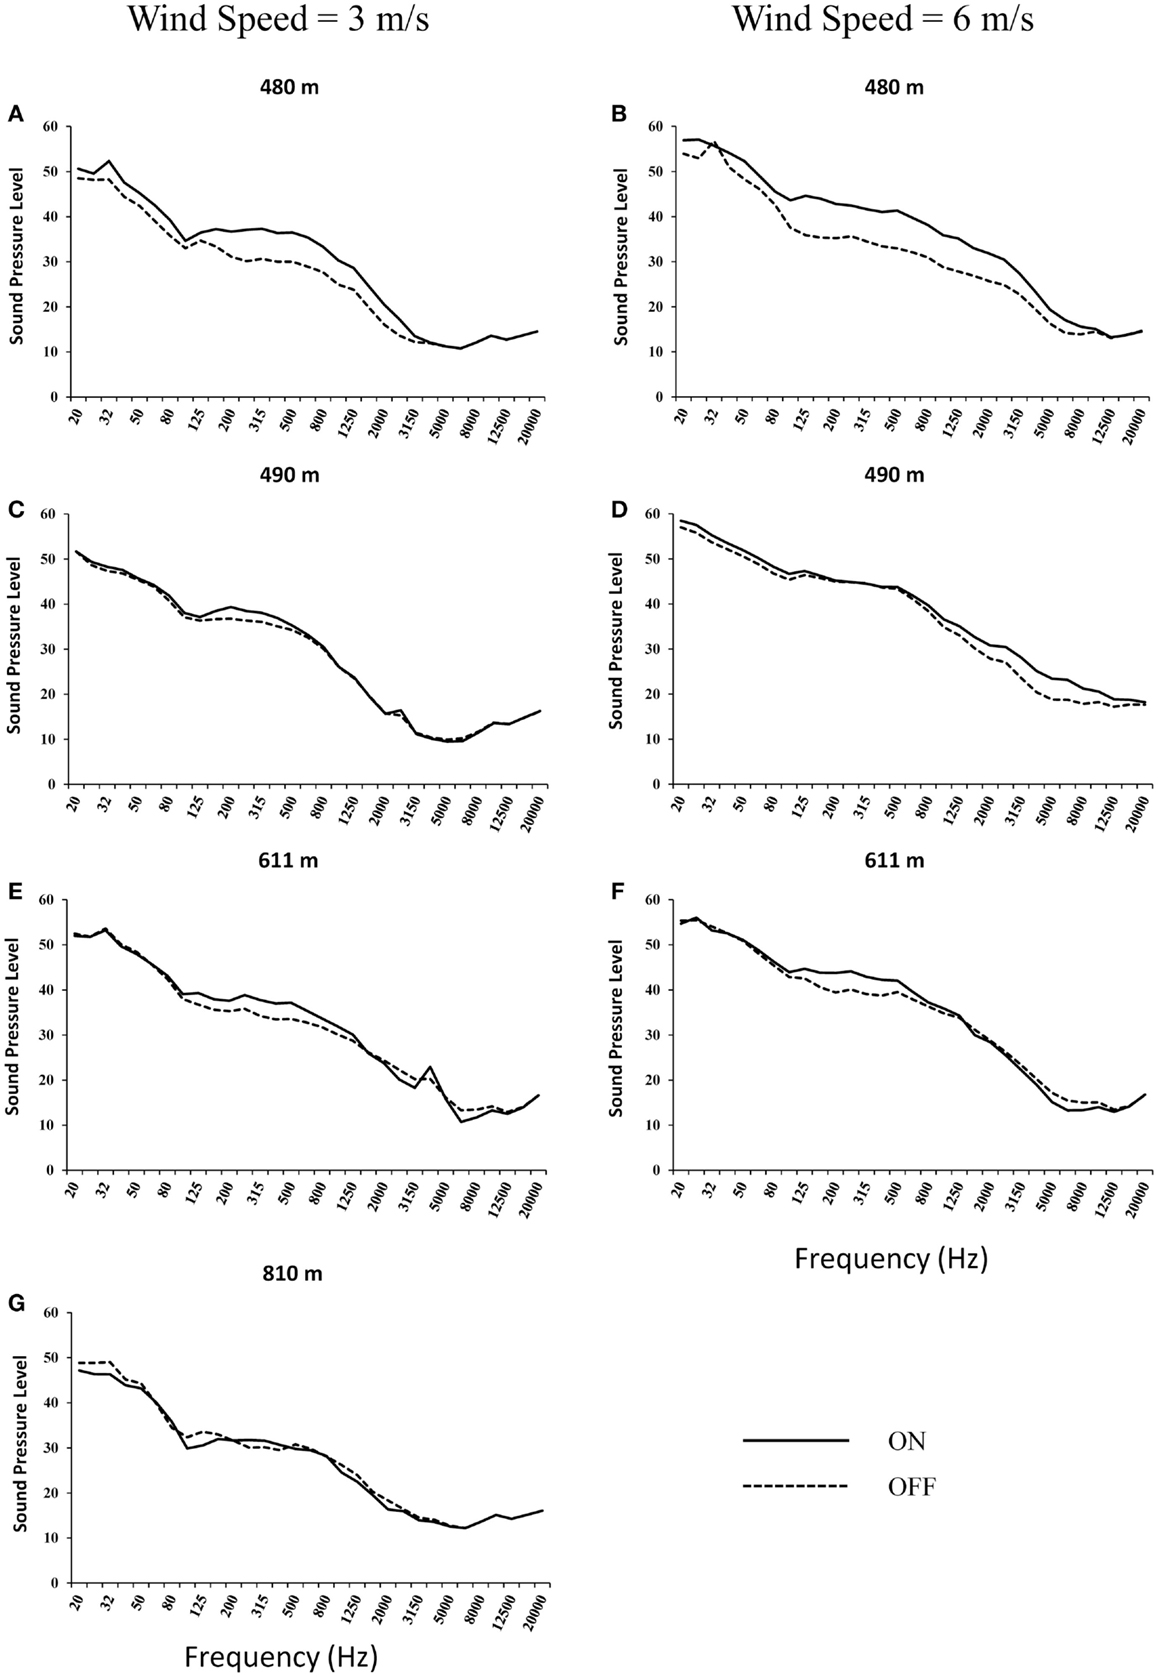
Figure 2. Outdoor sound measurements at 480 m (A,B), 490 m (C,D), 611 m (E,F), and 810 m (G) from 1.5 MW wind turbines with wind speeds of 3 m/s (A,C,E,G) and 6 m/s (B,D,F) with turbines on and off.
At closer distances where the LFN component can be measured above the ambient conditions, the mid frequency sound levels were also above ambient levels. In those cases, the signal-to-noise ratio of the mid frequency sound levels was higher than that below 125 Hz, indicating that the most audible portion of the frequency spectrum was between 125 and 3150 Hz. At further distances, it was evident that the signal-to-noise ratio decreased, such that only acoustic energy between 125 Hz and about 800–1000 Hz was above background, with the highest signal-to-noise ratio between 200 and 500 Hz (Figures 2C–F). The single measurement point at 810 m showed no measurable increase in any of the mean sound levels. This is indicative that a presence of LFN in the signal from wind turbines was accompanied by a presence in mid frequency sound levels. For instance, where the LFN levels were considerably above ambient levels, the mid frequency sounds levels were also considerably increased. This indicates that, at the distances of interest, it is the mid frequency region that is the most audible portion of the noise from the turbines. Only at closer distances, where the mid frequency components would be clearly audible (6–9 dB signal-to-noise ratio), would the low-frequency components from the turbines start to be audible above ambient levels. The overall A-weighted sound pressure level was significantly affected by the mid frequency component. As a result, it would be expected that by controlling the overall sound pressure level [dB(A)] from normal functioning wind turbines that the LFN component would also mitigated.
When the wind turbines were operating, the highest mean LFN level [dB(A)] was observed at 480 m (Table 6). At the other locations >480 m from the wind turbines, the measured difference between wind turbines on and off was between 1 and 3 dB, at least half of that observed at 480 m. The mean overall sound levels reported in dB(A) showed very similar trends to those reported in the LFN analysis. Critically, the increase in mean sound levels at the closest location (480 m) reported in the LFN spectrum and overall sound in the 1/3-octave band analysis was maintained. In addition, the observed trends at 490, 611, and 810 m, also remained consistent. From these results, it is evident that during wind turbine operation, the increased sound levels that began in the LFN spectrum, at approximately 160 Hz and continued to 1000 Hz, were above auditory threshold levels and represented in the mean dB(A) sound measures. The consistency between the mean dB(A) measurements and trends observed in the 1/3-octave band analysis suggest that the contribution of the LFN component and overall sound levels were accounted for in the calculation.
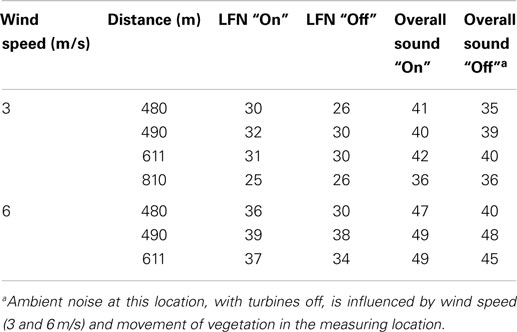
Table 6. Low-frequency noise (LFN) and overall sound levels with turbines on and off (i.e., background) in dB(A).
A number of investigations have reported LFN levels in the proximity of wind turbines (Table 2) similar to those reported here. Furthermore, the results showing LFN levels passing the auditory threshold between 40 and 50 Hz are similar to those that have been previously reported (42, 72). For instance, O’Neal et al. (42) measured indoor and outdoor LFN levels from wind turbines at a distance of 300 m and found the levels were below the United Kingdom’s (UK) Department for Environmental and Rural Affairs (DEFRA) and Japanese guidelines and became audible at approximately 50 Hz (42). Elsewhere, LFN levels were only marginally higher and remained well below guidelines even though measurements were taken as close as 104 m from the nearest wind turbine (72). LFN measured at 1.8 and 2.7 km from the nearest wind farm was comparable during pre-operational and operational periods of development, though small increases at frequencies above 63 Hz were reported (45). At a greater distance of 1.5 km from wind turbines, Evans et al. found LFN levels were similar to those measured at distances of 10 and 30 km from the turbines (46). Further, organized shut downs of the two wind farms showed that the contributions of the turbines to LFN measurements were negligible or relatively small contributions at 100 Hz and above (46). As shown with IS, LFN is also produced by natural and common engineered sources: in urban environments, including offices and residences, LFN levels often exceed available guidelines and are greater than those measured 1.5 km from the nearest wind turbine (46).
The sound characteristics and associated fall off with distance have been extensively measured by Tachibana in the range from 0.8 Hz to 5 kHz at 164 locations around 29 wind farms, using one third octave analysis. The average of the measures fell with a slope of 4 dB/octave over the whole range. The average passed through 55 dB at 10 Hz and crossed the hearing threshold at about 50 Hz (73). Other, less detailed measurements on individual turbines have shown slopes of 5 dB/octave to 6 dB/octave (42). A spectrum, which falls at 5 dB/octave and passes through, for example, 60 dB at 10 Hz has an A-weighted level of 39 dB(A), which is mainly determined by a broad peak in the A-weighted spectrum in the region of 200 Hz to 630 Hz. Any shift in the level at 10 Hz is reflected in the A-weighted level. Similarly, this spectrum has a C-weighted level of 58 dB(C). The difference between dB(A) and dB(C) levels depends only on the spectrum shape and is independent of overall level, indicating that for similar spectrum shapes, the dB(A) and dB(C) levels are highly correlated.
There are currently no widely accepted international health-based limits for LFN specifically derived for wind turbines. A number of jurisdictions have developed both indoor and outdoor LFN limits to address potential issues associated with industrial noise emissions (Tables 7 and 8). The majority of the limits are for indoors and utilize 1/3-octave sound pressure level measurements between 5 and 200 Hz. This analysis enables assessors to identify tonal components within the spectrum that may be problematic. The 1/3-octave band limits vary significantly between jurisdictions. In Poland, LFN limits are around 10 dB(A) across 1/3-octave bands between 10 and 250 Hz (74). In Denmark, LFN is limited to a total level of 20 dB(A) between 10 and 160 Hz (75), while in UK, guidelines are generally between 10 and 25 dB(A) depending on the frequency between 10 and 100 Hz (76). Indoor LFN limits provide a basis to address specific complaints from local residents; however, for wind farm development, regular monitoring of outdoor sound levels presents a more practical option.
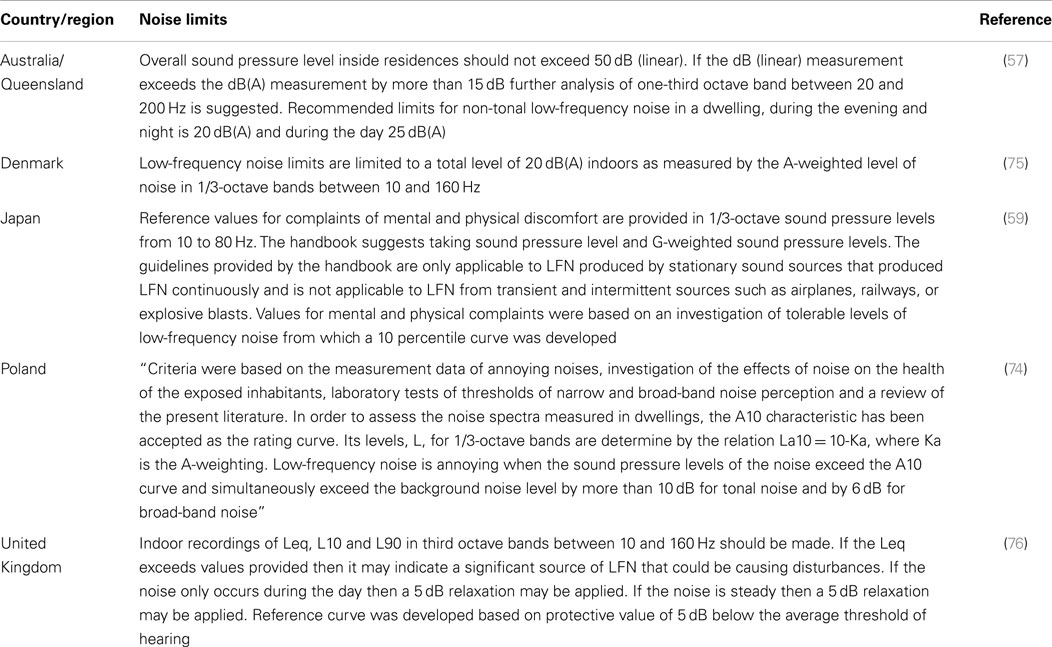
Table 7. Indoor LFN noise limits per jurisdiction (not wind turbine specific).
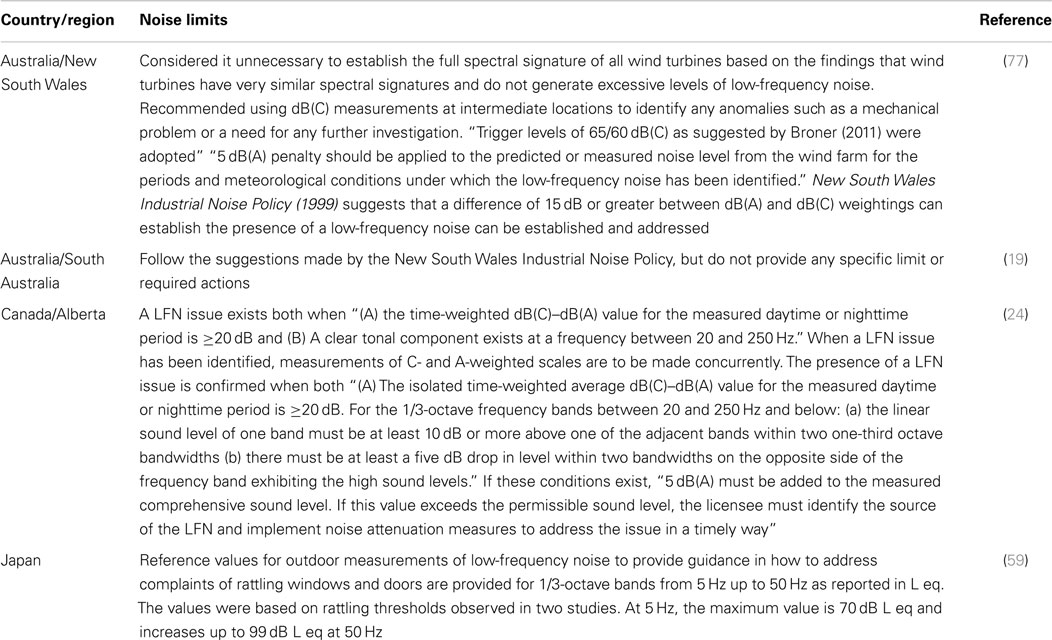
Table 8. Outdoor LFN noise limits per jurisdiction (not wind turbine specific).
Only a small number of jurisdictions, including the province of Alberta, Canada (24), Japan (59), and Australian States of South Australia and New South Wales (18), have introduced outdoor LFN noise limits (Table 8). Several of these guidelines determine the difference between C- and A-weighted sound measurements (19, 24, 77). This calculation can provide an indication of an unbalanced spectrum; a difference >20 dB between two weightings may warrant further investigation based on those regulations (78, 79). The ability of this calculation to predict LFN issues is limited, particularly when there are low levels of background noise that result in a large difference between the A- and C-weighted sound levels that are not associated with increased levels of annoyance (80). In the current investigation the difference between wind turbine operational scenarios (i.e., on and off) was <5 dB at the 490 and 611 m locations at both wind speeds. Measured background levels at 490 and 611 m were also high, measuring 48 and 45 dB(A), respectively. A number of noise guidelines, including those in UK (32), New Zealand (23), and several of the Australian states (18–20, 22), take into account the potential for high levels of background noise by suggesting that the contribution of wind turbines to be limited to <5 dB above background. In the current investigation, the 480 m location was the only one observed to be ≥5 dB above background levels (6 dB at 3 m/s and 7 dB at 6 m/s).
Conclusion
Data from the current investigation indicate that wind turbines produce noise that is broad-band in nature, which includes energy within the IS and LFN spectrums. Based on the data presented here, the indoor IS component of wind turbine noise measured as dB(G) at distances of 450 and 900 m, was well below the levels of human perception (54), providing further support to previous reports (39, 41–45, 81). IS is produced at levels comparable or greater than those shown here by natural and engineered sources (43, 81). There is no scientific evidence to indicate that exposure at these G-weighted levels of IS can directly impact human health. Recent studies have indicated that psychological factors (12, 13) and the manner in which information is presented from media reports and non-scientific sources may influence the perception and expectations associated with wind turbine sounds (82). These reports suggest that subjective variables may be a more likely etiology for self-reported effects than from exposure to IS associated with normal wind turbine operation.
The LFN analysis showed that when the turbines were both on and off sounds above 40–50 Hz exceeded the threshold for auditory perception as defined by ISO 226:2003 (71). A clear contribution from the operation of the wind turbines was only observed at the closest location of 480 m when compared to background levels. Increases in LFN observed between 100 and 200 Hz corresponded to increases in overall sound measures reported in dB(A). The use of alternative sound weightings [i.e., dB(C)] may have utility in instances where there are significant increased levels of LFN, particularly when a tonal component is present. However, the results from the current investigation indicate that increases in LFN associated with wind turbine operation are correlated with increases in overall sound levels. These results, in conjunction with those of previous reports, suggest that controlling for overall sound levels produced by normally operating wind turbines will inherently control for LFN (38, 48, 77). The results reported here are in agreement with a recent report issued by Health Canada, which concluded that following over 4,000 h of wind turbine noise measurements, there was “no additional benefit in assessing LFN as C- and A-weighted levels were so highly correlated (r = 0.94) that they essentially provided the same information” (50). Given the low levels of IS and the correlation between LFN and overall sound levels from wind turbines, the development and enforcement of suitable outdoor guidelines and limits, based on dB(A), provide an effective means to evaluate, monitor, and protect potential receptors.
Author Contributions
All authors contributed equally to the conception and design of the analysis; PA performed the field measurements and analyzed the data; RB wrote the manuscript with contributions from all other authors.
Conflict of Interest Statement
In terms of competing interests (financial and non-financial) the authors work for various consulting firms and have worked with wind power companies. The authors are actively working in the field of wind turbines as environmental health scientists and acoustical engineers. Although we make this disclosure, we wish to reiterate that as independent scientific professionals our views and research are not influenced by these contractual obligations.
Acknowledgments
The authors would like to acknowledge Rebecca Morrison for her help with quality control of the tables.
References
1. World Health Organization (WHO). Energy, sustainable development and health. Fourth Ministerial Conference on Environment and Health. Budapest (2004).
2. Wiser R, Bolinger M. 2012 Wind Technologies Market Report. US Department of Energy (2013). Available from: http://www.windpoweringamerica.gov/pdfs/2012_annual_wind_market_report.pdf
3. Independent Electricity System Operator (IESO). Ontario’s Supply Mix. Available from: http://ieso-public.sharepoint.com/Pages/Ontario%27s-Power-System/Supply-Mix/default.aspx#Wind
4. Wolsink M. Wind power and the NIMBY-myth: institutional capacity and the limited significance of public support. Renew Energy (2000) 21:49–64. doi: 10.1016/S0960-1481(99)00130-5
5. Jobert A, Laborgne P, Mimler S. Local acceptance of wind energy: factors of success identified in French and German case studies. Energy Policy (2007) 35:2751–60. doi:10.1016/j.enpol.2006.12.005
6. Baxter J, Morzaria R, Hirsch R. A case-control study of support/opposition to wind turbines: perceptions of health risk, economic benefits, and community conflict. Energy Policy (2013) 61:931–43. doi:10.1016/j.enpol.2013.06.050
7. McCallum LC, Aslund ML, Knopper LD, Ferguson GM, Ollson CA. Measuring electromagnetic fields (EMF) around wind turbines in Canada: is there a human health concern? Environ Health (2014) 13:9. doi:10.1186/1476-069X-13-9
Pubmed Abstract | Pubmed Full Text | CrossRef Full Text | Google Scholar
8. Knopper LD, Ollson CA. Health effects and wind turbines: a review of the literature. Environ Health (2011) 10:1–10. doi:10.1186/1476-069X-10-78
Pubmed Abstract | Pubmed Full Text | CrossRef Full Text | Google Scholar
9. Pedersen E, Persson Waye K. Perception and annoyance due to wind turbine noise – a dose-response relationship. J Acoust Soc Am (2004) 116:3460–70. doi:10.1121/1.1815091
10. Pedersen E, Persson Waye K. Wind turbine noise, annoyance and self-reported health and well-being in different living environments. Occup Environ Med (2007) 64:480–6. doi:10.1136/oem.2006.031039
Pubmed Abstract | Pubmed Full Text | CrossRef Full Text | Google Scholar
11. Chapman S, St George A. How the factoid of wind turbines causing ‘vibroacoustic disease’ came to be ‘irrefutably demonstrated’. Aust N Z J Public Health (2013) 37:244–9. doi:10.1111/1753-6405.12066
12. Crichton F, Dodd G, Schmid G, Gamble G, Cundy T, Petrie KJ. Can expectations produce symptoms from infrasound associated with wind turbines? Health Psychol (2013) 33:360–4. doi:10.1037/a0031760
Pubmed Abstract | Pubmed Full Text | CrossRef Full Text | Google Scholar
13. Crichton F, Dodd G, Schmid G, Gamble G, Cundy T, Petrie KJ. The power of positive and negative expectations to influence reported symptoms and mood during exposure to wind farm sound. Health Psychol (2013) 33:1588–92. doi:10.1037/hea0000037
Pubmed Abstract | Pubmed Full Text | CrossRef Full Text | Google Scholar
14. Ellenbogen JM, Grace S, Heiger-Bernays W, Manwell J, Mills D, Sullivan K, et al. Wind Turbine Health Impact Study: Report of Independent Expert Panel. Boston, MA: Massachusetts Department of Environmental Protection (MassDEP) and Massachusetts Department of Public Health (MDPH) (2012). Available from: http://www.mass.gov/eea/docs/dep/energy/wind/turbine-impact-study.pdf
15. Merlin T, Newton S, Ellery B, Milverton J, Farah C. Systematic Review of the Human Health Effects of Wind Farms. Canberra, ACT: National Health and Medical Research Council (2013). Available from: https://www.nhmrc.gov.au/_files_nhmrc/publications/attachments/eh54_systematic_review_of_the_human_health_effects_of_wind_farms_december_2013.pdf
16. Knopper L, Ollson CA, McCallum L, Whitfield Aslund M, Berger RG, Souweine K, et al. Wind turbines and human health. Front Public Heath (2014) 2:63. doi:10.3389/fpubh.2014.00063
17. World Health Organization (WHO). Night Noise Guidelines for Europe. Copenhagen: The Regional Office for Europe of the World Health Organization (2009). Available from: http://www.euro.who.int/__data/assets/pdf_file/0017/43316/E92845.pdf
18. New South Wales Planning and Infrastructure. NSW Planning Guidelines: Wind Farms. Draft for Consultation. Sydney, NSW: NSW Department of Planning and Infrastructure (2011). Available from: http://www.planning.nsw.gov.au/LinkClick.aspx?fileticket=5yeY6yw_wRE%3d&tabid=205&mid=1081&language=en-AU
19. South Australia Environmental Protection Authority. Wind Farms Environmental Noise Guidelines. Adelaide, SA: Environmental Protection Authority (2009). Available from: http://www.epa.sa.gov.au/xstd_files/Noise/Guideline/windfarms.pdf
20. Western Australian Planning Commission. Guidelines for Wind Farm Development. Perth, WA: Department for Planning and Infrastructure (2004). Report No. 67. Available from: http://www.planning.wa.gov.au/dop_pub_pdf/pb67May04.pdf
21. Haugen KMB. International Review of Policies and Recommendations for Wind Turbine Setbacks from Residences: Setbacks, Noise, Shadow Flicker, and Other Concerns. St. Paul, MN: Minnesota Department of Commerce (2011). Available from: http://mn.gov/commerce/energyfacilities/documents/International_Review_of_Wind_Policies_and_Recommendations.pdf
22. Department of Planning and Community Development. Policy and Planning Guidelines for Development of Wind Energy Facilities in Victoria. Melbourne, VIC: Victorian Government Department of Planning and Community Development (2012). Available from: http://www.dtpli.vic.gov.au/__data/assets/pdf_file/0009/231768/Policy-and-planning-guidelines-for-development-of-wind-energy-facilities-in-Victoria-July-2012.pdf
23. New Zealand Wind Energy Association. The New Zealand Wind Farm Noise Standard. Wellington: The New Zealand Wind Energy Association (2010). Available from: http://www.windenergy.org.nz/store/doc/NZ_WindFarm_Noise_Standard.pdf
24. Alberta Utilities Commission. Rule 012: Noise Control (2013). Available from: http://www.auc.ab.ca/rule-development/noise-control/Pages/default.aspx
25. Ministry of Forests, Lands and Natural Resource Operations, Ministry of Energy, Mines and Natural Gas, Environmental Assessment Office. Best Practice for Wind Power Project Acoustic Assessment British Columbia. Vancouver, BC: Ministry of Forests, Lands and Natural Resource Operations (2012). Available from: http://www.for.gov.bc.ca/land_tenures/tenure_programs/programs/windpower/bmp_wind_acoustic.pdf
26. Manitoba Intergovernmental Affairs. Land use Planning for Wind Energy Systems in Manitoba. Winnipeg, MB: EDS Consulting (2009). Available from: http://www.gov.mb.ca/ia/plups/MobilePages/pdf/weg.pdf
27. New Brunswick Department of Energy. Model Wind Turbine Provisions and Best Practices for New Brunswick Municipalities, Rural Communities and Unincorporated Areas (2008). Available from: http://www2.gnb.ca/content/dam/gnb/Departments/en/pdf/Publications/NBwindEnergy.pdf
28. Ontario Ministry of the Environment (MOE). Noise Guidelines for Wind Farms (2008). Available from: https://dr6j45jk9xcmk.cloudfront.net/documents/1683/164-noise-guidelines-for-wind-farms-en.pdf
29. Danish Ministry of the Environment. Bekendtgørelse Om Støj Fra Vindmøller (Statutory Order on Noise from Wind Turbines). Copenhagen: Danish Environmental Protection Agency (2011). Report No. Bekendtgørelse nr. 1284. Available from: http://eng.mst.dk/media/mst/66206/engelsk_vindmoellebekendtgoerelse.pdf
30. Germany Bundesministerium der Justiz. Technische Anleitung Zum Schutz Gegen Lärm (TA Lärm) [Sixth General Administrative Provision on the Federal Pollution Control Act (Technical Instructions on Noise Abatement: Noise TA)]. Federal Law Gazette I (2000). Available from: http://www.umweltbundesamt.de/sites/default/files/medien/pdfs/talaerm_en.pdf
31. Department of the Environment, Heritage and Local Government. Proposed Revisions to Wind Energy Development Guidelines 2006 Targeted Review in Relation to Noise, Proximity and Shadow Flicker. Dublin: Department of the Environment, Community and Local Government (2013). Available from: http://www.environ.ie/en/Publications/DevelopmentandHousing/Planning/FileDownLoad,34769,en.pdf
32. Barclay C. Wind Farms – Distance from Housing. London: House of Commons Library, UK Parliament (2012). Report No. SN/SC/5221. Available from: http://www.parliament.uk/briefing-papers/sn05221.pdf
33. Joshi S, Douglas JP, Hamberg A, Teshale S, Cain D, Early-Alberts J. Strategic Health Impact Assessment on Wind Energy Development in Oregon. Salem, OR: Public Health Division, Oregon Health Authority (2013). Available from: https://public.health.oregon.gov/HealthyEnvironments/TrackingAssessment/HealthImpactAssessment/Documents/Wnd%20Energy%20HIA/Wind%20HIA_Final.pdf
34. Geiger SS, Patch DL. New Hampshire Site Evaluation. Groton Wind (2010). Report No. Docket No. 2010. Available from: http://iberdrolarenewables.us.files.s3.amazonaws.com/pdf/groton-wind-SEC-application-032610.pdf
35. The State of Maine. Rule Chapters for the Department of Environmental Protection. The State of Maine (2014). Report No. Chapter 375. Available from: http://www.maine.gov/sos/cec/rules/06/chaps06.htm
36. Salt AN, Hullar TE. Responses of the ear to low frequency sounds, infrasound and wind turbines. Hear Res (2010) 268:12–21. doi:10.1016/j.heares.2010.06.007
Pubmed Abstract | Pubmed Full Text | CrossRef Full Text | Google Scholar
37. Salt AN, Kaltenbach JA. Infrasound from wind turbines could affect humans. Bull Sci Technol Soc (2011) 31:296–302. doi:10.1177/0270467611412555
Pubmed Abstract | Pubmed Full Text | CrossRef Full Text | Google Scholar
38. Møller H, Pedersen CS. Low-frequency noise from large wind turbines. J Acoust Soc Am (2011) 129:3727–44. doi:10.1121/1.3543957
Pubmed Abstract | Pubmed Full Text | CrossRef Full Text | Google Scholar
39. Leventhall G. Infrasound from wind turbines-fact, fiction or deception. Can Acoust (2006) 34:29–36.
40. Persson Waye K, Öhrström E. Psycho-acoustic characters of relevance for annoyance of wind turbine noise. J Sound Vib (2002) 250:65–73. doi:10.1006/jsvi.2001.3905
41. Boczar T, Malec T, Wotzka D. Studies on infrasound noise emitted by wind turbines of large power. Acta Phys Pol A (2012) 122:850–3.
42. O’Neal RD, Hellweg RD Jr, Lampeter RM. Low frequency noise and infrasound from wind turbines. Noise Control Eng J (2011) 59:135–57. doi:10.3397/1.3549200
43. Turnbull C, Turner J, Walsh D. Measurement and level of infrasound from wind farms and other sources. Acoust Aust (2012) 40:45–50.
44. Evans T, Cooper J, Lenchine V. Infrasound Levels near Wind Farms and in Other Environments. Adelaide, SA: South Australian EPA and Resonate Acoustics (2013). Available from: http://www.epa.sa.gov.au/xstd_files/Noise/Report/infrasound.pdf
45. Evans T. MacArthur Wind Farm – Infrasound & Low Frequency Noise. Adelaide, SA: Resonate Acoustics and AGL Energy Limited (2013). Report No. A12130. Available from: http://www.agl.com.au/~/media/AGL/About%20AGL/Documents/How%20We%20Source%20Energy/Wind%20Environment/Macarthur%20Wind%20Farm/Assessment%20and%20Reports/2013/July/130724_Resonate%20Acoustics%20MWF%20infrasound%20report.pdf
46. Evans T, Cooper J, Lenchine V. Low Frequency Noise Near Windfarms and in Other Environments. Adelaide, SA: South Australian Environment Protection Authority, Resonate Acoustics (2013). Available from: http://www.epa.sa.gov.au/xstd_files/Noise/Report/low_frequency.pdf
47. Bolin K, Bluhm G, Eriksson G, Nilsson ME. Infrasound and low frequency noise from wind turbines: exposure and health effects. Environ Res Lett (2011) 6:035103. doi:10.1088/1748-9326/6/3/035103
48. van den Berg F. Wind turbine noise: an overview of acoustical performance and effects on residents. Proceedings of Acoustics, Victor Harbor, SA (2013).
49. Sloven P. LFN and the A-weighting. J Low Freq Noise V A (2005) 24:157–62. doi:10.1260/026309205775374389
50. Health Canada. Wind Turbine Noise and Health. The Government of Canada (2014). Available from: http://www.hc-sc.gc.ca/ewh-semt/noise-bruit/turbine-eoliennes/summary-resume-eng.php
51. Ambrose S, Rand R, Krogh C. Wind turbine acoustic investigation: infrasound and low-frequency noise – a case study. Bull Sci Technol Soc (2012) 32:128–41. doi:10.1177/0270467612455734
52. Richarz W, Richarz H, Gambino T. Correlating very low frequency sound pulse to audible wind turbine sound. Fourth International Meeting on Wind Turbine Noise. Rome (2011).
53. Tachibana H, Yano H, Fukushima A. Assessment of wind turbine noise in immission areas. Proc. 5th International Conference on Wind Turbine Noise. Denver, CO (2013).
54. Watanabe T, Møller H. Low frequency hearing thresholds in pressure field and in free field. J Low Freq Noise V A (1990) 9:106–15.
55. Evans T, Cooper J. Comparison of predicted and measured wind farm noise levels and implications for assessments of new wind farms. Acoust Aust (2012) 40:28–36.
56. Howe Gastmeier Chapnik Limited. Low Frequency Noise and Infrasound Associated with Wind Turbine Generator Systems: A Literature Review. Toronto, ON: Ontario Ministry of the Environment (2010). Report No. OSS-078696. Available from: http://www.ontario.ca/environment-and-energy/low-frequency-noise-and-infrasound-associated-wind-turbine-generator-systems
57. Roberts C. Ecoaccess guideline for the assessment of low frequency noise. Acoustics 2004. Gold Coast, QLD (2004).
58. Jakobsen J. Danish guidelines on environmental low frequency noise, infrasound and vibration. J Low Freq Noise V A (2001) 20:141–8. doi:10.1260/0263092011493091
59. Kamigawara K, Yue J, Saito T, Hirano T. Publication of “handbook to deal with low frequency noise (2004)”. J Low Freq Noise V A (2006) 25:153–6. doi:10.1260/026309206778494292
60. Rand RW, Ambrose SE, Krogh CM. Occupational health and industrial wind turbines: a case study. Bull Sci Technol Soc (2011) 31:359–62. doi:10.1177/0270467611417849
61. Walker BW, Hessler GF, Hessler DM, Rand R, Schomer PA. Cooperative Measurement Survery and Analysis of Low Frequency and Infrasound at the Shirley Wind Farm in Brown County, Wisconsin. Public Service Commission of Wysconsin (2012). Report No. 122412-1. Available from: http://psc.wi.gov/apps35/ERF_view/viewdoc.aspx?docid=178263
62. Pierpont N. Wind Turbine Syndrome: A Report on a Natural Experiment. Santa Fe, NM: K-Selected Books (2009).
63. Dommes E, Bauknecht H, Scholz G, Rothemund Y, Hensel J, Klingebiel R. Auditory cortex stimulation by low-frequency tones – an fMRI study. Brain Res (2009) 1304:129–37. doi:10.1016/j.brainres.2009.09.089
Pubmed Abstract | Pubmed Full Text | CrossRef Full Text | Google Scholar
64. Goerke V, Woodward M. Infrasonic observation of a severe weather system. Mon Weather Rev (1966) 94:395–8. doi:10.1175/1520-0493(1966)094<0395:IOOASW>2.3.CO;2
65. Goerke V, Young J, Cook R. Infrasonic observations of the May 16, 1963, volcanic explosion on the Island of Bali. J Geophys Res (1965) 70:6017–22. doi:10.1029/JZ070i024p06017
66. Wilson CR. Infrasonic pressure waves from the aurora: a shock wave model. Nature (1967) 216:131–3. doi:10.1038/216131a0
67. Bedard A Jr. Infrasound originating near mountainous regions in Colorado. J Appl Meteorol (1978) 17:1014–22. doi:10.1175/1520-0450(1978)017<1014:IONMRI>2.0.CO;2
68. Leventhall G, Pelmear P, Benton S. A Review of Published Research on Low Frequency Noise and its Effects. London: Department for Environment, Food and Rural Affairs (2003). Report No. EPG 1/2/50. Available from: http://westminsterresearch.wmin.ac.uk/4141/1/Benton_2003.pdf
69. Yuan H, Long H, Liu J, Qu L, Chen J, Mou X. Effects of infrasound on hippocampus-dependent learning and memory in rats and some underlying mechanisms. Environ Toxicol Pharmacol (2009) 28:243–7. doi:10.1016/j.etap.2009.04.011
Pubmed Abstract | Pubmed Full Text | CrossRef Full Text | Google Scholar
70. Berglund B, Hassmen P, Job RS. Sources and effects of low-frequency noise. J Acoust Soc Am (1996) 99:2985–3002. doi:10.1121/1.414863
Pubmed Abstract | Pubmed Full Text | CrossRef Full Text | Google Scholar
71. International Organization for Standardization (ISO). ISO 226:2003. Acoustics – Normal Equal-Loudness Level Contours. 2nd ed. Geneva: ISO (2003).
72. Botha P. Ground vibration, infrasound and low frequency noise measurements from a modern wind turbine. Acta Acust United Acust (2013) 99:537–44. doi:10.3813/AAA.918633
73. Tachibana H, Yano H, Fukushima A, Sueoka S. Nationwide field measurements of wind turbine noise in Japan. Noise Control Eng J (2014) 62:90–101. doi:10.3397/1/376209
74. Mirowska M. Evaluations of low-frequency noise in dwelling. New polish recommendations. J Low Freq Noise V A (2001) 20:67–74. doi:10.1260/0263092011493163
75. Jakobsen J. Danish regulation of low frequency noise from wind turbines. J Low Freq Noise V A (2012) 31:239–46. doi:10.1260/0263-0923.31.4.239
76. Moorhouse A, Waddington D, Adams M. Proposed Criteria for the Assessment of Low Frequency Noise Disturbance. London: Department for Environment, Food and Rural Affairs (2005). Report No. NANR45. Available from: http://archive.defra.gov.uk/environment/quality/noise/research/lowfrequency/documents/nanr45-criteria.pdf
77. Parnell J. Development of the draft NSW planning guidelines: wind farms. Acoust Aust (2012) 40:79–83.
79. Broner N, Leventhall H. Low frequency noise annoyance assessment by low frequency noise rating (LFNR) curves. J Low Freq Noise V A (1983) 2:20–8.
80. Broner N. A simple criterion for low frequency noise emission assessment. Acoust Aust (2011) 39:7–14.
81. Leventhall G. Concerns about infrasound from wind turbines. Acoust Today (2013) 9:30–8. doi:10.3389/fpubh.2014.00220
Pubmed Abstract | Pubmed Full Text | CrossRef Full Text | Google Scholar
Keywords: wind turbines, infrasound, low-frequency noise, health, human perception, noise, sound pressure level, annoyance
Citation: Berger RG, Ashtiani P, Ollson CA, Whitfield Aslund M, McCallum LC, Leventhall G and Knopper LD (2015) Health-based audible noise guidelines account for infrasound and low-frequency noise produced by wind turbines. Front. Public Health 3:31. doi: 10.3389/fpubh.2015.00031
Received: 02 December 2014; Accepted: 06 February 2015;
Published online: 24 February 2015.
Edited by:
Keith L. Keene, East Carolina University, USAReviewed by:
Timothy Joe Wade, United States Environmental Protection Agency, USABrian Howe, Howe Gastmeier Chapnik Limited, Canada
Copyright: © 2015 Berger, Ashtiani, Ollson, Whitfield Aslund, McCallum, Leventhall and Knopper. This is an open-access article distributed under the terms of the Creative Commons Attribution License (CC BY). The use, distribution or reproduction in other forums is permitted, provided the original author(s) or licensor are credited and that the original publication in this journal is cited, in accordance with accepted academic practice. No use, distribution or reproduction is permitted which does not comply with these terms.
*Correspondence: Loren D. Knopper, Intrinsik Environmental Sciences Inc., 6605 Hurontario Street, Suite 500, Mississauga, ON L5T 0A3, Canada e-mail: lknopper@intrinsik.com