Image Classification to Support Emergency Situation Awareness
 Ryan Lagerstrom1*
 Yulia Arzhaeva1
Piotr Szul2
Yulia Arzhaeva1
Piotr Szul2
 Oliver Obst1,3
 Robert Power4
 Bella Robinson4
  Tomasz Bednarz2,5
- 1Data 61, Commonwealth Scientific and Industrial Research Organization, Marsfield, NSW, Australia
- 2Data 61, Commonwealth Scientific and Industrial Research Organization, Dutton Park, QLD, Australia
- 3School of Computing, Engineering, and Mathematics, University of Western Sydney, Paramatta, NSW, Australia
- 4Data 61, Commonwealth Scientific and Industrial Research Organization, Acton, ACT, Australia
- 5Science and Engineering Faculty, Queensland University of Technology, Brisbane, QLD, Australia
Recent advances in image classification methods, along with the availability of associated tools, have seen their use become widespread in many domains. This paper presents a novel application of current image classification approaches in the area of Emergency Situation Awareness. We discuss image classification based on low-level features as well as methods built on top of pretrained classifiers. The performance of the classifiers is assessed in terms of accuracy along with consideration to computational aspects given the size of the image database. Specifically, we investigate image classification in the context of a bush fire emergency in the Australian state of NSW, where images associated with Tweets during the emergency were used to train and test classification approaches. Emergency service operators are interested in having images relevant to such fires reported as extra information to help manage evolving emergencies. We show that these methodologies can classify images into fire and not fire-related classes with an accuracy of 86%.
Introduction
In times of crisis, it is increasingly common for the public to use social media to broadcast their needs, propagate news, and stay abreast of evolving situations (Landwehr and Carley, 2014). Situation awareness during disaster management and emergency response is an evolving area for research. In this context, situation awareness relates to picking up sensory cues from the environment, interpreting said cues, and forecasting what may occur (Endsley, 1995). The ubiquity of social media platforms presents an opportunity to harness developing information to improve situation awareness for management and response teams.
With advances in natural language processing (NLP) technologies, attention has been given to research and development for extracting relevant information from streaming data such as Twitter. For example, Sen (2015) investigates finding tweets that do not reflect user sentiment using NLP. Varga et al. (2013) propose methods for matching problem reports to aid messages while Tweet4Act (Chowdhury et al., 2013) filters for irrelevant tweets. Power et al. (2014) have developed a system for processing large volumes of Twitter data using language models to identify Tweets of interest to emergency managers.
An aspect of social media in relation to disaster management, which has so far received little attention, is images. Images have the potential to provide new insights on top of the text-derived intelligence in tweets, giving a rich and contextual information stream in crisis situations. For example, images of fires provide an immediate cue to crisis coordinators about an event allowing them to react appropriately. Images provide a less ambiguous insight into a situation compared to subjective textual descriptions. An image can show the size of the fire and also provide clues to environmental conditions such as weather conditions and the potential fuel load in the vicinity.
To our knowledge, most social media monitoring tools currently in use for emergency management purposes target images based on the text associated with them. While this is often the case, we wanted to investigate if the images could be processed directly without relying on the associated text to identify high value images depicting fire events. The contribution provided by this paper is the application of well-known state-of-the-art image classification approaches in a new field, namely, that of Emergency Situation Awareness (ESA).
This paper is organized as follows. First, we present background information describing the task of situation awareness for emergency events. We then provide examples of how this is currently being addressed and describing issues in image classification. A motivating case study is then presented, which includes a description of the images collected from Twitter relating to a bush fire in Australia that we have used in our work. We then outline the image classification approaches we have investigated including details of their implementation using the Spark framework. We have also examined a classification approach that utilizes a pretrained deep neural network-based classifier. We conclude with a discussion of the results comparing the four classification approaches examined.
Background
Emergency Situation Awareness
In Australia, the State and Territory governments are responsible for emergency management and coordination during crisis events. Agencies such as the New South Wales Rural Fire Service (NSW RFS) and the Victorian Country Fire Authority are responsible for managing bushfires in rural areas. These agencies have map-based web sites showing warnings and advice concerning fire events in progress. The information reported includes the fire alert level, the location, the severity, its status (for example, “contained” or “out of control”), when an update was last reported, and details of the response activities underway and sometimes specific advice for those in harm’s way.
The usefulness of information obtained from the public is recognized by the various fire agencies. The adoption of social media in our society is an opportunity for emergency managers to utilize this new communication channel as a source of situational awareness during crises events. However, to date, this opportunity is not fully realized due to a number of factors. For example, a survey of U.S. public sector emergency managers (Hiltz et al., 2014) identified the following issues as the main barriers to using social media: limited personal time to work on social media; lack of organizational policies and guidelines for social media use; and concern over trustworthiness of social media data. Our work aims to address the trustworthiness issue for large-scale fire emergencies and to develop tools that help users quickly identify relevant social media content.
As reported in Power et al. (2015), we undertook a requirements gathering exercise in collaboration with the NSW RFS to better understand how they would like to use social media to gather evidence of fire events from the general community. A significant requirement was the ability to find relevant “high value” images such as those with smoke plumes. This collaboration led to the customization of our ESA tool (Power et al., 2014) that provides all-hazard situation awareness information for emergency managers using content gathered from Twitter. This preliminary work was based on our earlier attempts at identifying images of interest, which relied on filtering the tweet message text using keywords and machine learning text classifiers (Power et al., 2013). The aim was to identify relevant images to help overcome the trustworthiness issue mentioned above. If there is an image to support the description of a fire underway, it improves the credibility of the information. These images may also provide useful information to the fire responders by assessing the color of the smoke, the extent of plume, and the possible speed of the fire, as well as providing evidence of the wind speed and direction.
This became out next task: how to identify such “high value” images that are relevant to users in these fire agencies. The current tool relied on the user associating descriptive text with their images. Now, we wanted to explore if the images themselves could be processed so that we do not have to rely on the text descriptions.
Related Work
There are other social media monitoring tools similar to our ESA platform. Some are focused on specific disaster types, such as earthquakes (Sakaki et al., 2013; Avvenuti et al., 2014), floods (Holderness et al., 2015), small-scale incidents such as car accidents, urban fires, or shootings (Schulz et al., 2013), or are similar to ESA in that they detect and monitor different disaster events or crisis management issues (Terpstra et al., 2012; Chowdhury et al., 2013). They are also not all based on Twitter. Some make use of other social media sources, such as Facebook, YouTube, Instagram, and Flickr.
Fundamental to realizing the potential of identifying “high value” images is the ability to understand the content of an image using an automated process. Image classification is a topic receiving considerable attention in the machine learning and computer vision communities. New methods are being developed to solve problems in many application areas, such as biomedical imaging (Zhang et al., 2015, 2016), biometry (Gaoa et al., 2015), video surveillance (Chamasemani and Affendey, 2013), remote sensing (Al-doski et al., 2013), and industrial inspection (Jaffery and Dubey, 2016). One of the key outputs of an image classification system is a class label for an image. To achieve this output, a system would typically need to automatically extract a feature set from an image and use a machine learning algorithm, developed on test data, to determine such a class. Typical image features describe color, texture, or shape and can be represented at global, block-based, or region-based levels. Tian (2013) provides a review of the current state of feature extraction and representation techniques. Following on from the development of a feature set, numerous classification techniques can be employed in a supervised machine learning framework (Kotsiantis, 2007). Deep learning (Schmidhuber, 2015) has underpinned many recent advances in image classification. There is a growing body of deep neural network architectures for image classification being made available. Among them are pretrained classifiers that can be employed to classify images via a web browser. These classifiers are trained on enormous image databases, such as ImageNet (Deng et al., 2009), and can provide a viable alternative to developing one’s own classifier on an image dataset.
With the growing attention given to image classification, many cutting edge approaches are being made available to practitioners in a variety of languages and environments. The OpenCV library of computer vision tools has, among other approaches, a guide to implementing a cascade of boosted classifiers working with Haar-like features (Dawson-Howe, 2014). VLFeat is another open source computer vision library written in C, which makes available an image classification approach based on visual word dictionaries and support vector machines (SVMs) (Vedaldi and Fulkerson, 2008). DLib is a C++ machine learning library, which can perform image classification using a histogram of gradients approach (King, 2009). Furtado et al. (2010) have developed a genetic algorithm approach to image classification within the Matlab environment. The combination of sci-kit learn (Pedregosa et al., 2011) and skimage (van der Walt et al., 2014) libraries for the Python language also underpins a number of implementations of image classification approaches. For example, Keras provides a convolutional neural network approach (Chollet, 2015) while (He et al., 2015) present a deep residual learning framework. Indeed, deep learning frameworks are becoming widely available for image classification problems, such as Caffe (Jia et al., 2014) and Tensorflow (Abadi et al., 2015). Along with providing the framework to carry out deep learning approaches directly on a practitioners own image data set, these frameworks also offer pretrained classifiers. These are trained on massive image data bases containing thousands of different objects. A user simply needs to feed an image to the classifier to receive a predicted label or labels.
The following pieces of work relate to the use of images for ESA and highlight the lack of research in this area. Yang et al. (2011) describe a multi-source data fusion approach to crisis situation reporting. One component of the approach involves image classification via low- and mid-level feature extraction followed by multiple correspondence analysis. They establish their framework by classifying Flickr images into one of two subcategories, such as sea grass damage versus death to animals, within the crisis context of an oil spill. Peters and Albuquerque (2015) establish that the presence of images in crisis-related messages or tweets is an indicator of geographical proximity to the event. They postulate that the existence of an image could be used as a proxy for relevance to improve situational awareness. Data from social media sources during a flooding event are used in this study. Ilyas (2014) presents a system designed to take advantage of image data by scraping tweets and the links therein for images and then using machine learning to classify them. They use color histograms and Haralick features (Haralick et al., 1973) on segments in each image. The features are then used to discriminate between images containing or not containing damage from hurricanes using Naive Bayes and SVMs.
Our research investigates the use of a state-of-the-art image classification scheme based on the Pyramid Histogram of Words (PHoW) (Lazebnik et al., 2006) features along with SVMs. We detail how this can be employed on a large database of images in a useful time frame using Apache Spark (Zaharia et al., 2010), an open source cluster computing framework. We also contrast this to the use of a pretrained image classification scheme developed on the ImageNet database. Results are reported for a 5975 strong image database developed around images associated with Australian bush fires.
Preliminary Work
Case Study
Our investigation into image classification methodologies has been chiefly motivated by work done by Power et al. (2015), who developed a monitoring system for tracking tweets describing fire events. Their work presents a case study of a bush fire event in NSW, Australia, which occurred in October of 2013. During this time, there were over 100 active fires in NSW. During this study, it was identified that images were a potentially highly valuable source of information. Being able to identify images that are related to fire in an automated fashion would be an important capability within their monitoring system.
Data
The authors gathered all the tweets published in NSW during October 2013 and examined this content to determine if there was useful information relating to the fires in the Blue Mountains region. This included searching for tweets that contained fire-related keywords (such as “fire” or “smoke”), focusing on a specific geographic region of interest, ignoring retweets, and manually inspecting the content found. The authors were then able to identify 6214 such tweets, which also had an associated image. Duplicate images were then removed. These images were then manually inspected and placed into two groups: “fire” or “not-fire” based on their potential usefulness to emergency services in the event of a bushfire. This labeling process was undertaken by first deciding what constitutes a relevant fire image. The criteria used was that at least one of the following features had to be present: flames (bush or grass fire with visible flames, house, other structure or vehicle fire, or flames at night), smoke (smoke plume or haze), firefighting response (firefighting personnel and equipment such as planes, helicopters, and trucks), or burnt remains (house, structure, vehicle, or bushland). The result was a collection of 3851 fire-related images and 2124 not related to a fire, giving a total of 5975 images. Examples are shown in Figure 1 below.
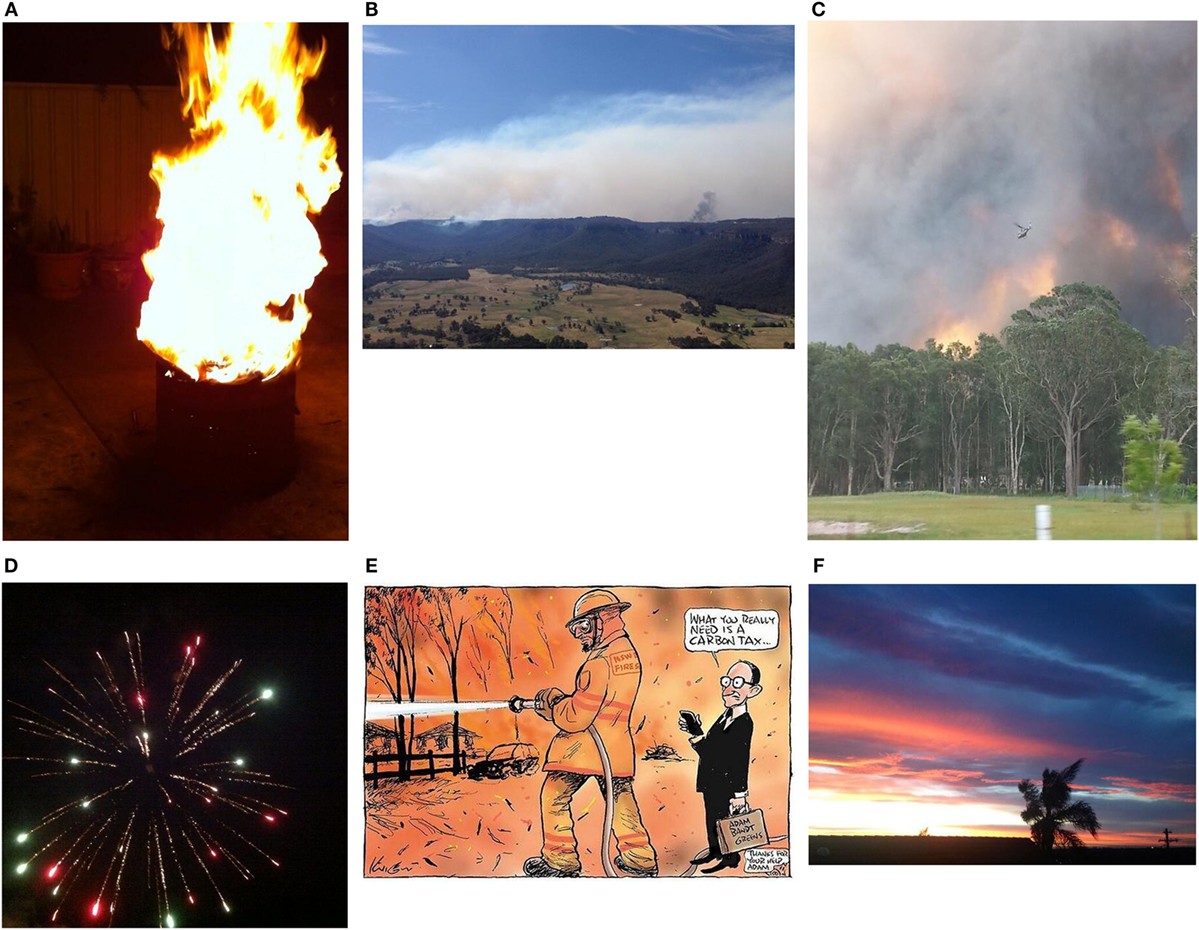
Figure 1. Various images from our database compiled from fire-related tweets. Images (A–C) are manually grouped into a “fire” category, while (D–F) are “not-fire” images based on their potential usefulness to emergency services. The tweets for these images can be found at: http://twitter.com/NoobNelson/statuses/385693129984061440; http://twitter.com/auxesis/statuses/391778476933410816; http://twitter.com/KAZMAC2/statuses/391772236866019330; http://twitter.com/FireworksSydney/statuses/391774856175312896; http://twitter.com/waxinggibberish/statuses/391807106220687360; and http://twitter.com/JoYohana/statuses/391003278411968512.
Methodology
This section details the image classification approaches we have investigated in the context of image-based situational awareness. First, we present an image classifier based on the PHoW feature space combined with a SVM classifier. Second, we discuss how this classifier was implemented using the Spark framework given the need to rapidly build models in the face of a developing crisis. Lastly, we describe a classification approach that utilizes a deep neural network-based classifier, which is pretrained on an enormous image database. Our intention in exploring these methodologies was to assess how a classifier based on low-level image features compares to that of a pretrained classifier, in the context of the database of images discussed above.
PHoW with SVMs
To describe this approach, we begin by describing the scale-invariant feature transform (SIFT) (Lowe, 2004). SIFT is a means for detecting and characterizing localized areas in images and is invariant to scale and orientation. The feature descriptor for a point of interest in an image is built up from histograms of local gradient directions. Sixteen histograms, with 8 bins each, are computed for each point, giving a feature vector of length 128. Points of interest can be automatically detected, but for this implementation, we sample the image at regular intervals in a grid formation. This is referred to as the dense SIFT feature set for an image.
Pyramid Histogram of Words is an extension on Bag of Words (BoW) models (Salton and McGill, 1983). A BoW for a document, in the context of language processing, is a sparse vector containing the frequencies of the document’s words over all the words in the dictionary. An analogous representation can be built for images. Image features are first extracted and can be thought of as words. A dictionary is then built by clustering all of the features over the collection of images. For BoW, the image features are the dense SIFT feature set described above. The assembly of dense SIFT features over a collection of images is then clustered using the k-means approach to create a dictionary. The need for clustering to form a dictionary, as opposed to simply using the whole collection, is that features are often numerically unique. The BoW features can now be determined by calculating the frequencies of feature sets in an image over the dictionary, which simply amounts to cluster membership. This gives us an indication of whether and how often a particular feature occurs in an image. However, we have lost the spatial context of the particular feature. PHoW seeks to address this issue by computing the BoW features for image segments over multiple spatial scales. The method partitions an image into increasingly fine segments. The BoW features can then be calculated for each of the local segments and finally concatenated to form the PHoW feature for the image. The final stage of the approach is classification based on the PHoW feature sets. For this, we employ L2-loss linear SVMs as a reasonable approach to a large-scale classification with sparse data.
The choice in this combination of feature set and classifier was not only motivated by its performance as an image classifier but also its convenient availability within OpenIMAJ (Hare et al., 2011). OpenIMAJ is an open source set of Java libraries and tools for multimedia content analysis and content generation. OpenIMAJ is very broad and contains everything from state-of-the-art computer vision (e.g., SIFT descriptors, salient region detection, face detection, etc.) and advanced data clustering, through to software that performs analysis on the content, layout, and structure of webpages.
Spark
Despite the ease of access to the PHoW with SVMs approach via OpenIMAJ, performance in terms of the time it takes to build a classifier was a serious issue. Initial experiments to build a classifier on a small set of 120 images took in the order of 6 h. This kind of time frame would make operating this kind of methodology in a real world setting useless as classification time scales up with a training sample size. In recent years, a large number of technologies have been developed to enable data-intensive computing, including Apache Spark. Spark originated at the University of Berkeley and is a fast and general engine for large-scale data processing maintained by the Apache Software Foundation. Machine learning algorithms that are employed in image classification are also computationally intensive. Spark lends itself well to machine learning as it supports fast in-memory computing and iterative querying of data. MLlib is Spark’s scalable machine learning library (Meng et al., 2015). It consists of common learning algorithms and utilities, including classification, regression, clustering, collaborative filtering, and dimensionality reduction. Spark, including MLlib, provides APIs in Java, Scala, and Python, which makes it easy to integrate with an existing Java application that utilizes OpenIMAJ for image feature extraction and classification.
A Spark application consists of a driver program that runs the user’s main function and executes various parallel operations on a cluster. The main abstraction that Spark provides is a resilient distributed dataset (RDD), which is a collection of elements partitioned across the nodes of the cluster that can be operated on in parallel. One way to create an RDD is by parallelizing an existing collection in the driver program. Subsequently, operations applied to RDDs are executed on a cluster. RDDs support two types of operations: transformations, which create a new dataset from an existing one, and actions, which return a value to the driver program after running a computation on the dataset. Finally, RDDs can automatically recover from node failures.
We developed a Spark application in Java that implements the image classification approach described above. Most of the OpenIMAJ methods utilized by this approach could not be used straightforwardly in distributed transformations of Spark RDDs as OpenIMAJ objects are not serializable. To overcome this, we created container classes that implement the Serializable interface and encompass instantiation of associated OpenIMAJ classes and calls to their methods. Objects of such container classes could be passed over the network, saved, and restored (deserialized); therefore, they could be used in Spark transformations.
We delegated the data-intensive tasks of loading images and the subsequent extraction of dense SIFT features to a “big data cluster” – a dedicated hardware cluster intended to support big data related research. Its specifications are described in Section “Results” below. In the training phase, MLlib’s k-means clustering was applied to SIFT features extracted from a small, randomly selected subset of the training images. The MLlib implementation is based on a highly scalable version of k-means called scalable k-means++ (Bahamani et al., 2012). The PHOW features were calculated on the cluster as well. BoW features were computed from four non-overlapping image segments and concatenated to form a resulting image feature vector. Finally, all the image feature vectors were returned as an array to the driver program to train an SVM classifier locally. The OpenIMAJ linear SVM is based on LIBLINEAR, which is efficient on large sparse datasets (Fan et al., 2008). We used L2-regularized L2-loss support vector classification with C = 1. After reducing an image to a 1200-element feature vector (given k = 300 in k-means clustering), image classification was not a big data problem anymore, and an overhead cost of using distributed computations would possibly outweigh its gains. However, it should be noted that MLlib contains a distributed implementation of SVM that could be used in place of the local classifier provided the training set is very large.
Pretrained Classifiers
The existence of enormous image databases, such as ImageNet, underpins many advances in image classification technologies. Large volumes of clean, annotated images are excellent data sources for data hungry machine learning approaches to image classification such as deep learning. ImageNet runs an annual challenge in which researchers compete in image classification tasks, with researchers often making available their classifiers to the public in either open or closed format.
We have employed two of these classifiers as components of a solution to our image classification task. In both cases, the classifiers can be executed to provide a number of possible classes or labels for any given input image. The first classifier we discuss is OverFeat (Sermanet et al., 2014). This classifier uses a multiscale, sliding approach within a convolutional network for image detection, localization, and classification tasks. It won the 2013 ImageNet challenge for localization. The source code for the classifier was written is C++ and makes use of the OpenBLAS (Qian et al., 2013) and ImageMagick (Still, 2005) libraries. The source also comes with weights information, which allows the user to classify images with respect to the algorithm trained on the ImageNet database. The second classification framework we assessed was Clarifai (Zeiler et al., 2011). Clarifai is a closed source classifier that is accessed via a web API using Python hooks. The classifier produces 20 possible labels for each input image. Clarifai won the 2013 ImageNet challenge for classification and is trained on both the ImageNet database and extra images curated by its creators.
While these pretrained classifiers return labels that are impressively accurate over a range of images from animals to food, the results that they produce for fire-related images are less than perfect. Executing the classifiers on our database of fire-related images and looking for labels, such as “fire” or “smoke,” yields fairly inaccurate results. For example, Table 1 shows example raw labeling results using Clarifai for the six images in Figure 1. However, given these classifiers return multiple labels per image, we can treat these labels as a feature space for a secondary classifier. One way to construct such a feature space is, for every image, to create a presence/absence vector for each possible label in the classifier (which is of the order of 10,000 labels). This of course would create a lot of redundancy, so we can reduce the dimensionality of such a feature space by retaining those labels which occur in more than q% of the raw labels for each image, in each class (“fire” or “not-fire”). To illustrate, with reference to our fire image database discussed earlier, consider the output of running Clarifai on the whole database. This would result in 20 labels for each of the 5975 images. The “fire” class of images, which has 3851 images, yields 1374 unique labels. The “not-fire” class produces 2267 labels. If we compute the frequency of these labels and retain those which occur in more than q = 5% of the observations for each class, we get 87 labels for “fire” and 81 for “not-fire.” The combined unique set of labels for both classes totals 133. The presence/absence of these unique labels for each image can now form a reduced dimension feature space. The selection of p was determined empirically to be 5% for our methodologies. This was done by assessing the classification accuracy over a range of values and examining at which point the accuracy was significantly compromised by the reduced dimension.
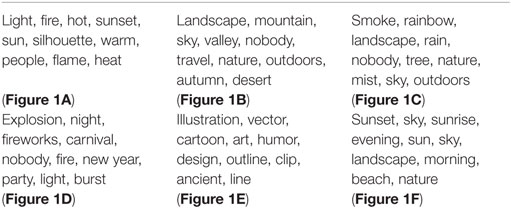
Table 1. First 10 labels produced by Clarifai’s labeling system for the 6 images in Figure 1, respectively.
Now that a suitable feature space has been constructed, a classification algorithm can be employed to derive a class for each image. There exists many such classification schemes to do so, such as linear discriminant analysis, neural networks, SVMs, etc. We opted for using a random forest model due to its good trade-off between accuracy and model interpretability. It was not our intention to assess the relative merits of various classifiers in this context but to show how pretrained classifiers can be adapted to the requirements of the image database presented earlier. In terms of parameter settings for the random forest, the number of trees parameter was set to 500, while the number of variables randomly sampled as candidates at each split was set to 3. We used R’s randomForest library to carry out the classification work at this step (Liaw and Wiener, 2002).
Operationalization
In this section, we describe how the methodology and the technologies presented above can be used to implement an online (streaming) image classification system for the ESA application. The basic assumption is that we can perform the resource intensive task of image tagging (human intensive) and classification model training (compute intensive) offline, and that classification of images with the model is relatively fast and inexpensive and as such suitable for online application.
Figure 2 presents a conceptual architecture of such an implementation. The tweets and related images are captured through Tweeter Public API with the “Tweet and Image Capture” component (which is part of the ESA application) and published to a message queue (in the publish/subscribe model). The “Store Images Consumer” subscribes to incoming images and saves them together with metadata in the “Image Store” for offline processing. Once a sufficient number of images have been collected, a “Human Expert” (or many of them) is invited to label the images as “Fire”/“No fire” using a dedicated “Image Labeling” interface. The labels are saved together with the images. Once a sufficient number of images has been labeled, the “Classifier Training” process is invoked, which builds the classified model and saves its representation to the ESA database. The model can be then used by the “Streaming Image Classifier” consumer, which classifies the incoming stream of images and saves the assigned categories to the ESA database so that they can be used for searches, filtering, and alert generation. This process may be repeated as more labeled images become available to build better models and improve the performance of the classification.
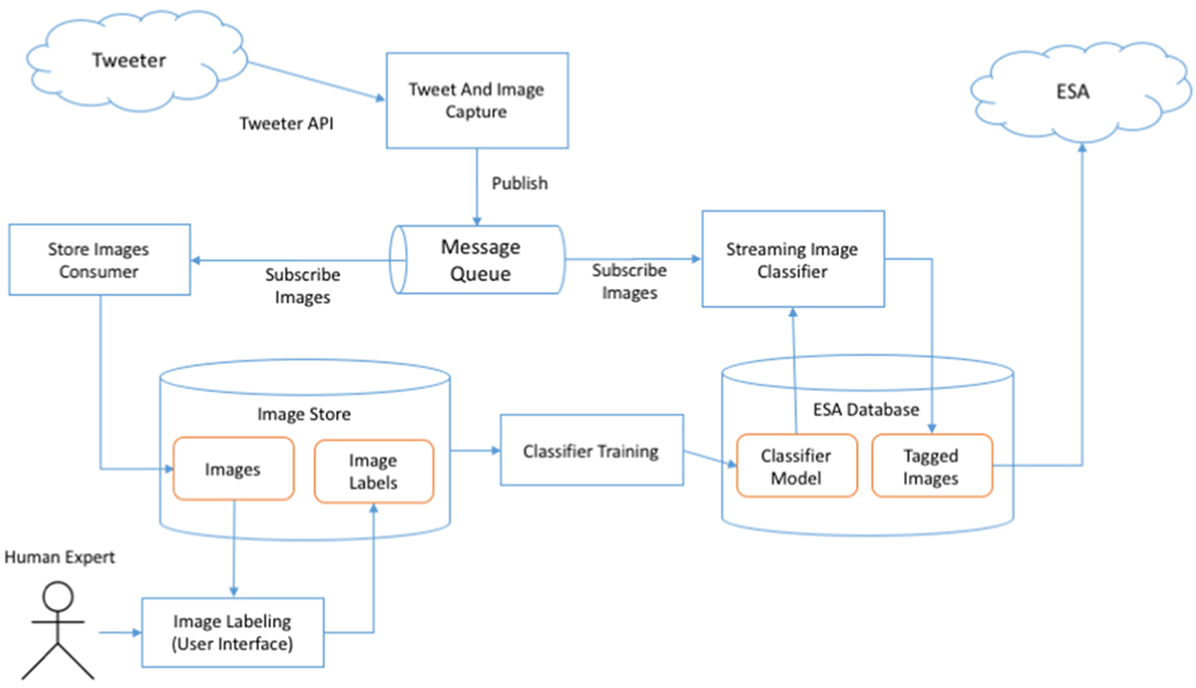
Figure 2. Conceptual architecture of the online image classification system.
The presented concept is very general and can employ the various methods and technologies described earlier. In particular, Apache Spark can be used in both streaming classifier (Spark Streaming) and model training component (Spark Core/Batch). As an example, we also present the conceptual implementation of the “PHoW with SVM” classifier in Figure 3. This diagram closely follows the description of “PHoW with SVM” classifier given in Section “PHoW with SVMs.” For each labeled image from “Image Store,” SIFT features are extracted from multiple local points and together they form an “Image feature set.” Image feature sets are stored in “SIFT Feature space” data store. Once this space is populated, “k-means clustering” is performed in SIFT feature space, and each image is assigned a cluster membership vector. Cluster membership vectors of all participating images form “PHoW Feature space,” on which the SVM Classifier is trained. The output is “Classifier model” that is stored in “ESA Database” to be used for streaming image classification (Figure 2). We have indicated in this diagram that computationally and data-intensive operations could be performed using “big data” technologies.
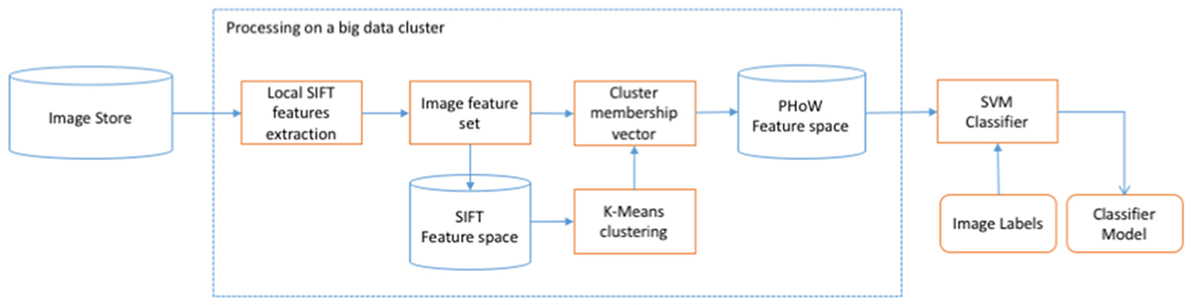
Figure 3. Conceptual implementation of “Classifier training” block with “PHoW with SVM” classifier.
Results
In this section, we discuss the performance of the methodologies outlined with regard to the fire-related image data set described in Section “Data.”
Models
In this section, we report on four different methodologies. First, there are two methods based on the PHoW with SVM approach presented in Section “PHoW with SVMs.” The two methods differ based on their underlying SIFT feature sets in that one uses gray scale only, while the other uses color. We will denote these methods as PHoWG and PHoWC, for the gray scale and color variants of the PHoW with SVM method, respectively. We also report on the two methods based on pretrained classifiers, namely Clarifai and OverFeat, with a random forest second-level classifier, as described in Section “Pretrained Classifiers.” We refer to these as ClarifaiRF and OverFeatRF.
Training and Test Data
Each of the four models was trained on a stratified random sample of 2200 images from our image database described earlier. This gives us 1100 images from each of the “fire” and “not-fire” classes. Results were then reported on a test set derived from a stratified random sample of the remaining images of size 2000, with 1000 images from each class. We chose not to use the whole image database so as to retain a balanced sample from each class in both the training and test sets (note here, we have 2124 “not-fire” images in our database, which is slightly larger than the 2100 “not-fire” images used in our training and test samples).
Computing
All methods were run on the big data cluster that supports Hadoop ecosystem technologies such as MapReduce, YARN, Spark, Pig, Hive, etc. The cluster consists of 14 worker nodes connected with a fast Infiniband network, each featuring 2× Intel Xeon E5-2660@2.20 GHz CPU (8 cores), 128-GB RAM and two additional nodes with the same specification acting as the cluster master and edge node, respectively.
Performance
Performance of the various methodologies is assessed based on both accuracy and speed. We report on recall, precision, accuracy, and F1 score to quantify the correctness of the results (Sammut and Webb, 2011). The speed with which the results are derived is reported in terms of feature computation (per image), training time, and classification time (per image).
These results are summarized in Table 2. With respect to the correctness of classification, the ClarifaiRF methodology achieves the best performance with respect to recall, precision, accuracy, and F1 with scores of 0.915, 0.833, 0.866, and 0.872, respectively. In assessing the relative merits of these approaches, it is useful to bear in mind the context of use. For our data relating to images of bush fires, an emergency services operator would like to be alerted to images from social networks that may contain vital information relating to evolving emergency events. Operationally, this would mean passing images in tweets, which have been assessed as fire related based on their text content, to a classification algorithm. The algorithm would then report that if image is fire related or not. This could help the operator to assess the spread of the fire or if any new outbreaks are occurring. With this use case in mind, one would tend toward accepting more false positive reporting. For this reason, recall may be the most useful measure to consider.
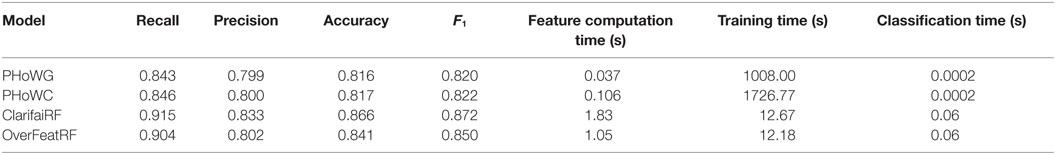
Table 2. Performance results for the four classification approaches.
With respect to the computation time of PHoWG and PHoWC, we have shown that implementing these methods using a distributed technology, such as Spark, notably reduced a model building (training) time: from hours to minutes on a much larger training sample size. For all methods, classifying a new image happens in real time.
Observations
In Table 3, we present the individual classification results for the example images shown in Figure 1. The example images show three fire-related images and three not fire-related images. Shown is the ground truth class along with the predicted class and posterior probability for being in the fire class. The images were chosen to illustrate some of the issues with the results. Figure 1A is an open fire in a 44 gallon drum. This would be considered a fire hazard especially when fire bans are in place due to hazardous conditions. However, it is not a typical bush fire image, which shows smoke and trees. We can see that the PHoW approaches give borderline results and classifies the image into the not fire class. Figure 1B shows a landscape shot which contains a lot of smoke but no visible flames. All four methods classify this image correctly. Figure 1C is a reasonably close in shot of an active fire, with burning trees and smoke. Again all four methods report the correct class for this image. Figure 1D shows an image of fireworks, which is obviously not useful to an emergency services operator but may present issues to a classifier given the “fire” is a potential tag and that some explosions may look vaguely similar to flames. The PHoW classifiers report this correctly; however, it is a borderline result. The ClarifaiRF method reports correctly, but its discrimination is not as strong as with other examples. The OverFeatRF method reports incorrectly with a borderline probability. Figure 1E is a bush fire-related cartoon that would be expected amongst tweets relating to a fire event, yet it would not be useful to emergency service operators. All four approaches classify this image correctly. Finally, Figure 1F is an outdoors landscape scene which is similar in content to some of the more typical bush fire images, yet has no smoke or flames. The two PHoW methods incorrectly classify this image as fire related, while the ClarifaiRF and OverFeatRF methods correctly classify them as not fire.
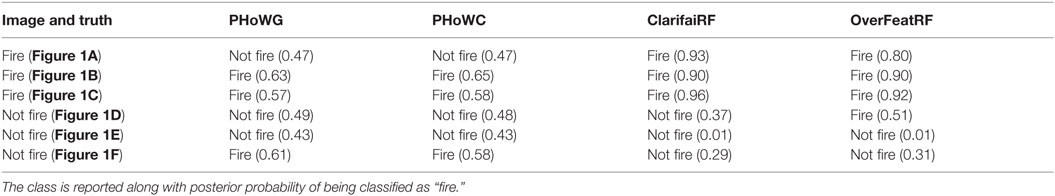
Table 3. Classification results for the six images shown in Figure 1.
One of the useful aspects of the random forest classifier is its variable importance functionality which allows us to gain an insight into each variable’s contribution to the model. To do this, one can rank variables based on the mean decrease in accuracy of the model due to the omission of the variable. For example, with respect to the ClaifaiRF methodology, the top 10 variables (of the 134 used) are “sky,” “landscape,” “sunset,” “light,” “disaster,” “tree,” “sun,” “fire,” “road,” and “illustration.” Because Clarifai’s labels (or variables) are very generic, one can get a good sense of the type of image content that is driving the classification process. Interestingly, the “smoke” variable was ranked 19th.
In assessing the relative merits of these approaches, it is useful to bear in mind the context of use. For our data relating to images of bush fires, an emergency services operator would like to be alerted to images from social networks that may contain vital information relating to evolving emergency events. Operationally, this would mean passing images in tweets, which have been assessed as fire related based on their text content, to a classification algorithm. The algorithm would then report that the image is fire related or not. This could help the operator to assess the spread of the fire or if any new outbreaks are occurring. With this use case in mind, one would tend toward accepting more false positive reporting.
Discussion
We presented a novel application of some current image classification approaches to the area of ESA. The methodologies we investigated involved classification of images based on low-level features as well as features derived by image tagging methodologies built from pretrained classifiers. We discussed aspects of operationalizing the computation, given the size of our training libraries and using technologies for data-intensive computing. The methods were assessed in the context of a bush fire emergency in NSW Australia where image data was available relating to a particular event via Twitter. In this example, emergency service operators would like relevant images to be reported that may contain important information. We showed that our methodologies could classify images into fire and not fire-related classes with an accuracy of 86%.
Further work is planned to compare the results of using the image classifier over tweets directly to find fire images of interest with our previous practice of filtering the tweets for fire-related keywords and then checking for attached images. We expect that the image classifier will find better results; however, this needs to be tested experimentally. We also plan to explore novel ways of presenting the images found to crisis coordinators. Our previous experience indicates that during emergency events, these people are time poor and under pressure to make informed decisions. They do not have the luxury of interacting with user interfaces to look for relevant social media content: it needs to be displayed immediately and with a priority that takes into consideration the current emergency context. This challenge is at the heart of situation awareness and is our goal for deploying our research with practitioners: getting the right information to the right people at the right time in the right format.
Ethic Statement
This work is covered by the CSIRO ethics approval process.
Author Contributions
RL performed analysis and developed the manuscript. YA developed software, carried out analysis, and contributed to the manuscript. PS developed concept along with providing software and computational expertise. OO developed concept. RP provided application ideas, concept, and contributed to the manuscript. BR provided application ideas and concept along with curating data. TB developed concept.
Conflict of Interest Statement
The authors declare that the research was conducted in the absence of any commercial or financial relationships that could be construed as a potential conflict of interest.
Acknowledgments
The authors wish to acknowledge the support of CSIRO’s Computational and Simulation Sciences Transformational Capability Platform.
References
Abadi, M., Agarwal, A., Barham, P., Brevdo, E., Chen, Z. Citro, C., et al. (2015). TensorFlow: Large-Scale Machine Learning on Heterogeneous Systems [Online]. Available at: http://tensorflow.org/
Al-doski, J., Mansor, S., and Shafri, H. (2013). Image classification in remote sensing. J. Environ. Earth Sci. 3, 141–147. Available at: https://scholar.google.com.au/scholar?cluster=2204290826712471620&hl=en&as_sdt=0,5&as_ylo=2013&as_yhi=2099
Avvenuti, M., Cresci, S., Marchetti, A., Meletti, C., and Tesconi, M. (2014). “EARS (earthquake alert and report system): a real time decision support system for earthquake crisis management,” in Proceedings of the 20th ACM SIGKDD International Conference on Knowledge Discovery and Data Mining (KDD’14) (New York, NY, USA: ACM).
Bahamani, B., Moseley, B., Vattani, A., Kumar, R., and Vassilvitskii, S. (2012). Scalable k-means++. Proc. VLDB Endowment 5, 622–633. doi: 10.14778/2180912.2180915
Chamasemani, F., and Affendey, L. (2013). Systematic review and classification on video surveillance systems. Int. J. Inf. Technol. Comput. Sci. 7, 87–102. doi:10.5815/ijitcs.2013.07.11
Chollet, F. (2015). Keras [Online]. Available at: https://github.com/fchollet/keras
Chowdhury, S., Amer-Yahia, S., and Castillo, C. (2013). “Tweet4act: using incident-specific profiles for classifying crisis-related messages,” in 10th International ISCRAM Conference (Baden-Baden, Germany).
Deng, J., Dong, W., Socher, R., Li, L., and Fei-Fei, L. (2009). “ImageNet: a large-scale hierarchical image database,” in IEEE Computer Vision and Pattern Recognition (CVPR) (Miami Beach, USA).
Endsley, M. (1995). Toward a theory of situation awareness. Hum. Factors 1, 32–64. doi:10.1518/001872095779049543
Fan, R., Chang, K., Hsieh, C., Wang, X., and Lin, C. (2008). LIBLINEAR: a library for large linear classification. J. Mach. Learn. Res. 9, 1871–1874. Available at: https://scholar.google.com.au/scholar?hl=en&q=liblinear+a+library+for+large+linear+classification&btnG=&as_sdt=1%2C5&as_sdtp=
Furtado, J., Cai, Z., and Xiaobo, L. (2010). Digital image processing: supervised classification using genetic algorithm in MATLAB toolbox. Rep. Opin. 2, 53–61. doi:10.7537/marsroj020610.09
Gaoa, G., Yangb, J., Wuc, S., Jing, X., and Yuea, D. (2015). Bayesian sample steered discriminative regression for biometric image classification. Appl. Soft Comput. 37, 48–59. doi:10.1016/j.asoc.2015.07.034
Haralick, R., Shanmugam, K., and Dinstein, I. (1973). Textural features for image classification. IEEE Trans. Syst. Man Cybern. 3, 610–621. doi:10.1109/TSMC.1973.4309314
Hare, J., Samangooei, S., and Dupplaw, D. (2011). “OpenIMAJ and ImageTerrier: Java libraries and tools for scalable multimedia analysis and indexing of images,” in MM’11 Proceedings of the 19th ACM International Conference on Multimedia (New York, USA).
He, K., Zhang, X., Ren, S., and Sun, J. (2015). Deep Residual Learning for Image Recognition [Online]. Available at: https://arxiv.org/abs/1512.03385
Hiltz, S., Kushma, J., and Plotnick, L. (2014). “Use of social media by US public sector emergency managers: barriers and wish lists,” in 11th International Conference on Information Systems for Crisis Response and Management (ISCRAM) (PA, USA).
Holderness, T., Turpin, E., and Wickramasuriya, R. (2015). “A geosocial intelligence framework for studying & promoting resilience to seasonal flooding in Jakarta, Indonesia,” in International Symposium for Next Generation Infrastructure Conference Proceedings: 30 September–1 October 2014 International Institute of Applied Systems Analysis (IIASA), Schloss Laxenburg, Vienna, Austria, eds T. Dolan and B. Collins (London, UK: UCL STEaPP), 239–242.
Ilyas, A. (2014). “MicroFilters: harnessing Twitter for disaster,” in IEEE 2014 Global Humanitarian Technology Conference (Washington, DC, USA).
Jaffery, Z., and Dubey, A. (2016). Scope and prospects of non-invasive visual inspection systems for industrial applications. Indian J. Sci. Technol. 9, doi:10.17485/ijst/2016/v9i4/80067
Jia, Y., Shelhamer, E., Donahue, J., Karayev, S., Long, J., Girshick, R., et al. (2014). Caffe: An Open Source Convolutional Architecture for Fast Feature Embedding [Online]. Available at: http://caffe.berkeleyvision.org/
King, D. (2009). Dlib-ml: a machine learning toolkit. J. Mach. Learn. Res. 10, 1755–1758. Available at: https://scholar.google.com.au/scholar?q=dlib-ml%3A+a+machine+learning+toolkit&btnG=&hl=en&as_sdt=0%2C5
Kotsiantis, S. (2007). Supervised learning: a review of classification techniques. Informatica 31, 249–268. Available at: https://scholar.google.com.au/scholar?q=supervised+machine+learning%3A+a+review+of+classification+techniques&btnG=&hl=en&as_sdt=0%2C5
Landwehr, P., and Carley, K. (2014). “Social media in disaster relief: usage patterns, data mining tools, and current research directions,” in Data Mining and Knowledge Discovery for Big Data, ed. W. W. Chu (Berlin, Germany: Springer), 225–257.
Liaw, A., and Wiener, M. (2002). Classification and regression by randomForest. R News 2, 18–22. Available at: https://scholar.google.com.au/scholar?hl=en&q=classification+and+regression+by+randomForest&btnG=&as_sdt=1%2C5&as_sdtp=
Lazebnik, S., Schmid, C., and Ponce, J. (2006). “Beyond bags of features: spatial pyramid matching for recognizing natural scene categories,” in IEEE Conference on Computer Vision and Pattern Recognition (New York, USA).
Lowe, D. (2004). Distinctive image features from scale-invariant keypoints. Int. J. Comput. Vis. 60, 91–110. doi:10.1023/B:VISI.0000029664.99615.94
Meng, X., Bradley, J., Yavuz, B., Sparks, E., Venkataraman, S., Liu, L., et al. (2015). MLlib: Machine Learning in Apache Spark [Online]. Available at: http://arxiv.org/abs/1505.06807
Pedregosa, F., Varoquaux, G., Gramfort, A., Michel, V., Thirion, B., Grisel, O., et al. (2011). Scikit-learn: machine learning in Python. J. Mach. Learn. Res. 12, 2825–2830. Available at: https://scholar.google.com.au/scholar?q=Scikit-learn+%3A+machine+learning+in+Python&btnG=&hl=en&as_sdt=0%2C5
Peters, R., and Albuquerque, J. P. D. (2015). “Investigating images as indicators for relevant social media messages in disaster management,” in The 12th International Conference on Information Systems for Crisis Response and Management (Kristiansand, Norway).
Power, R., Robinson, B., Colton, J., and Cameron, M. (2014). “Emergency situation awareness: Twitter case studies,” in Information Systems for Crisis Response and Management in Mediterranean Countries – First International Conference, ISCRAM-med 2014 (Toulouse, France).
Power, R., Robinson, B., Colton, J., and Cameron, M. (2015). “A case study for monitoring fires with Twitter,” in 12th International Conference on Information Systems for Crisis Response and Management (Kristiansand, Norway).
Power, R., Robinson, B., and Ratcliffe, D. (2013). “A case study for monitoring fires with Twitter,” in Proceedings of the Australasian Language Technology Association Workshop 2013 (ALTA 2013) (Brisbane, Australia).
Qian, W., Xianyi, Z., Yunquan, Z., and Yi, Q. (2013). “AUGEM: automatically generate high performance dense linear algebra kernels on x86 CPUs,” in International Conference for High Performance Computing, Networking, Storage and Analysis (SC’13) (Denver, USA).
Sakaki, T., Okazaki, M., and Matsuo, Y. (2013). Tweet analysis for real-time event detection and earthquake reporting system development. IEEE Trans. Knowl. Data Eng. 25, 919–931. doi:10.1109/TKDE.2012.29
Salton, G., and McGill, M. (1983). Introduction to Modern Information Retrieval. New York: McGraw-Hill.
Schmidhuber, J. (2015). Deep learning in neural networks: an overview. Neural Netw. 61, 85–117. doi:10.1016/j.neunet.2014.09.003
Schulz, A., Ristoski, P., and Paulheim, H. (2013). “I see a car crash: real-time detection of small scale incidents in microblogs,” in ESWC Satellite Events, Volume 7955 of Lecture Notes in Computer Science (Montpellier: Springer), 22–33.
Sen, A. (2015). “Extracting situational awareness from microblogs during disaster events,” in 7th International Conference on Communication Systems & Networks (Bangalore, India).
Sermanet, P., Eigen, D., Zhang, X., and Mathieu, M. (2014). “Overfeat: integrated recognition, localization and detection using convolutional networks,” in International Conference on Learning Representations (Banff, Canada).
Terpstra, T., de Vries, A., Paradies, G., and Stronkman, R. (2012). “Towards a realtime Twitter analysis during crises for operational crisis management,” in Proceedings of 9th International Conference on Information Systems for Crisis Response and Management (ISCRAM) 2012 (Vancouver, Canada).
Tian, D. P. (2013). A review on image feature extraction and representation techniques. Int. J. Multimedia Ubiquitous Eng. 8, 385–395. Available at: https://scholar.google.com.au/scholar?hl=en&q=A+Review+on++Image++Feature+Extraction+and+Representation+Techniques&btnG=&as_sdt=1%2C5&as_sdtp=
van der Walt, S., Schönberger, J., Nunez-Iglesias, J., Boulogne, F., Warner, J., Yager, N., et al. (2014). scikit-image: image processing in Python. PeerJ 2, doi:10.7717/peerj.453
Varga, I., Sano, M., Torisawa, K., Hashimoto, C., Ohtake, K., Oh, J., et al. (2013). “Aid is out there: looking for help from tweets during large scale disaster,” in 51st Annual Meeting of the Association for Computational Linguistics (Sofia, Bulgaria).
Vedaldi, A., and Fulkerson, B. (2008). VLFeat: An Open and Portable Library of Computer Vision Algorithms [Online]. Available at: http://www.vlfeat.org/
Yang, Y., Ha, H.-Y., Fleites, F., Chen, S.-C., and Luis, S. (2011). “Hierarchical disaster image classification for situation report enhancement,” in IEEE 12th International Conference on Information Reuse and Integration (Las Vegas, Nevada).
Zaharia, M., Chowdhury, M., Franklin, M., Shenker, S., and Stoica, I. (2010). “Spark: cluster computing with working sets,” in HotCloud’10 Proceedings of the 2nd USENIX Conference on Hot Topics in Cloud Computing (Berkeley, USA).
Zeiler, M., Taylor, G., and Fergus, R. (2011). “Adaptive deconvolutional networks for mid and high level feature learning,” in International Conference on Computer Vision (Barcelona, Spain).
Zhang, Y., Dong, Z., Phillips, P., Wang, S., Ji, G., Yang, J., et al. (2015). Detection of subjects and brain regions related to Alzheimer’s disease using 3D MRI scans based on eigenbrain and machine learning. Front. Comput. Neurosci. 9:66. doi:10.3389/fncom.2015.00066
Keywords: classification, image processing, emergency response, machine learning, situation awareness
Citation: Lagerstrom R, Arzhaeva Y, Szul P, Obst O, Power R, Robinson B and Bednarz T (2016) Image Classification to Support Emergency Situation Awareness. Front. Robot. AI 3:54. doi: 10.3389/frobt.2016.00054
Received: 14 June 2016; Accepted: 06 September 2016;
Published: 21 September 2016
Edited by:
Giuseppe Boccignone, University of Milan, ItalyReviewed by:
Roberto Bortoletto, University of Padova, ItalyYudong Zhang, Nanjing Normal University, China
Copyright: © 2016 Lagerstrom, Arzhaeva, Szul, Obst, Power, Robinson and Bednarz. This is an open-access article distributed under the terms of the Creative Commons Attribution License (CC BY). The use, distribution or reproduction in other forums is permitted, provided the original author(s) or licensor are credited and that the original publication in this journal is cited, in accordance with accepted academic practice. No use, distribution or reproduction is permitted which does not comply with these terms.
*Correspondence: Ryan Lagerstrom, ryan.lagerstrom@csiro.au