Bare-Hand Volume Cracker for Raw Volume Data Analysis
 Bireswar Laha
 Doug A. Bowman
 John J. Socha
- 1Department of Neurobiology, Stanford University, Stanford, CA, USA
- 2Department of Computer Science, Center for Human-Computer Interaction, Virginia Tech, Blacksburg, VA, USA
- 3Department of Biomedical Engineering and Mechanics, Virginia Tech, Blacksburg, VA, USA
Analysis of raw volume data generated from different scanning technologies faces a variety of challenges, related to search, pattern recognition, spatial understanding, quantitative estimation, and shape description. In a previous study, we found that the volume cracker (VC) 3D interaction (3DI) technique mitigated some of these problems, but this result was from a tethered glove-based system with users analyzing simulated data. Here, we redesigned the VC by using untethered bare-hand interaction with real volume datasets, with a broader aim of adoption of this technique in research labs. We developed symmetric and asymmetric interfaces for the bare-hand VC (BHVC) through design iterations with a biomechanics scientist. We evaluated our asymmetric BHVC technique against standard 2D and widely used 3DI techniques with experts analyzing scanned beetle datasets. We found that our BHVC design significantly outperformed the other two techniques. This study contributes a practical 3DI design for scientists, documents lessons learned while redesigning for bare-hand trackers and provides evidence suggesting that 3DI could improve volume data analysis for a variety of visual analysis tasks. Our contribution is in the realm of 3D user interfaces tightly integrated with visualization for improving the effectiveness of visual analysis of volume datasets. Based on our experience, we also provide some insights into hardware-agnostic principles for design of effective interaction techniques.
Introduction
Across a broad range of scientific domains such as medical biology, geophysics, and astronomy, scientists use 3D techniques to scan humans, animals, man-made structures, the earth, or outer space. The 3D volume data generated through such methods, which include computed tomography (CT), magnetic resonance imaging (MRI), positron emission tomography (PET), seismography, radar, and radio or optical telescopy, consist of voxels that map the material properties of the object. Raw volume data needs to be segmented, to separate the useful set of voxels from the occluding ones, before an effective visual analysis can be performed.
Most segmentation methods (including automatic) are coarse and inaccurate and ignores partial volume effects (Marai et al., 2006). Manual segmentation remains a labor-intensive and time-consuming task. We believe an interactive human intervention would be very efficient in this process to identify the useful set of voxels constituting the regions of interest in a raw volume and inform a semi-automatic segmentation of the entire volume.
Human intervention in the form of bare-hand interaction could be particularly suitable because domain scientists and researchers hesitate to wear cumbersome 3D devices. Also, a bare-hand interface can be used within a normal scientific workflow and in conjunction with traditional 2D interactive tools.
Axis-aligned slicing (AAS) is the most widely used 2D interaction technique for volume data exploration (Xradia-Solutions, 2012), and arbitrary slicing (AS) is a well-known 3DI technique (Hinckley et al., 1994a). We define 3DI as human–computer interaction in which the user’s tasks are performed directly in a 3D spatial context (Bowman et al., 2005). Both these and other virtual slicing techniques, e.g., Schultheis et al. (2012) and Weiskopf et al. (2003), often require the user to remove the occluding voxels to expose the underlying regions of interest in a volume. But slicing also results in the removal of part of the volume that contains context-defining features, without which the analysis becomes more difficult.
A benefit of so-called “focus + context” techniques (Wang et al., 2005) is that they aim to preserve all the voxels at all times, while focusing on regions of interest using innovative visualization techniques. These techniques typically use a magnification metaphor (Wang et al., 2005), an exploded views approach (Bruckner and Gröller, 2006), or a variety of widgets (McGuffin et al., 2003), and almost all are designed to work on pre-segmented volume data. Some assume semantic layers in a volume or distort the less important parts of a volume.
Previously, we analyzed the limitations of prior approaches (AAS and AS) and also interviewed volume data analysts from multiple scientific domains to understand their challenges. Based on this research, we designed a 3DI technique called the volume cracker (VC) (Laha and Bowman, 2013), which we describe below. VC appeared to out-perform standard interaction techniques. But the implementation and the study had important limitations, which we describe below and seek to overcome in our current work.
The core contribution of VC is not as a new 3D visualization method or algorithm–multiple prior approaches of such techniques exist already, e.g., the exploded views technique (Bruckner and Gröller, 2006) and a host of widgets proposed by McGuffin et al. (2003). VC is rather inspired by such approaches and is a novel 3DI technique [human–computer interaction where the input is provided in direct 3D spatial format, defined in Bowman et al. (2005)], which seeks at leveraging the benefits of direct spatial input for improving the effectiveness of such 3D visualizations for visual analysis of volume datasets. So, to provide a level ground for comparison (3D spatial input), we always compare it against versions of the states-of-the-art designed to provide input in direct spatial form.
In this paper, we describe the design and evaluation of multiple bare-hand versions of the VC technique. Our contributions include (1) a practical interface for 3DI with raw volume data that can be used by scientists in the lab, (2) lessons learned while redesigning an existing technique to use a bare-hand tracking device, (3) additional evidence that 3DI can be useful in volume data analysis for a variety of abstract task types, and (4) insights into hardware-agnostic principles for design of interaction techniques.
Related Work
Previous work in 3DI design for volume data analysis has developed bimanual-asymmetric neurosurgical tools for AS of brain data (Hinckley et al., 1994b). Holding a doll’s head in the non-dominant hand allowed the user rotation of the volume about all three axes, while a cutting plane prop held in the dominant hand allowed slicing the dataset along desired orientation directly mapped with the real plate, and relative position of the slice plane to the volume data perceptually mapped to the two hand-held props. More recently, Qi and Martens (2005) developed a similar tangible interface for AS. They used a tangible cube, held in the non-dominant hand, to mimic a virtual trackball for manipulating the volume, while the dominant hand controlled the orientation and position of a pen, or a plane-like tangible input device for arbitrarily slicing through the volume.
Preim et al. (2002) developed some of the first measurement tools for medical visualizations using 3DI techniques, with accuracy adapted to the size of the voxels. Their tools included interactive rulers for measuring distances and a virtual geometric compass for measuring angles. On similar lines, Reitinger et al. (2006) proposed a host of virtual spatial analysis tools for surgical planning, grouped by distance measurements, volume measurements, and angular measurements. They also proposed using measurement props as input devices (which they did not use in their evaluation study), such as a ruler, pen, and measurement jug. More recently, Monclús et al. (2009) proposed using a “magic lantern” approach to remove the outer layers in a volume data, in order to reveal occluded underlying layers. This extended prior work on exploded views of volume data by Bruckner and Gröller (2006).
Evaluating gesture-based approaches for tasks in medical volume visualization, Kirmizibayrak et al. (2011) ran studies to evaluate gestures for rotations and target localization. Ulinski’s (2008) research showed that symmetric and synchronous gestural approaches are best for selection tasks in volume datasets, but more recent designs have used symmetric-asynchronous bimanual designs for medical data exploration (Mlyniec et al., 2011). Our first design of gesture-based 3DI technique for volume data exploration, called VC, further explored these issues and is explained in Section “Volume Cracker” below.
Tactile and Commodity 3D User Interfaces for Visualization
Recently, research in tactile or tangible interfaces has also explored designing 3DUIs for exploring data visualization, bringing back partly the spirit of the original AS designed by Hinckley et al. (1994a). Perhaps, one of the more notable ones is Jackson et al.’s (2013) design of a simple hand-held stick with a printed pattern. They demonstrate interacting with 3D visualizations of fiber structures in a fish tank VR system. The stick provides 3DOF position-controlled rotations of the dataset, but more interestingly, simply positioning two fingers on the stick allows slicing through the data, which allows for an intuitive interactive exploration of volume data. Another kind of interaction design, keeping more along the lines of tactile interaction, has been tablet-based or surface-focused – Isenberg (2016) good summary of the recent work done in this line. For example, Coffey et al. (2012) extend the world-in-miniature metaphor (Stoakley et al., 1995) in their interactive slice WIM, through a one-to-one static mapping between interactions performed on multi-touch table and a stereoscopic wall display. Besançon et al. (2017) presents a conceptual framework of combining tactile input and tangible sensing using a tablet for 3D manipulation tasks. This research provides intriguing techniques for interacting with 3D visualizations of data, in ways that allow the users to almost “touch” the data through the tactile props or devices. In our approach of designing the BHVC from the VC, although we remained within the spirit of allowing more intuitive interactions with commodity 3DUIs, our designs are less tactile but allows the users to carry out more free-form and in-air interactions. It remains to be explored, which of these two design methodologies would perform better overall.
Volume Cracker
Volume cracker is a free-hand bimanual interaction technique for volume data exploration (Laha and Bowman, 2013), designed specifically to aid in the visual analysis of raw scanned data. Here, we define free-hand techniques as ones in which the hands of the user move freely in 3D space.
Volume cracker allows the user to recursively crack open a volume using intuitive naturalistic gestures, in order to isolate smaller regions of interest. This helps to reduce clutter in a dense volume, enabling exploration of hidden and occluded structures inside. By preserving the full volume at all times, VC overcomes the problems of prior approaches, which relied on removing occluding portions of the volume, but, in the process, removed valuable contextual information that may be important for an overall understanding.
The published prototype of VC was developed using tethered 5DT data gloves (Fifth_Dimension_Technologies, 2015) and Intersense IS900 hand trackers (Intersense, 2015) and was shown to work with simulated raw volumetric datasets (Laha and Bowman, 2013). In an evaluation study run with non-expert participants, VC was compared to AAS and AS techniques. The results showed that VC had significant advantages over those techniques for search and pattern recognition tasks.
Although this evaluation study showed significant potential for VC to improve analysis, the VC prototype was impractical and cumbersome. The tethered design could be a big inhibition in the adoption of this technique outside core computer science research labs, as novel technologies can be difficult for direct adoption by domain scientists and more so with unnecessary tethering. In addition, the study results need validation with expert analysts who study real volume datasets. We sought to address these issues in the current work.
Bare-Hand Volume Cracker
Overcoming Prior Problems with Volume Cracker
We aimed to redesign VC so that any volume data analyst could adopt it in their lab. Toward this aim, we explored the space of devices for 3D tracking technology for easily available commodity-level off-the-shelf hardware. We considered multiple commercial products including the Microsoft Kinect, the 3Gear Systems (3Gear-Systems, 2015), and the Leap Motion controller (Leap-Motion, 2015). We chose the Leap Motion controller (or simply, the “Leap”) because (1) it provides very high accuracy and low latency for bare-hand tracking, (2) it requires minimum desk space, and (3) it is the cheapest in its class (as of May 2016).
By using the Leap, we were able to avoid the cumbersome tethering, localization, and high price range of the wired IS900 trackers and the 5DT data gloves used in the previous VC prototype. Instead of using a glove, the Leap provides tracking capabilities of bare human hands and fingers, and we therefore named our new technique the “Bare-Hand VC” (BHVC).
We used the constructor SDK (cSDK) from NGRAIN (NGRAIN-Constructor-SDK, 2015) to render real volume datasets. The cSDK rendered our datasets at real-time frame rates (~60 Hz), while allowing us access to manipulate individual voxels and groups of voxels at run time. This was critical for the design of BHVC.
Professor Jake Socha (third author in this paper) analyzes the fluid flow in the tracheal tubes of insects in his research. We used datasets from his lab (see Datasets) and designed the current interface and evaluation of BHVC around the tasks important to his research objectives (see Evaluation). We were also able to secure the help of 12 researchers from his lab to participate in our evaluation study.
Design Challenges with the Leap
The Leap is a consumer-oriented device that provides six degree-of-freedom (6DOF) tracking of bare human hands and fingers. Its accuracy in finger tracking and latency (in its feedback loop) levels are comparable to some of the best 3D trackers currently available. But it has several limitations, primarily stemming from its infrared camera use. The Leap sits on a desk and has an inverted cone-shaped field of view (FOV), which limits the workspace for users’ hand movements. To obtain the best tracking requires a user to place their hand at least five inches above the device, while avoiding bright sunlight and reflective objects and also avoiding leaning forward (as the head can be misidentified as a hand). The detection of hand orientation by the Leap depends heavily on the number of fingers tracked. This causes problems with detecting the orientation of closed fists and reduces the postures available for 3DI.
Occlusion is another important source of problems for the Leap. Because the vision-based tracker requires a clear line of sight, one hand can occlude the other, or the palm can occlude the fingers, or fingers can occlude other fingers. These problems limit hand and wrist movements and severely constrain the gestures available for 3DI designers.
Finally, the Leap assigns hand and finger IDs to the tracked body parts. These may randomly vary between frames, posing design challenges. The jitter between frames can also cause the palm normal (calculated by the Leap) to invert, and the number of fingers detected to change unexpectedly between frames.
In spite of these problems, the Leap’s unique capabilities of tracking bare hands and fingers inspired us to use it for the BHVC and to address the limitations of the Leap through design. The Leap also represents a group of infrared tracking devices, which could be a possible choice for desktop 3D input in the near future, and we hoped that the lessons we learned here could be used to guide gesture-based interaction in that design space.
Bimanual-Symmetric Interface Design for BHVC
We first attempted to directly migrate the prior VC design (Laha and Bowman, 2013) to the Leap and cSDK, as the original VC design had been validated to work well for real-world volume data analysis tasks (Laha and Bowman, 2013). The main features of VC were the unimanual grab and selection modes, the bimanual volume-cracking preview mode, the cracking gesture, bimanual cracking, bimanual grab of cracked and connected sub-volumes on a plane, and joining back of sub-volumes. Mapping the corresponding gestures directly with the Leap was not possible, because (1) the detection of a closed-fist orientation with the Leap was far from reliable, but the grab gesture needed 6DOF tracking of the closed fist and (2) furthermore, bimanual interaction with the Leap was severely impaired due to occlusion problems, while the strength of the volume-cracking preview arguably came from the 3D movement of two hands in free space.
We started exploring the bare-hand interaction design space, balancing intuitiveness with the choices that the Leap offered. System control commands could be mapped to the different number of fingers detected by Leap. However, fluctuations in the detected number of fingers, sometimes varying by one or two between frames, demanded a gap of at least two or more fingers between meaningful postures for distinct and robust detection by the Leap. The two postures we found to be reliably distinct were with one finger extended and more than one finger extended (open palm).
The grab mode of VC needs more freedom of rotation than the selection mode, but it proved difficult to detect orientation changes when tracking a single finger with the Leap. Therefore, we decided to use single-finger selection and open-palm grab. Although this may appear counterintuitive (in the real-world, we grab with the fist closed), we decided to trade intuitiveness for freedom of movement and tracking.
Because 3DOF absolute rotation with the Leap is limited to around 100 degrees about the pitch and roll axes, we tried to implement position-controlled non-isomorphic 3D rotation (Poupyrev et al., 2000) and rate-controlled rotation (Bowman et al., 2005). In the amplified non-isomorphic 3D rotation, as the user rotated her hand in the real world, she saw the camera in the virtual world rotating twice or thrice the amount of hand rotation. But the quick rotation was either too fast to control precisely, or the tracked space for rotation fell short of what was needed. In the rate-controlled 3D rotation, when the user kept her hand near the neutral orientation (hand parallel to the desk), no rotation happened. When she tilted the hand in some direction, if the tilt angle went beyond a certain threshold, we started the camera rotation, at a constant rate. By experimenting with different threshold values, we found a certain value about each axis that had a good intuitiveness–performance combination. We finally settled for the 3DOF rate-controlled rotation, with two levels of speed (two different thresholds), around each of the three orthogonal axes. We used 3DOF position-controlled translations.
For the bimanual cracking preview and cracking gesture, we had two choices: single-finger and open-palm postures with each hand. We wanted to have bimanual grab activated immediately after the cracking occurs, as in the original VC. We thus used bimanual single-finger pointing for the cracking preview mode. The cracking preview is activated when one finger of each hand is detected in the tracking volume. The preview is updated in each frame. The invisible cutting plane that creates the preview is located at the midpoint between the two fingertips and is oriented along the line joining the two fingertips. The preview animation is active as long as both hands are inside the volume and is canceled as soon as either hand is taken out. We chose the simultaneous opening of the fists to the open-palm position as the gesture to crack the dataset. The cracking preview mode suffered from the occlusion problems with the Leap but far less with the bimanual single-finger posture than with bimanual open-palms.
We preserved other features of VC such as restricting the movements of a sub-volume on a plane, joining back of the sub-volumes, and the hierarchy of cracking. We presented the details of the design of this symmetric interface and its challenges in a workshop paper (Laha and Bowman, 2014).
Evaluation of the Bimanual-Symmetric Design of BHVC
Socha and De Carlo (2008) tested a prototype of this interface with his synchrotron X-ray micro-computed tomography (SRμCT) scanned beetle datasets (see Datasets and Figure 1). Our approach was to let him try it out first, and then carry out some important tasks he would typically perform to answer his research questions. Initially, he had difficulty while trying out the different features of BHVC. We iterated with him for several weeks, modifying our design based on his advice and our assessment of his problems. However, the usability issues kept recurring.
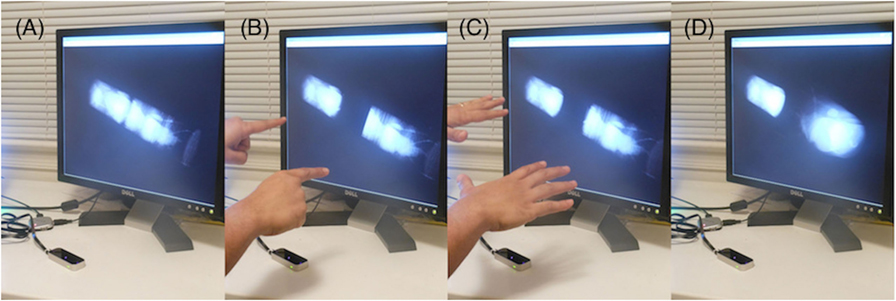
Figure 1. The bimanual-symmetric interface of the BHVC – (A) μ-CT scan, (B) cracking preview, (C) cracking, and (D) cracked data.
We reviewed the usability problems, both in direct discussion with him and separately as designers of 3D user interfaces. We found that some of the problems were due to his lack of familiarity with 3D input devices and because of the inherent difficulty in using 3D rate-controlled rotation. There was also fatigue associated with holding both hands in space all the time. Inherent problems with the Leap such as limited FOV and occlusion (made worse by bimanual tracking) compounded these issues. The lack of intuitiveness of our gesture set (such as open-palm for grab) was an additional problem.
Most of these problems arose directly because of differences from the original VC. Because of the Leap’s limitations, we were not able to use position-controlled rotation or the more natural gesture set of the original VC. This is why the direct migration of the technique to the new device did not work (see Towards Hardware-Agnostic Design Principles).
We realized that desktop infrared camera-based tracking devices such as the Leap required a complete redesign of the BHVC from the ground up, rather than a simple migration of our original design. We explored an asymmetric variation, where one hand could use a less fatiguing desktop device, and the other could be tracked by the Leap, but now with higher reliability.
Bimanual-Asymmetric Interface Design for BHVC
In designing an asymmetric interface, our first priority was trying to decide how to divide the different interaction requirements between the dominant and the non-dominant hands. We decided to follow Guiard’s framework for division of labor in bimanual asymmetric interactions (Guiard, 1987). He postulated that (1) the dominant hand follows the reference frame provided by the non-dominant hand, (2) the dominant hand works on a finer spatial and temporal scale, and (3) the non-dominant hand leads while the dominant hand follows.
Of the interaction features in BHVC, we observed that the 3D manipulations (camera rotations and translations) applied to the whole dataset at all times. These work on a global spatial and temporal scale and provide the frame of reference for the more nuanced interactions specific to the VC. Similarly, the mode switches for system control also operate globally.
We thus decided to separate out the global 6DOF camera controls and system commands to a different input device and use that with the non-dominant hand. We chose to use the Space Navigator Pro from 3D-connexion (3D-Connexion, 2015) for this purpose. This is a 3D mouse that provides a 6DOF elastic “handle,” which we could directly use for camera manipulation. We used the buttons on its keypad for system control commands. This is a common device used by 3D modelers and artists for camera control with the non-dominant hand. In theory, it should reduce fatigue, occlusion, and tracking problems as compared to the first BHVC design, because it would enable the Leap to track just one hand, while allowing the other to rest on the table.
We used the Leap for the functionality specific to VC and not related to camera or system control. We designed the asymmetric interface of BHVC inspired by a magnet metaphor, using the Leap to track only the dominant hand. We imagined the dominant hand acting like a magnet, and the voxels, in a volume, acting like small metallic pieces. As the hand hovered around the dataset in 3D, it attracted more or fewer of the voxels, depending on how close or far it was from the dataset, which produced the cracking preview. To keep the interface simple, we defined the boundary of magnetic attraction as a plane (instead of a sphere), positioned at a fixed distance from the hand, toward the volume, and oriented perpendicular to the line joining the center of the hand and the center of the volume. We showed a transparent slice plane at that position and orientation as a visual cue to the user.
Preliminary Evaluation and Modifications of BHVC
Professor Socha found that this interface was much more intuitive and easier to control than the previous symmetric version. But there were still some design issues specific to BHVC. For example, the cracking plane was unconstrained in 3D. When the cracking preview showed the volume breaking into two parts along the viewing axis (the line of sight of the viewer), the sub-volume in front blocked the cracked face of the other sub-volume. This made it difficult for him to judge precisely where to crack. Thus, we constrained the cracking plane to be perpendicular to the view plane (limiting some of the 3D interactivity), essentially keeping the depth of the hand at the same depth as the center of the volume (see cracking preview in Figure 2).
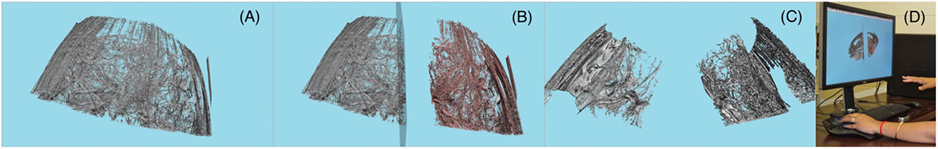
Figure 2. Bare-hand volume cracker (BHVC): a 3D interaction technique – (A) μ-CT scan of a beetle, (B) cracking preview, (C) cracked beetle, and (D) a participant using BHVC.
Another problem was related to selecting a sub-volume in 3D. Our interface lacked many depth cues such as stereo, shadows, and head-tracked motion parallax. Hence, selecting sub-volumes in 3D was difficult, as it was hard to gage the depth of a hand compared to that of the volume. This increased the difficulty level of the overall BHVC experience. So we decided to use image-plane selection, in which a ray from the camera through the hand position was used to select objects. This gives the user the impression of controlling a 2D hand “cursor” and selecting whatever is underneath this cursor visually.
Finally, to improve the precision of the crack, and to give the user more control over isolation of the regions of interest, we introduced an important feature in BHVC. We called this the turning the pages feature (see Figure 3), inspired by a book metaphor. After cracking the volume, the user can now point to either of the sub-volumes and activate turn-the-pages with a button press. Like turning pages in a book, the user can then turn “layers” of voxels from one sub-volume to the other, where a layer is defined as a single-plane of adjacent voxels lying on the plane parallel to the cut-surface of the sub-volume. Moving the hand causes the two sub-volumes to synchronously shrink and expand along one axis, using a position-control mapping from the vertical position of the hand to the position of the crack along the axis perpendicular to the cut-surface for each of the sub-volumes. This position mapping simulates how a reader turns the pages of a book depending on what she is looking for and combines the power of precise readjustment of the crack and the ease of intuitive position-based control.
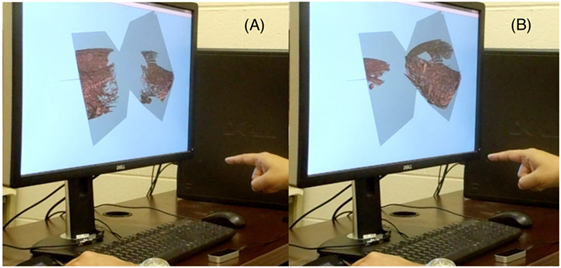
Figure 3. Turning the pages with BHVC – the synchronous shrinking and expanding of the sub-volumes with hand movement. (A) and (B) are two instances in this action.
Based on additional design sessions with Professor Socha, we introduced a few more features to make BHVC more usable and comprehensive for his tasks. We removed many of the redundant or extraneous degrees of freedom from both the cracking preview and the sub-volume manipulation, adding constraints and automation. We further introduced a feature to hide selected sub-volumes (see Figure 4). Once a volume is broken into multiple sub-volumes, and the user wants to focus on just one of them, the other sub-volumes might clutter or occlude the view unnecessarily. This feature allowed the user to hide or unhide sub-volumes at will. We showed an outline for a hidden volume, to avoid losing its location visually. This feature could be combined with the page-turning feature to focus on the growing or shrinking of only a single sub-volume.
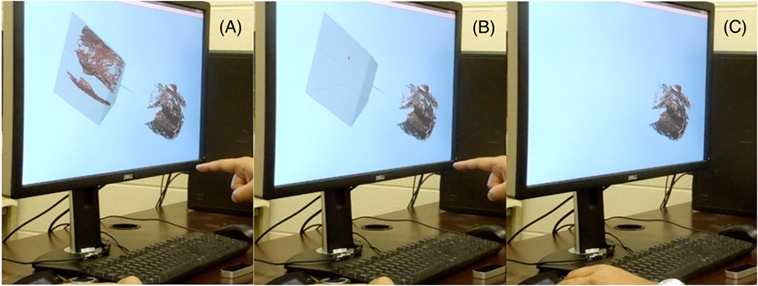
Figure 4. Hiding a sub-volume – (A) point to select a sub-volume, (B) hit the escape key to hide, and (C) remove the tracked hand.
Instead of having a fixed center of rotation at the origin of the virtual world, or at the centroid of all the visible sub-volumes, we decided to have the center of rotation at the center of the screen, but at an average depth of all the visible voxels. This kept rotating sub-volumes within the visible screen space.
With all these modifications, the interface was greatly simplified compared to the original VC. Although it was much less realistic than the original VC (less like holding and cracking the volume directly using the hands), it was highly usable and still allowed cracking the volume along any arbitrary axis necessary. It supported all generic volume data analysis tasks [as listed in a recent visual analysis task taxonomy for volume data (Laha et al., 2015)] and appeared to be ready for a formal evaluation study by experts.
Evaluation
Study Design
We designed a study to evaluate the performance of the asymmetric BHVC technique against standard interaction techniques used by researchers in volume data analysis. The first prototype of the VC (Laha and Bowman, 2013) was evaluated against the most widely used 2D interaction technique (AAS) and a widely known 3D interaction technique (AS). In AAS, three orthogonal 2D slicing planes give simultaneous sliced views into the same dataset. In AS, the user has 3DOF orientation control over one slice plane, giving sliced view into the dataset. Both of these remove certain occluding parts of the volume data to reveal internal areas of interest. We kept our evaluation design similar to our previous study (Laha and Bowman, 2013) to know how our design performs as compared to baseline 2D and 3DI techniques.
The drawbacks of the AAS technique (which provide only planar views to explore 3D regions of interest inside volume data) are quite well known. To alleviate such problems, almost all open-source medical analysis projects, such as Amira, 3D Slicer, MITO, and software packages shipping with commercial scanning hardware include a multiplanar reconstruction (MPR) facility. However, the AAS technique remains an integral part of all volume data analysis packages and is an important baseline technique, because it is the only technique that allows the user to view the actual source imagery obtained by the scanner. Thus, we chose to use AAS as a baseline to compare with the other techniques in our study.
We wanted to have expert participants in our study so that we could use real datasets and realistic analysis tasks. However, we found it relatively difficult to recruit many experts in the domain of biomechanics, which is a standard issue in domain-specific user studies (Laha et al., 2015). A within-subjects design would have given us more statistical power. But this was impractical because it would have required having three comparable datasets and tasks of equal complexity for each. We thus settled on a between-subjects design with three groups for each of the three techniques (BHVC, AS, and AAS). With the available number of experts (see Participants), we were able to secure four sets of data in each study group.
We made a conscious decision to avoid all confounds arising due to different hardware configurations between the techniques (our independent variable). Therefore, we designed the AS and AAS techniques with the same set of hardware (Leap and 3D mouse) as in our asymmetric BHVC. Just like in the BHVC, in both the AAS and AS, we used non-dominant hand control of the 3D mouse for 3D manipulations and system control commands, and Leap-tracked gestures and postures of the dominant hand for technique-specific controls (such as slicing), as per Guiard’s postulates (Guiard, 1987). Through several iterations, we made sure that the Leap-based AAS matched its mouse-based versions as closely as possible (see Implementation). Although we did not test this formally, the strong results by the experts with our AS and the AAS techniques support the strength of our design (see Results).
For similar reasons and for higher statistical power, we avoided comparison with the original VC. Also, the original VC was not practical to use in a real-world lab setting. Our goal was not just to improve the original VC, but to design a version of it that could be used in a realistic scientific context.
Goals and Hypotheses
Our main goal was to determine how BHVC compares with the AS and AAS techniques in terms of quantitative task performance. Our primary research question was:
1. Which technique (BHVC, AS, and AAS) performs best in terms of task performance for analyzing raw volume datasets?
Recent research has consolidated visual analysis tasks from multiple scientific domains together in an abstract task taxonomy (Laha et al., 2015). Our next goal was to understand the mapping between such abstract task categories and the interaction techniques we designed. Thus, our next research question was:
2. Is the task performance with each technique consistent within abstract task categories, proposed in (Laha et al., 2015)?
We also wanted to capture some qualitative feedback on the usability of our interfaces for the three techniques that we prototyped, from an expert perspective, giving us the next research question:
3. How does BHVC compare with the standard interaction techniques in terms of user preference, usability, and ease of learning?
Based on our experience and prior results (Laha and Bowman, 2013), we had the following hypotheses for our research questions.
H1.a. BHVC will be more accurate than both AS and AAS. BHVC was designed to isolate and analyze smaller regions in a whole volume. This should allow high accuracy on search tasks inside a volume. Spatial judgment tasks, involving close analysis of some internal structure or region of interest within a volume from different viewpoints, should also benefit. AS gives quick insights into occluded sub-volumes but could be less accurate due to the associated loss of context. AAS uses an axis-aligned approach, whereas most internal structures in a volume dataset in general are not axis-aligned. Therefore, we expected it to be far less accurate than VC and AS techniques.
H1.b. BHVC will be slower than the other two techniques, in terms of visual analysis task completion. The number of features in BHVC is greater than in AS and AAS. This might cause BHVC participants to be slower than the other participants. Using the joining back functionality more frequently than turn-the-pages for getting precise cracks could also slow down performance.
H2. Task performance will be roughly consistent within each task category. The purpose of the abstract categorization is to group similar tasks. Table 1 shows the grouping of the tasks from this study based on our recent abstract categorization of visual analysis tasks in volume visualization (Laha et al., 2015). This table also includes the task difficulty level, as decided by Professor Socha.
H3. For users, BHVC will be liked more than the other techniques but will have comparable usability ratings and ease of learning. We expected the real-world metaphor of cracking to elicit liking and quick learning. We iterated on the design of BHVC and the other techniques, focusing on making all of them usable.
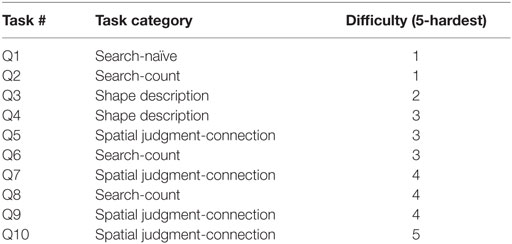
Table 1. Tasks with abstract categories and difficulty levels.
Hardware and Software
We used a custom-configured computer with Intel’s Xeon CPU X5667 (64-bit) running at 3.07 GHz, with 48 GB RAM, an NVidia Quadro FX 5800 graphics card, and a Dell 27-inch monitor. We also used the Leap Motion controller and the Space Navigator Pro for 3D input. We used the Leap to track just one hand, in all cases.
We used NGRAIN’s cSDK (NGRAIN-Constructor-SDK, 2015) to implement prototypes of BHVC, AS, and AAS. We integrated the APIs for the Leap and the 3D mouse with the cSDK, which pooled the inputs from the different hardware into a common application.
Implementation
The handle (or the joystick) of the 3D mouse allowed 6DOF movements of the dataset, in the top-left quadrant of the AAS (see Figures 5C,D), and in the full-screen view of the AS (Figures 5A,B), and BHVC interfaces (see Figure 2). The backward or forward tilt of the joystick pitched the data up or down; left or right twist caused the data to yaw left or right; left or right tilt rolled the data left or right. The translational movement of the handle in any direction translated the dataset in that direction. We used thresholds on the handle to start the rotations to separate those from the translations. But there was a very small window within which the joystick allowed simultaneous rotations and translations.
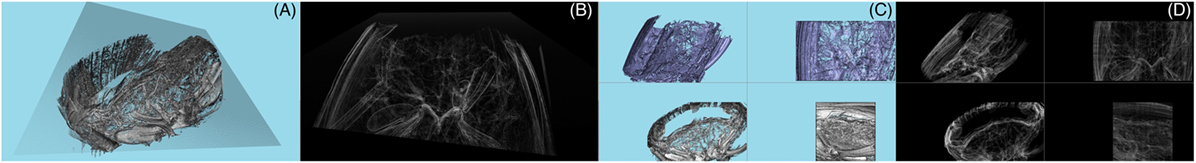
Figure 5. The arbitrary slicing (AS) and the axis-aligned slicing (AAS) interfaces – (A) AS: opaque mode, (B) AS: X-ray mode, (C) AAS: opaque mode, and (D) AAS: X-ray mode.
In the AAS interface (Figures 5C,D), we divided the screen into four quadrants. The top-left quadrant showed the dataset from an arbitrary 3D viewpoint. The other three quadrants had fixed views oriented along three orthogonal axes. Using the position of the dominant hand above the Leap, the user could select any one of these three quadrants. The user could activate the slice mode for the direction of the selected quadrant by pressing the shift key on the 3D mouse pad and deactivate slicing by pressing the escape key. In the slicing mode, we position-mapped the slice plane to the forward–backward movement of the hand with the position of the hand right above the Leap always corresponding to the slice plane position halfway through the dataset. Pressing the C, S, and A keys on the keyboard would flip the direction of view (and the slice plane orientation) in each of the three quadrants. We chose the letters C, S, and A to denote correspondence with the coronal, sagittal, and axial views, terms used commonly in medical biology.
Our Leap-based AAS was comparable to the mouse-based AAS, because (1) the hand-movements for the selection of the quadrants in the Leap-based version occurred in a 2D plane, just like for the mouse; (2) we preserved the button-press accuracy for quadrant selection; and (3) simple movement of the hand allowed slicing in the selected quadrant.
In the AS interface (Figures 5A,B), we showed a transparent slice plane at the position and orientation of the hand, tracked by the Leap. The slice plane removed the volume behind the plane. The user could freeze the slice plane at any instant, to hold the selected sliced view, by pressing the shift key on the 3D mouse pad. While frozen, the 6DOF movements from the joystick would also move the frozen slice plane along with the volume. The user could unfreeze the slice plane with another shift key press.
We implemented the BHVC interface as described in the previous section on bimanual-asymmetric interface design. We used the shift key on the mouse pad to trigger cracking and joining back actions and to activate the turning-the-pages feature (see Figure 3), and the escape key for hiding or un-hiding the sub-volumes (see Figure 4).
For all interfaces, pressing the X key on the keyboard activated a transparent X-ray mode (see Figures 5B,D), and pressing the X key again would return the opaque rendering mode. The X-ray mode was designed to give insight into the hidden parts of the dataset. Pressing the R key on the keyboard would reset the dataset, as it was at the beginning. In all interfaces, we showed a small cube as a visual feedback for the 3D hand position, and a similar cube to denote the center of rotation.
Datasets
In CT, X-rays are used to scan objects using multiple projection images. Here, we used synchrotron X-ray micro-computed tomography (SR-μCT) at beamline 2-BM of the Advanced Photon Source, Argonne National Laboratory. This beamline provides the capability of high-resolution (~1 μm) 3D imaging, enabled by the quality of X-rays at a synchrotron light source (Xiao et al., 2012). We used scans of the ground beetle Platynus decentis (from the family Carabidae). Carabid beetles are of scientific interest due to their dynamic tracheal behaviors, in which parts of the tracheal system are compressed in a rhythmic fashion (Westneat et al., 2003; Socha et al., 2008). Our dataset consisted of a stack of raw 2D images. We used the software ImageJ (2015) to enhance contrast and crop the images before loading them in our software.
The size of the whole dataset was larger than our software could render at an interactive frame rate. Therefore, we partitioned the beetle dataset into five equal parts, labeled Part A to E, with the size of each part being 640 × 384 × 257 voxels (257 images each of 640 × 384 pixels), chosen to preserve the whole region of interest of each dataset, while avoiding unimportant parts of the volume. This was the maximum size of the volume that we were able to render at 60 Hz frame rate, which we considered reasonable for our study. For every task in our study, we used only one of these five datasets (see Supplementary Material).
We selected a similar-sized dataset for training the participants, which was from a similar carabid beetle, of the genus Pterostichus. The training was focused on familiarizing the participants with the interaction techniques (see Procedure), so the exact comparability of the data was not important. But we kept the size of the data comparable to that of the main study, to train the participants using similar rendering frame rates.
Tasks
We closely worked with Professor Socha to identify 12 tasks with the beetle dataset that are important to his research. After attempting these tasks ourselves, we rejected two tasks, as they were too difficult to fit within a 1-h study frame. The final list of 10 tasks is in the Supplementary Material. Additionally, we identified five training tasks. The first three provided practice with 3D rotations and translations with the handle of the 3D mouse. The fourth task provided training in technique-specific functionalities, specifically using three slice planes in AAS, using one slice plane in AS, and cracking in VC. The last training task related to system-control commands for switching between opaque and transparency modes, and resetting the dataset to initial position and orientation.
Participants
We recruited 14 participants for our study. Two of them were pilot participants and had no background in biomechanics. The remaining 12 participants were our main study participants. They were either undergraduate or graduate students, with a strong background in analyzing the kind of beetles we had in our study. Professor Socha confirmed that their expertise with the anatomy of carabid beetles did not differ significantly. They were 20–31 years old with an average age of 24.8 years. We distributed them randomly between the three groups in our study, giving us four expert participants per group.
Procedure
The Institutional Review Board of our university approved the study. Upon arrival, the participant signed an informed consent form informing them of their rights to leave at any point during the experiment. They filled out a background questionnaire that captured their demographic details. The experimenter gave a brief summary of the experimental protocol to the participant. The participant was then introduced to the hardware and software used in the study, which included a detailed explanation of the different features of the 3D mouse and the Leap, as relevant to the study.
The experimenter then gave a demo of one of the three interaction techniques, based on the participant’s study group. This included system control illustrations with the 3D mouse, the Leap, and the keyboard.
The 3D mouse demonstrations showed how tilt and push on the handle mapped to the rotations and translations of the dataset. We also included unintended mistakes for interaction instances that trigger translation and rotation simultaneously with the 3D mouse handle, so that the participants knew what to avoid.
The demo of the Leap included a brief look at the Leap motion visualizer interface (Leap-Motion, 2015). It showed how the hand and finger movements are detected with high accuracy and low latency. The experimenter gave a brief explanation of the field of view (FOV) of the Leap (like an inverted cone) and outlined the approximate boundary of the tracked space using his hands. The experimenter demonstrated the uses of the Leap specific to the interaction technique of the participant’s group (see Implementation).
The experimenter then outlined best practices with the Leap to avoid tracking and occlusion problems. The participant was asked to avoid bringing the dominant hand within four to five inches of the Leap and from going outside the boundaries of its FOV. The experimenter also suggested the participant to stretch out the fingers (to avoid occlusion problems and have better tracking), and to sit upright as much as possible.
The participant then performed the training tasks, took an optional break (a few minutes), and completed the main tasks. The main tasks were ordered by increasing difficulty (see Table 1), as determined by Professor Socha.
For each main task, the experimenter recorded the response of the participant, which was evaluated offline using a grading rubric prepared by Professor Socha. The grading rubric had ratings for each task on a scale of 1–10. The increments of the scale varied for each task, as decided by Professor Socha.
There was a maximum allowable time for each task (see Supplementary Material), which the participant was given before beginning a task. The experimenter recorded the time that the participant took to perform each task using a stopwatch. However, the participant was asked to focus on the accuracy of their response rather than on its duration.
After completing the tasks, the participant filled out the post-questionnaire. The experimenter carried out a free-form interview to answer any questions the participant had, before concluding the study. The whole study lasted for about an hour per participant. The experimenter’s demo session lasted around 5 min, and the participant’s training session lasted about 20 min.
Results
The grade for each task (between 0 and 1), and the quantitative metrics from the background questionnaire and the post questionnaire (all on 7-point scales) had ordinal data, while the recorded time was of the continuous type. We employed the non-parametric ordinal logistic regression based on a Chi-square statistic for the ordinal variables, and a one-way analysis of variance (ANOVA) for the time metric. When we found significant differences between the techniques in any of the ordinal data metrics, we further employed the non-parametric two-sided Wilcoxon signed rank test (with Bonferroni corrections) for post hoc analysis. The Wilcoxon test often showed higher p-Values than the original regression tests, as it was more conservative than the ordinal logistic regression model.
To produce an overall performance measure for each participant, we calculated a weighted overall grade, which took into account the difficulty level of each task (Table 1; the difficulty levels were used as weights), and the grade received for each task by each participant.
Grade Metric: The Accuracy of Task Performance
We observed several significant and nearly significant effects of interaction technique on the accuracy of tasks performance. We summarize these in Table 2 and Figure 6.
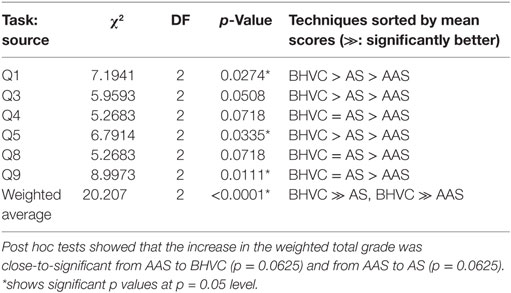
Table 2. Effects of interaction technique on grades for only significant or close-to-significant p Values (<0.1).
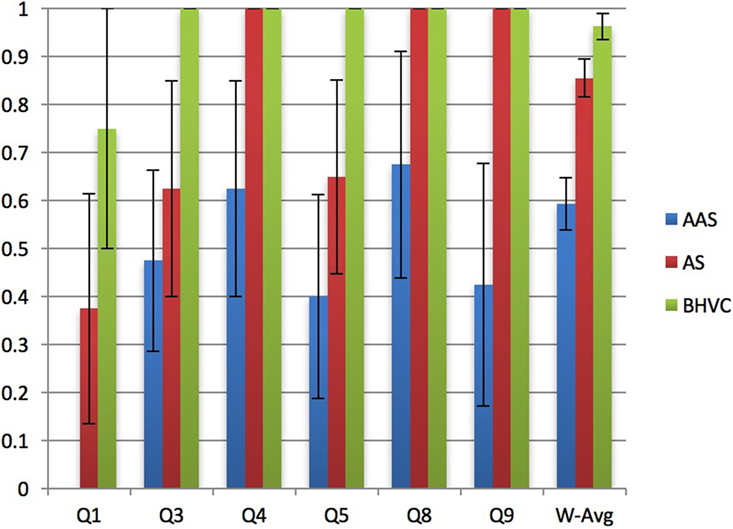
Figure 6. Average grades (with SE bars) secured by the participants with the three interaction techniques for only significant or close-to-significant p Values (<0.1).
Time Metric: The Speed of Task Performance
We did not find any significant difference between the techniques for the speed of completion of any of the tasks. On an average, BHVC participants took longer than the others. For Q10, we found that the effect of technique on the speed of task performance was close-to significant at p = 0.0654, with BHVC being the slowest technique.
Background Questionnaire Metrics
We ran pairwise correlation tests (Spearman’s ρ) between the participants’ weighted overall grade, their total time of task performance, and their self-reported ratings of fatigue, expertise with computers, frequency of computer use (for work and for fun), experience with volume data analysis (in general and with biomechanics), experience with the technique they used, experience with video games or 3D movies at the theater or at home, experience with Nintendo Wiimote, Sony Move, or Microsoft Kinect, and experience with 3D interaction for volume data analysis. Experience with video games or 3D movies (at the theater or at home) showed a significant inverse correlation (ρ = −0.681; p = 0.0148*) with the total time taken for task performance.
Post Questionnaire Metrics
From the post questionnaire responses, we found that the overall experience of the participants differed significantly (χ2df=2 = 14.6325, p = 0.0007*) between the interaction techniques. The difference in the perceived ease of learning the techniques was close-to-significant (χ2df=2 = 4.7167, p = 0.0946). There was no significant difference between the techniques for perceived usefulness or ease of use. Post hoc tests indicate that the improvement in the overall experience of the participants was close-to-significant from AAS to VC (p = 0.0625). 75% of the participants, in each of the AS and BHVC techniques, thought that some form of auto-locking feature of the cutting plane (along the X, Y, or Z axis) would be helpful. Although we did not have a mandatory fatigue reporting metric, half of the AAS participants reported fatigue in their arms.
Discussion
Effect of the Techniques on Task Performance
Revisiting the research questions, we find strong evidence for hypothesis H1.a (BHVC will be more accurate than both AS and AAS). For the overall weighted average scores, BHVC was significantly better than AAS and was also the best overall. For all tasks in which we found significant differences in the accuracy of task performance, BHVC participants consistently received the highest scores (see Figure 6).
There was no significant difference between the techniques for the speed of task performance; however, BHVC was the slowest of them all. This supports our hypothesis H1.b (BHVC will be slower than the other two techniques, in terms of visual analysis task completion). In task Q10, which was the most difficult as per Professor Socha’s rating, BHVC participants were close to being significantly slower than the others. This happened because the participants took time to precisely crack the dataset multiple times, hide some of the sub-volumes, and isolate the small portion of the volume that had a particular piece of anatomy that was required to analyze. This also reflects a result from our previous study (Laha and Bowman, 2013), where we found that VC was slower than the other two techniques for pattern recognition tasks.
Consistency of Performance within Task Groups
Analyzing the results grouped by task type (see Table 1), we find some consistency in the results within the task groups, partially supporting hypothesis H2 (Task performance will be roughly consistent within each task category). For example, the only naive search task in our study (Q1) showed a significant difference between the techniques for accuracy, but none of the counting-based search tasks (Q2, Q6, and Q8) showed any significant difference between techniques. Both shape description tasks (Q3 and Q4) showed close-to-significant differences in task performance, with BHVC participants scoring higher than the rest.
For the spatial judgment tasks (Q5, Q7, Q9, and Q10), the results were mixed, suggesting a possible need for more specificity in that group definition (Laha et al., 2015). Two of the tasks (Q5 and Q9) showed a significant difference between the techniques for accuracy of task performance; whereas for the other two (Q7 and Q10), there was no significant difference between the techniques. Analyzing closely, we found that Q7 might be different than the other three spatial judgment tasks because Q7 was an open-ended search for left–right connections in the dataset, whereas the other three had specific “anchors” around which the tasks were designed.
Our results indicate that tasks designed within the search or the shape description categories showed more consistency in performance than those within the spatial judgment category, from our recent task taxonomy (Laha et al., 2015).
Effect of the Techniques on User Preference
To address the third research question (on user preference), we looked at the post-questionnaire measures. The self-reported overall experience of the participants differed significantly between the techniques, with BHVC receiving the highest ratings, which were close to significantly higher than those of AAS. But the participants did not think that the techniques were different for ease of use, ease of learning, and usefulness. This result partly supports hypothesis H3 (BHVC will be liked more than the other techniques but will have comparable usability ratings and ease of learning), on the comparable usability ratings of the interaction techniques.
2D vs. 3D Interaction for Analysis of Volume Data
The scores of the AS and BHVC participants were comparable for some tasks (Q4, Q8, and Q9), and for others, were significantly (Q9) or nearly significantly (Q4 and Q8) better than the scores of AAS participants. For individual tasks, the scores of the BHVC participants did not significantly differ from those of the AS participants; just for the overall weighted score, BHVC was close to significantly better than AS (at p = 0.0515). Both BHVC and AS being 3D interaction techniques, this strongly suggests that 3DI could significantly improve task performance in visual analysis of volume datasets, over 2D interaction techniques.
From our observations, we believe that the problems with AAS in general were caused by the random orientation of the internal structures in the data and the gaps between them, in contrast to the slicing planes in AAS, which were always axis-aligned. This direct mismatch in the affordance of the interaction and the requirement for analysis caused problems. This mismatch was also reflected in the post-questionnaire comments of one AAS participant. Both AS and BHVC allowed the participants to slice or crack along any arbitrary direction necessary to isolate and closely monitor a structure from a desired angle, which partly overcame the problems with AAS, and highlights the usefulness of 3DI in this specific scenario.
But the loss of context in both AS and in AAS also interfered with the overall analysis. BHVC preserved this lost context (by preserving all voxels at all times), allowed precise isolation of the structures (through turn-the-pages feature), and also allowed hiding less important sub-volumes to give clearer views of the regions of interest in the whole volume. These features in BHVC might have contributed to its overall superior performance.
BHVC vs. VC
Due to all the differences between the BHVC and the original VC system, a direct comparison was neither reasonable nor practical. However, the tradeoffs between the two designs are clear. The original VC was more expressive and less constrained, since the workspace was considerably larger (large enough that the user did not have to worry about getting out of the workspace) and hands could be tracked in any orientation. On the other hand, the BHVC is significantly less cumbersome, because the user could simply walk up and use it, without having to put anything on, and it also avoids tethering the user to the computer by cables. It is important to note here that since the BHVC was created, Leap has released their recent software upgrade nicknamed “Orion,” which improved tracking significantly through their device and overcame much of its previously reported occlusion issues (Laha and Bowman, 2014). As innovations are occurring at a fast pace in the 3DUI industry, it is highly likely that a subsequent study evaluating the BHVC design with updated Leap software would result in a more responsive and accurate user experience.
Toward Hardware-Agnostic Design Principles
Creating hardware-agnostic design guidelines was not the focus of this work. However, the migration of an existing 3DI tool (VC) between disparate hardware platforms provided important learning experiences, described below.
Hardware Idiosyncrasies Dictate Design Choices
To avoid the encumbrances involved with tethered 5DT gloves, we used a bare-hand tracking device, but we faced occlusion issues with its camera-based tracking. Alternatively, we could have used electromagnetic [e.g., Polhemus’ G4 (Polhemus, 2015)], or inertial trackers [e.g., Intersense’s Inertiacube (Intersense, 2015)], which are much higher priced (thousands of dollars) than commodity tracking devices and involve tethering the user’s hands. Other optical or vision-based trackers [such as Vicon (2015)] would also have occlusion issues.
Our chosen bare-hand tracking device currently has the best combination of low latency and high accuracy in the consumer price range. But it suffered from occlusion issues, aside from occasional tracking issues (jitters and random assignment of hand IDs), when two hands were tracked simultaneously. Our decision to stick to this hardware led us to make design choices to optimize the performance of our technique, working around the hardware problems. This led to important design decisions, which were not always natural (like open palm for grab action), but still led to effective 3DI technique design. We believe our choices can potentially inform future 3DI designs in the realm of infrared-based tracking devices for desktops.
Use Natural Mappings for Gestures When Possible but Not at All Costs
Prior research has shown that naturalness is not a necessary criterion for optimal design decisions; depending on the task in focus, naturalness in the interaction could be beneficial or detrimental (Bowman et al., 2012). This is directly reflected in our current design and evaluation. Not all interactions were natural in our case, but the overall package (combining interaction techniques and tracking hardware) of both BHVC and AS proved to be effective, over AAS. Our evaluation showed that the expert participants performed better with BHVC and AS in their standard analysis tasks – the increase in the weighted total grade was close-to-significant from AAS to BHVC and from AAS to AS.
The experts’ preference (based on overall experience) of our BHVC technique was close to significantly better over the standard 2D technique (AAS), whereas there was no significant difference between the interaction techniques in the perceived usefulness and ease of use. This is a very strong result, considering the non-naturalness of some of the interactions with BHVC.
It is also important to note that the symmetric version of the BHVC failed partly because of the occlusion problems caused by a two-handed, fully gestural interface. But the technique-specific gestures, when used in combination with another input device handling 3D manipulation and system control (asymmetric BHVC), were very useful. So, effective 3DI designs may not always need to be fully gesture-based.
Comfort Is Important in Gesture-Based 3DI Design
The symmetric BHVC could induce fatigue in the forearms quickly, which was a stated concern of Professor Socha. The asymmetric BHVC not only reduced fatigue by having just one hand for gestures, but also allowed to “clutch” or freeze the visualization imprecisely when needed, while turning-the-pages allowed precision in sub-volume selection. Lower comfort in the AAS design was also reflected by one of the participants reporting fatigue with it, but we had no objective measure for it. The Leap requires a user’s hands to be always within its FOV, and floating in free space, which can cause more fatigue than from trackers without restricted FOV. This is a general problem with camera-based trackers, which can be mitigated by wearable or inertial (Intersense, 2015) or magnetic hand trackers (Polhemus, 2015).
Other Observations and Thoughts
We also found that the participants with higher experience in video games or 3D movies were faster in their task completion, which probably suggests that some proficiency in using 3D input devices might be helpful for using the interfaces we designed. Multiple participants suggested in the post-questionnaire comments that switching the direction of some of the axes in the 3D mouse might be useful. We think this resulted from their perceptual mismatch between the egocentric viewing (e.g., in games) and the exocentric viewing in our design.
The AS and BHVC participants recurrently noted a desire to restrict the movement of the cutting plane. This request suggests that the participants found the combined degrees of freedom in 3D manipulation and slicing or cracking to interfere with their ability to focus on the task at hand. Some of the participants in the AS and the AAS also thought that having a translucent or “ghost” version of the sliced part of the dataset might be helpful. We believe that this points to the probable loss of important context for visual analysis, due to slicing.
Conclusion and Future Work
We present the design of a bare-hand version of the VC technique (Laha and Bowman, 2013) and provide evidence that the interface has significant benefits over baseline 2D (AAS) and 3D (AS) interaction techniques for certain categories of generic visual analysis tasks with volume visualization (Laha et al., 2015). Our contributions include a practical bare-hand version of the VC, which could be directly adapted by domain scientists in their labs. We also contribute the lessons learned while redesigning an existing technique to use a bare-hand tracking device (Leap), provide guidance for designing bare-hand interactions for infrared-based desktop tracking devices, and insights into hardware-agnostic design principles. Our evaluation with experts and real-world datasets provides evidence for the benefits of 3D interaction techniques (VC and AS) over standard 2D interaction techniques (AAS), and in particular, for improvements in task performance with BHVC. Lastly, our results indicate that tasks mapped to a recent abstract task taxonomy (Laha et al., 2015) showed more consistency in performance within search and shape description categories than within spatial judgment. Our contributions are in the realm of 3D user interfaces tightly integrated with and inspired by techniques developed in 3D visualization research. We believe BHVC is geared to improve the effectiveness of 3D visualizations for visual analysis of volume datasets.
Future work may include design and evaluation of 3D techniques and tools aimed at addressing the problems specific to other task categories in a generic mapping of tasks (Laha et al., 2015), so that the impact of the work is across multiple scientific disciplines. We suggest that the next iteration of the VC explore using a volumetric region of magnetic influence of the dominant hand, such as a sphere, as opposed to a plane used in our design (see Bimanual-Asymmetric Interface Design for BHVC). Careful design of a suite of 3D interaction tools and its evaluation against standard techniques used currently can produce the next generation of segmentation and classification techniques. Future evaluation studies can also compare the precision of bare-hand interaction techniques to that of the mouse for the level required in precise region-of interest isolation for volume data segmentation.
Author Contributions
BL, concept development, designing software and hardware, running study, analyzing results, and writing the paper. DB, concept development, analyzing results, and writing paper. JS, providing domain expertise, locating study participants, and writing the paper.
Conflict of Interest Statement
The authors declare that the research was conducted in the absence of any commercial or financial relationships that could be construed as a potential conflict of interest.
Funding
Our research was supported by the National Science Foundation under Grant No. 1320046 and 0938047 and an IBM Ph.D. Fellowship (2013–14). Use of the Advanced Photon Source, an Office of Science User Facility operated for the U.S. Department of Energy (DOE) Office of Science by Argonne National Laboratory, was supported by the U.S. DOE under Contract No. DE-AC02-06CH11357. We thank all the researchers from the Socha Lab at Virginia Tech who participated in the evaluation of the BHVC technique.
Supplementary Material
The Supplementary Material for this article can be found online at https://www.frontiersin.org/article/10.3389/frobt.2016.00056
References
3D-Connexion. (2015). Available at: http://www.3dconnexion.com/products/spacemousepro.html
3Gear-Systems. (2015). Available at: http://threegear.com/
Besançon, L., Issartel, P., Ammi, M., and Isenberg, T. (2017). Hybrid tactile/tangible interaction for 3D data exploration. IEEE Trans. Vis. Comput. Graph. 23. doi: 10.1109/TVCG.2016.2599217
Bowman, D. A., Kruijff, E., LaViola, J. J., and Poupyrev, I. (2005). 3D User Interfaces: Theory and Practice, Vol. 1. Reading, MA: Addison-Wesley.
Bowman, D. A., McMahan, R. P., and Ragan, E. D. (2012). Questioning naturalism in 3D user interfaces. Commun. ACM 55, 78–88. doi:10.1145/2330667.2330687
Bruckner, S., and Gröller, M. E. (2006). Exploded views for volume data. IEEE Trans. Vis. Comput. Graph 12, 1077–1084. doi:10.1109/TVCG.2006.140
Coffey, D., Malbraaten, N., Le, T. B., Borazjani, I., Sotiropoulos, F., Erdman, A. G., et al. (2012). Interactive slice WIM: navigating and interrogating volume data sets using a multisurface, multitouch VR interface. IEEE Trans. Vis. Comput. Graph. 18, 1614–1626. doi:10.1109/TVCG.2011.283
Fifth_Dimension_Technologies. (2015). Available at: http://www.5dt.com/?page_id=34
Guiard, Y. (1987). Asymmetric division of labor in human skilled bimanual action: the kinematic chain as a model. J. Mot. Behav. 19, 486–517. doi:10.1080/00222895.1987.10735426
Hinckley, K., Pausch, R., Goble, J. C., and Kassell, N. F. (1994a). “Passive real-world interface props for neurosurgical visualization,” in Paper Presented at the Proceedings of the SIGCHI Conference on Human Factors in Computing Systems, Boston, MA.
Hinckley, K., Pausch, R., Goble, J. C., and Kassell, N. F. (1994b). “Three-dimensional user interface for neurosurgical visualization,” in Paper Presented at the Medical Imaging 1994, Newport Beach, CA.
ImageJ. (2015). Available at: http://imagej.nih.gov/ij/
Intersense. (2015). Available at: http://www.intersense.com/categories/18/
Isenberg, T. (2016). “Interactive exploration of 3D scientific visualizations on large display surfaces,” in Collaboration Meets Interactive Surfaces and Spaces: Theory and Practice (to Appear), eds C. Anslow, P. Campos, and J. Jorge (Berlin/Heidelberg: Springer).
Jackson, B., Lau, T. Y., Schroeder, D., Toussaint, K. C. Jr, and Keefe, D. F. (2013). A lightweight tangible 3D interface for interactive visualization of thin fiber structures. IEEE Trans. Vis. Comput. Graph. 19, 2802–2809. doi:10.1109/TVCG.2013.121
Kirmizibayrak, C., Radeva, N., Wakid, M., Philbeck, J., Sibert, J., and Hahn, J. (2011). “Evaluation of gesture based interfaces for medical volume visualization tasks,” in Paper Presented at the Proceedings of the 10th International Conference on Virtual Reality Continuum and Its Applications in Industry, Hong Kong.
Laha, B., and Bowman, D. A. (2013). “Volume cracker: a bimanual 3D interaction technique for analysis of raw volumetric data,” in Paper Presented at the ACM Symposium on Spatial User Interaction (SUI) (California).
Laha, B., and Bowman, D. A. (2014). “Design of the bare-hand volume cracker for analysis of raw volumetric data,” in Paper Presented at the 2014 IEEE VR Workshop on Immersive Volumetric Interaction (WIVI 2014) (Minneapolis, MN).
Laha, B., Bowman, D. A., Laidlaw, D. H., and Socha, J. J. (2015). “A classification of user tasks in visual analysis of volume data,” in Paper Presented at the IEEE Scientific Visualization (Chicago, IL).
Leap-Motion. (2015). Available at: https://leapmotion.com/
Marai, G. E., Laidlaw, D. H., and Crisco, J. J. (2006). Super-resolution registration using tissue-classified distance fields. IEEE Trans. Med. Imaging 25, 177–187. doi:10.1109/TMI.2005.862151
McGuffin, M. J., Tancau, L., and Balakrishnan, R. (2003). “Using deformations for browsing volumetric data,” in Paper Presented at the IEEE Visualization, Seattle, WA.
Mlyniec, P., Jerald, J., Yoganandan, A., Seagull, F. J., Toledo, F., and Schultheis, U. (2011). “iMedic: a two-handed immersive medical environment for distributed interactive consultation,” in Medicine Meets Virtual Reality 18: NextMed, eds J. D. Westwood, S. W. Westwood, L. Felländer-Tsai, R. S. Haluck, H. M. Hoffman, R. A. Robb, et al. Vol. 163 (Amsterdam: IOS Press), 372–378.
Monclús, E., Díaz, J., Navazo, I., and Vázquez, P.-P. (2009). “The virtual magic lantern: an interaction metaphor for enhanced medical data inspection,” in Paper Presented at the Proceedings of the 16th ACM Symposium on Virtual Reality Software and Technology, Kyoto.
NGRAIN-Constructor-SDK. (2015). Available at: https://www.ngrain.com/ngrain-constructor-sdk-5-available-now/
Polhemus. (2015). Available at: http://polhemus.com/motion-tracking/all-trackers/g4
Poupyrev, I., Weghorst, S., and Fels, S. (2000). “Non-isomorphic 3D rotational techniques,” in Paper Presented at the SIGCHI Conference on Human Factors in Computing Systems, The Hague.
Preim, B., Tietjen, C., Spindler, W., and Peitgen, H. O. (2002). “Integration of measurement tools in medical 3d visualizations,” in Paper Presented at the Proceedings of the Conference on Visualization’02, Boston, MA.
Qi, W., and Martens, J.-B. (2005). “Tangible user interfaces for 3D clipping plane interaction with volumetric data: a case study,” in Paper Presented at the Proceedings of the 7th International Conference on Multimodal Interfaces, Trento.
Reitinger, B., Schmalstieg, D., Bornik, A., and Beichel, R. (2006). “Spatial analysis tools for virtual reality-based surgical planning,” in Paper Presented at the 3D User Interfaces (3DUI’06), Alexandria, VA.
Schultheis, U., Jerald, J., Toledo, F., Yoganandan, A., and Mlyniec, P. (2012). “Comparison of a two-handed interface to a wand interface and a mouse interface for fundamental 3D tasks,” in Paper Presented at the 2012 IEEE Symposium on 3D User Interfaces (3DUI), Orange County, CA.
Socha, J. J., and De Carlo, F. (2008). “Use of synchrotron tomography to image naturalistic anatomy in insects,” in Paper Presented at the Developments in X-Ray Tomography VI: 2008, ed. S. R. Stock (San Diego, CA: SPIE), 70780A-1–70780A-7.
Socha, J. J., Lee, W. K., Harrison, J. F., Waters, J. S., Fezzaa, K., and Westneat, M. W. (2008). Correlated patterns of tracheal compression and convective gas exchange in a carabid beetle. J. Exp. Biol. 211, 3409–3420. doi:10.1242/jeb.019877
Stoakley, R., Conway, M. J., and Pausch, R. (1995). “Virtual reality on a WIM: interactive worlds in miniature,” in Paper Presented at the Proceedings of the SIGCHI Conference on Human Factors in Computing Systems, Denver, CO.
Ulinski, A. C. (2008). Taxonomy and Experimental Evaluation of Two-Handed Selection Techniques for Volumetric Data Doctoral Dissertation. Charlotte, NC: The University of North Carolina.
Vicon. (2015). Available at: http://www.vicon.com/
Wang, L., Zhao, Y., Mueller, K., and Kaufman, A. E. (2005). “The magic volume lens: an interactive focus + context technique for volume rendering,” in Paper Presented at the IEEE Visualization, Minneapolis, MN.
Weiskopf, D., Engel, K., and Ertl, T. (2003). Interactive clipping techniques for texture-based volume visualization and volume shading. IEEE Trans. Vis. Comput. Graph 9, 298–312. doi:10.1109/TVCG.2003.1207438
Westneat, M. W., Betz, O., Blob, R. W., Fezzaa, K., Cooper, W. J., and Lee, W. K. (2003). Tracheal respiration in insects visualized with synchrotron X-ray imaging. Science 299, 558–560. doi:10.1126/science.1078008
Xiao, X., Fusseis, F., and De Carlo, F. (2012). “X-ray fast tomography and its applications in dynamical phenomena studies in geosciences at advanced photon source,” in Paper Presented at the SPIE Optical Engineering+Applications, San Diego, CA.
Xradia-Solutions. (2012). Available at: http://www.xradia.com/solutions/index.php
Keywords: 3D interaction, 3D visualization, volume data analysis, bimanual interaction, virtual reality
Citation: Laha B, Bowman DA and Socha JJ (2016) Bare-Hand Volume Cracker for Raw Volume Data Analysis. Front. Robot. AI 3:56. doi: 10.3389/frobt.2016.00056
Received: 01 June 2016; Accepted: 08 September 2016;
Published: 28 September 2016
Edited by:
Mel Slater, University of Barcelona, SpainReviewed by:
Daniel Keefe, University of Minnesota, USAEva Monclús, Universitat Politècnica de Catalunya BarcelonaTech (UPC), Spain
Copyright: © 2016 Laha, Bowman and Socha. This is an open-access article distributed under the terms of the Creative Commons Attribution License (CC BY). The use, distribution or reproduction in other forums is permitted, provided the original author(s) or licensor are credited and that the original publication in this journal is cited, in accordance with accepted academic practice. No use, distribution or reproduction is permitted which does not comply with these terms.
*Correspondence: Bireswar Laha, laha@stanford.edu