Navigating a 2D Virtual World Using Direct Brain Stimulation
 Darby M. Losey
 Andrea Stocco
 Justin A. Abernethy3,4
  Rajesh P. N. Rao
- 1Department of Computer Science and Engineering, University of Washington, Seattle, WA, USA
- 2Department of Neurobiology, University of Washington, Seattle, WA, USA
- 3Department of Psychology, University of Washington, Seattle, WA, USA
- 4Institute for Learning and Brain Sciences, University of Washington, Seattle, WA, USA
- 5Center for Sensorimotor Neural Engineering, University of Washington, Seattle, WA, USA
Can the human brain learn to interpret inputs from a virtual world delivered directly through brain stimulation? We answer this question by describing the first demonstration of humans playing a computer game utilizing only direct brain stimulation and no other sensory inputs. The demonstration also provides the first instance of artificial sensory information, in this case depth, being delivered directly to the human brain through non-invasive methods. Our approach utilizes transcranial magnetic stimulation (TMS) of the human visual cortex to convey binary information about obstacles in a virtual maze. At certain intensities, TMS elicits visual percepts known as phosphenes, which transmit information to the subject about their current location within the maze. Using this computer–brain interface, five subjects successfully navigated an average of 92% of all the steps in a variety of virtual maze worlds. They also became more accurate in solving the task over time. These results suggest that humans can learn to utilize information delivered directly and non-invasively to their brains to solve tasks that cannot be solved using their natural senses, opening the door to human sensory augmentation and novel modes of human–computer interaction.
Introduction
Considerable progress has been made in interpreting information recorded from the brain to build non-invasive brain–computer interfaces (BCIs) (Rao, 2013) that allow control over a wide variety of devices, such as cursors (Wolpaw et al., 1991), robots (Bell et al., 2008), and spellers (Xu et al., 2013). While these efforts have focused on decoding information from the brain, an important question that has not received as much attention is: can novel information from artificial sensors or computer-generated virtual worlds be encoded and delivered non-invasively to the human brain to solve useful tasks? We address this question by showing that transcranial magnetic stimulation (TMS) can be used to deliver useful information to the human brain to solve a simple navigation task in a virtual world. To our knowledge, this is the first demonstration that non-invasive human brain stimulation can be used for such a purpose, the most closely related previous demonstration being the work of Thomson et al. (2013) who used invasive stimulation of somatosensory cortex in rats to deliver infrared information for solving a discrimination task. Other research efforts, also in rats, have focused on the neural mechanisms of navigation in virtual reality using visual or auditory cues (Cushman et al., 2013; Aghajan et al., 2015) rather than direct sensory feedback through stimulation.
Transcranial magnetic stimulation has been and continues to be used as an important investigative tool for cortical “knockout” studies (Pascual-Leone et al., 1999; Devlin and Watkins, 2007), neurophysiology (Terhune et al., 2015), and medical treatment (Menkes et al., 1999; George et al., 2000). The realm of applications of TMS has recently expanded as it has emerged as a tool for non-invasive neural encoding of information via a computer–brain interface (CBI), specifically within the context of human brain-to-brain communication (Grau et al., 2014; Rao et al., 2014; Stocco et al., 2015). Rao et al. (2014) utilized TMS over the primary motor cortex to elicit a hand movement in correspondence with changes in the motor rhythms (mu band power) of another subject. As with Rao and colleagues, Grau et al. (2014) transferred information through a brain-to-brain interface utilizing changes in mu band power and encoding information in TMS-produced phosphenes, though the information transfer was not in real time. The presence or absence of phosphenes, temporary visual percepts of lines or spots that can occur upon neuromodulation of the visual cortex represented a binary message that was used to build simple words. Stocco et al. (2015) also utilized phosphene perception in a different brain-to-brain interface that allowed 2-way communication. In this case, Yes/No answers in a 20-questions game were decoded from one subject’s steady-state visually evoked potentials (SSVEPs) and sent in real-time to another subject, where this information was encoded in the presence or absence of phosphenes.
In the present study, phosphene elicitation via single pulse TMS over the primary visual cortex was utilized for augmenting human sensory capability. Information is relayed to the subject about obstacle depth in a virtual environment where the subject is deprived of visual information about the world they are navigating. The intensity of stimulation depends on the relative position of an avatar to the wall of the maze, such that being close to the wall causes the subject to perceive a phosphene and being far from a wall results in the absence of a phosphene. The subject advances in the maze if they correctly interpret the stimulation.
We demonstrate that the decision time in classification of phosphenes directly correlates with the probability of answering correctly. Subjects also became more accurate in solving the navigation task over the course of the experiment. Both of these results suggest that phosphene perception is an interpretable phenomenon, allowing subjects to learn to interpret and incorporate inputs from a CBI as a new artificial source of useful sensory signals.
Materials and Methods
Subject Recruitment
Five healthy participants (age: M = 30.6, SD = 6.95, range 19–39; 3 females; see Table 1) were recruited via word of mouth among the University of Washington student, staff, and faculty population. This study was carried out in accordance with the recommendations of the University of Washington Institutional Review Board under application #48773. All subjects gave written informed consent in accordance with the Declaration of Helsinki prior to participation in the study. All subjects recruited successfully completed the experiment.
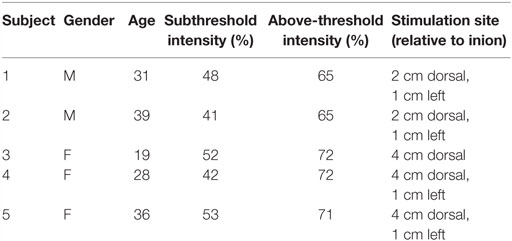
Table 1. Subject demographics and stimulation intensities.
Generation of Mazes
Fourteen experimental mazes and seven control mazes (see Control Conditions below) were generated and utilized for all participants. All mazes were 10 steps in length and consisted of a path that required a combination of forward or downward movements (Figure 1). The 14 experimental mazes comprised of two sets of seven mazes. Each set of seven mazes consisted of one maze with each of zero through six “turns” randomly distributed throughout the maze, where a turn is a switch between forward and downward movements. The second set of seven experimental mazes represented the mirror image of the first set, such that all forward movements were replaced with downward movements and vice versa. The control mazes were selected such that for each of the one through six turn conditions, a maze from the original set or the mirrored set was randomly selected and added to the control set. The control maze with 0 turns was selected to include only downward movements to avoid the trivial case in which a subject would likely finish the maze under the control conditions. The order in which the mazes were presented to the subject was randomized once and kept consistent between subjects. Figure 2 illustrates the mazes used in the experiment.
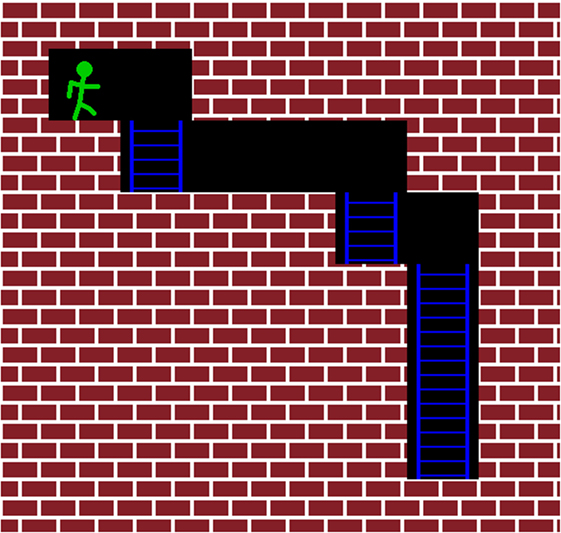
Figure 1. This figure illustrates the starting position of the second maze (see Figure 2). The subject’s avatar starts in the upper-left corner of the maze. The goal is to move the avatar toward the bottom-rightmost position. The intensity of the TMS pulse is determined by the position of the closest wall in front of the avatar. If a wall is directly in front of the avatar, the subject receives an above-threshold pulse. A subthreshold pulse is fired if there is no wall directly in front of the avatar, as in this figure.
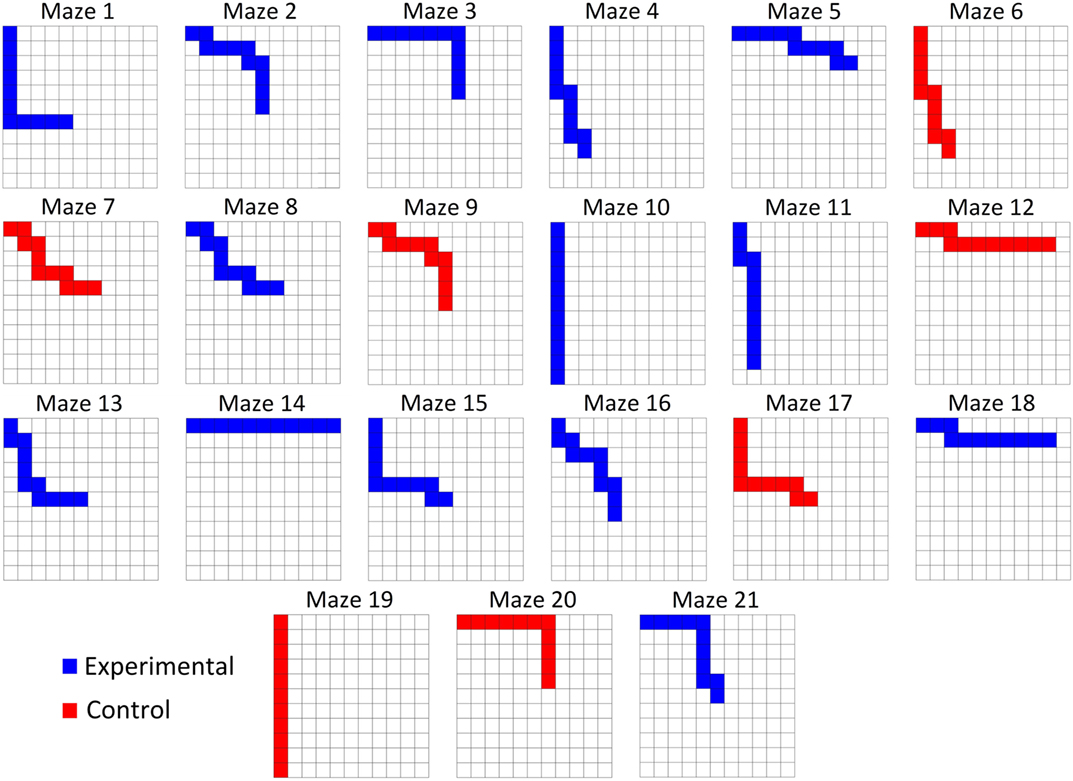
Figure 2. All subjects were tested on the same mazes in the same order. Each maze was 10 steps in length. Participants only advanced if they correctly interpreted the input from the CBI and made the correct movement.
Control Conditions
In order to ensure that information came solely from the CBI, 7 control games were randomly intermixed with the 14 experimental games. During these control trials, a custom-made plastic prop, whose design was intended to mimic the shape and texture of the TMS coil, was placed over the coil, separating the coil from the scalp of the subject by 20 mm (Figure 3). This additional distance prevents the appearance of phosphenes while mimicking other sensory cues that could provide information about the subject’s location in the maze, such as the noise and the vibration generated by the TMS machine upon firing. This prop was tested for each subject during the thresholding phase (described below) to ensure its effectiveness in preventing phosphene perception.
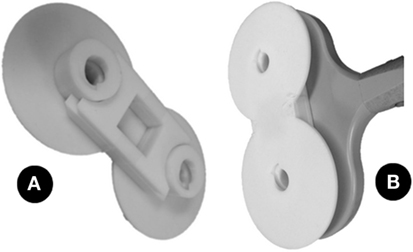
Figure 3. (A) The photo shows the prop used in the control condition. It is designed to mimic the texture and size of the TMS coil, but when applied to the coil (B), it separates the coil from the head by 20 mm, thus preventing the appearance of phosphenes.
Prior to the experiment, subjects were made aware of the existence of the control condition but were not informed about which games the control condition would apply to or the ratio of experimental to control games. During the control condition, the TMS machine still fired at intensities appropriate to the avatar’s location within the maze, irrelevant of its designation as a control game. Upon completion of the control maze, the subject was notified of the game’s designation as part of the control set so as to not mislead the subject about their performance, which may impede their confidence in phosphene perception and influence their future performance.
The methodology with which the mazes were constructed ensured that one maze consisted of a straight hallway with no turns, which would cause all TMS pulses to be subthreshold, and would thus mimic the perception of a control condition while not actually being a control maze. This was done to help prevent subjects from trying to guess whether the control condition was in place from a prolonged lack of phosphenes.
Determination of Phosphene Thresholds
Prior to the experiment, each subject underwent a screening session in order to determine the intensity and location at which they reliably perceived phosphenes from a single pulse TMS stimulation. As convention, the intensity of stimulation is expressed as a percentage of the maximum output, which, in this case, is a 2.2-T magnetic field from a 70-mm figure-of-8 coil (Double 70 mm Alpha coil, Magstim, UK; Figure 4) generated by a 660-V electric field from a biphasic transcranial magnetic stimulator (Super Rapid2, Magstim, UK; Figure 4). The subject wore a tight-fitting cap, in which the location of the inion was marked as a reference point for the stimulation process. A 4 cm × 4 cm grid of locations, arranged in 1-cm spaced rows and columns, was then drawn 1 cm dorsal to the inion (Figure 5). For a given location, the suitability as a candidate “hotspot” for stimulation was determined by administering seven pulses of increasing intensity, in increments of 5%, starting at 45%. If the subject did not perceive a phosphene by the 75% mark, a new location was examined. Based on the results of Stocco et al. (2015), the first stimulation site examined was 2 cm dorsal, 1 cm left of the inion. Subsequent sites were then examined at increasing distance from this starting point. The first location at which the subject could perceive phosphenes at intensities less than 75% was designated as the target site for the stimulation hotspot. For safety, the subject was not stimulated more than once in a given 8 s interval, either during the thresholding procedure or during the experimental session. The above-threshold intensity was determined as the lowest intensity for which the subject reported phosphene perception for 10 consecutive stimulations. Conversely, the subthreshold intensity was determined as the largest intensity for which no phosphene was perceived for 10 consecutive stimulations. The control condition was then tested to ensure that participants could not perceive phosphenes when stimulated at the above-threshold intensity.
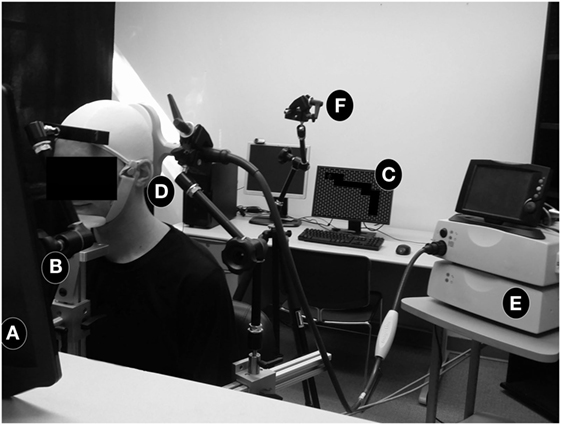
Figure 4. Depiction of the experimental setup. The subject sat on a BrainSight™ chair (Rogue Research, Montreal, QC, Canada) with a white swim cap in front of a touch screen monitor (A) with their head situated in a two-pronged head-and-chin-rest (B). The current maze was displayed to the experimenter on a separate monitor not visible to the subject (C). A figure-eight TMS coil (D) was situated over the stimulation site in the orientation shown. The angle of the coil was consistent across all subjects. In the control condition, the coil was covered by the control prop (partially visible in the figure; see Figure 3). The coil, powered by a MagStim Super Rapid2 stimulator (E), was positioned using a laser pointer (F) at the beginning of every maze game.
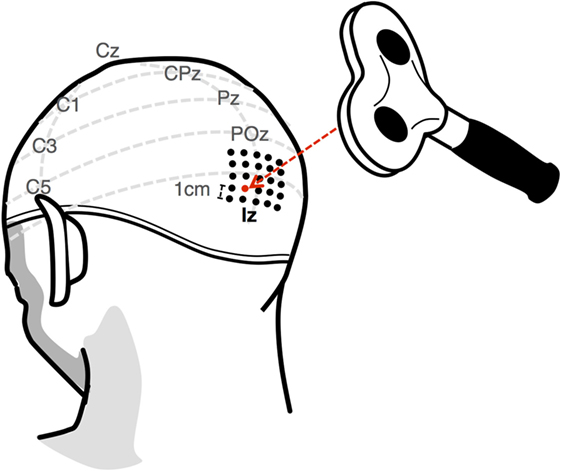
Figure 5. The phosphene threshold for each subject was found by first marking a 4 cm × 4 cm grid 1 cm dorsal to the inion. A candidate location was determined by stimulating at increasing intensities up to 75%. If a phosphene was not perceived, a new location was examined. The final above-threshold intensity was established as the minimum intensity for which subjects perceived a phosphene for 10 consecutive stimulations. Conversely, the subthreshold intensity was established as the maximum intensity for which a subject did not perceive a phosphene after 10 consecutive stimulations.
It should be noted that this method of phosphene perception implicitly accounts for minute individual differences between subjects, such as varying skull thickness or neural architecture. Additionally, only a subset of all possible stimulation locations and parameters are examined. While a more reliable stimulation site may exist, the first reliable location was selected in order to minimize the number of stimulations administered during the thresholding phase. Therefore, because the choice of the location was not optimized for each subject, our results are likely a conservative estimate and underestimate the participants’ achievable performance.
Experimental Paradigm
The subject sat in a darkened room in front of a touch screen computer monitor that displayed a fixation cross. A pair of 36 dB noise-canceling earplugs was used to help mask potential external cues and allow for better concentration. The TMS coil was placed over the subject’s occipital lobe at a location determined during the thresholding procedure (described above). The subject’s avatar started in the upper-left portion of the maze (Figure 1). If the avatar was directly in front of a wall, an above-threshold TMS pulse was fired; otherwise, a subthreshold pulse was fired. Note that the maze was displayed on a second screen visible only to the experimenter (Figure 4) and remained hidden from the participants until the end of each maze. Instead, the screen visible to participants displayed a fixation sign cross while they waited for the next stimulation. Two seconds after the TMS fired, a question box appeared asking if the subject wishes to move forward in the maze or down a ladder. To avoid potential confusion, a reminder that the presence of a phosphene corresponds to a downward movement also displayed on screen. The subject answered the question by hitting one of two buttons on the touch screen computer monitor to move forward or downward. If the subject identified the necessary movement correctly, their avatar advanced one space in that direction. If the subject misinterpreted the stimulation, they did not advance forward in the maze (Figure 6); in this case, the avatar remained in the same location, and the same intensity stimulation was fired in the next time step, effectively repeating the time step. Each maze required 10 correct steps to be traversed completely. Correspondingly, each subject was given 10 stimulations per maze, and thus 10 opportunities to move. After the 10 simulations, the maze was displayed on the subject’s screen to allow them to view their avatar’s final location within the maze, and the subject was notified if that game was part of the control set. The maze was then hidden from their view as the next game commenced. Prior to the start of each game, the experimenter examined the subject’s head position and relative coil position using a guiding laser pointed at the stimulation site (Figure 4). If the next maze was a part of the control set, the experimenter attached the control prop (Figure 3) to the TMS coil when readjusting head position. To keep the timing of the operations consistent across different conditions, the experimenter mimicked the procedure of inserting the control prop before every trial, including experimental trials.
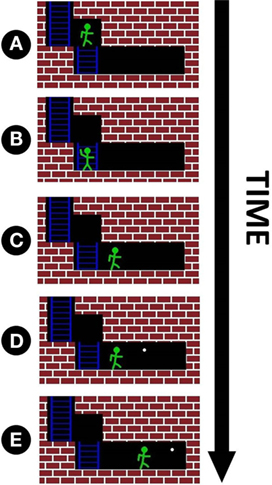
Figure 6. For each maze, the subject has ten opportunities for movement. An example of four hypothetical movements is shown above. Note that the maze is not visible to the subject until the end of the trial, and all movement decisions must be made based only on TMS pulses. (A) The avatar is directly in front of a wall, thus triggering an above-threshold TMS pulse. The subject identifies this pulse correctly and makes a discrete movement down to the location shown in (B). (B) Since no wall is in front of the avatar, a subthreshold pulse is triggered. The subject correctly identifies this pulse and advances to the location shown in (C). (C) No wall directly in front corresponds to another subthreshold pulse. This time, the subject misidentifies the pulse and does not advance. (D) The white dot marks the location the avatar would have occupied if the subject had answered with 100% accuracy for the duration of current game (the white dot only marks this optimal location and has no influence on pulse intensity). As there is still no wall directly in front of the avatar, a subthreshold pulse is fired again. The subject correctly identifies that no obstacle is directly in the avatar’s path and advances one space forward. (E) This marks the end of the game. At this point, the maze is displayed on the subject’s screen to provide feedback on how far they progressed through the maze. Note that whenever the subject views the screen, either the avatar or the white dot will occupy the last location in the maze, corresponding to completing or not completing the maze, respectively.
Results
On average, participants completely traversed 70% of the mazes under the experimental conditions and 0% in the control conditions. The difference was statistically significant [paired t(4) = 3.89, p < 0.02; Figure 7A]. Note that, as participants needed 10 consecutive correct categorizations in order to complete a maze, a single mistake caused them to fall short of traversing the entire maze. Therefore, this analysis is a conservative measure of performance. A more sensitive measure is the number of correct steps performed by participants under each condition. Participants completed an average of 92% of the steps in the experimental condition, significantly more than 15.4% of the steps in the control condition [t(4) = 11.59, p = 0.0003; Figure 7B]. In the control conditions, an ideal observer would always assume that, since no phosphenes are being perceived, he or she should always move forward. This would result in correctly performing only the initial forward movements for the control mazes and getting “stuck” at the first wall obstacle. This represents 14.2% of the total number of movements and is thus the baseline performance for the control condition. Two one-sided t-tests showed that participants performed above baseline in the experimental condition [t(4) = 14.15, p = 0.0001], but not in the control condition [t(4) = 1.00, p = 0.38].
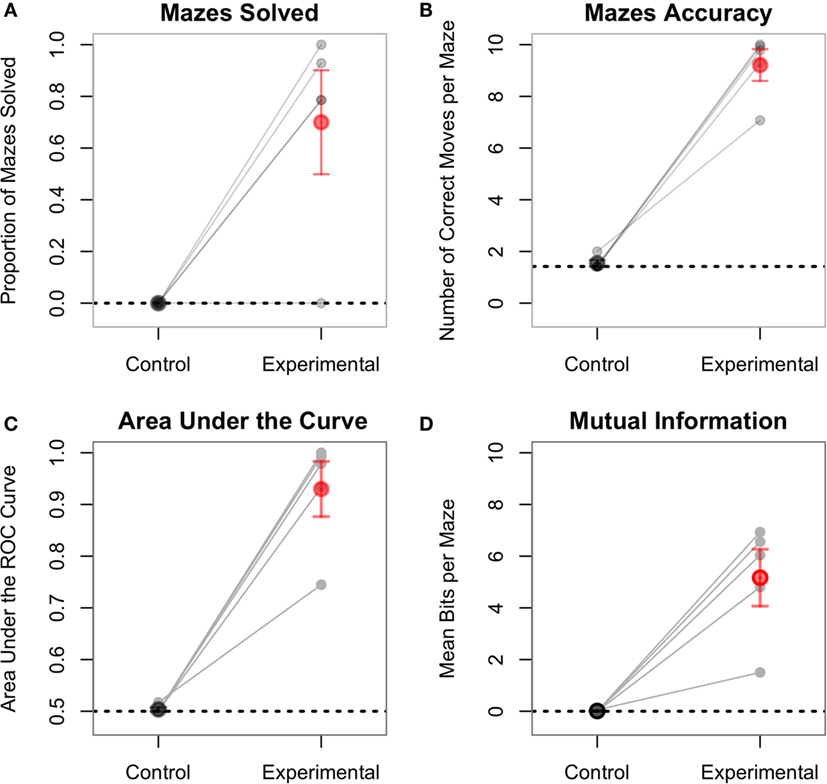
Figure 7. Each line represents one subject, separately showing the experimental and control conditions. For all plots, the control condition is not statistically significant from baseline performance (dashed line). (A) The proportion of mazes solved (i.e., fully traversed) ranged from 0 to 100% in the experimental condition. In order to fully traverse a maze, subjects had to correctly classify all 10 consecutive pulses. (B) This figure shows the aggregate accuracy for the entirety of the experiment. One subject, despite not fully traversing any maze, still had an accuracy of over 70% for the experimental condition. (C) The AUC plot is the area under the curve of the ROC plots shown in Figure 8. (D) Mutual information is a measure of the amount of information successfully transferred from the CBI to the participant.
Signal detection theory also provides another dimension of analysis. Specifically, the performance of each subject can be visually described using ROC curves (Fawcett and Tom, 2006), which plot the true positives rate vs. the false positives rate for both experimental and control conditions. In this analysis, the “signal” is the correct direction at each step, and the “prediction” is the action selected by the participant. Figure 8 shows the ROC curves for each participant. Within this framework, the performance of each participant in both the experimental and control conditions can be quantified as the area under the curve (AUC) of the corresponding ROC plot (Figure 7C). The AUC value ranges from 1.0 (an ideal detector that recognizes all true positives with 0 false positives) to 0.5 (a random responder). Individual AUCs were calculated using the ROCR package for R (Sing et al., 2005). Because the AUC is inherently non-normal, the raw data were arcsin-root transformed before being analyzed. The mean raw AUC for the control condition was exactly at chance (0.50), whereas the raw AUC for the experimental condition was 0.93. This is significantly larger than chance [t(4) = 9.40, p = 0.0007].
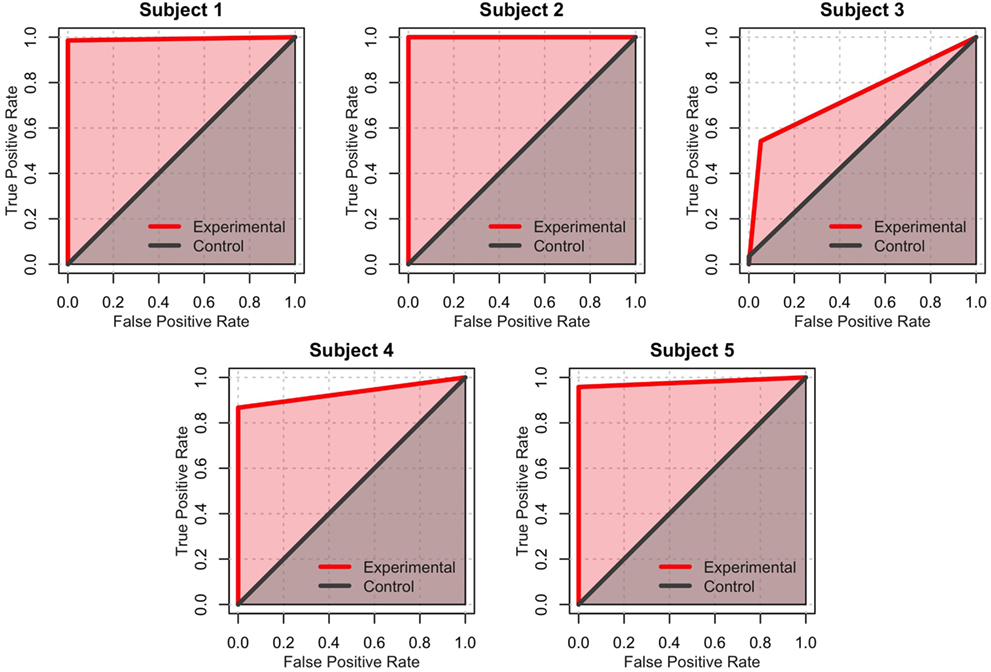
Figure 8. Receiver operating characteristics (ROC) for the control games (gray) and experimental games (red). A perfect classifier (100% true positives and 0% false positives) occupies the upper-leftmost corner of the graph. In contrast, a random classifier is represented by a straight line across the diagonal. The experimental condition of Subject 2 is an example of a perfect classifier, while the control condition of Subject 2 exemplifies a random classifier.
A final measure of interest is the number of bits successfully transferred to the participant using the TMS stimulation by the CBI. This measure is best captured by the mutual information between the series of TMS pulses and the participant’s responses. The mutual information values were calculated using the Infotheo package for R (Meyer, 2014), using the empirical probability distributions of zeros and ones to estimate the corresponding entropy (Cover and Thomas, 2005). The actual number of bits transferred can be calculated by first converting the mutual information into bits, and then multiplying it by the total number of pulses for each maze (in this case, 10), so that this measure can be compared between the two conditions (which have different numbers of mazes). In the experimental condition, the raw mean number of bits transferred per maze was 5.16, which was significantly greater than the mean of 0.01 bits transferred during the control condition [paired t(4) = 5.18, p = 0.006; Figure 7D]. The raw number of bits transferred in the experimental condition was also greater than chance, which in the mutual information framework, corresponds to zero bits [t(4) = 5.25, p = 0.006]. The average of 0.01 bits transferred during the control condition was not significantly different than chance [t(4) = 1.00, p = 0.38].
The five participants in our study varied considerably in terms of performance during experimental conditions, ranging from the 100% accuracy of Subject 2 to 70.7% accuracy of Subject 3. It is important to understand the origin of these differences, and how they might affect the use of TMS in a CBI. In principle, these differences could reflect two different phenomena, namely irreducible individual differences in sensitivity to visual neuromodulation or individual differences in the rapidity of learning. To clarify this issue, we analyzed the data from the experimental mazes. As Subject 2 made no mistakes during the experimental condition, this subject’s data were excluded from this analysis.
A well-known psychological phenomenon is that decision times relate to the similarity between the available alternatives to choose from; the more similar the alternatives, the longer the decision time. In this instance, decision time represents the time that it takes to determine whether to move forward or down in the maze from the time the TMS machine fired. Decision times were measured from the moment the alternatives (i.e., the screen buttons corresponding to moving forward or downward) were presented to the subject, which occurred exactly 2 s after the TMS pulse fired. The mean decision times were calculated separately for correct and incorrect trials. In the case of errors, participants took significantly longer to respond than in the case of correct trials [4,102 ± 582 vs. 3,362 ± 423 ms, respectively; paired t(3) = 5.97, p = 0.01; Figure 9].
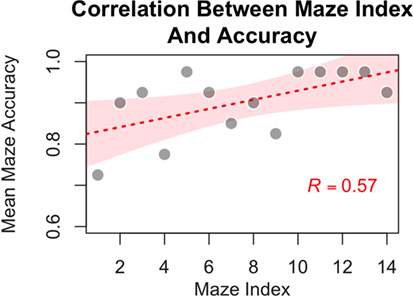
Figure 9. Participants showed improved accuracy for mazes in the experimental condition as a function of time (i.e., with increasing experience with the navigational task, as evidenced by a significant correlation between mean group performance on a maze and the maze position within the experiment). The individual dots represent average performances for the specific mazes, the red line represents best fitting linear relationship (intercept: 0.81; beta = 0.011), and the shaded contour represents the 95% confidence interval of the estimate.
If errors were due to the difficulty in categorizing an unusual, stimulation-induced visual percept, then it becomes interesting to examine whether participants were able to familiarize themselves with phosphenes and learn how to recognize them over the course of the experiment. If the participants are indeed learning in this manner, then the number of errors should decline over time. To test this hypothesis, the mean accuracy for each of the 14 experimental mazes across participants was calculated. As shown in Figure 9, a significant positive correlation was found between the probability of correctly classifying a phosphene and the position of a maze (maze index) within the experimental sequence [Pearson r = 0.57, t(12) = 2.42, p = 0.031]. This correlation strongly suggests that some form of learning took place as participants progressed through the experimental mazes. This finding is consistent with the hypothesis that, as participants gained more experience, they become better at interpreting the initially unusual inputs from the CBI.
While it is possible that subjects could learn to improve accuracy by some other means, the notion that subjects exploited patterns within the maze is not supported by our data. Because half of our 14 experimental mazes were mirror images of the other half, subjects could not have relied on any asymmetry in the distribution of forward and downward moves, as they were bound to be equal (each forward move in one maze was converted into a downward move in its mirror image). The symmetry of the mazes also implies that there was an equal number of changes in direction, from forward to downward and from downward to forward. However, because the mazes were generated by varying the number of turns from 0 to 6, an intrinsic asymmetry in the distribution of moves is that there are more continuations (downward–downward and forward–forward) than changes of direction (downward–forward and forward–downward). Because of the asymmetry in the distribution of turns, only 33.3% of all the moves (across all 14 experimental mazes) resulted in a change of direction. This percentage, however, is an imperfect representation of the true statistics experienced by participants. Because the software’s feedback (phosphene vs. no phosphene) depends on the actual position of the avatar on the screen, and because a mistake results in the participants’ avatar remaining stuck in the same position, the actual percentage of turns participants moved through represent 29.1% of the total moves. Thus, subjects could have learned the simple strategy of persevering in the same direction (instead of deciding at random) when the stimulation resulted in an ambiguous percept. If this were the case, however, we would expect not only a decline of errors with practice but also an asymmetry in the error distribution. Specifically, the probability of an error occurring on a turn should be higher in the later mazes than in the earlier ones. To test this prediction, we calculated the conditional probability that the move where an error occurred was a turn [i.e., P(Turn | Error); note that, because a move is either a turn or a continuation, P(Turn | Error) = 1 − P(Continuation | Error)] for each maze where at least one error occurred. We averaged this probability across participants. As seen in Figure 10, no significant correlation exists between maze index and the probability that an error occurred on a turn [Pearson r = 0.04, t(12) = 0.15, p = 0.88].
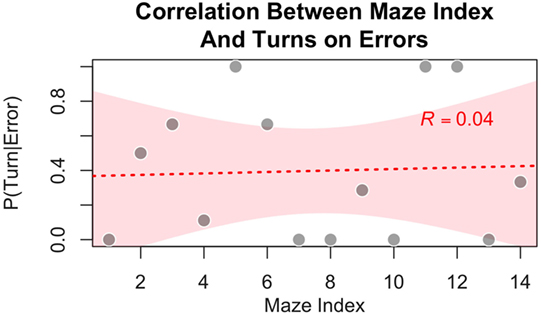
Figure 10. Participants showed no tendency to commit more errors on turns (as opposed to continuation in the same direction) in the experimental condition as a function of increasing experience with mazes, suggesting that subjects were not relying on a learned strategy of persevering in the same direction (instead of deciding at random) when the stimulation resulted in an ambiguous percept.
Discussion and Conclusion
Our results suggest that human subjects can learn to interpret the information delivered via non-invasive brain stimulation to solve a task in a virtual world. In our experiments, a total of 72 bits were transferred on average per subject in approximately 60 min; to our knowledge, this is both the largest CBI information transfer using TMS [superior to Rao et al. (2014) and Stocco et al. (2015)] as well as the largest CBI bit-rate to date. The type of information delivered to the brain was, however, quite restricted. Only a binary signal generated based on predefined criteria was transmitted to a single region of the brain. Nevertheless, as the technology advances, we anticipate that more sophisticated transmission of information may become possible, facilitating more fluid communication between the computer and the brain. At present, there are some critical limitations that need to be overcome with regard to the spatial resolution of TMS (Walsh and Cowey, 2000) and the need for a better understanding of how complex and conceptual information is processed in the brain.
There are also some practical limitations of our approach. TMS machines, at present, tend to be too large for portability. As this aspect of the technology improves, the paradigms presented here could be useful, for example, in developing a non-invasive sensory prosthesis for the blind. Patients with certain types of blindness have shown the ability to perceive phosphenes (Walsh and Cowey, 2000; Silvanto et al., 2007), suggesting that the technology presented here could eventually allow such subjects to better navigate their environment using phosphene-based feedback. This would require utilizing dynamic physical depth information instead of the static virtual depth information used in our study.
Four of the five subjects answered correctly for the experimental trials at a rate greater than 93%, with one subject correctly identifying all 140 stimulations. Accuracy for this task also improved over time. These results suggest that humans can learn to utilize information delivered non-invasively to their brains to solve tasks that cannot be solved using their natural senses. Exploring this emerging field of human sensory augmentation, with its technological as well as ethical and social implications, remains an active area of research.
Author Contributions
Designed the experiments: DL, AS, JA, and RR. Implemented the software: DL. Performed the experiments: DL, AS, and JA. Analyzed the data: AS and DL. Contributed materials: AS and RR. Contributed to the writing of the manuscript: DL, AS, and RR.
Conflict of Interest Statement
The authors declare that the research was conducted in the absence of any commercial or financial relationships that could be construed as a potential conflict of interest.
Acknowledgments
The authors would like to thank Dr. Chantel Prat for contributing materials and Matt Elzinga for useful discussions.
Funding
This work was supported by an award from the W. M. Keck Foundation to AS and RR and by a Washington Research Foundation Innovation Undergraduate Fellowship in Neuroengineering to DL. RR was also supported by NSF grant EEC-1028725.
References
Aghajan, Z. M., Acharya, L., Moore, J. J., Cushman, J. D., Vuong, C., and Mehta, M. R. (2015). Impaired spatial selectivity and intact phase precession in two-dimensional virtual reality. Nat. Neurosci. 18, 121–128. doi: 10.1038/nn.3884
Bell, C. J., Shenoy, P., Chalodhorn, R., and Rao, R. P. N. (2008). Control of a humanoid robot by a noninvasive brain-computer interface in humans. J. Neural Eng. 5, 214–220. doi:10.1088/1741-2560/5/2/012
Cover, T. M., and Thomas, J. A. (2005). Elements of Information Theory. Hoboken, NJ: John Wiley and Sons.
Cushman, J. D., Aharoni, D. B., Willers, B., Ravassard, P., Kees, A., Vuong, C., et al. (2013). Multisensory control of multimodal behavior: do the legs know what the tongue is doing? PLoS ONE 8:e80465. doi:10.1371/journal.pone.0080465
Devlin, J. T., and Watkins, K. E. (2007). Stimulating language: insights from TMS. Brain 130, 610–622. doi:10.1093/brain/awl331
Fawcett, T., and Tom, F. (2006). An introduction to ROC analysis. Pattern Recognit. Lett. 27, 861–874. doi:10.1016/j.patrec.2005.10.010
George, M. S., Nahas, Z., Molloy, M., Speer, A. M., Oliver, N. C., Li, X. B., et al. (2000). A controlled trial of daily left prefrontal cortex TMS for treating depression. Biol. Psychiatry 48, 962–970. doi:10.1016/S0006-3223(00)01048-9
Grau, C., Ginhoux, R., Riera, A., Nguyen, T. L., Chauvat, H., Berg, M., et al. (2014). Conscious brain-to-brain communication in humans using non-invasive technologies. PLoS ONE 9:e105225. doi:10.1371/journal.pone.0105225
Menkes, D. L., Bodnar, P., Ballesteros, R. A., and Swenson, M. R. (1999). Right frontal lobe slow frequency repetitive transcranial magnetic stimulation (SF r-TMS) is an effective treatment for depression: a case-control pilot study of safety and efficacy. J. Neurol. Neurosurg. Psychiatry 67, 113–115. doi:10.1136/jnnp.67.1.113
Meyer, P. E. (2014). Infotheo: Information-Theoretic Measures. R Package Version. Available at: http://CRAN.R-project.org/package=infotheo
Pascual-Leone, A., Bartres-Faz, D., and Keenan, J. P. (1999). Transcranial magnetic stimulation: studying the brain-behaviour relationship by induction of “virtual lesions”. Philos. Trans. R. Soc. Lond. B Biol. Sci. 354, 1229–1238. doi:10.1098/rstb.1999.0476
Rao, R. P. N. (2013). Brain-Computer Interfacing: An Introduction. New York, NY: Cambridge University Press.
Rao, R. P. N., Stocco, A., Bryan, M., Sarma, D., Youngquist, T. M., Wu, J., et al. (2014). A direct brain-to-brain interface in humans. PLoS ONE 9:e111332. doi:10.1371/journal.pone.0111332
Silvanto, J., Cowey, A., Lavie, N., and Walsh, V. (2007). Making the blindsighted see. Neuropsychologia 45, 3346–3350. doi:10.1016/j.neuropsychologia.2007.06.008
Sing, T., Sander, O., Beerenwinkel, N., and Lengauer, T. (2005). ROCR: visualizing classifier performance in R. Bioinformatics 21, 3940–3941. doi:10.1093/bioinformatics/bti623
Stocco, A., Prat, C. S., Losey, D. M., Cronin, J. A., Wu, J., Abernethy, J. A., et al. (2015). Playing 20 questions with the mind: collaborative problem solving by humans using a brain-to-brain interface. PLoS ONE 10:e0137303. doi:10.1371/journal.pone.0137303
Terhune, D. B., Murray, E., Near, J., Stagg, C. J., Cowey, A., and Cohen Kadosh, R. (2015). Phosphene perception relates to visual cortex glutamate levels and covaries with atypical visuospatial awareness. Cereb. Cortex 25, 4341–4350. doi:10.1093/cercor/bhv015
Thomson, E. E., Carra, R., and Nicolelis, M. A. L. (2013). Perceiving invisible light through a somatosensory cortical prosthesis. Nat. Commun. 4, 1482. doi:10.1038/ncomms2497
Walsh, V., and Cowey, A. (2000). Transcranial magnetic stimulation and cognitive neuroscience. Nat. Rev. Neurosci. 1, 73–79. doi:10.1038/35036239
Wolpaw, J. R., McFarland, D. J., Neat, G. W., and Forneris, C. A. (1991). An EEG-based brain-computer interface for cursor control. Electroencephalogr. Clin. Neurophysiol. 78, 252–259. doi:10.1016/0013-4694(91)90040-B
Keywords: transcranial magnetic stimulation, brain–computer interface, virtual reality, phosphene, visual system, navigation, neural stimulation, sensory augmentation
Citation: Losey DM, Stocco A, Abernethy JA and Rao RPN (2016) Navigating a 2D Virtual World Using Direct Brain Stimulation. Front. Robot. AI 3:72. doi: 10.3389/frobt.2016.00072
Received: 04 July 2016; Accepted: 01 November 2016;
Published: 16 November 2016
Edited by:
Doron Friedman, Interdisciplinary Center Herzliya, IsraelReviewed by:
Luciana Nedel, Universidade Federal do Rio Grande do Sul, BrazilJuan Carlos Torres, University of Granada, Spain
Copyright: © 2016 Losey, Stocco, Abernethy and Rao. This is an open-access article distributed under the terms of the Creative Commons Attribution License (CC BY). The use, distribution or reproduction in other forums is permitted, provided the original author(s) or licensor are credited and that the original publication in this journal is cited, in accordance with accepted academic practice. No use, distribution or reproduction is permitted which does not comply with these terms.
*Correspondence: Rajesh P. N. Rao, rao@cs.washington.edu