Identifying the operational status of container terminals from high-resolution nighttime-light satellite image for global supply chain network optimization
 Hiroki Murata
 Ryuichi Shibasaki
 Naoto Imura1
 - 1Research Center for Advanced Science and Technology, The University of Tokyo, Tokyo, Japan
- 2Resilience Engineering Research Center, School of Engineering, The University of Tokyo, Tokyo, Japan
Container terminals are cargo gateways in the global maritime supply chain network. Major container terminals generally operate throughout the year, but do not operate at night, when container vessels are not calling at ports, or when there is no need to handle containers. Terminal congestion can delay containers’ shipping schedules, which impacts the supply chain network. To optimize global logistics, it is therefore important to understand fully the daily operational status of container terminals. A vessels’ automatic identification system data are not sufficient to determine whether containers are being handled in container terminals at night. Remote sensing, especially nighttime-light (NTL) imagery, might solve this problem. Recently, high-resolution images for the CE-SAT-IIB satellite with a pixel resolution of 5.1 m became available to observe NTL. This study assessed the operational status of container terminals based on satellite image taken at night. Eight terminals in the Port of Tokyo, Japan, were selected for the study. A Sentinel-2A image recorded during the day on 7 April 2021, and a CE-SAT-IIB image recorded during the night on 6 April 2021, were obtained. The digital numbers (DNs) of each red-, green-, and blue-(RGB) band image were analyzed, revealing that the red, green, and blue bands, in that order, had higher DNs in the Sentinel-2A daytime image and the CE-SAT-IIB NTL image at all terminals. One of the eight terminals had a low DN in the CE-SAT-IIB RGB image because its lights were off at the time the image was taken. The operational status of the terminals could be verified from the CE-SAT-IIB image by setting the DN threshold to the green or red bands. We also found that the CE-SAT-IIB image could distinguish white-light-emitting diode (LED) lamps from high-pressure sodium lamps based on color differences in the DNs of the RGB bands. If high-resolution NTL sensors were placed onboard microsatellites, a high-frequency observation constellation network could be constructed using a combination of NTL data and daytime images. This study showed the benefits and usefulness of NTL images of ports; the results will contribute to the overall optimization of the global maritime supply chain network.
1 Introduction
Containers have reduced costs in logistics and led to advances in the global maritime supply chain (Levinson, 2016). Containerized cargo is transported through container terminals around the world, with the terminals acting as cargo gateways through direct/transhipment maritime services. Since the COVID-19 outbreak, several major ports such as Los Angeles (United States), New York (United States), and Felixstowe (United Kingdom) have become congested (Huang et al., 2022), and global container transportation has been disrupted. Notteboom (2006) reported that terminal congestion was causing delays to container shipping schedules, with terminal congestion at ports rippling through the global supply chain network. In such cases, it would make sense to divert containers to other nearby terminals or ports if cargo owners could be informed in advance of the congestion status of each terminal. Understanding the operational status of container terminals would be beneficial to all parties involved in terms of optimizing the global supply chain. Major container terminals are generally in operation year-round, with container vessels calling at the ports throughout the day and trailers collecting the containers during daytime. Container terminals are not in operation when there are no container vessels calling at the port or when there is no need for marshalling works at night. Port capacity is limited by quay depths and lengths, the size of gantry cranes, shipping alliances, and other factors. However, if it is possible to identify container terminals that do not operate at nighttime, and their operational trends, there is the potential to optimize the global supply chain network by identifying congested ports and encouraging the use of suitable nearby ports. One way to verify this information is to survey every container terminal operator in the world periodically, but this is not practical because many terminal operators are in operation worldwide and their operating situations change daily. A vessels’ automatic identification system (AIS) data, which provide positioning data (latitude and longitude) in real time, are not sufficient to confirm whether container terminals are operating.
The most commonly applied methods in port and terminal logistics research are analytical methods (such as mathematical programming and game theory), heuristic or meta-heuristic methods, simulation methods, and multi-agent approaches (Chen et al., 2013; Song, 2021). While these approaches are theoretically feasible, container terminals do not operate ideally due to various factors. Without accurate knowledge of the current situation, proper analysis and planning are not possible, even though sophisticated traffic simulation and modeling methods have been developed (Shibasaki et al., 2020; Kanamoto et al., 2021; Kawasaki et al., 2022). There is also a growing need to manage ports not only from a logistics perspective but also from an environmental perspective, to achieve the goals of the Paris Agreement (United Nations, 2015; Davarzani et al., 2016; Jeong et al., 2022). Therefore, to support decision-making, it is essential to develop methods to collect, monitor, and share information regarding container terminals’ daily status among stakeholders.
Remote sensing could be a useful tool in port management. Satellite remote sensing is effective for daily monitoring because information can be obtained periodically. Planet Labs (San Francisco, CA, United States) forms a constellation that can observe the same point daily with 3.0 or 3.7 m high-resolution imagery. Several studies have been conducted using Planet Labs’ images of ports in recent years. Štepec et al. (2019) used Planet Labs’ imagery and AIS data to detect ships without the need for human-labeled data in the Ports of Oakland and Long Beach (United States). Ping et al. (2021) used Planet Labs’ daily imagery to detect vessels and predict the port-operating conditions in the Port of Shanghai (China). There are few satellites that can observe nighttime-light (NTL), and no satellite constellation can currently perform this function. The satellites observing NTL in panchromatic wavelengths are as follows: the Operation Linescan System on the Defence Meteorological Satellite Program (DMSP/OLS), which has 3000-m spatial resolution (launched in 1992); the Visible Infrared Imaging Radiometer Suite (VIIRS) onboard the Suomi National Polar-Orbiting Partnership (Suomi NPP), which has 740-m spatial resolution (launched in October 2011); and Luojia 1-01 (Wuhan University, China), which has 130-m spatial resolution (launched in January 2017) (Wang et al., 2020). The following satellites observe NTL in multispectral wavelengths: JL1-3B (Chang Guang Satellite Technology Co., Ltd., Changchun, China), which has 0.92-m high-resolution imagery (launched on 9 January 2017 and started commercial operation on 1 April 2017) (Zheng et al., 2018); and CE-SAT-IIB (Canon Electronics Inc., Saitama, Japan), which has 5.1-m high-resolution (launched on 29 October 2020) (Canon Electronics Inc., 2020). Sales of CE-SAT-IIB images by the Remote Sensing Technology Center of Japan began on 5 July 2022 (Remote Sensing Technology Center of Japan, 2022). Currently, there are only a few NTL observation satellites, but when the benefits and usefulness become clear, microsatellites could be launched to construct an NTL constellation network.
In previous studies applied NTL image in port, Polinov et al. (2022) used Suomi NPP data to study the NTL emitted by ships in ports’ anchorage areas and reported that NTL data has high correspondence with various shipping indicators such as container port throughput, and maximum cargo carried by ships. Liu et al. (2019) used DMSP/OLS data and confirmed the correlation between NTL image data and the cargo handling capacity of ports in China. Jiang et al. (2018) used Luojia 1-01 imagery to investigate artificial light pollution including ports. These studies used low-resolution NTL imagery. However, no study has used NTL images to determine the operational status of container terminals. Additionally, this study is the first applied research used CE-SAT-IIB images until today. In this study, we investigated whether the operational status of container terminals at night can be elucidated using CE-SAT-IIB imagery based on lights. We also applied Sentinel-2A imagery, which is widely used in remote sensing and has many images available, to compare differences between daytime and NTL images.
2 Study site and methods
2.1 Study site
The study site was the Port of Tokyo, Japan (Figure 1A). This port handles the highest number of containers in Japan’s port industry, with 4.86 million twenty-foot-equivalent units (TEUs) recorded in 2021 (Bureau of Port and Harbor, Tokyo Metropolitan Government), although it has a congestion problem with semi-trailers draying containers in the port area. A survey during 2–23 December 2022 found that the average waiting time for trailers ranged from 30 min to 2 h 47 min, depending on the container terminal and the type of work, i.e., export/import and loading/unloading containers (Tokyo Trucking Association, 2023). Attempts have been made to disperse trailers, which tend to be concentrated at certain times of the day, by requiring reservations in advance to reduce waiting times at the container terminal gate and ensure efficient handling in the terminal based on prior information (Tokyo Metropolitan Government, 2023).
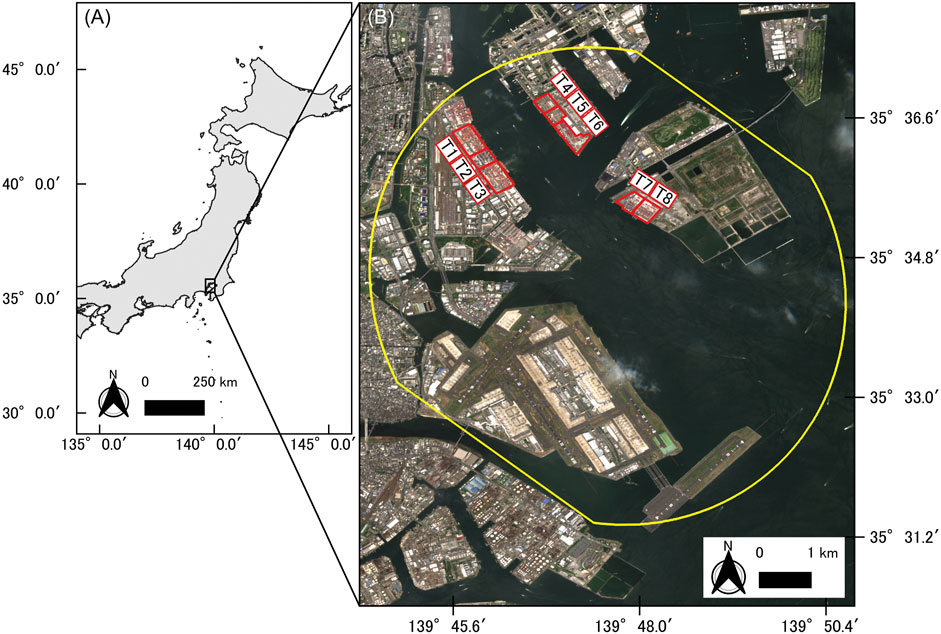
FIGURE 1. Map of the study site in the Port of Tokyo, Japan (A). Red polygons show the container terminals T1–T8 selected for analysis in this study, and yellow polygon show the area of CE-SAT-IIB image (B). The background image is an RGB image from Sentinel-2A on 7 April 2021.
2.2 Materials and methods
2.2.1 Satellite images
A Sentinel-2A image taken during the daytime at 10:26 (Japan Standard Time: JST) on 7 April 2021, and a CE-SAT-IIB image taken during the night at 21:03 (JST) on 6 April 2021 were used to compare differences between daytime and NTL images. The pixel resolution was 10 m in the Sentinel-2A RGB bands, and 5.1 m in the CE-SAT-IIB RGB bands. The CE-SAT-IIB is a 35-kg microsatellite that is capable of capturing NTL color images of the moonlit Earth surface and city lights using a 20-cm Cassegrain telescope with an ultra-high sensitivity camera. Exposure is controllable through shutter speed, complementary metal-oxide-semiconductor (CMOS) gain, and neutral-density (ND) filters. By maximizing the gain and detaching all the ND filters, the ISO sensitivity is equivalent to approximately 4 million. Focus can be adjusted by a stepper motor on the detector, and the observable area is approximately 3.5 × 2.3 km on the ground. This ultra-high-sensitivity camera can observe wavelengths between 400 and 700 nm with a red, green, and blue (RGB) Bayer pattern (Matsuzawa et al., 2021). The altitude of CE-SAT-IIB was approximately 517 km and the off-nadir angle was 32.9° obtained in this study. The CE-SAT-IIB data were composed of RGB bands and georeferenced to WGS 84/UTM zone 54N by Canon Electronics Inc. before the image was provided. The area of the image is shown in Figure 1B. In usually, the edge part of CE-SAT-IIB images are trimmed before provided because data quality cannot be guaranteed. In this study, we ordered to include these part to analyze more container terminals and the image was provided specially.
2.2.2 Analysis methods
A flowchart of the data procedure is shown in Figure 2. We first created eight polygons (T1–T8) of container terminals (the red polygons shown in Figure 1B) based on a Google Earth Pro (Google, United States) image taken on 9 March 2022, by visual interpretation referencing the website of the Tokyo Port Terminal Co., Ltd. Then, we offset the polygons by 10 and 5.1 m in the Sentinel-2A and CE-SAT-IIB images, respectively, to avoid pixel overlap between adjacent container terminals in the analysis. We then created points of all pixels by terminal and transcribed the digital numbers (DNs) of the RGB bands into a point shapefile. The DNs were 14-bit for the CE-SAT-IIB image (Remote Sensing Technology Center of Japan) and a data range of 0–4,000 for the Sentinel-2A image (Sinergise). In the third step, we made a boxplot of the RGB bands by terminal to find the optimal band and threshold to discriminate between operating and non-operating container terminals. Finally, we classified the point shapefile by setting a threshold. We used the software QGIS version 3.28.2 (QGIS Development Team) and R version 4.22 (R Development Core Team, 2019) with the ggplot2 package (Wickham, 2016) for analysis.
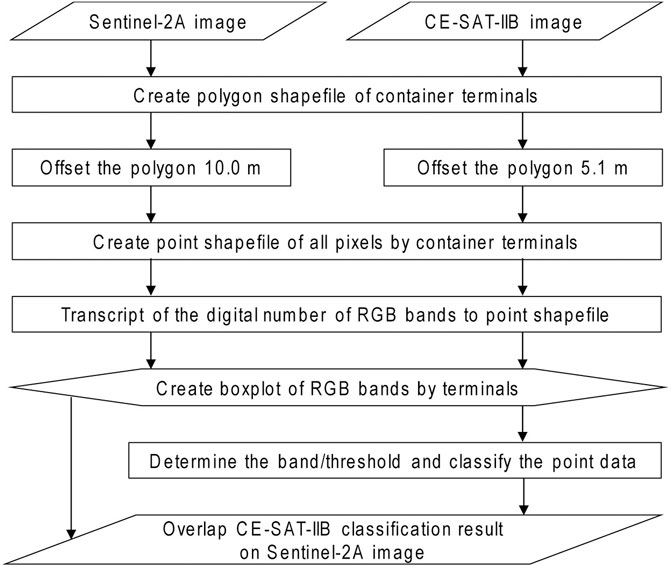
FIGURE 2. Flowchart of the data-analysis procedure for the Sentinel-2A and CE-SAT-IIB image.
2.2.3 Ground truth data
According to the AIS data derived from Seasearcher (Lloyd’s List Intelligence, United Kingdom), container vessels were calling at terminals T3, T6, and T8 when the CE-SAT-IIB image was recorded. Moreover, in T1, a container vessel left at 19:31 (JST) on 6 April 2021, 1 h and 32 min before the CE-SAT-IIB image was taken, and the next container vessel entered the terminal at 07:26 (JST) on 7 April 2021. In T2, AIS data from 20 min prior to the CE-SAT-IIB image observation indicated that the container vessel was sailing toward the terminal, but it was not confirmed whether the vessel was at the terminal when the CE-SAT-IIB image was taken. The next AIS data was recorded at 22:14 (JST) on 6 April 2021, approximately 1 h after the CE-SAT-IIB image observation and the container vessel was called at the terminal at that time. In T4, there was no container vessel when CE-SAT-IIB image observation. The next container vessel arrive until 22:33 (JST) on 6 April 2021, 1 h and 30 min later than the CE-SAT-IIB image observation. In T5, there was no container vessel when CE-SAT-IIB image observation. This terminal was used as a temporary container yard between April and September 2021 in preparation for the Tokyo 2020 Olympic Games and, due to less traffic congestion, it was not used as a container terminal at that time (Bureau of Port and Harbor, Tokyo Metropolitan Government). In T7, the next container vessel did not dock until 16:35 (JST) on 7 April 2021, the following day. We asked the operational status of container terminal to the terminal operator and confirmed that the lights were off in T1 when the CE-SAT-IIB image was observed. For these reasons, we determined that the lights were on in terminals T3, T6, and T8, but were off in T1 as ground truth data.
3 Results
3.1 The DN results of the RGB bands in the container terminals
A DN boxplot of the Sentinel-2A image is shown in Figure 3A. The median DN ranges for T1–T8 were 1,026–1,282, 1,152–1,372, and 1,318–1,694 in the blue, green, and red bands, respectively. At all container terminals, the DN ranges of the RGB bands overlapped and the median DNs were higher in the red, green, and blue bands, in that order.
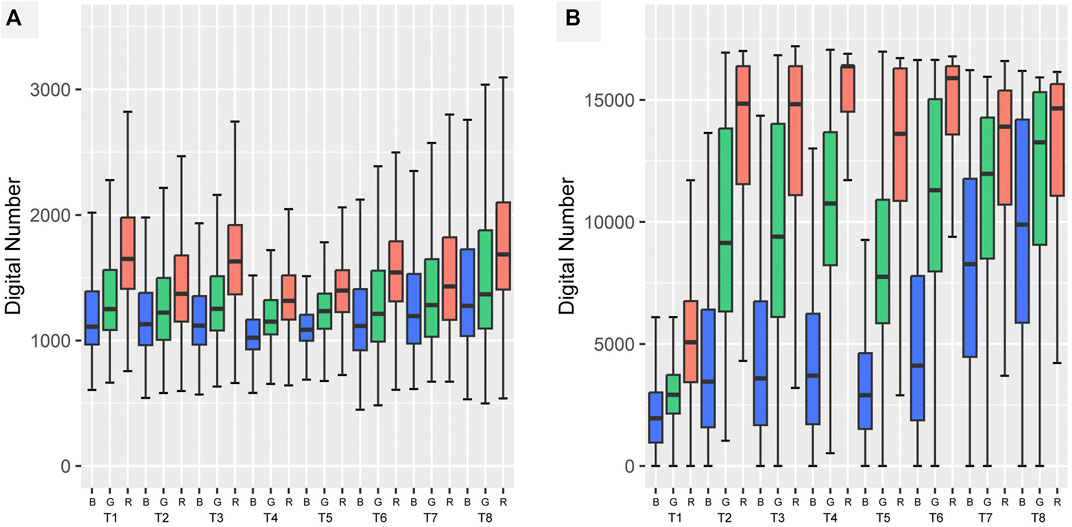
FIGURE 3. Boxplots showing the DN results for the RGB bands of container terminals T1–T8 (same as shown in Figure 1) in the Port of Tokyo. Analysis of a Sentinel-2A daytime image from 7 April 2021 (A), and analysis of a CE-SAT-IIB nighttime image from 6 April 2021 (B).
A DN boxplot of the CE-SAT-IIB image is shown in Figure 3B. At all container terminals, the median DNs were higher in the red, green, and blue bands, in that order. The median DNs of T1 were 1,954, 2,917, and 5,073 in the blue, green, and red bands, respectively. The median DN ranges of T3, T6, and T8 were 3,588–9,891, 9,397–13,261, and 14,651–15,891 in the blue, green, and red bands, respectively. The median DN ranges of the other four terminals were 2,904–8,269, 7,751–11,970, and 13,609–16,376 in the blue, green, and red bands, respectively. Comparing the first-quartile (Q1) and third-quartile (Q3) ranges in the boxplot (Figure 3B), the blue bands had overlaps between the container terminals. In contrast, the green and red bands did not overlap in T1 or T2–T8. Therefore, setting a threshold to green and red bands could determine whether the container terminal lights were on or off. The results of green- and red-band for each of the 5 percentiles between 10th and 90th percentile for T1, T3, T6, and T8 which were determined as ground truth data are shown in Table 1.
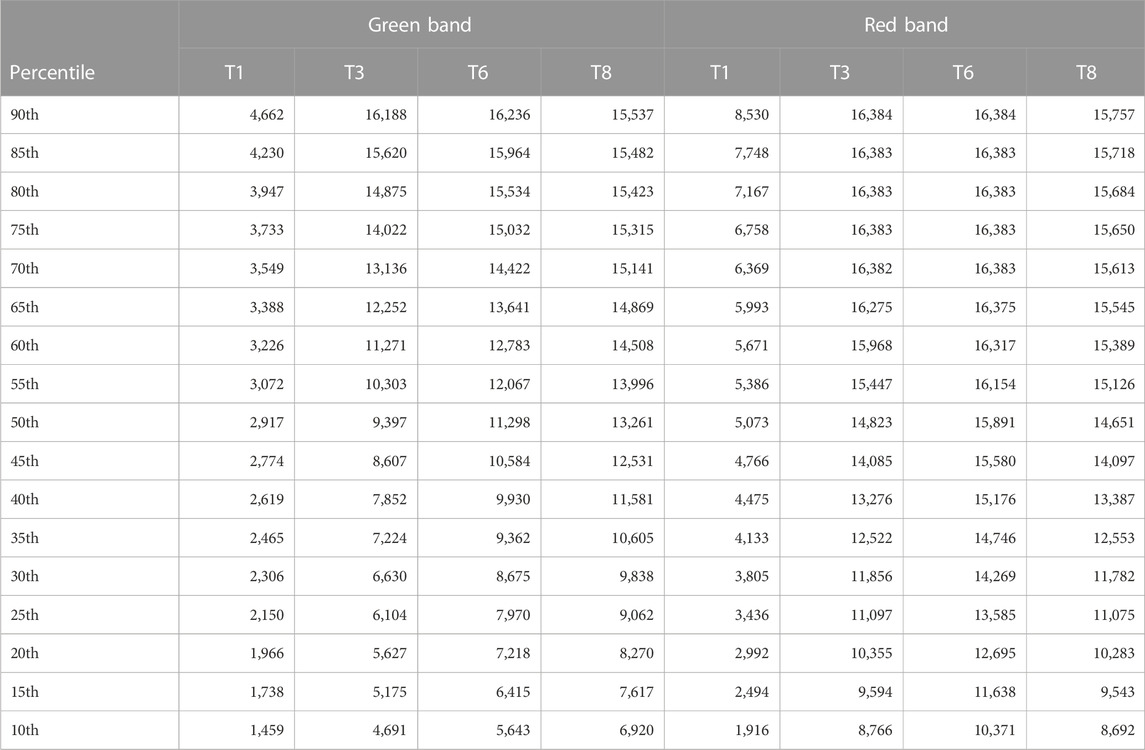
TABLE 1. The 10–90th percentile DN results of green- and red-band in T1, T3, T6, and T8.
3.2 Classification of the CE-SAT-IIB image based on threshold values
Based on the results provided in the previous section, we set the green band threshold to 3,947 and the red band threshold to 7,167. These thresholds were set since there were 80th percentile values of T1. These threshold values were also lower than the 10th percentile values of T3, T6, and T8. In other words, the 80th percentile value of the green- or red-band of non-operating container terminal can be set as a threshold value, and when 90% or more of the pixels is above this threshold value, the container terminal can be identified as operating. Applying this definition to T2, T4, T5, and T7, all container terminals were identified as operating. Results of setting the 80th percentile value of T1 as threshold to the green- and red-band (Figure 4), most part of the terminals classified as yellow (above the threshold) while some parts classified as black (below the threshold) in T2–T8.
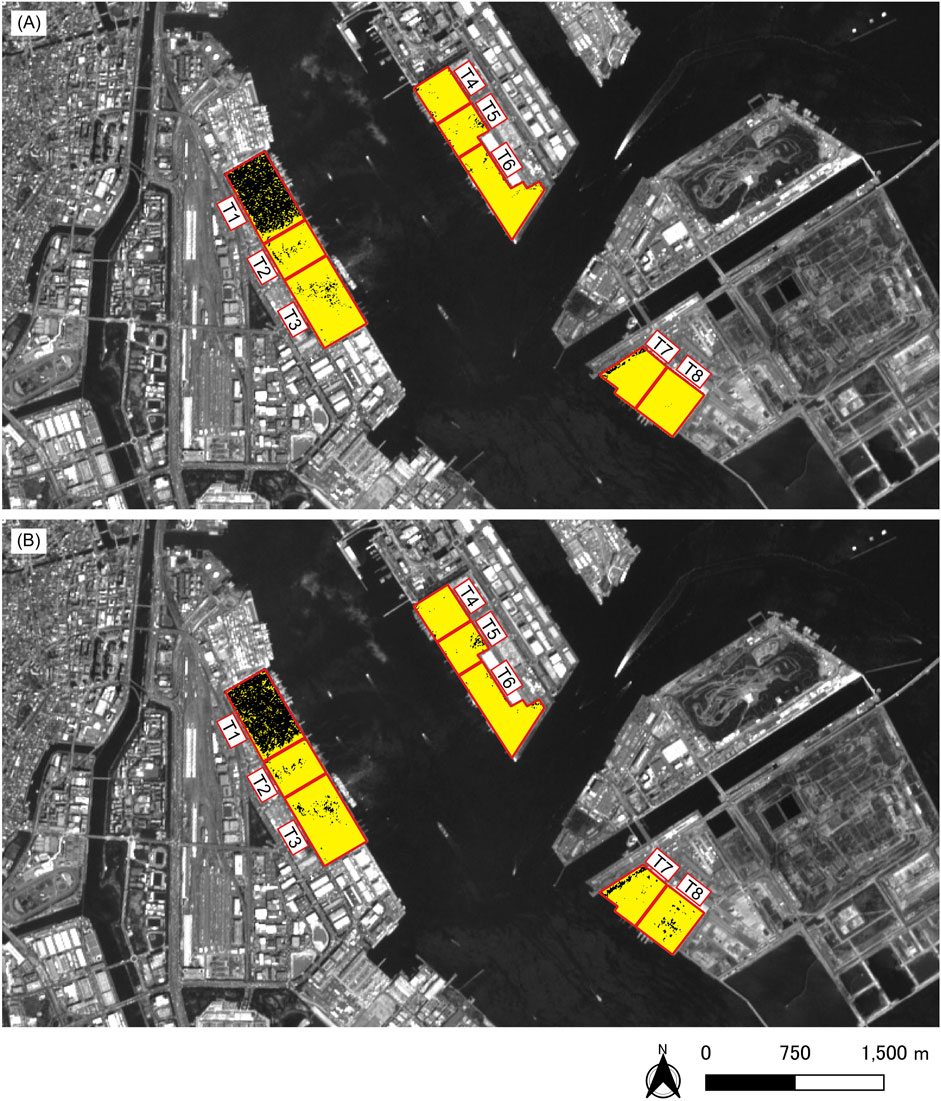
FIGURE 4. Images showing the classification results of CE-SAT-IIB DNs above the threshold in yellow and below the threshold in black at container terminals T1–T8. The threshold values were 3,947 for the green band (A), and 7,167 for the red band (B). The background image was a monochrome image from Sentinel-2A on 7 April 2021.
4 Discussion
4.1 Differences in DNs between RGB bands at container terminals in daytime images
During the daytime, container terminals operate regardless of whether container vessels are in port. Therefore, there is little need to examine the operational status based on daytime satellite images, but we analyzed the Sentinel-2A satellite image to compare it with the nighttime image. The trends in the DN results of the RGB bands did not differ significantly, but there were some differences. This is thought to be caused by the different color of the ground surface, including the containers. Based on the Google Earth Pro image taken on 19 April 2021, container colors of the blue, green, red, and white were found (Figure 5A). Daytime satellite imagery may be useable for monitoring daily changes in container terminals, but it seems difficult to determine the operational status of container terminals based on the DN of RGB bands.
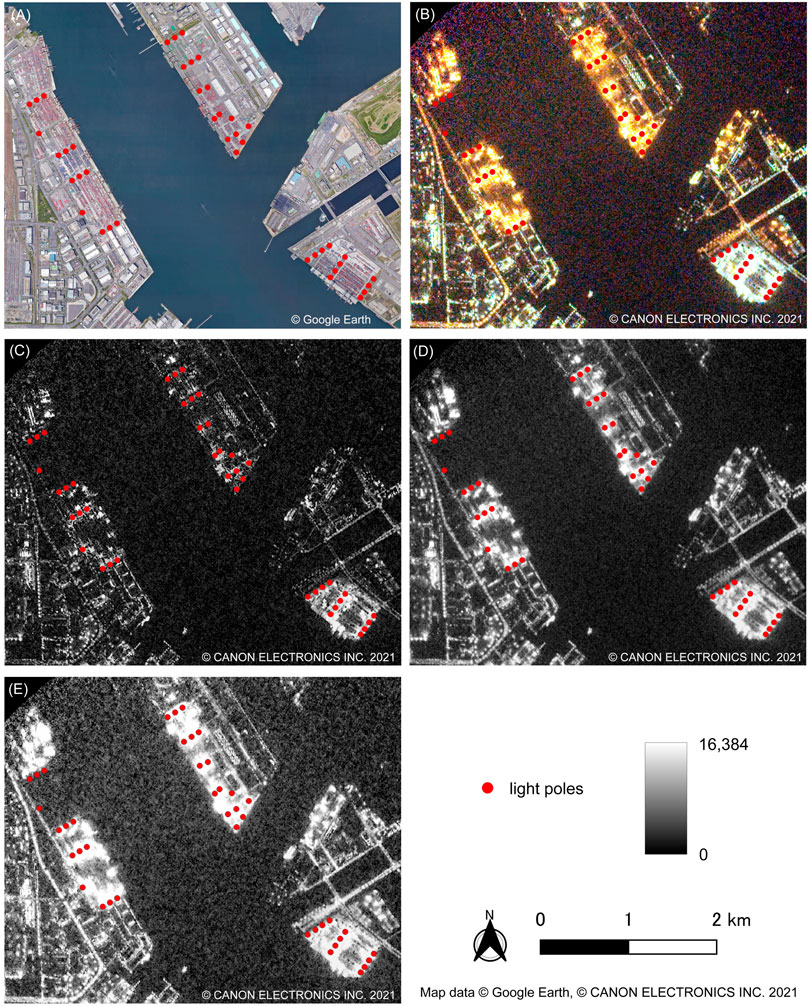
FIGURE 5. Images of the Port of Tokyo container terminals. Google Earth image on 19 April 2021 (A), CE-SAT-IIB composited RGB image (B), images of blue band (C), green band (D), and red band (E). Red points are the locations of light poles.
4.2 The optimal threshold to identify the operational status of container terminals
We set the 80th percentile DN value to green- and red-band in this study. The threshold does not have to be limited to the 80th percentile value but can be set with some range. This depends on the definition of the percentage of container terminals to determine in operating or non-operating. It is considered that the threshold value should be as high as possible, but the median, 75th percentile, or other values are also possible. On the other hand, a method to set the threshold based on the container terminals in operation should be also considered. In this case, the lowest 10th percentile values among T3, T6, and T8 were 4,691 and 8,692 for green and red bands, respectively. This values were above the 90th percentile value of T1. This means more than 90% of the area can be classified as black, and the container terminal can identify as non-operating.
The CE-SAT-IIB image is 14-bit data, that record DNs from 0 to 16,384. Assuming NTL sensors with different quantization bits will be developed in the future, we propose to set the threshold value to one-quarter (DN is 4,096 in this study) for the green band and one-half (DN is 8,192 in this study) for the red band as an indicator. With these thresholds, more than the 80% of the green band and more than the 85% of the red-band pixels would be below these threshold values in T1 which terminal was non-operating in this study.
4.3 Consideration of the operational status of container terminals with AIS data
In T1, a container vessel left 1 h and 32 min before the CE-SAT-IIB image was taken and the next container vessel entered the terminal at next day morning. It was probably not in operation because the marshalling work related to the previous container vessel did not proceed at night and there was sufficient time to complete the work before the arrival of the next container vessel.
Container vessels were calling at T3, T6, and T8 that confirmed by the AIS data, and container terminals were classified as operating as shown in Figure 4. The AIS data could not identify whether or not a container vessel was calling at T2. Further research of NTL satellite images is needed to determine whether the container vessel called at the port. When containers are being handling between container vessel and container terminal, the lights of gantry crane and container vessel might be detected. It would be possible to ascertain this by investigating DNs of RGB bands of the container vessels and gantry cranes. In T4, the container vessel arrived 1 h and 30 min later than the CE-SAT-IIB image observation. Therefore, it is assumed that the lights were on in T4 in preparation for the next container vessel. In T7, the lights were on, indicating that some work was being conducted at the container terminal at nighttime. However, the next container vessel did not dock until next day evening. This implies that the terminals are sometimes in operation at nighttime, even when no container vessel calls, or the lights could be incidental to the adjacent T8 operational work.
4.4 The NTL intensity inside the container terminals and its sources
Some parts of the container terminals were classified as black in Figure 4, meaning that the DN values in the green and red bands were under the thresholds. To understand the sources of NTL, the locations of the light poles in T1–T8 were mapped based on Google Earth Pro images and with reference to the website of the Tokyo Port Terminal Co., Ltd. (Figure 5). Even in the absence of light poles, light sources were detected. The NTL near the quay was presumably due to the lighting of gantry cranes and/or container vessels, and the NTL inside the container terminal was presumably due to the lighting on transfer cranes or container trailers. There were total 42 light poles, located mainly at the periphery of the container terminals, and the area near the center of the container terminal was considered to have a lower light intensity than areas near the light poles. The lights in T1 were off, and therefore little NTL was detected. Comparing the RGB bands in Figure 5, the red band reached farthest, followed by the green band, while the blue band illuminated the periphery of the actual light source (Figures 5C–E). It is therefore possible to use green- and red-band images to determine the operational status of a container terminal, and the blue-band image can be used for conducting research on container-handling equipment based on NTL imagery.
Jiang et al. (2018) used Luojia 1-01 NTL imagery of ports, with a resolution of 130 m, and found that artificial lights tended to be brighter near the quay than behind the container yard. According to our analysis of the image used in that study, this trend was evident in the Port of Ningbo-Zhoushan (China) and the Yangshan Deep-Water Port (China), whereas it was not evident in the Port of Busan (Korea). In the present study, there was no tendency for the NTL near the quay to be brighter than in the container yard. The spatial distribution of NTL may vary from terminal to terminal, depending on the presence or absence of container vessels at a specific time. Additionally, at 130-m spatial resolution, it might be difficult to determine container terminal operation. Hence, high-resolution NTL imagery such as the 5.1-m pixel resolution of CE-SAT-IIB is advantageous for the identification of container terminal operations.
4.5 Differences in DNs between the RGB bands at container terminals in an NTL image
The ranges between Q1 and Q3 of the red band in T4 and T6 as shown in Figure 3B were differ from the other terminals. One possible reason for this could be the use of lighting lamps with strong red wavelengths. It may possible effecting that T6 has more light poles inside the terminal than other container terminals.
As shown in Figure 3B, the DNs of T7 and T8 in the NTL image had significantly higher median values for the blue band compared to the other container terminals. The median DNs in the blue-band range were between 2,904 and 4,111 for T2–T6, and 8,269 and 9,891 for T7–T8. To reveal the reason for this, we conducted a ship-based field survey and took photographs with a camera (EOS Kiss X3, Canon) on 18 March 2023. We found differences in the illumination colors: T1–T6 were yellowish-white and T7–T8 were white (some parts are shown in Figure 6). This may have been due to the use of light-emitting diodes (LEDs) in T7–T8. Cheng et al. (2020) used a JL1-3B NTL image and reported the classification of the types of streetlights as high-pressure sodium lamps or LED lamps based on multispectral characteristics. The spatial resolution of JL1-3B was higher than that of CE-SAT-IIB and it was able to extract streetlights one by one. The CE-SAT-IIB image could not extract lights one by one at this study site. However, it was possible to detect a variety of light sources in container terminals such as lighting from container trailers, transfer cranes, gantry cranes, and container vessels.
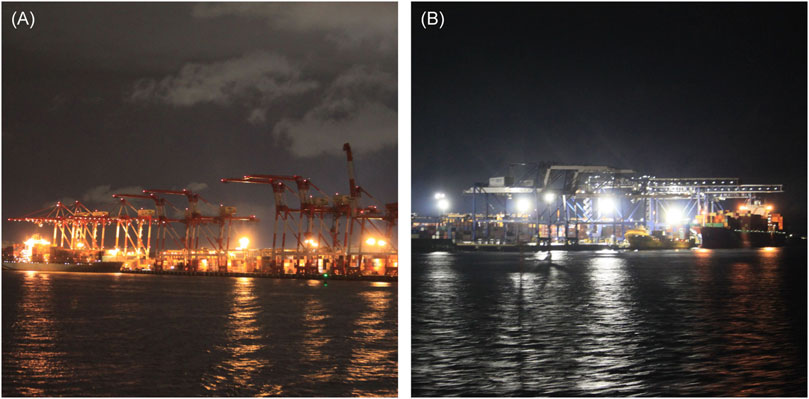
FIGURE 6. Nighttime photographs of the Port of Tokyo container terminals at T1 (A), and T7–T8 (B) taken on 18 March 2023.
According to our interviews with officials of the Tokyo Port Terminal Co., Ltd., in recent years, high-intensity LED lamps have become available and, because they are more economical than high-pressure sodium lamps, light poles fitted with white LEDs as the light source have been erected in T7 (2017) and T8 (2020). Currently, T1–T3 and T6 use high-pressure sodium lamps, while T4–T5 use high-pressure sodium lamps with some natural white LED lamps. The DN range of the blue band in T4–T5 was not as different as in the T2–T3 range, and the median DN was clearly lower than T7–T8’s white-LED lights. It was not possible to distinguish the types of lamps, such as high-pressure sodium or LED lamps, from the CE-SAT-IIB image, but it was possible to distinguish differences in the color of illumination. If the installed lamps were limited to white-LED or high-pressure sodium lamps, it might be possible to identify them based on the significantly higher median DN of the blue band. This suggests that the NTL in multispectral wavelengths provide more information than in the NTL in panchromatic wavelengths.
5 Conclusion
This study proved that is possible to determine the operational status of container terminals at night by setting DN threshold values for the green and red bands of a nighttime CE-SAT-IIB image. This was a useful feature of the NTL image, while there was no obvious difference in the DN ranges of the RGB bands in the daytime Sentinel-2A image. Identification of container terminals not in operation at night based on satellite imagery will provide useful information that enables container vessels to schedule to call at port which has available operational capacity. The AIS data are not sufficient to confirm the operational status of container terminals. Although only one image was analyzed in this study, more studies are likely in the future (e.g., a time-series analysis and studies in other ports). Furthermore, combinations with other data, such as the actual terminal status based on terminal-operator information and AIS data, will enable trends in the operational status of container terminals around the world at night to be determined.
When a microsatellite constellation of NTL images is established in the future, it will become possible to regularly observe the operational status of ports around the world. These observations could be used to support decision making in the maritime supply chain network by selecting terminals that are relatively free from congestion. It might also be useful to study the operation of container-handling equipment such as gantry cranes and transfer cranes in container terminals at night using blue-band images and, simultaneously, to study differences in the illumination colors of lamps over a wide area. It would be desirable to devise a formula for converting data from DNs to radiance, as is possible in daytime optical remote-sensing images. This would allow comparisons between several different sensors and could lead to the calculation of a uniform threshold value to classify the operational status of container terminals. We expect this study will ultimately lead to the construction of an NTL satellite constellation and contribute to optimization of the global supply chain network.
Data availability statement
The data analyzed in this study is subject to the following licenses/restrictions: The Sentinel-2A satellite imagery is available from the Copernicus Open Access Hub. The CE-SAT-IIB satellite imagery is commercial data and must be purchased from a distributor. Requests to access these datasets should be directed to Copernicus Open Access Hub, https://scihub.copernicus.eu/; Remote Sensing Technology Center of Japan, https://www.restec.or.jp/en/index.html.
Author contributions
HM led the overall design of the work, data analysis, writing of the paper, prepared figures. RS, NI, and KN authored or reviewed drafts of the paper, and approved the final draft. All authors contributed to the article and approved the submitted version.
Funding
This study was financially supported by a Research Grant from the Remote Sensing Technology Center of Japan in 2022.
Acknowledgments
We thank the UTOC Corporation for providing information on container terminal operation, and we also thank Tokyo Port Terminal Co., Ltd. for providing details of the container terminals.
Conflict of interest
The authors declare that the research was conducted in the absence of any commercial or financial relationships that could be construed as a potential conflict of interest.
Publisher’s note
All claims expressed in this article are solely those of the authors and do not necessarily represent those of their affiliated organizations, or those of the publisher, the editors and the reviewers. Any product that may be evaluated in this article, or claim that may be made by its manufacturer, is not guaranteed or endorsed by the publisher.
References
Bureau of Port and Harbor, (2021). Establishment of temporary cargo yard. https://www.kouwan.metro.tokyo.lg.jp/business/tokyo2020torikumi/temporarycargo.html.
Bureau of Port and Harbor, (2021). Port of Tokyo statistics. https://www.kouwan.metro.tokyo.lg.jp/yakuwari/toukei/.
Canon Electronics Inc, (2020). Canon News Release. https://www.canon-elec.co.jp/files/media/2020/10/20201029_newsrelease.pdf
Chen, G., Govindan, K., and Yang, Z. (2013). Managing truck arrivals with time windows to alleviate gate congestion at container terminals. Int. J. Prod. Econ. 141 (1), 179–188. doi:10.1016/j.ijpe.2012.03.033
Cheng, B., Chen, Z., Yu, B., Li, Q., Wang, C., and Li, B., (2020). Automated extraction of street lights from JL1-3B nighttime light data and assessment of their solar energy potential. IEEE J. Sel. Top. Appl. Earth Observations Remote Sens. 13, 675–684. doi:10.1109/JSTARS.2020.2971266
Davarzani, H., Fahimnia, B., Bell, M., and Sarkis, J. (2016). Greening ports and maritime logistics: A review. Transp. Res. Part D Transp. Environ. 48, 473–487. doi:10.1016/j.trd.2015.07.007
Huang, L., Tan, Y., and Guan, X. (2022). Hub-and-spoke network design for container shipping considering disruption and congestion in the post COVID-19 era. Ocean Coast. Manag. 225, 106230. doi:10.1016/j.ocecoaman.2022.106230
Jeong, B., Kin, M., and Park, C. (2022). Decarbonization trend in international shipping sector. J. Int. Marit. Saf. Environ. Aff. Shipp. 6 (4), 236–243. doi:10.1080/25725084.2022.2156155
Jiang, W., He, G., Long, T., Guo, H., Yin, R., Leng, W., et al. (2018). Potentiality of using Luojia 1-01 nighttime light imagery to investigate artificial light pollution. Sensors 18 (9), 2900. doi:10.3390/s18092900
Kanamoto, K., Murong, L., Nakashima, M., and Shibasaki, R. (2021). Can maritime big data be applied to shipping industry analysis? – Focusing on commodities and vessel sizes of dry bulk carriers. Marit. Econ. Logist. 23, 211–236. doi:10.1057/s41278-020-00171-6
Kawasaki, T., Nakanishi, W., Hyodo, S., Namba, Y., Mori, H., and Kishi, H. (2022). Estimating freight production/attraction using nighttime satellite imagery. Commun. Transp. Res. 2, 100067. doi:10.1016/j.commtr.2022.100067
Levinson, M. (2016). The box: How the shipping container made the world smaller and the world economy bigger. 2. Princeton University Press, Princeton, NJ, USA.
Liu, A., Wei, Y., Yu, B., and Song, W. (2019). Estimation of cargo handling capacity of coastal ports in China based on panel model and DMSP-OLS nighttime light data. Remote Sens. 11 (5), 582. doi:10.3390/rs11050582
Matsuzawa, S., Shibata, T., Inakawa, T., Niwa, Y., and Sako, N. (2021). Proceedings of the Small satellite conference. Night-time color imaging with high resolution from a 35 kg microsatellite, Logan, Utah, July 2021.
Notteboom, T, E. (2006). The time factor in liner shipping services. Marit. Econ. Logist. 8, 19–39. doi:10.1057/palgrave.mel.9100148
Ping, Y., Zhao, J., Shi, H., Zhang, Q., and Xiang, B. (2021). An approximate system for evaluating real-time port operations based on remote sensing images. Int. J. Remote Sens. 42 (3), 783–793. doi:10.1080/2150704X.2020.1820612
Polinov, S., Bookman, R., and Levin, N. (2022). A global assessment of night lights as an indicator for shipping activity in anchorage areas. Remote Sens. 14 (5), 1079. doi:10.3390/rs14051079
QGIS Development Team, , QGIS geographic information system. Open source geospatial foundation project, https://www.qgis.org/en/site/.
R Development Core Team, (2019). R: A language and environment for statistical computing. Vienna, Austria: R Foundation for Statistical Computing.
Remote Sensing Technology Center of Japan, . CE-SAT-IIB, https://www.restec.or.jp/satellite/ce-sat-2b.html (Accessed March 15, 2023).
Remote Sensing Technology Center of Japan, , (2022). RESTEC announces distribution agreement of CE-SAT series data with Canon Electronics, https://www.restec.or.jp/en/notice/notice_year_2022/0615.html. (Accessed March 17, 2023).
Shibasaki, R., Kanamoto, K., and Suzuki, T. (2020). Estimating global pattern of lng supply chain: A port-based approach by vessel movement database. Marit. Policy & Manag. 47 (2), 143–171. doi:10.1080/03088839.2019.1657974
Sinergise, Sentinel Hub. Sentinel-2 L2A, https://docs.sentinel-hub.com/api/latest/data/sentinel-2-l2a/ (Accessed March 10, 2023).
Song, D. (2021). A literature review, container shipping supply chain: Planning problems and research opportunities. Logistics 5 (2), 41. doi:10.3390/logistics5020041
Štepec, D., Martinčič, T., and Skočaj, D. (October 2019). 1–10. Automated system for ship detection from medium resolution satellite optical imagery, IEEE, Proceedings of the OCEANS 2019 MTS/IEEE SEATTLE, Seattle, WA, USA. doi:10.23919/OCEANS40490.2019.8962707
Tokyo Metropolitan Government, (2023). Container lading/unloading reservation system business using CONPAS at the Port of Tokyo. https://www.metro.tokyo.lg.jp/tosei/hodohappyo/press/2023/03/27/26.html (Accessed April 10, 2023).
Tokyo Port Terminal Co, . Foreign Trade Wharf Layout and Traffic Network. Tokyo. https://www.tptc.co.jp/guide/list (Accessed March 9, 2023).
Trucking Association, Tokyo, , (2023). Results of the 21st maritime container vehicle waiting time survey at Tokyo port container terminals. https://www.totokyo.or.jp/archives/27653 (Accessed March 9, 2023).
United Nations, (2015), Paris Agreement. https://unfccc.int/sites/default/files/english_paris_agreement.pdf (Accessed May 10, 2023).
Wang, F., Zhou, k., Wang, M., and Wang, Q. (2020). The impact analysis of land features to JL1-3B nighttime light data at parcel level: Illustrated by the case of Changchun, China. Sensors 20 (18), 5447. doi:10.3390/s20185447
Wickham, H. (2016). ggplot2: Elegant graphics for data analysis. New York, NY, USA: Springer-Verlag.
Keywords: nighttime light image, container terminal operation, CE-SAT-IIB, Sentinel-2, Port of Tokyo, Japan
Citation: Murata H, Shibasaki R, Imura N and Nishinari K (2023) Identifying the operational status of container terminals from high-resolution nighttime-light satellite image for global supply chain network optimization. Front. Remote Sens. 4:1229745. doi: 10.3389/frsen.2023.1229745
Received: 26 May 2023; Accepted: 17 July 2023;
Published: 26 July 2023.
Edited by:
Xi Li, Wuhan University, ChinaReviewed by:
Mengjie Wang, Hunan University of Science and Technology, ChinaYizhen Wu, Southwest University, China
Copyright © 2023 Murata, Shibasaki, Imura and Nishinari. This is an open-access article distributed under the terms of the Creative Commons Attribution License (CC BY). The use, distribution or reproduction in other forums is permitted, provided the original author(s) and the copyright owner(s) are credited and that the original publication in this journal is cited, in accordance with accepted academic practice. No use, distribution or reproduction is permitted which does not comply with these terms.
*Correspondence: Hiroki Murata, murata.ykhm@gmail.com