 Shaun A. Forrest
 Darryl McMahon2
 Jesse C. Vermaire
- 1Department of Geography and Environmental Studies, Carleton University, Ottawa, ON, Canada
- 2Remote Energy Security Technologies Collaborative (RESTCo), Nepean, ON, Canada
- 3Institute of Environmental Science, Carleton University, Ottawa, ON, Canada
Changes in microplastic concentrations were examined during various temporal events including heavy rain and snowmelt in a river and an urban stream receiving stormwater. Additionally, microplastic concentrations were measured in an urban river during an active combined sewage overflow event. Microplastic concentrations downstream of a combined sewage outfall were observed to increase seven times compared to ambient conditions. During heavy rainfall an increase of 50 times the microplastic concentration was observed in the urban creek with microplastic concentrations doubling in the urban river. However, the largest increase in microplastic concentration at both locations was observed during the primary snowmelt of spring, with microplastic concentrations increasing 114 times in the urban creek and 11 times in the urban river. These results suggest that more research is required to further establish the influence of both combined sewage overflows and snowmelt as a major temporal conduit of microplastics to freshwater environments.
Introduction
Global plastic waste continues to accumulate at alarming rates with an estimated 60% of the 8,300 million metric tons of produced plastic discarded as waste (Geyer et al., 2017). Substantial amounts of plastic waste are awash in oceans with an estimated 5 trillion pieces of plastic weighing over 250,000 tons (Eriksen, 2014). Plastic waste is becoming a major emerging pollutant with suggestions it will be considered a geological indicator of the Anthropocene (Zalasiewicz et al., 2016). Microplastics, tiny pieces of plastics <5 mm (Masura et al., 2015), are becoming a global concern with these tiny pollutants identified in the deepest ocean trenches (Peng et al., 2018) and at the highest point on earth (Napper et al., 2020). The majority of the research on microplastics to date has focused on marine areas and it is suggested that microplastics are a contaminant of emerging concern (Wagner et al., 2014; Eerkes-Medrano et al., 2015). However, little research has focused on freshwater ecosystems, especially as rivers are identified as the major source of plastics to oceans (Lebreton et al., 2017), with riverine environments delivering up to 80% of plastic debris to seas and oceans (Skalska et al., 2020). To date, there has been little, if any, focus on the temporal change in microplastic concentrations from previously identified major sources, for example wastewater treatment plants (Estahbanati and Fahrenfeld, 2016; Horton et al., 2017; Vermaire et al., 2017; Windsor et al., 2019) and stormwater systems (Liu et al., 2019; Olesen et al., 2019; Grbić et al., 2020; Piñon-Colin et al., 2020; Ziajahromi et al., 2020).
One potential and major source of microplastics to freshwater systems, especially river environments, is combined sewage overflows. Sewer systems in larger urban areas are typically designed in one of two ways: a combined sewer and stormwater system; or a split-system where sewage and stormwater are conveyed separately. Traditionally, older and more established urban areas have combined sewer systems, thus, both stormwater and sewage are conveyed in the same pipe to treatment facilities. However, during larger rainfall (or snowmelt) events, treatment facilities may reach a critical volume threshold and at this point, a combined sewage overflow (CSO) is activated. During these events, both sewage and stormwater are released directly into receiving bodies of water to ensure treatment facilities are not overwhelmed. These events can contain large amounts of microplastics, as typically during the wastewater treatment process, many microplastics are removed and end up in wastewater sludge (Zubris and Richards, 2005; Nizzetto et al., 2016; Corradini et al., 2019). Thus, overflow events would contain microplastics that would otherwise be removed through treatment processes.
In many newer urban areas, or in suburbs within established urban centers, sewer systems are separated. In this case, stormwater is conveyed separately from sewage. Only sewage is transported to treatment facilities whereas stormwater flows directly into receiving bodies of water via stormwater drains. In some instances, stormwater may flow into urban creeks or small tributaries of larger river systems. These creeks tend to have modified channels and/or structures controlling flow, especially during high rainfall events, but do not typically receive wastewater, only stormwater.
Some microplastic research is emerging on the role of urban creeks in conveying microplastics (Dikareva and Simon, 2019) including research on microplastics in stormwater (Grbić et al., 2020; Ziajahromi et al., 2020) and stormwater ponds (Liu et al., 2019; Olesen et al., 2019). However, research is still relatively minimal, especially within freshwater systems, with limited research to date on the change in microplastic concentrations during combined sewage overflow events. One major reason for this is that combined sewage overflow outlets are typically underwater and hard to identify with very few locations having any real-time indication of an active event. Therefore, it can be difficult to sample these events. The current research aims to temporally sample a major urban river downstream of a combined sewage overflow and an urban creek that receives stormwater, to examine the change in microplastic concentration over various weather and seasonal events.
Study area
The research was conducted in the City of Ottawa, Ontario, Canada, at LeBreton Flats near the downtown core of Ottawa, and Graham Creek in Andrew Haydon Park in the city's West End (Figure 1). The LeBreton Flats location is a “pump up” from the Ottawa River used by the Ottawa River Runners kayak club, where the water is diverted through a kayak course before joining the Ottawa River again downstream of the Chaudière Falls. At this location, the City of Ottawa has installed a light (Figure 1) to signal real-time sewage overflow events, so kayakers know when water quality may be impacted. This signal light was the primary reason LeBreton Flats was selected as the Ottawa River location due to a real-time indication of active sewage overflow events. The Ottawa River is a major tributary of the Saint Lawrence River and runs ≈1,272 km from its source to its terminus near Montreal, Quebec. The Ottawa/Gatineau urban area is the largest urban area on the river, at ≈1.3 million inhabitants, and located roughly 130 km upstream from the river mouth.
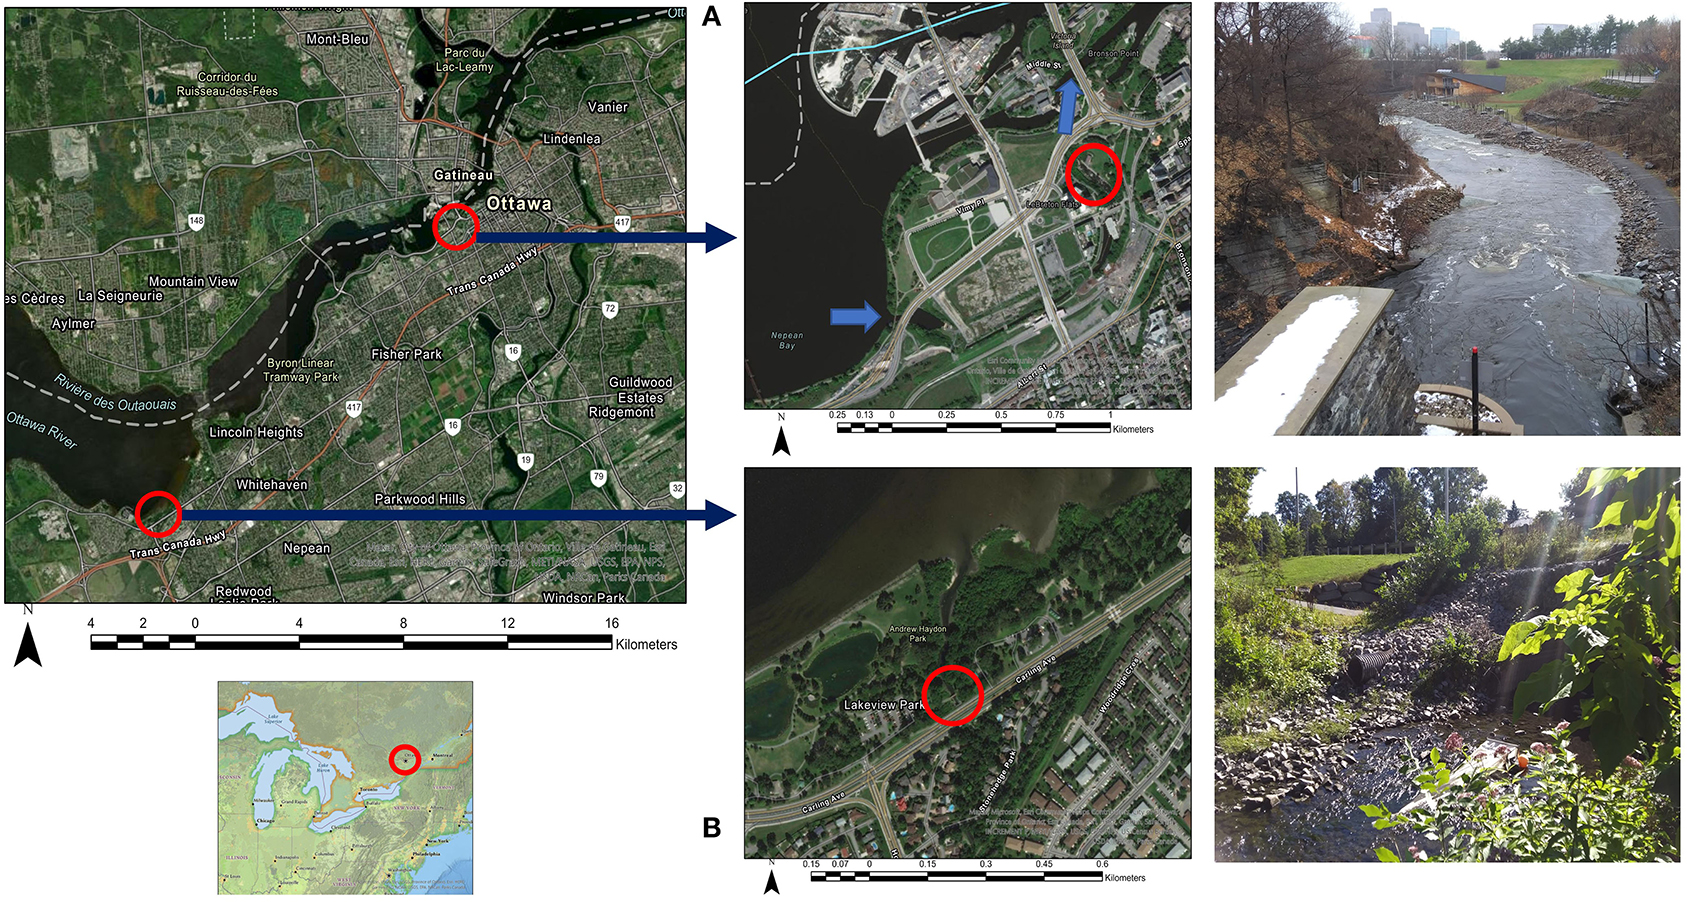
Figure 1. (A) A combined sewage overflow at LeBreton Flats, note the signal light in the foreground that is activated during real-time combined sewage events. (B) Graham Creek, an urban creek, note a stormwater input near the left bank of the creek.
Graham Creek is a small urban creek with an area of ≈25 km2. Graham Creek joins the Ottawa River at Andrew Haydon Park and begins at the Stony Swamp Wetland, roughly 6 km south of the Ottawa River. The creek flows through agricultural areas, however, the lower portions of the creek flow through urbanized areas with numerous channel modifications, including stormwater structures that convey stormwater runoff during rainfall and snow melt events. Stormwater outfalls are utilized in the Ottawa River watershed where there is a separate sewage system, thus, most stormwater drains are easier to identify, as they are dry during non-stormwater events, and flow during stormwater runoff. Therefore, the suburban sewer system around Graham Creek is separated and The LeBreton Flats location is in an area of the city where the sewer system is still combined.
Methodology
Sampling at both locations was conducted during heavy rain events, low to moderate rain events, during spring snow and during a primary and secondary snowmelt event of the spring. Additionally, LeBreton Flats was sampled during an active combined sewage overflow event. Furthermore, dry, non-precipitation events were sampled at both locations to indicate potential ambient or baseline microplastic conditions, in order to compare the increase in microplastic concentrations during identified temporal events.
Field methods
Sampling at Graham Creek was conducted with a Manta trawl net with a 300-μm mesh and detachable cod end and a flow meter. The net was deployed into the creek for between 5 and 20 min depending on flow, organic load and debris in the creek. For example, for rain and snowmelt events, there was typically one deployment for a shorter period as organic load was high in addition to higher plastic particle counts. For ambient conditions, the net was deployed for longer periods with triplicate samples utilized, as the net would not clog, and it gave the opportunity to capture more particles to reduce the impact of potential airborne contamination on final particle counts. The creek was shallow enough to deploy the net on the shoreline capturing the entire water column, with the depth of the creek covering between 30 and 80% of the net opening. Between each of the sample runs, the Manta net was flushed with water along the outside of the net to move all the captured contents into the cod end of the net. The cod end was then detached, and the contents washed into a clean glass Mason jar for transport to the laboratory. After each sample was completed, the Manta net was backwashed, with the cod end backwashed separately, to ensure there was no cross-contamination between sample dates. The volume of water sampled was calculated by taking the known area of the Manta net opening and determining the percentage coverage of the water at the net opening during sampling. The flow of the river was measured with a flow meter and averaged for the duration of the sampling time.
Graham creek was sampled on 10 different occasions between 2019 and 2021, representing a variety of temporal conditions, including the onset of heavy rain, during heavy rain, during dry and extended dry conditions, during the primary spring snowmelt in addition to a secondary snowmelt event and during snowfall. Additionally, sampling was conducted during spring, summer and fall. No winter sampling was conducted as there is no flow in the creek, as the creek is typically frozen.
The overflow location at LeBreton Flats was sampled a total of nine times between 2019 and 2021 ≈150 m downstream of the Fleet Street sewage overflow outlet. The representative temporal conditions included sampling during an active overflow event, during rain without an overflow event, the day after a heavy rain event, during an extended dry period, during the influence of spring freshet conditions on the Ottawa River and during the primary spring snowmelt in addition to a secondary snowmelt event. Furthermore, there were seven temporal events where both LeBreton flats and Graham Creek were sampled to compare the microplastic concentration at each location. Sampling at LeBreton Flats was conducted with a 100-μm mesh inside of a metal funnel and 1,000 liters (L) of water over three samples was passed through the mesh using a bucket. Sampling was conducted on the shoreline with the bucket submerged into a shallow area of the shoreline, with good current. The bucket was submerged into ≈50% of the water column. A control metal funnel and mesh were also present to indicate the potential for airborne contamination during sampling. Each of the samples and control mesh were then placed into a Whirl-Pak bag and transported to the laboratory and stored in a freezer until ready for processing. This method of sampling was chosen over deploying a Manta net, as the flow of the river at the LeBreton location is swift, thus, it is difficult to deploy a Manta net. Furthermore, during a combined sewage overflow event and/or heavy rainfall, fouling potential for a Manta net is high in addition to increased flow in the river. For these reasons, a grab method of sampling with a bucket was chosen.
Laboratory analysis
The 100-μm mesh filters and the contents of the Mason jars from the Manta samples were washed into a clean beaker using filtered deionised water. A 30% hydrogen peroxide solution was added, and the sample heated to 50°C in a water bath for digestion of organic material. The temperatures were kept below 70°C as not to alter the inherent shape of polymers that may be in the sample (Kalpakjian and Schmid, 2008) and to avoid the potential complete loss of microplastics in wet peroxide oxidation in temperatures above 70°C (Munno et al., 2018). Digestion time varied depending on organic content of the samples (between 2 and 14 h). Once digestion was completed, the solution was passed through a vacuum filtration system with a clean (pre-inspected) 80-μm metal mesh filter, that was then backwashed into a clean (pre-inspected) petri dish after the solution had completely passed through. Visual inspection identified potential microplastics under a Leica stereomicroscope at 20–40× magnification. Suspected microplastics were identified and classified as fibers, fragments or beads (Lusher et al., 2020). The color of each particle was also noted (up to secondary colors including black and white), however, it has been suggested that broad color classifications are not sufficient to indicate particle similarity, given the range of shades available, but noting microplastic color is still recommended during visual assessment (Lusher et al., 2020) as it may give information on potential broad trends (Shaw and Day, 1994). Additionally, various fragments were put aside for further analysis to identify polymer types using micro-Fourier-transform infrared spectroscopy. For the Graham Creek samples, 13 fragments were analyzed (out of a total of 317) and for LeBreton Flats, three fragments were analyzed (from a total of 45 fragments), with at least one fragment from each temporal event at Graham Creek and three temporal events at LeBreton Flats (three of the sampled events did not have any identified fragments). This represented ≈4% of the total fragments extracted from each location, slightly above the recommended minimum of 3% of total microplastics that need to be analyzed to be representative (Kedzierski et al., 2019). Polymer identification was carried out using micro-ATR-FTIR analysis using a Nicolet iN 10 Infrared Microscope where spectrums were compared to the Hummel Polymer and Additives FTIR Spectral Library. Some of the pre-treatment may not have efficiently removed the matrix, which could have hindered the spectroscopic identification (Uurasjärvi et al., 2021), thus, spectral matches with an R value equal or >0.7 were considered a good fit to the spectral library.
Quality assurance and quality control
Many of the quality assurance and quality control (QA/QC) recommendations were drawn from Cowger et al. (2020) and included strict processing protocols in the laboratory to avoid airborne contamination in addition to performing procedural blanks. All work was conducted under a laminar flow hood to reduce airborne contamination of the samples while being prepared and analyzed. The research team wore natural fiber laboratory coats and minimized movement around the laminar flow hood during sample preparation and analysis. Procedural blanks in the laboratory included placing 10 laboratory blanks under the laminar flow hood to account for fiber precipitation during sample preparation and analysis. Analysis of laboratory blanks returned an average of 1.1 fibers per blank, with a maximum count of three fibers and a minimum of zero. The LeBreton Flats field controls aimed to mimic the sampling procedure as closely as possible (Brander et al., 2020) and presented an average of 2.63 fibers with a maximum count of four in one control (Supplementary Table S1). For LeBreton Flats, fibers in the controls were ≈10–200-fold lower than those in the samples, therefore, contamination errors were considered negligible. Field controls were not conducted at Graham Creek as the sample volumes were significantly higher than LeBreton Flats. This is not to discount the influence of atmospheric contamination with suggestions of atmospheric fallout rates of 2 and 355 fibers per m3 per day (Dehghani et al., 2017), however, with sample volumes over 120,000 L in ambient conditions, potential atmospheric contamination influences was considered negligible.
Two different mesh sizes where utilized for sampling due to the aforementioned field sampling circumstances. It has been noted that samples collected from a 300-μm mesh compared to a 100 μm mesh, could underestimate fibers by up to four orders of magnitude (Covernton et al., 2019). Furthermore, as the LeBreton Flats samples did not collect from the total water column unlike Graham Creek, the size range of microplastics is likely smaller (Barrows et al., 2017). However, z-scores were calculated for both LeBreton Flats and Graham Creek (discussed in further detail in the preceding section) to allow for a comparison between the mutual temporal events.
Statistical analysis
To examine if changes in microplastic concentration at the two study sites were synchronous as a result of similar environmental conditions a Pearson's correlation analysis was carried out in R (R Core Team, 2020) on the seven sampling days that overlapped between the two sites. Because of the different methods used in microplastic sampling at the two sites the data were standardized for each site by subtracting the mean and dividing by the standard deviation (z-score). Additionally, a principal component analysis was conducted in R using a square root of the variables to down weight relative abundance and to be able to visualize the change in fiber and fragment color types according to the temporal event.
Results
At LeBreton Flats, the nine samples averaged 88 particles per cubic meter of water (p/m3) with a minimum of 10 p/m3 and a maximum of 273 p/m3. The standard deviation over the nine samples was 79 p/m3. The active overflow event on November 1st, 2019, corresponded to a concentration of 167 p/m3. This was after ≈62 mm of rain in the 48 h preceding the sampling. The highest concentration of 273 p/m3 was during the first snowmelt event of spring 2021. The weather was clear with no previous precipitation over 48 h. However, the increased air temperature created visible overland runoff from the melting snowpack. An additional melt event 6 days later was also sampled and represented a concentration of 92 p/m3. Additionally, no rain was noted during the previous 48 h for this event. On March 26th, 2021, the location was sampled with a concentration of 49 p/m3. Previous rainfall was noted at ≈37 mm 48 h before the event. A spring snowfall event was sampled on April 21st, 2021, and the concentration was noted at 88 p/m3 with the approximate amount of snow falling at 0.4 cm in the previous 24 h. On May 14th, 2021, the concentration was noted at 29 p/m3 with the possibility of a spring freshet influence as the river was running high with no rain or stormwater inputs. On June 4th, 2021, the location was sampled, and the concentration was 34 p/m3. Steady rain was noted the day before with ≈7 mm of rain falling 24–48 h before, but no rainfall 8 h before sampling, in fact this rainfall broke a prolonged dry spell. After a dry spell, the river was sampled on June 11th, 2021, and the concentration was noted at 10 p/m3, the lowest recorded concentration. The ninth sample was conducted on July 24th, 2021, with a concentration of 34 p/m3. Some rainfall was noted 8 h before sampling, ≈2.3 mm of rain. However, the rainfall was sporadic, and isolated, typical of summer precipitation in the watershed (Supplementary Tables S2, S3).
At Graham Creek, the 10 samples averaged 12.93 p/m3 with a maximum of 52.55 p/m3 and a minimum of 0.37 p/m3. The standard deviation over the 10 samples was 15.87 p/m3. On September 9th and 18th, 2019 sampling was conducted after dry conditions with a concentration of 0.40 and 0.37 p/m3, respectively. On October 31st, 2019, the creek was sampled during a heavy rain event and the concentration was noted at 19.92 p/m3. The rainfall was noted at ≈20.6 mm over the previous 48 h. This was the same event as the active combined sewage overflow for the LeBreton Flats location, sampled the day before. Another rain event on October 21st, 2020, was sampled with a concentration of 26.51 p/m3. As with the overflow location, samples were conducted on March 11th, March 26th, April 21st, May 14th, and June 4th, 2021. The primary snowmelt event on March 11th highlighted the highest recorded concentration of 52.55 p/m3. The secondary snowmelt event on March 26th presented a concentration of 6.96 p/m3. The snowing conditions of April 21st had a corresponding concentration of 15.82 p/m3, with the drier conditions of May 14th and June 4th exhibiting concentrations of 0.60 and 0.75 p/m3, respectively (Supplementary Tables S4, S5).
Changes in microplastic concentrations at the two sampling sites during the seven overlapping sampling days were highly correlated (r = 0.96, p < 0.001), suggesting changes in microplastic concentrations were driven by changing environmental conditions common between the two sites (Figure 2).
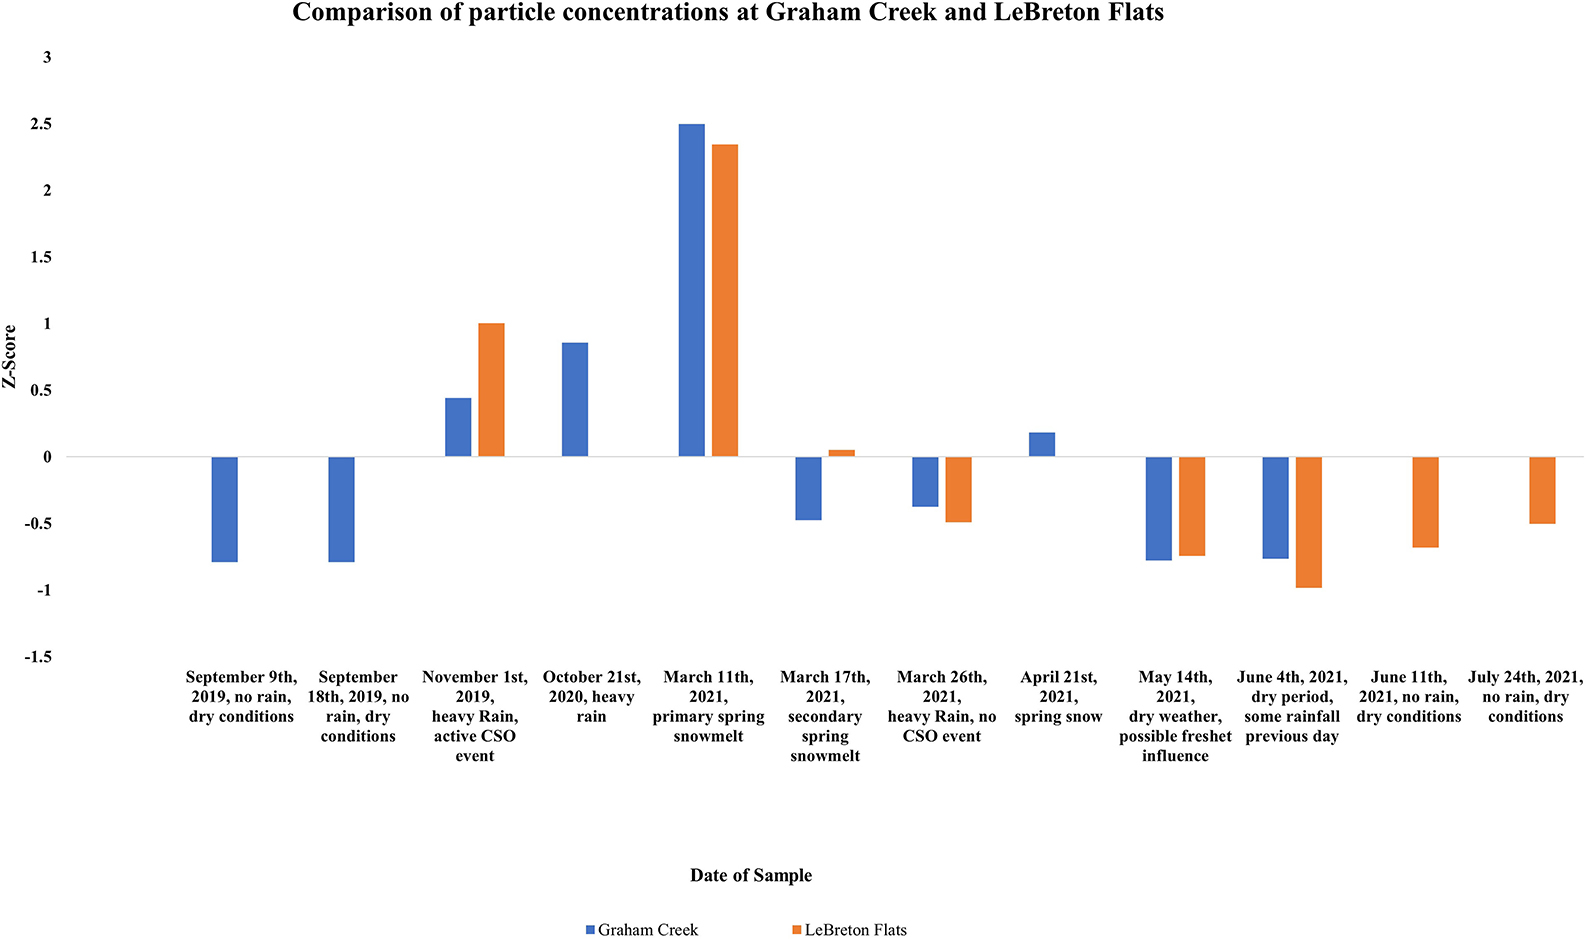
Figure 2. Z-score values for comparison of particle concentration between Graham Creek and LeBreton Flats during various temporal events.
In the LeBreton combined sewage overflow samples, 96% of the extracted particles were fibers with 4% fragments. The fibers were predominately blue in color corresponding to 65% of all identified fibers. Other colors of note for the fibers were 16% black, 10% red and 4% green. Blue fragments were also the predominant color accounting for 53% with 16% white, 13% green and 7% black.
The Graham Creek samples were also predominantly fibers, with fibers accounting for 79% of the extracted particles (Figure 3). The predominant fiber color was blue with 74%, with other common colors 17% black, 3% red and 2% green. For the extracted fragments, black was the dominant color with 57% of the fragments, with other colors of note at 21% blue, 10% red, 5% white and 2% green.
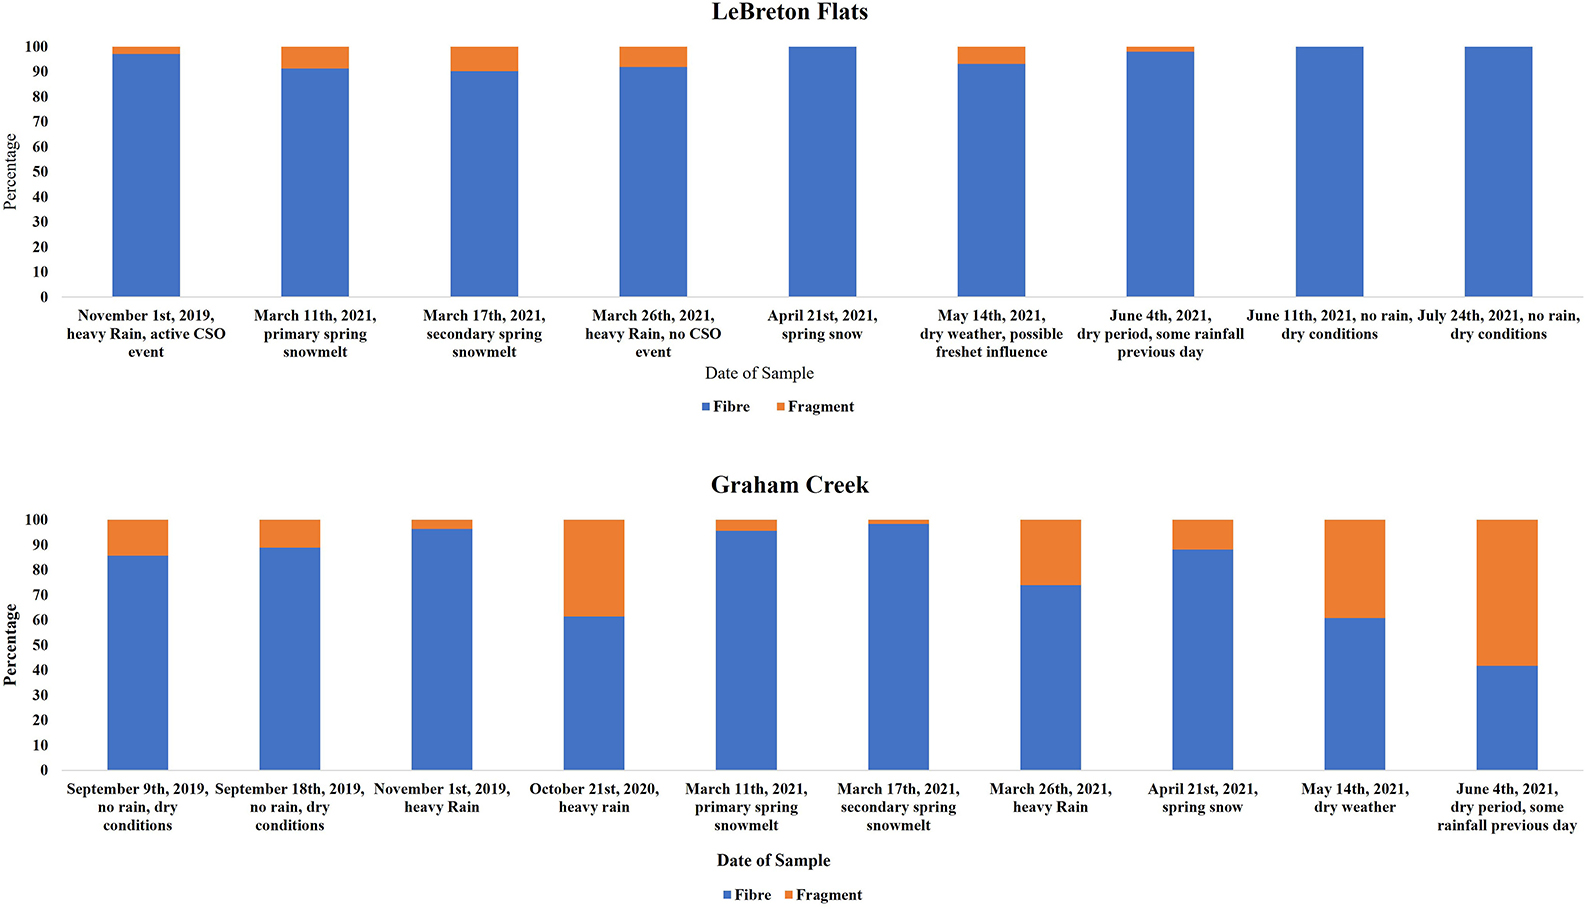
Figure 3. Comparison between fibers and fragments during each sampled temporal event at Le Breton Flats and Graham Creek.
Additionally, the relative change in fragments and fibers (according to z-scores) changed according to the temporal event (Figure 4), with an increase of fragments at Graham creek coinciding with the heavy rain event on October 21st, 2020, and an increase in fragments was noted at LeBreton Flats during the primary snowmelt. Additionally, an increase of fibers was also noted at LeBreton Flats during the primary snowmelt. An increase of fibers was noted at Graham creek during the heavy rain event on November 1st, 2021, and during the primary snowmelt. The PCA analysis (Figure 5) highlights in the relationship between fiber and fragment colors at Graham Creek and LeBreton Flats during the examined temporal events. The results from the PCA analysis demonstrate an increase in white and black fragments during some of the Graham Creek dry events. Additionally, an increase in green and blue fibers were highlighted during three LeBreton Flats dry events, a LeBreton snowmelt event in addition to a Graham Creek snowmelt and rain event. Red fibers demonstrated an increase during snow melt at LeBreton and red fibers were also exhibited an increase during a snowmelt event at LeBreton. Some of the temporal events did not highlight a noticeable increase in certain colors of fibers and fragments, for example a Graham Creek snowmelt event, the CSO event and a LeBreton dry event.
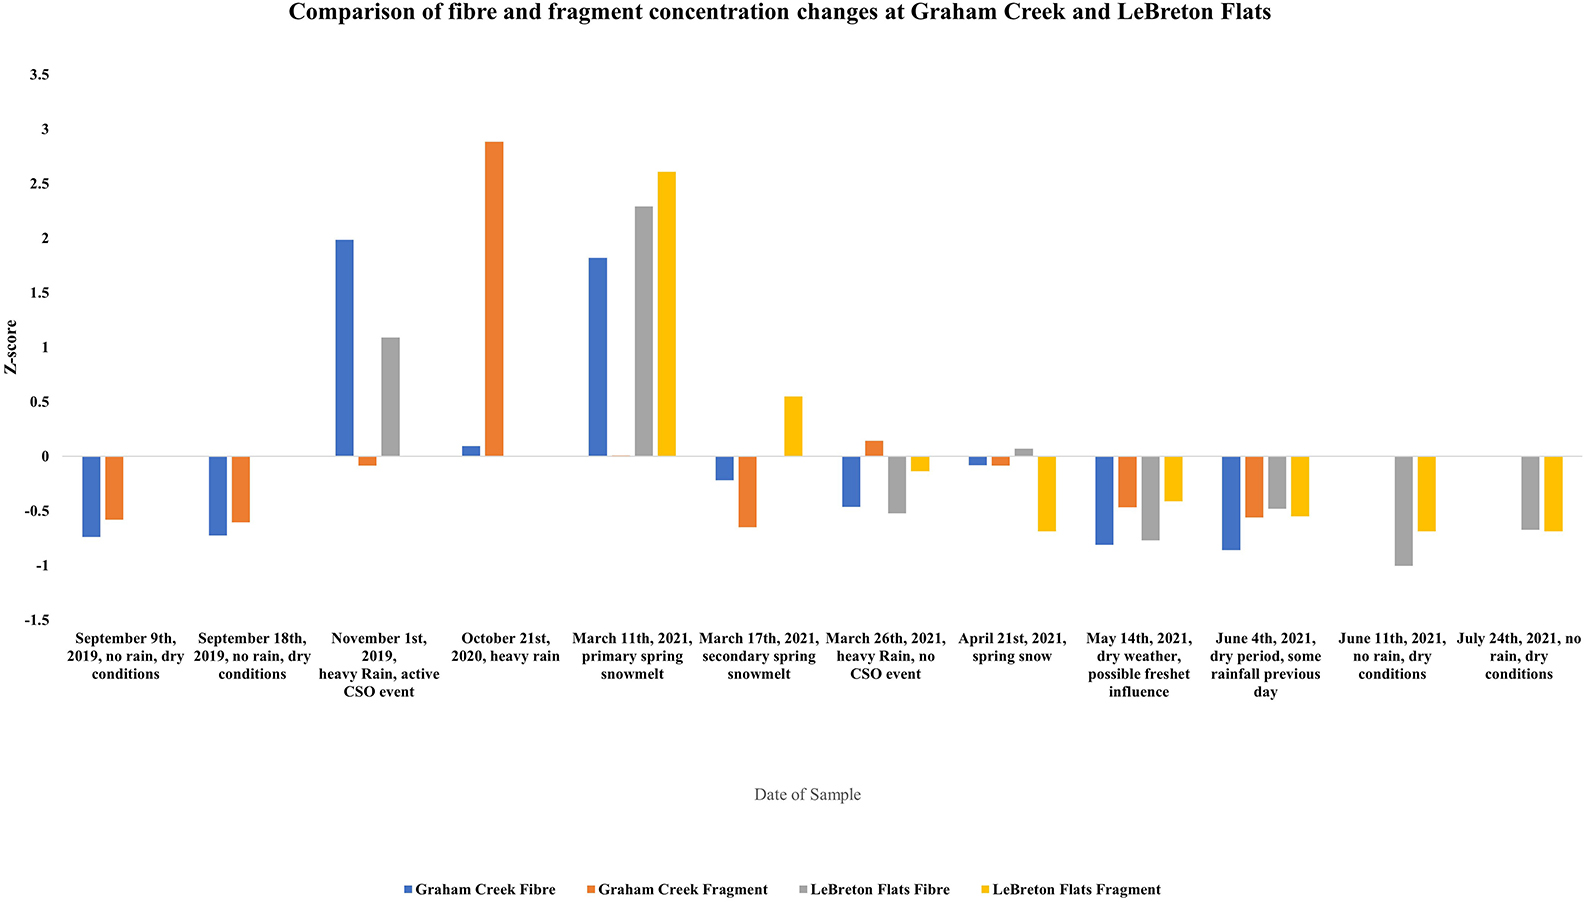
Figure 4. Z-score values for comparison of the change in fibers and fragments between Graham Creek and LeBreton Flats during various temporal events.
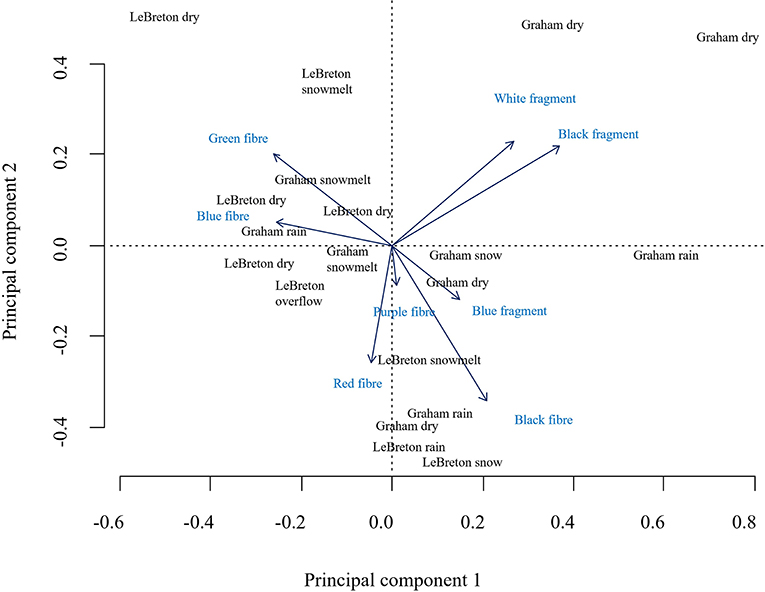
Figure 5. A principal component analysis highlighting the change in fragment and fiber colors according to temporal events.
As the majority of the fibers extracted from the samples were deemed to be anthropogenically modified a selection of fragments were chosen to be analyzed under micro-Fourier-transform infrared spectroscopy (Figures 6, 7). Of the 16 samples analyzed with micro-Fourier-transform infrared spectroscopy, all were identified as plastics.
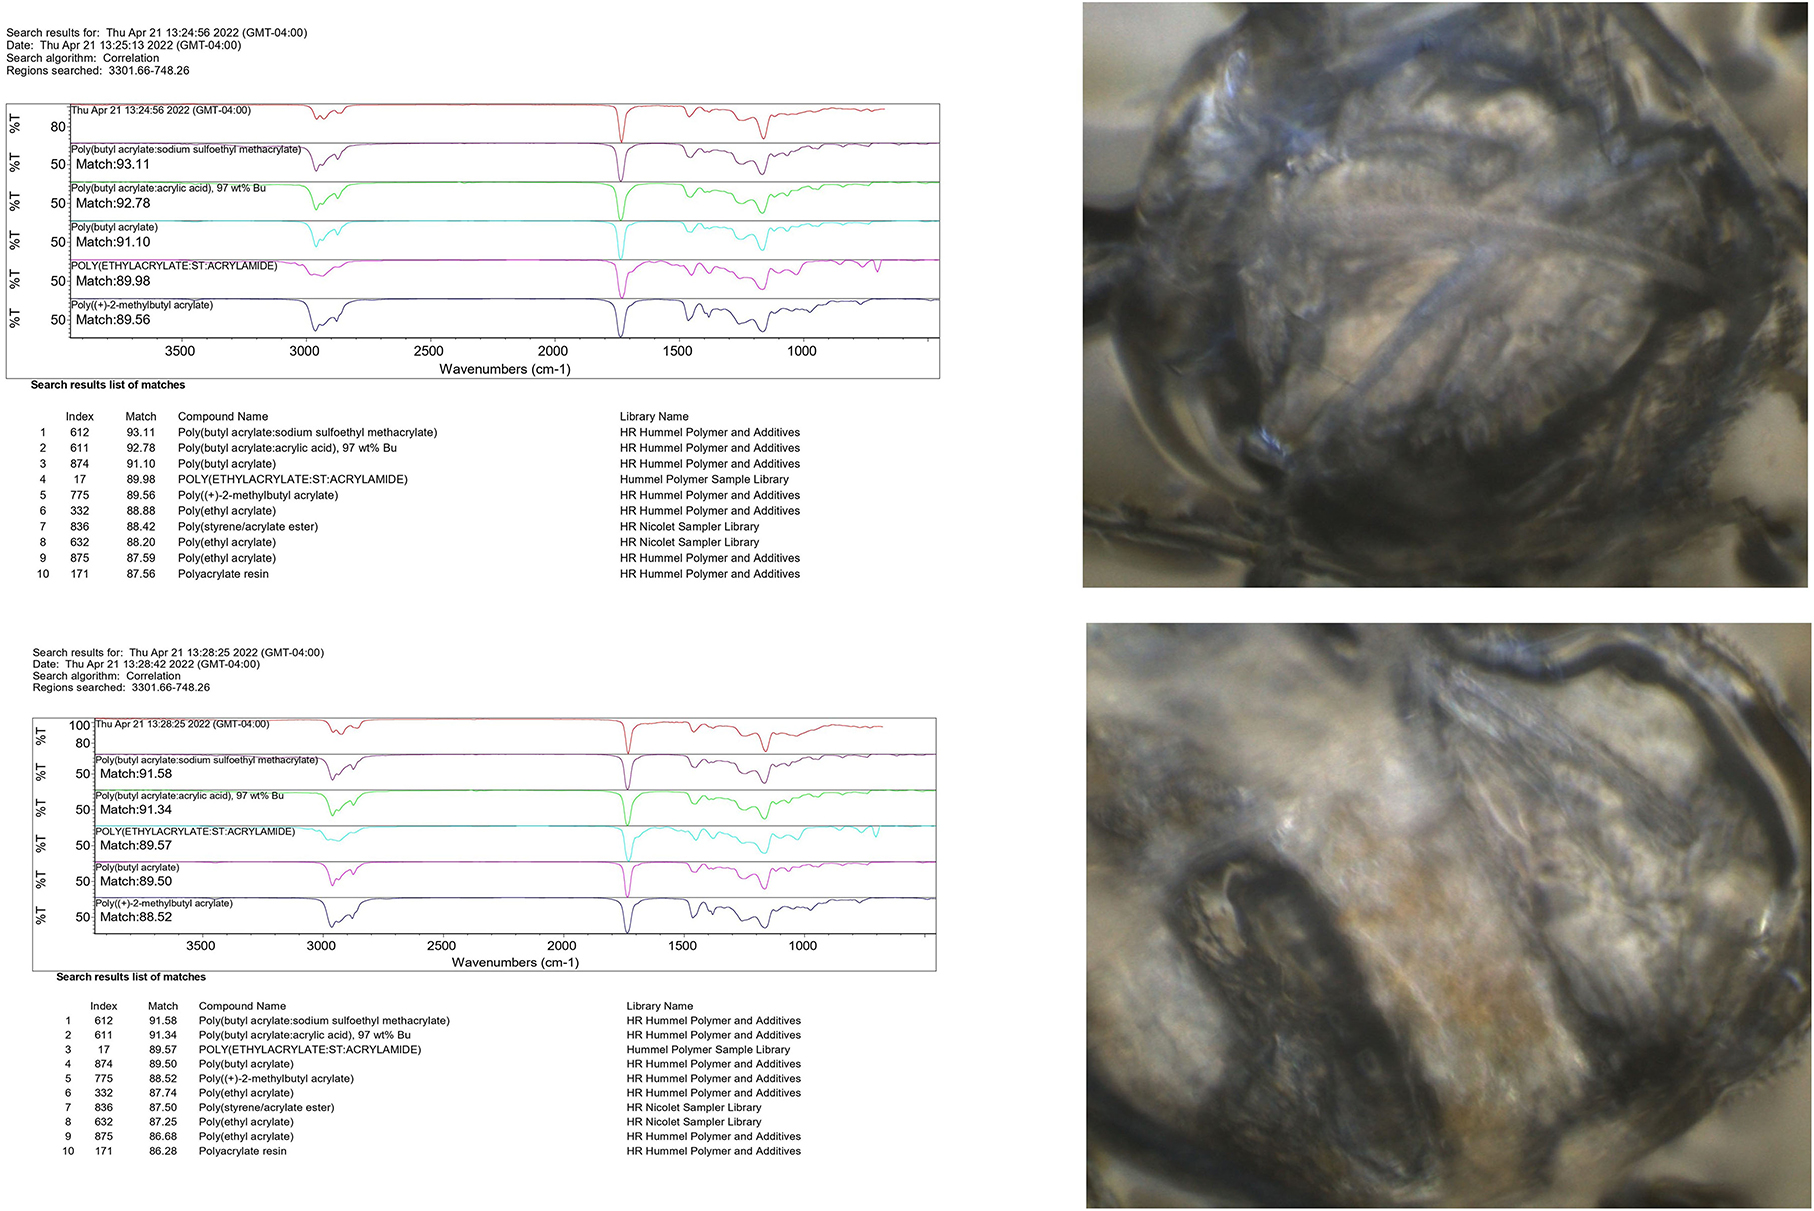
Figure 6. Micro-FTIR analysis of two suspected plastics from Graham Creek.
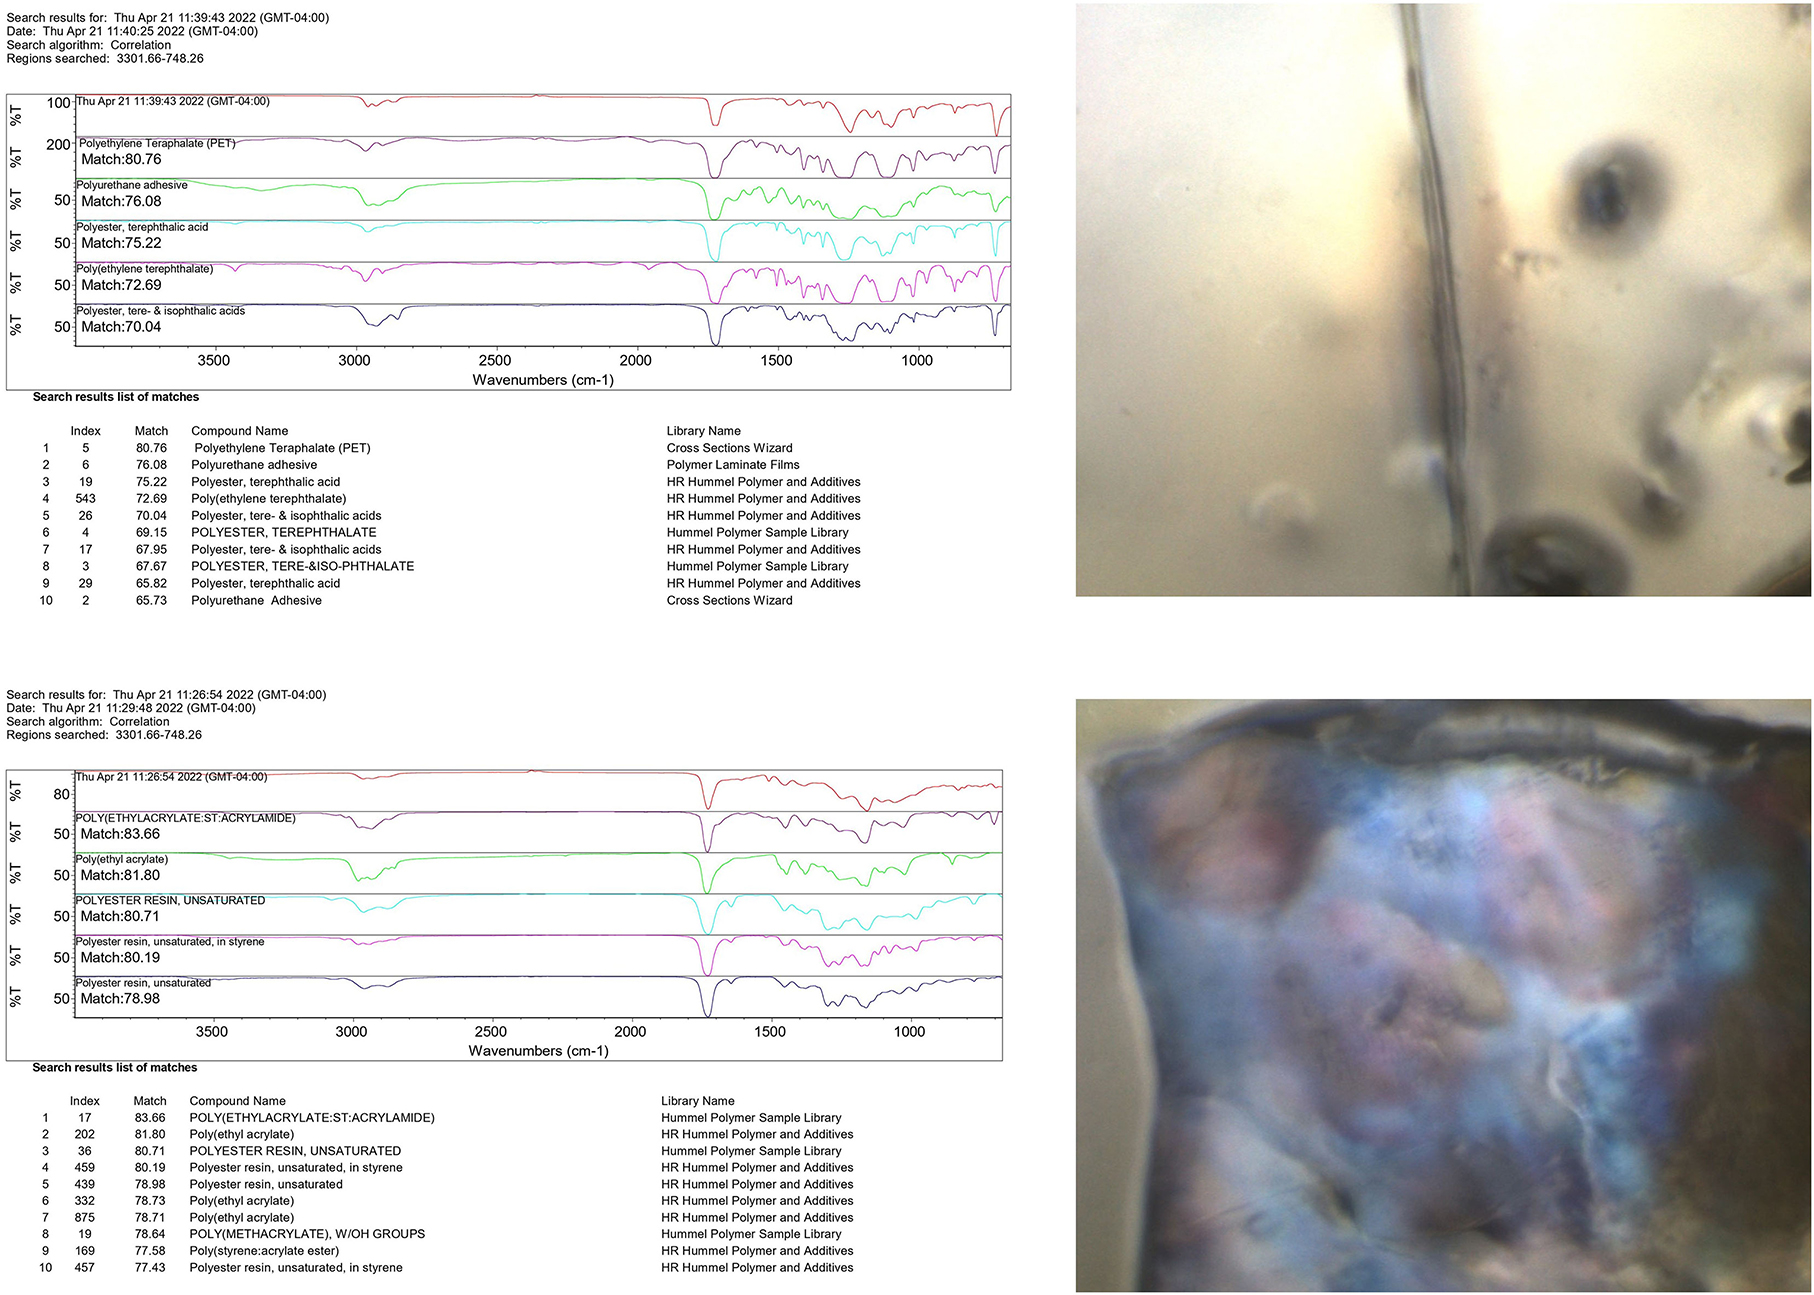
Figure 7. Micro-FTIR analysis of two suspected plastics from LeBreton Flats.
Discussion
The results have demonstrated how various temporal events can increase microplastic concentrations, downstream of combined sewage overflow outlets and in urban streams that receive stormwater. Snowmelt events demonstrated the highest concentrations of microplastics over all temporal events. Additionally, the combined sewage overflow event was significant, especially as the LeBreton Flats location represents only one location of numerous outfalls throughout the Ottawa and Gatineau urban areas. Therefore, combined sewage overflow events are potentially a major source of microplastics to river and freshwater systems. CSO inputs have previously been reported as a major conduit of microplastics to freshwater environments (Dris et al., 2018) and the current research further confirms the importance of CSO overflows as an important point source. However, the comparative concentration of snowmelt events to other temporal events is substantially higher, especially with a location like the Ottawa River watershed where snow melt events are throughout the watershed in spring, rather than combined sewage overflow events which are mainly confined to urban areas. Additionally, it should be noted that larger snowmelt events can also trigger combined sewage overflow events, potentially creating a much larger microplastic load event. However, as the snowmelt events were only recorded in an urban area, there is no data on the potential change in microplastic concentration from snowmelt in agricultural areas or regions of sparse population. These findings highlight more research is needed on the impact snow melt has on microplastic load to freshwater systems, especially in watersheds that receive significant winter snow.
The z-values are very close for five of the temporal events, demonstrating that the change in microplastic concentration during these events are linked at both locations. This demonstrates that certain temporal events have a significant influence on microplastic concentrations with these results providing useful data on how microplastic concentrations and loads change according to a specific temporal event.
The research does highlight rain events contribute to increased microplastic concentrations, also noted in previous research in Canada (Grbić et al., 2020) and highlighted overall as a main contributor of microplastics to water bodies (Piñon-Colin et al., 2020). Furthermore, the peak concentrations from rain events tend to occur at the onset of rainfall events with wet weather overland flow significantly increasing microplastic pollution in urban areas (Chen et al., 2020).
Both locations presented particles that were mainly fibers, consistent with previous research on Canadian rivers (Vermaire et al., 2017; Warrack et al., 2017; Forrest et al., 2019; Bujaczek et al., 2021). However, there was a change in the relative concentrations of fragments during one of the heavy rain events at Graham Creek on October 21st, 2020. During this temporal event, the dominant fragment color was black. Many of these black fragments present in the sample particles were indicative of tire debris, however, FTIR analysis was not performed on these particular fragments due to the potential of interference, thus are difficult to confirm as tire or road wear particles (Grbić et al., 2020). Nonetheless, previous research does note tire particles as a source of microplastics to the environment (Kole et al., 2017) and as a component of stormwater particles (Ziajahromi et al., 2020). However, the PCA did note that black fragments were relatively high during dry periods at Graham Creek, indicating the potential for atmospheric transport of black fragments. An increase in fibers at LeBreton Flats was noted to coincide with the combined sewage overflow event. Fibers have previously been noted to be the dominant type in wastewater (Gündogdu et al., 2018; Blair et al., 2019) including samples from Canadian wastewater treatment plants (Gies et al., 2018). This can be part due to the amount of textile fibers in wastewater from laundry (Belzagui et al., 2019) entering wastewater streams. Nonetheless, Graham Creek and LeBreton flats also exhibited an increase of fibers during the primary snowmelt event, with Graham Creek exhibiting an increase during a high rainfall event. These events do not have wastewater inputs, thus, atmospheric fallout and/or atmospheric precipitation with rainfall or snow is a potential source. This can include an accumulation in the snowpack that is released in the spring during snowmelt events. Previous research has identified that atmospheric transport is an important source of microplastics, especially in urban areas (Dris et al., 2016; Cai et al., 2017; Dehghani et al., 2017) with fibers a major component of atmospheric microplastics (Dris et al., 2016, 2017; Gasperi et al., 2018). Furthermore, it represents the need to advance research on the contribution of microfibres (synthetic and anthropogenically modified) to microplastic pollution, especially in understudied compartments and geographical regions (Athey and Erdle, 2021).
The identified polymers from the extracted fragments (Figures 5, 6) represent some commonly found plastics, for example polyethylene terephthalate (PET), low density polyethylene (LDPE) with other identified polymers including poly (ethyl acrylate).
Temporal events at Graham Creek sampled on dates that did not coincide with dates at LeBreton Flats involved two dry periods and another heavy rainfall event. The dry temporal events presented the two lowest particle concentrations, as there are no additional inputs from rainfall and/or overland runoff. These two events, as well as the additional dry period sampled on May 14th, 2021, is assumed to represent the normal environmental, or background particle concentrations of Graham Creek. The average concentration of the three sampled dry events is 0.46 p/m3. To compare this background concentration to major temporal events, it is noted a heavy rainfall event in summer or fall, with strong stormwater drain outflows (October 31st, 2019 and October 21st, 2020) increases particle concentrations by ≈50 times (from 0.46 to 23.21 p/m3). Additionally, the first snowmelt event of the season increases particle concentrations by ≈114 times (from 0.46 to 52.55 p/m3) with secondary melt events increasing concentrations by ≈12 times. Additionally, snowfall, when the creek is not frozen and flowing in early spring, presents a significant increase in particle concentration, ≈34 times from background concentrations (from 0.46 to 15.82 p/m3). This highlights that even though urbanized creeks may not have any wastewater treatment inputs, they can still be a significant point source of microplastics to the environment.
Additional events sampled at LeBreton Flats independent from Graham Creek included two supplementary samples during dry periods. As with Graham Creek, sampling during dry periods with no assumed significant temporal inputs presents a potential background concentration to compare major temporal events. The background concentration at LeBreton Flats was noted at 24 p/m3, averaged from May 14th, June 11th, and July 24th, 2021. A combined sewage overflow event potentially increases particle concentrations by seven times (from 24 to 167 p/m3) with the highest increase potentially 11 times during the primary spring snowmelt (from 24 to 273 p/m3). The secondary snowmelt and spring snow presents a potential increase of concentration up to four times (from 24 to 92 and 88 p/m3, respectively). Additionally, rainfall events during a non-combined sewage overflow event still increase concentrations by approximately double. Furthermore, it should be noted that the City of Ottawa constructed overflow tunnels in the downtown core during the sampling period. These tunnels direct active combined sewage overflow events into temporary tunnel storage and not directly into a receiving body of water, like the LeBreton Flats location. This is significant, as the rainfall event on March 26th, 2021, in the 8 h prior to sampling, demonstrated similar rainfall amounts to the sampled active combined sewage overflow event. Though the eventual rainfall amounts were higher up to 2 days before the active combined sewage overflow event, what would have potentially been an additional combined sewage overflow event at LeBreton Flats on March 26th, 2021, was possibly avoided by the storage tunnels. Therefore, the storage tunnels potentially reduce particle concentrations by two-thirds (from 167 to 49 p/m3).
As climate trends continue to warm and urban populations continue to grow, the impact on urban river systems will intensify as summer baseline flows decrease and wastewater flows increase (Woodward et al., 2021). Additionally, the impact of snowmelt in urban areas necessitates additional research into microplastic release during these temporal events.
Conclusions
A major river downstream of a combined sewage overflow outlet and an urban creek were sampled under various temporal indicators that were suspected to contribute to a significant change in microplastic concentrations. An urban creek receiving stormwater inputs demonstrated an increase of suspected microplastics up to 50 times during heavy rain events and up to 34 times during spring snow. The first snowmelt event of the spring contributed to a particle increase of up to 114 times, with a secondary melt event demonstrating an increase of 12 times. For the Ottawa River, a location directly downstream of a combined sewage overflow outlet demonstrated a particle increase of up to seven times during an active combined sewage overflow event after heavy rainfall. During a rainfall event without an active combined sewage overflow, the concentration doubled, possibly suggesting recent storage tunnels built in Ottawa to manage combined sewage overflow events are reducing particle concentrations by up to two-thirds. During the primary snowmelt of spring, concentrations were recorded at ≈11 times the normal concentration.
These results demonstrate that snowmelt events are the most significant event in terms of increased concentration of microplastics in urban rivers and streams. However, combined sewage overflow events are contributing the greatest load of microplastics to urban rivers, as demonstrated in the Ottawa/Gatineau urban area, due to the numerous combined sewage overflow locations and frequent discharge events. This research establishes further temporal analysis would be beneficial to freshwater microplastic research as these results indicate temporal events produce significant microplastic loads to freshwater environments.
Data availability statement
The raw data supporting the conclusions of this article will be made available by the authors, without undue reservation.
Author contributions
SF: conceptualization, data curation, formal analysis, investigation, visualization, and writing—original draft. DM: conceptualization, funding acquisition, and writing—review and editing. WA: conceptualization, funding acquisition, and writing—review and editing. JV: conceptualization, funding acquisition, resources, supervision, and writing—review and editing. All authors contributed to the article and approved the submitted version.
Acknowledgments
The authors appreciatively acknowledge the financial support received during the research project. RESTco was supported in part by a grant from the National Geographic Society (Grant: NGS-51553T-18) with Shaun Forrest supported by a MITACS Accelerate award. The authors are also grateful to the reviews with their suggestions and constructive comments helping improve the quality of the manuscript.
Conflict of interest
Authors DM and WA are employed by Remote Energy Security Technologies Collaborative (RESTCo).
The remaining authors declare that the research was conducted in the absence of any commercial or financial relationships that could be construed as a potential conflict of interest.
Publisher's note
All claims expressed in this article are solely those of the authors and do not necessarily represent those of their affiliated organizations, or those of the publisher, the editors and the reviewers. Any product that may be evaluated in this article, or claim that may be made by its manufacturer, is not guaranteed or endorsed by the publisher.
Supplementary material
The Supplementary Material for this article can be found online at: https://www.frontiersin.org/articles/10.3389/frwa.2022.958130/full#supplementary-material
References
Athey, S. N., and Erdle, L. M. (2021). Are we underestimating anthropogenic microfiber pollution? A critical review of occurrence, methods, and reporting. Environ. Toxicol. Chem. 41, 822–837. doi: 10.1002/etc.5173
Barrows, A. P. W., Neumann, C. A., Berger, M. L., and Shaw, S. D. (2017). Grab vs. neuston tow net: a microplastic sampling performance comparison and possible advances in the field. Anal. Methods 9, 1446–1453. doi: 10.1039/C6AY02387H
Belzagui, F., Crespi, M., Álvarez, A., Gutiérrez-Bouzán, C., and Vilaseca, M. (2019). Microplastics' emissions: microfibers' detachment from textile garments. Environ. Pollut. 248, 1028–1035. doi: 10.1016/j.envpol.2019.02.059
Blair, R. M., Waldron, S., and Gauchotte-Lindsay, C. (2019). Average daily flow of microplastics through a tertiary wastewater treatment plant over a ten-month period. Water Res. 163, 114909. doi: 10.1016/j.watres.2019.114909
Brander, S. M., Renick, V. C., Foley, M. M., Steele, C., Woo, M., Lusher, A., et al. (2020). Sampling and quality assurance and quality control: a guide for scientists investigating the occurrence of microplastics across matrices. Appl. Spectrosc. 74, 1099–1125. doi: 10.1177/0003702820945713
Bujaczek, T., Kolter, S., Locky, D., and Ross, M. S. (2021). Characterization of microplastics and anthropogenic fibers in surface waters of the North Saskatchewan River, Alberta, Canada. FACETS 6, 26–43. doi: 10.1139/facets-2020-0057
Cai, L., Wang, J., Peng, J., Tan, Z., Zhan, Z., Tan, X., et al. (2017). Characteristic of microplastics in the atmospheric fallout from Dongguan city, China: preliminary research and first evidence. Environ. Sci. Pollut. Res. 24, 24928–24935. doi: 10.1007/s11356-017-0116-x
Chen, H., Jia, Q., Zhao, X., Li, L., Nie, Y., Liu, H., et al. (2020). The occurrence of microplastics in water bodies in urban agglomerations: impacts of drainage system overflow in wet weather, catchment land-uses, and environmental management practices. Water Res. 183, 116073. doi: 10.1016/j.watres.2020.116073
Corradini, F., Meza, P., Eguiluz, R., Casado, F., Huerta-Lwanga, E., and Geissen, V. (2019). Evidence of microplastic accumulation in agricultural soils from sewage sludge disposal. Sci. Total Environ. 671, 411–420. doi: 10.1016/j.scitotenv.2019.03.368
Covernton, G. A., Pearce, C. M., Gurney-Smith, H. J., Chastain, S. G., Ross, P. S., Dower, J. F., et al. (2019). Size and shape matter: a preliminary analysis of microplastic sampling technique in seawater studies with implications for ecological risk assessment. Sci. Total Environ. 667, 124–132. doi: 10.1016/j.scitotenv.2019.02.346
Cowger, W., Booth, A. M., Hamilton, B. M., Thaysen, C., Primpke, S., Munno, K., et al. (2020). Reporting guidelines to increase the reproducibility and comparability of research on microplastics. Appl. Spectrosc. 74, 1066–1077. doi: 10.1177/0003702820930292
Dehghani, S., Moore, F., and Akhbarizadeh, R. (2017). Microplastic pollution in deposited urban dust, Tehran metropolis, Iran. Environ. Sci. Pollut. Res. 24, 20360–20371. doi: 10.1007/s11356-017-9674-1
Dikareva, N., and Simon, K. S. (2019). Microplastic pollution in streams spanning an urbanisation gradient. Environ. Pollut. 250, 292–299. doi: 10.1016/j.envpol.2019.03.105
Dris, R., Gasperi, J., Mirande, C., Mandin, C., Guerrouache, M., Langlois, V., et al. (2017). A first overview of textile fibers, including microplastics, in indoor and outdoor environments. Environ. Pollut. 221, 453–458. doi: 10.1016/j.envpol.2016.12.013
Dris, R., Gasperi, J., Saad, M., Mirande, C., and Tassin, B. (2016). Synthetic fibers in atmospheric fallout: a source of microplastics in the environment? Mar. Pollut. Bull. 104, 290–293. doi: 10.1016/j.marpolbul.2016.01.006
Dris, R., Gasperi, J., and Tassin, B. (2018). “Sources and fate of microplastics in urban areas: a focus on Paris megacity,” in Freshwater Microplastics, eds M. Wagner, and S. Lambert, Vol. 58 (Springer International Publishing), 69–83. doi: 10.1007/978-3-319-61615-5_4
Eerkes-Medrano, D., Thompson, R. C., and Aldridge, D. C. (2015). Microplastics in freshwater systems: a review of the emerging threats, identification of knowledge gaps and prioritisation of research needs. Water Res. 75, 63–82. doi: 10.1016/j.watres.2015.02.012
Eriksen, M. (2014). Plastic Marine Pollution Global Dataset [Data set]. Figshare. doi: 10.6084/M9.FIGSHARE.1015289
Estahbanati, S., and Fahrenfeld, N. L. (2016). Influence of wastewater treatment plant discharges on microplastic concentrations in surface water. Chemosphere 162, 277–284. doi: 10.1016/j.chemosphere.2016.07.083
Forrest, S. A., Holman, L., Murphy, M., and Vermaire, J. C. (2019). Citizen science sampling programs as a technique for monitoring microplastic pollution: results, lessons learned and recommendations for working with volunteers for monitoring plastic pollution in freshwater ecosystems. Environ. Monit. Assess. 191, 172. doi: 10.1007/s10661-019-7297-3
Gasperi, J., Wright, S. L., Dris, R., Collard, F., Mandin, C., Guerrouache, M., et al. (2018). Microplastics in air: are we breathing it in? Curr. Opin. Environ. Sci. Health 1, 1–5. doi: 10.1016/j.coesh.2017.10.002
Geyer, R., Jambeck, J. R., and Law, K. L. (2017). Production, use, and fate of all plastics ever made. Sci. Adv. 3, e1700782. doi: 10.1126/sciadv.1700782
Gies, E. A., LeNoble, J. L., Noël, M., Etemadifar, A., Bishay, F., Hall, E. R., et al. (2018). Retention of microplastics in a major secondary wastewater treatment plant in Vancouver, Canada. Mar. Pollut. Bull. 133, 553–561. doi: 10.1016/j.marpolbul.2018.06.006
Grbić, J., Helm, P., Athey, S., and Rochman, C. M. (2020). Microplastics entering northwestern Lake Ontario are diverse and linked to urban sources. Water Res. 174, 115623. doi: 10.1016/j.watres.2020.115623
Gündogdu, S., Çevik, C., Güzel, E., and Kilercioglu, S. (2018). Microplastics in municipal wastewater treatment plants in Turkey: a comparison of the influent and secondary effluent concentrations. Environ. Monit. Assess. 190, 626. doi: 10.1007/s10661-018-7010-y
Horton, A. A., Svendsen, C., Williams, R. J., Spurgeon, D. J., and Lahive, E. (2017). Large microplastic particles in sediments of tributaries of the River Thames, UK – abundance, sources and methods for effective quantification. Mar. Pollut. Bull. 114, 218–226. doi: 10.1016/j.marpolbul.2016.09.004
Kalpakjian, S., and Schmid, S. R. (2008). Manufacturing Processes for Engineering Materials, 5th Edn. London: Pearson Education.
Kedzierski, M., Villain, J., Falcou-Préfol, M., Kerros, M. E., Henry, M., Pedrotti, M. L., et al. (2019). Microplastics in Mediterranean sea: a protocol to robustly assess contamination characteristics. PLoS ONE 14, e0212088. doi: 10.1371/journal.pone.0212088
Kole, P. J., Löhr, A. J., Van Belleghem, F., and Ragas, A. (2017). Wear and tear of tyres: a stealthy source of microplastics in the environment. Int. J. Environ. Res. Public Health. 14, 1265. doi: 10.3390/ijerph14101265
Lebreton, L. C. M., van der Zwet, J., Damsteeg, J.-W., Slat, B., Andrady, A., and Reisser, J. (2017). River plastic emissions to the world's oceans. Nat. Commun. 8, 15611. doi: 10.1038/ncomms15611
Liu, X., Yuan, W., Di, M., Li, Z., and Wang, J. (2019). Transfer and fate of microplastics during the conventional activated sludge process in one wastewater treatment plant of China. Chem. Eng. J. 362, 176–182. doi: 10.1016/j.cej.2019.01.033
Lusher, A. L., Bråte, I. L. N., Munno, K., Hurley, R. R., and Welden, N. A. (2020). Is it or isn't it: the importance of visual classification in microplastic characterization. Appl. Spectrosc. 74, 1139–1153. doi: 10.1177/0003702820930733
Masura, J., Baker, J., Foster, G., and Arthur, C. (2015). Laboratory Methods for the Analysis of Microplastics in the Marine Environment: Recommendations for Quantifying Synthetic Particles in Waters and Sediments. Silver Spring, MD: NOAA Marine Debris Division, 31. doi: 10.25607/OBP-604
Munno, K., Helm, P. A., Jackson, D. A., Rochman, C., and Sims, A. (2018). Impacts of temperature and selected chemical digestion methods on microplastic particles: impacts of temperature and digestion method on microplastics. Environ. Toxicol. Chem. 37, 91–98. doi: 10.1002/etc.3935
Napper, I. E., Davies, B. F. R., Clifford, H., Elvin, S., Koldewey, H. J., Mayewski, P. A., et al. (2020). Reaching new heights in plastic pollution—preliminary findings of microplastics on Mount Everest. One Earth 3, 621–630. doi: 10.1016/j.oneear.2020.10.020
Nizzetto, L., Futter, M., and Langaas, S. (2016). Are agricultural soils dumps for microplastics of urban origin? Environ. Sci. Technol. 50, 10777–10779. doi: 10.1021/acs.est.6b04140
Olesen, K. B., Stephansen, D. A., van Alst, N., and Vollertsen, J. (2019). Microplastics in a stormwater pond. Water 11, 1466. doi: 10.3390/w11071466
Peng, X., Chen, M., Chen, S., Dasgupta, S., Xu, H., Ta, K., et al. (2018). Microplastics contaminate the deepest part of the world's ocean. Geochem. Perspect. Lett. 9, 1–5. doi: 10.7185/geochemlet.1829
Piñon-Colin, T., de, J., Rodriguez-Jimenez, R., Rogel-Hernandez, E., Alvarez-Andrade, A., and Wakida, F. T. (2020). Microplastics in stormwater runoff in a semiarid region, Tijuana, Mexico. Sci. Total Environ. 704, 135411. doi: 10.1016/j.scitotenv.2019.135411
R Core Team (2020). R: A Language and Environment for Statistical Computing. Vienna: R Foundation for Statistical Computing. Available online at: https://www.R-project.org/
Shaw, D. G., and Day, R. H. (1994). Colour- and form-dependent loss of plastic micro-debris from the North Pacific Ocean. Mar. Pollut. Bull. 28, 39–43. doi: 10.1016/0025-326X(94)90184-8
Skalska, K., Ockelford, A., Ebdon, J. E., and Cundy, A. B. (2020). Riverine microplastics: behaviour, spatio-temporal variability, and recommendations for standardised sampling and monitoring. J. Water Process Eng. 38, 101600. doi: 10.1016/j.jwpe.2020.101600
Uurasjärvi, E., Sainio, E., Setäl,ä, O., Lehtiniemi, M., and Koistinen, A. (2021). Validation of an imaging FTIR spectroscopic method for analyzing microplastics ingestion by Finnish lake fish (Perca fluviatilis and Coregonus albula). Environ. Pollut. 288, 117780. doi: 10.1016/j.envpol.2021.117780
Vermaire, J. C., Pomeroy, C., Herczegh, S. M., Haggart, O., and Murphy, M. (2017). Microplastic abundance and distribution in the open water and sediment of the Ottawa River, Canada, and its tributaries. FACETS 2, 301–314. doi: 10.1139/facets-2016-0070
Wagner, M., Scherer, C., Alvarez-Muñoz, D., Brennholt, N., Bourrain, X., Buchinger, S., et al. (2014). Microplastics in freshwater ecosystems: what we know and what we need to know. Environ. Sci. Europe 26, 12. doi: 10.1186/s12302-014-0012-7
Warrack, S., Challis, J. K., Hanson, M. L., and Rennie, M. D. (2017). Microplastics flowing into lake winnipeg: densities, sources, flux, and fish exposures. Proc. Manitoba's Undergr. Sci. Eng. Res. 3, 5–15. doi: 10.5203/pmuser.201730578
Windsor, F. M., Tilley, R. M., Tyler, C. R., and Ormerod, S. J. (2019). Microplastic ingestion by riverine macroinvertebrates. Sci. Total Environ. 646, 68–74. doi: 10.1016/j.scitotenv.2018.07.271
Woodward, J., Li, J., Rothwell, J., and Hurley, R. (2021). Acute riverine microplastic contamination due to avoidable releases of untreated wastewater. Nat. Sustain. 4, 793–802. doi: 10.1038/s41893-021-00718-2
Zalasiewicz, J., Waters, C. N., Ivar do Sul, J. A., Corcoran, P. L., Barnosky, A. D., Cearreta, A., et al. (2016). The geological cycle of plastics and their use as a stratigraphic indicator of the Anthropocene. Anthropocene 13, 4–17. doi: 10.1016/j.ancene.2016.01.002
Ziajahromi, S., Drapper, D., Hornbuckle, A., Rintoul, L., and Leusch, F. D. L. (2020). Microplastic pollution in a stormwater floating treatment wetland: detection of tyre particles in sediment. Sci. Total Environ. 713, 136356. doi: 10.1016/j.scitotenv.2019.136356
Keywords: microplastics, temporal, combined sewage overflows, stormwater, rivers, freshwater, urban
Citation: Forrest SA, McMahon D, Adams WA and Vermaire JC (2022) Change in microplastic concentration during various temporal events downstream of a combined sewage overflow and in an urban stormwater creek. Front. Water 4:958130. doi: 10.3389/frwa.2022.958130
Received: 31 May 2022; Accepted: 22 July 2022;
Published: 11 August 2022.
Edited by:
Vahid Pilechi, National Research Council Canada (NRC-CNRC), CanadaReviewed by:
Anna Posacka, Ocean Diagnostics Inc., CanadaAbdolmajid Mohammadian, University of Ottawa, Canada
Copyright © 2022 Forrest, McMahon, Adams and Vermaire. This is an open-access article distributed under the terms of the Creative Commons Attribution License (CC BY). The use, distribution or reproduction in other forums is permitted, provided the original author(s) and the copyright owner(s) are credited and that the original publication in this journal is cited, in accordance with accepted academic practice. No use, distribution or reproduction is permitted which does not comply with these terms.
*Correspondence: Shaun A. Forrest, shaun.forrest@carleton.ca