The transformation of Spirals into S0 galaxies in the cluster environment
 Mauro D'Onofrio
 Paola Marziani
 Lucio Buson
- 1Department of Physics and Astronomy, University of Padova, Padova, Italy
- 2National Institute of Astrophysics (INAF), Astrophysical Observatory of Padova, Padova, Italy
We discuss the observational evidences of the morphological transformation of Spirals into S0 galaxies in the cluster environment exploiting two big databases of galaxy clusters: WINGS (0.04 < z < 0.07) and EDisCS (0.4 < z < 0.8). The most important results are: (1) the average number of S0 galaxies in clusters is almost a factor of ~ 3 − 4 larger today than at redshift z ~ 1; (2) the fraction of S0's to Spirals increases on average by a factor ~ 2 every Gyr; (3) the average rate of transformation for Spirals (not considering the infall of new galaxies from the cosmic web) is: ~ 5 Sp → S0's per Gyr and ~ 2 Sp → E's per Gyr; (4) there are evidences that the interstellar gas of Spirals is stripped by an hot intergalactic medium; (5) there are also indirect hints that major/minor merging events have played a role in the transformation of Spiral galaxies. In particular, we show that: (1) the ratio between the number of S0's and Spirals (NS0∕NSp) in the WINGS clusters is correlated with their X-ray luminosity LX; (2) that the brightest and massive S0's are always close to the cluster center; (3) that the mean Sérsic index of S0's is always larger than that of Spirals (and lower than E's) for galaxy stellar masses above 109.5M⊙(4) that the number of E's in clusters cannot be constant; (5) that the largest difference between the mean mass of S0's and E's with respect to Spirals is observed in clusters with low velocity dispersion. Finally, by comparing the properties of the various morphological types for galaxies in clusters and in the field, we find that the most significant effect of the environment is the stripping of the outer galaxy regions, resulting in a systematic difference in effective radius and Sérsic index.
1. Introduction
The morphological class of S0 galaxies has been largely debated since Hubble (1936) supposed their existence in “Realm of the Nebulae,” and Sandage (1961) placed them as transition types in the tuning fork diagram. Spitzer and Baade (1951) first suggested that S0's might originate from Spirals stripped out of gas and that this class of objects could form a dustless sequence that parallels the Sa-Sb-Sc sequence in the Hubble tuning fork. This idea was further developed by van den Bergh (1976) who proposed the class of “anemic Spirals” as intermediate objects between normal S0's and Spirals and discussed at length by Kormendy and Bender (2012).
Historically there are essentially two main views concerning the origin of S0 galaxies: (1) S0's are the end product of the transformation of Spiral galaxies removed of their gas content by means of gravitational or non gravitational forces, or by secular evolution; (2) the S0 class is intrinsic, i.e., formed by objects that differ from Spirals since their formation.
The proponents of the first view found support in the following observational facts: (1) a significant fraction of today's early-type galaxies likely evolved from later-type galaxies at relatively recent cosmic epochs. Hubble Space Telescope (HST) observations revealed that Spirals are proportionally much more common (a factor of ~ 2–3), and S0 galaxies much rarer, in distant than in nearby clusters (see e.g., Dressler et al., 1997; Fasano et al., 2000; Treu et al., 2003; Postman et al., 2005; Smith et al., 2005; Desai et al., 2007); (2) several evidences exist that Spirals are stripped of their HI gas in dense environments (see e.g., Davies and Lewis, 1973; Haynes et al., 1984; Giovanelli and Haynes, 1985; Solanes et al., 2001; Koopmann and Kenney, 2004; Crowl et al., 2005; Chung et al., 2007; Sun et al., 2007; Yagi et al., 2007; Rasmussen et al., 2008; Yoshida et al., 2008; Vollemer et al., 2009; Sivanandam et al., 2010; Smith et al., 2010). Loosing their gas Spiral galaxies rapidly transform into S0's owing to the quenching of their star formation (SF) (see e.g., Boselli and Gavazzi, 2006; Book and Benson, 2010; Fabello et al., 2011; Goncalves et al., 2012; Mendel et al., 2013; Bekki, 2014; Hirschmann et al., 2014; Wu et al., 2014); (3) the specific frequency of globular clusters (GCs) in present day S0's is consistent with the idea that these galaxies are formed when the gas in normal Spirals is removed (Barra et al., 2007); (4) the observed mass-metallicity trends in S0 galaxies are consistent with a merging formation of these galaxies (Chamberlain et al., 2012); (6) the stellar kinematics of S0 galaxies inferred from Planetary Nebulae (PN) appears consistent with those of Spirals, indicating that they could evolve directly from such systems via gas stripping or secular evolution (Cortesi et al., 2011).
On the other side the proponents of the second view claim that: (1) the bulge-to-disk ratios (B∕D) of the two morphological classes are too different for being explained by the simple occurrence of gas stripping (see e.g., Burstein, 1979). If S0's are evolved Spirals, their bulge luminosities must have been physically enhanced (Christlein and Zabludoff, 2004); (2) many edge-on S0's are characterized by thick disks that are absent in the control samples of Spirals; (3) the relation between density and morphology is a weak function of density, so that a significant percentage of S0's are in regions where the density and temperature is too low for a significant stripping of the gas (Dressler, 1980); (4) the large ages and magnesium-to-iron overabundance of the outer disks of nearby S0's contradict the commonly accepted scenario of S0 formation from Spirals by quenching their star formation during infall into dense environments at intermediate redshifts, z = 0.4 − 0.5 (4–5 Gyr ago) (Silchenko et al., 2012); (5) the evolution in the number density of S0's from z = 0.4 − 0.5 to z = 0 is the result of morphological classification errors (Andreon, 1998); (6) neither the median ellipticity, nor the shape of the ellipticity distribution of cluster early-type galaxies evolve with redshift from z ~ 0 to z > 1, i.e., over the last ~ 8 Gyr (Holden et al., 2009), suggesting that the bulge-to-disk ratio distribution for cluster early-type galaxies does not change with time.
The controversy on the S0' origin is not yet settled after more than 70 years! There is however today a wide consensus that more than one process can operate the transformation of Spirals into S0's and that a significant role is played by the environment.
In low density environments the transformation of Spirals into S0's could be the end product of secular evolution. This idea is supported by the fact that many S0's in this environment host pseudo-bulges (Laurikainen et al., 2006; Graham, 2013), i.e., bulges with bulge-to-total luminosity ratios and concentrations typical of late-type spiral galaxies (B∕T < 0.2 and n ~ 1). These bulges often contain embedded disks, inner spiral patterns, nuclear bars, star formation, and present rotational support similar to that of Spiral bulges (see Kormendy and Kennicutt, 2004). These properties are usually attributed to the evolution induced by bars, which send material toward the center of the galaxy, enhancing the bulge component (Pfenniger and Norman, 1990), even if often these bulges do not seem to have the concentrations and sizes of typical S0's bulges (see e.g., Eliche-Moral et al., 2012, 2013). However, Pfenniger and Friedli (1993) found that the buckling instability can lead to vertically thick inner bar components, which are several factors larger than the nuclear star forming structures. They have similar sizes as the boxy/peanut bulges in the S0s (and in other Hubble types) in the edge-on view. Furthermore, secular evolution offers a viable mechanism to produce the thick disk component observed in many edge-on S0's.
In the cluster environment several mechanisms can operate the quenching of SF and start the transition of Spirals toward the S0 class: (1) gas loss triggered by: galactic winds as a consequence of star formation or AGN activity (see e.g., Veilleux et al., 2005; Fogarty et al., 2012; Ho et al., 2014), ram pressure stripping, i.e., the interaction between the interstellar medium (ISM) of the galaxy and the intergalactic medium (IGM) (Gunn and Gott, 1972), strangulation, i.e., the removal of the hot gas halo surrounding the galaxy via ram pressure or tidal stripping by the halo potential (Larson et al., 1980; Balogh et al., 2000), thermal evaporation (Cowie and Songaila, 1977), and turbulent/viscous stripping (Nulsen, 1982). (2) strong tidal interactions and mergers, although more frequent in groups than in clusters (Barnes and Hernquist, 1992; Mazzei et al., 2014a,b), tidal effects from the cluster as a whole (Byrd and Valtonen, 1990), and harassment, i.e., the cumulative effect of several weak and fast tidal encounters (Moore et al., 1996).
Ram pressure is one of the most accredited actors of the transformation of Spirals in clusters. Its importance resides in the fact that only the gaseous component of disk galaxies is affected. The ram pressure exerted by the IGM is a key ingredient for understanding the star formation history (SFH) of galaxies in clusters (see e.g., Bekki, 2014), because temporal and spatial variations of the SF in disks can be produced by ram pressure (see e.g., Koopmann and Kenney, 2004). Observations suggest that the Hα-to-optical disk-size ratio is smaller for Spirals with higher degrees of HI-deficiency (Fossati et al., 2013).
The merging hypothesis is also quite popular and old (see e.g., Biermann and Tinsley, 1975; mechanism defined at that time “collision between galaxies”) and often advocated for explaining the existence of S0 galaxies in low density environments (e.g., groups and field) where the mechanisms typical of clusters are less effective. This possibility found support in the discovery of “Polar Ring S0's,” i.e., lenticular galaxies hosting structures likely due to a second event such as the transfer of mass from a companion galaxy during a close encounter as well as a true merger (Schweizer et al., 1983). Bekki (1997) stressed that a particular orbit configuration could transform two late-type spirals into one S0 galaxy with polar rings (see also Mapelli et al., 2015). A related phenomenology, namely S0's hosting an unexpected gas component counter-rotating or strongly kinematically decoupled with respect to the stellar body of the galaxy, has also been detected (Bertola et al., 1992). Even more, numerical simulations by Bekki (1998) indicate that the major mechanism for the S0 creation is galaxy merging between two spirals with unequal mass; if this is true, unequal-mass galaxy mergers provide the evolutionary link between the large number of blue spirals observed in intermediate-redshift clusters and the red S0's in the present-day ones.
An additional piece of evidence favoring the merging idea comes from the correlation observed in very nearby galaxies between UBV color residuals and the Schweizer's fine-structure Σ index, especially because the detected systematic variations are not limited to the nuclei, but occur globally in the stellar populations of galaxies (Schweizer and Seitzer, 1992). Again with reference to observed colors, the so-called blue E/S0 galaxies studied by Aguerri et al. (2010), i.e., objects having a clear early-type morphology on HST/ACS images but with a blue rest-frame color, do resemble merger remnants probably migrating to the red-sequence in a short time-scale, when their mass is comparable (or higher) than that of the Milky Way. Analogously Prieto et al. (2013) identify several pieces of evidence favoring the same hypothesis i.e., that major mergers have played a dominant role in the definitive buildup of present-day E-S0's with M* > 1011M⊙ at 0.6 < z < 1.2.
At any rate the frequency of other photometric hints indicating a major role of merging events in S0 galaxies formation is still controversial. For instance the claim by Borlaff et al. (2014), who find that—in the context of their N-body simulations—nearly 70% of their S0-like host anti-truncated (Type III) stellar disks does not find support in the observational works by Erwin et al. (2008) as well as by Gutierrez et al. (2011), who at variance conclude that the difference in the fractions of Type-III profiles between early (presumably S0-S0a) and late-type spirals is not statistically significant. in other words, it should not reasonable to conclude that Type-III photometric profiles are a special characteristic of S0's. Maltby et al. (2015) reports for a sample of ~ 280 field and cluster S0's similar fractions of Type profiles in both environments.
On the other side Querejeta et al. (2015a) have shown that major mergers among binary galaxies can rebuild a bulge-disk coupling in the S0 remnants in less than ~ 3 Gyr, after having destroyed the structures of the progenitors, whereas minor mergers directly preserve them. The resulting structural parameters span a wide range of values, and their distribution is consistent with observations. In their simulations many remnants have bulge Sérsic indices ranging 1 < n < 2, flat appearance, and contain residual star formation in embedded discs, a result which agrees with the presence of pseudo-bulges in real S0's. Querejeta et al. (2015b) also find that major mergers can explain the difference in the stellar angular momentum and concentration between Spirals and S0's.
Disentangling the mechanisms at work in the transformation of Spirals into S0 galaxies is not easy even in very nearby objects. For more distant galaxies a combination of efforts are required, both in the sense of increasing the observational data available for galaxies in clusters at different redshifts, and in producing numerical simulations of increasing complexity. With this paper we want to contribute to this effort, discussing the data coming from two clusters surveys, WINGS (WIde field Nearby Galaxy cluster Survey; Fasano et al., 2006) at redshifts 0.04 ≤ z ≤ 0.07 and EDisCS (the ESO Distant Cluster Survey; White et al., 2005) at 0.4 ≤ z ≤ 0.8, that are particularly important for their ample databases. The idea behind this work is that by comparing the mean properties of galaxies of different morphological classes per bin of masses, cluster-centric distance, and redshift, we can find a statistically significant proof for the origin of the S0 class.
We start with Section 2 and its subsections discussing the WINGS and EDisCS data samples used for the present analysis, as well as the characteristics of three additional subsamples that have been used to support our conclusions. In Section 3 we provide the main observational evidences in favor of the hypothesis that Spirals in clusters transform into S0's. In Section 4 we present a detailed analysis of the stacked WINGS and EDisCS data samples discussing their implication for the origin of the S0 class. In Section 5 we discuss the evidences of ram pressure stripping and evaporation, and in Section 6 those of merging. In Section 7 we compare the properties of field and cluster S0's and, finally in Section 8 we present our conclusions.
Throughout the paper we have adopted the following cosmology: H0, = 70 kms − 1 Mpc − 1, ΩM = 0.3 and ΩΛ = 0.7.
2. The Data Samples of Galaxies in Clusters
2.1. WINGS
WINGS is a long-term project dedicated to the characterization of the photometric and spectroscopic properties of galaxies in nearby clusters. The core of the survey is WINGS-OPT (Varela et al., 2009), which is a set of B and V-band images of a complete, X-ray selected sample of 77 clusters with redshift 0.04 < z < 0.07. The images have been taken with the Wide Field Camera (WFC, 34′ × 34′) at the INT-2.5 m telescope in La Palma (Canary Islands, Spain) and with the Wide Field Imager (WFI, 34′ × 33′) at the MPG/ESO 2.2 m telescope in La Silla (Chile). The optical photometric catalogs have been obtained using SExtractor and are 90% complete at V ~ 21.7, which translates into M*V + 6 at the mean redshift of the survey (Varela et al., 2009). The WINGS-OPT catalogs contain ~ 400,000 galaxies in both the V- and B-band. According to (Varela et al., 2009, Table D.2), in the whole cluster sample the surface brightness limits at 1.5σbkg (σbkg is the standard deviation per pixel of the background) span the ranges 24.7÷26.1 (average value: 25.71) in the V-band and 25.4÷26.9 (average value: 26.39) in the B-band. SExtractorcatalogs have also been obtained for the near-infrared follow-up of the survey (WINGS-NIR; Valentinuzzi et al., 2009), which consists of J- and K-band imaging of a subsample of 28 clusters of the WINGS-OPT sample, taken with the WFCAM camera at the UKIRT telescope. Each mosaic image covers ≈ 0.79deg2. With the SExtractor analysis the 90% detection rate limit for galaxies is reached at J = 20.5 and K = 19.4. The WINGS-NIR catalogs contain ~ 490,000 in the K-band and ~ 260,000 galaxies in the J-band. The photometric depth of the WINGS-NIR imaging is slightly worse than that of the WINGS-OPT imaging. Thus, for the K-band the surface brightness limit at 1.5σbkg spans the range 20.6÷21.5 (see Table 4 in Valentinuzzi et al., 2009, average value: 21.15). The U-band photometry has been realized up to now for a subsample (17 clusters) of galaxies of the WINGS-OPT sample (WINGS-UV; Omizzolo et al., 2014), but new u band imaging of the WINGS clusters have been recently acquired at the VST telescope within OMEGAWINGS project, that is an extention of WINGS. The area covered is ~ 1 square degree and allows to reach up to 2.5 cluster virial radii. OMEGAWINGS is based on two OmegaCAM@VST GTO programs for 46 WINGS clusters. The B and V campaigns of observations are already completed, while the u-band programme is still ongoing. The B and V data of OMEGAWINGS are presented in Gullieuszik et al. (in press).
In addition to the aperture photometry catalogs, the WINGS database includes the surface photometry catalogs realized with GASPHOT (D'Onofrio et al., 2014). This automatic software provided for each galaxy and each band (with an area larger than 200 pixels) the total luminosity, the effective radius Re, the effective surface brightness 〈μ〉e, the Sersic index n, and the minor to major axis ratio b∕a. In addition the automatic tool MORPHOT (Fasano et al., 2012) produced the accurate morphological classification T of ~ 40,000 galaxies. For more information about the WINGS database see Moretti et al. (2014).
The medium-resolution multifiber spectroscopy of 48 clusters is another valuable property of the WINGS database (WINGS-SPE; Cava et al., 2009). Redshifts and membership were measured (see for details, Cava et al., 2009), as well as star formation histories, stellar masses, ages (see for details, Fritz et al., 2007, 2011), equivalent widths, and line-indices (Fritz et al., 2014) for ~ 6000 galaxies. Within OMEGAWINGS new spectra have been obtained with AAOmega@AAT using the OmegaCAM fields. So far, we have secured high quality spectra for ~ 30 OMEGAWINGS clusters, reaching very high spectroscopic completeness levels for galaxies brighter than V = 20 from the cluster cores to their periphery (Moretti et al. in preparation).
2.2. The WINGS Stacked Sample
Using all the galaxies members of the 48 WINGS clusters with available spectroscopy1 we have built a stacked sample aiming at increasing the statistical significance of the results obtained for the different morphological classes.
We extracted from the WINGS database the following data: the identification name (ID), the cluster name, the redshift (z), the scale of the images (kpc/arcsec), the value of R2002 in Mpc obtained for the cluster, the morphological type (T), the luminosity distance (Dlum), the equatorial coordinates of the galaxies (RA and DEC), the B and V GASPHOT total magnitudes, the circularized effective radius (Rce) in kpc unit, the mean effective surface brightness (〈μ〉e) in mag. arcsec − 2, the distance from the brightest cluster member (DBCG) in R200 unit, the star formation rate in the last 2 × 10⁷ Myr (SFR[M⊙yr − 1]), the axis ratio in the V-band (b∕a), the total stellar mass (M*[⊙]), the luminosity weighted age (wAge[yr]), the local density (LD), the galactic extinction in the B- and V-bands, the Sérsic index (n) in the V-band, and the average B − V color.
In total we got 2869 galaxies members of the clusters from a total number of objects of the spectroscopic catalog of ~ 6000 galaxies. According to their morphological classification we have 803 Elliptical galaxies (T < − 5), 1347 S0 galaxies (− 4.5 < T < 0), and 719 (T > 0) Spiral galaxies. They span an interval of masses from ~ 108 to ~ 1012 M⊙, and an interval of distances from the center from 0 to ~ 1 R200.
The stacked WINGS sample is aimed at creating a “pseudo-cluster” having the mean properties of our clusters, but with many more objects at each distance DBCG∕R200 from the center. This is possible because the WINGS clusters share well defined properties in terms e.g., of X-ray luminosities, velocity dispersions, dimensions, richness, ages, etc. This homogeneity of properties is also accompanied by a set of homogeneous observations and data reductions, so that the final sample is very robust from a statistical point of view. We can say that this pseudo-cluster provides us the mean properties of the WINGS clusters and its variance. This stacked sample permits the analysis of the mean properties of the morphological classes as a function of mass and distance from the cluster center.
The completeness of this data sample is the same of our spectroscopic sample. This is defined by the ratio of the number of spectra yielding the redshift to the total number of galaxies in the photometric catalog. Cava et al. (2009) found that this sample is ~ 50% complete at V ~ 18 mag. This corresponds to MV ~ − 19 mag. and log(M*∕M⊙) ~ 10. The spectroscopic completeness rapidly decreases below V ~ 19 mag. The completeness turns out to be rather flat with magnitude for most clusters, and it is essentially independent from the distance to the cluster center up to ~ 0.6R200.
Figure 1 shows the distribution of the galaxy stellar masses, of the cluster-centric distance from the BCG normalized to R200, and of the absolute magnitudes for the different morphological types. Note that the histograms of the masses and luminosities remain flat up to log(M*∕M⊙) ~ 9.5 and MV ~ − 18 mag., respectively. There are also no reasons to believe that the morphological fraction (i.e., the ratios among E-S0-Sp types) drastically change when the completeness decreases, and that the survey has systematically lost galaxies of a given morphological type in the explored interval of cluster-centric distances 0 ≤ DBCG ∕ R200 ≤ 0.6. We are therefore confident that up to these values of masses and luminosities the WINGS stacked sample is reasonably statistically robust.
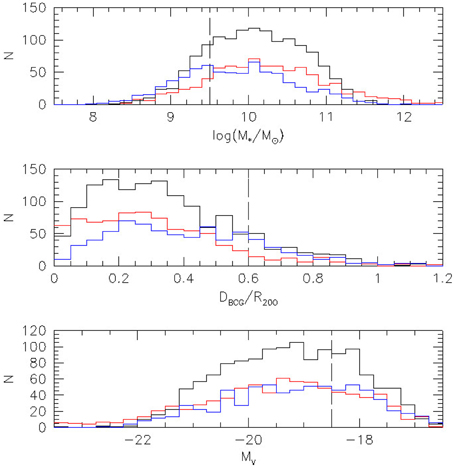
Figure 1. From top to bottom we plot here the distribution of the galaxy stellar masses, the cluster-centric distance in R200 units and the absolute magnitudes of the galaxies for the different morphological types: red lines mark the Elliptical galaxies, black lines the S0 galaxies, and blue lines Spirals. The vertical dashed black lines mark the limit where the WINGS data sample is ~ 50% complete.
Figure 2 plots the distributions of R200, σcl (the central velocity dispersion of the cluster), log(LX) (the X-ray luminosity of the cluster), and Mcl (the dynamical mass of the clusters) for the WINGS clusters that belong to the stacked sample. The values for the Coma clusters are indicated by the dashed lines as a reference. These data are useful to better figure out the observed range of properties of the stacked cluster sample. Clusters of quite different properties have been averaged together.
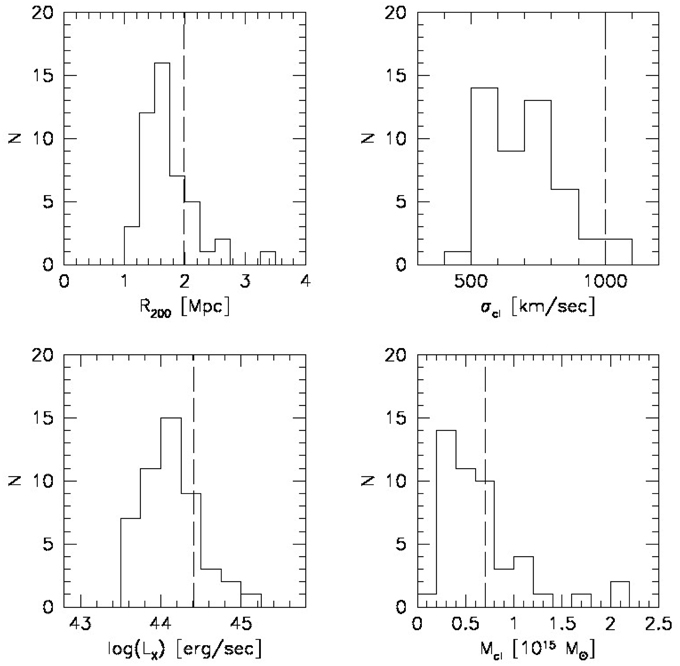
Figure 2. From top left to bottom right we plot here the observed distributions of R200, σcl, log(LX), and Mcl for the WINGS clusters that belong to the stacked sample. The dashed line mark the values for the Coma cluster.
2.3. Additional Subsamples Used in this Work
Three smaller subsamples have been used in this work for testing some of our hypotheses. The first one contains the measured Lick indexes for 2241 WINGS galaxies in common with our stacked sample. The Lick indexes were measured by Alexander Hansson in his Ph.D. thesis following the prescriptions of Worthey et al. (1994). These data are still unpublished. The second subsample contains the bulge-to-disk decomposition of thousand of galaxies (but only 877 in common with our stacked sample) measured by Ruben Sanchez-Janssen in his Ph.D. thesis. All galaxies were 2D decomposed with a Sérsic bulge and an exponential disk component. These data are also still unpublished. The third subsample include 1579 galaxies with redshift z ≤ 0.1 extracted from the B-band PM2GC survey (see Calvi et al., 2011, 2012, for more details). These galaxies belong to low density environments and have been used to compare the properties of the different morphological classes in clusters and in the field. These galaxies have been analyzed adopting the same softwares (e.g., GASPHOT and MORPHOT) and procedures used in the data reduction of the WINGS data, so that there is a high level of homogeneity between the two databases. Clearly, all these subsamples are not complete from a statistical point of view, in particular for faint galaxies, but still they provide significant indications of the mean trends of the measured structural parameters. We will explicitly mention the use of these subsamples when they are used.
2.4. The High-z EDisCS Stacked Sample
The properties of the EDisCS data survey (White et al., 2005) have been extensively analyzed in various papers (see e.g., Vulcani et al., 2011b). This multiwavelength photometric and spectroscopic survey includes several clusters at 0.4 < z < 1. The galaxy photometric redshifts were determined by using both optical and IR imaging (Pellò et al., 2009), the morphologies were derived by Desai et al. (2007), and the photometric parameters (radii, total magnitudes, colors, etc.) were extracted using SExtractor by White et al. (2005).
For the comparison with WINGS we used the mass-limited sample at M* = 1010.2 M⊙ derived by Vulcani et al. (2011b), consisting of 489 galaxies, 156 of which are classified as Es, 64 as S0s, 252 as Spiral galaxies and 17 with unknown morphology. The values of R200 and the distance of the galaxies from the BCG were derived by Poggianti et al. (2006, 2008). The values of the galaxy stellar masses (still unpublished) were kindly provided by B. Vulcani: they are calculated using the Kroupa (2001) IMF in the mass range 0.1 − 100M⊙ following Bell and de Jong (2001).
As for WINGS, the EDisCS data were also stacked together at increasing distance from the BCGs with the aim of providing a more robust statistical comparison between high-z and low-z clusters.
3. Observational Elements in Favor of the Transformation of Spirals into S0's
Here we present the main observational evidences in favor of the hypothesis that Spirals transform themselves into S0's in clusters.
Figure 3 shows the fraction of S0/E, S0/Sp, and E/Sp for all the clusters observed up to z ~ 0.8, coming from the WINGS and EDisCS databases, as well as from literature data for the intermediate redshift (0.1 < z < 0.55) clusters studied by Fasano et al. (2000) and Dressler et al. (1997).
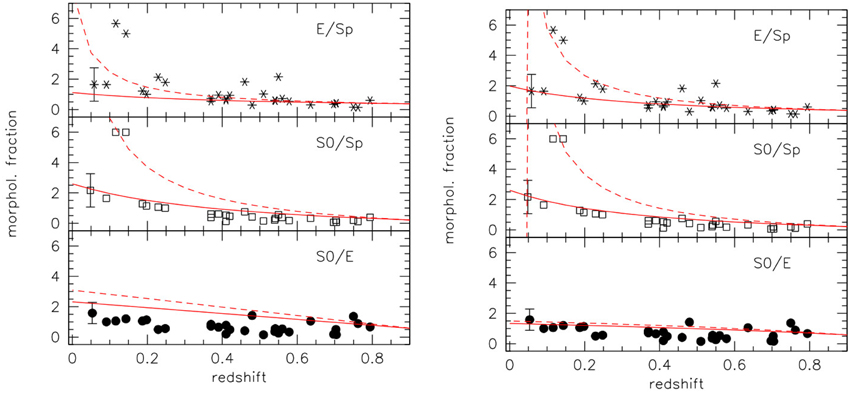
Figure 3. Trend of the morphological fractions (E/Sp, S0/Sp, and S0/E) with redshift in various clusters. The WINGS stacked sample is shown with its 1σ error bar. The plotted lines mark the evolution of the morphological fractions for a hypothetical cluster that at high redshift has the mean morphological fractions of the EDisCS sample. Spirals transform into S0's and E's at different rates per interval of redshift. Left: The solid lines mark the trend obtained for a rate of transformation of 6.25 Sp → S0's per Gyr and 0 Sp → E's per Gyr. The dashed lines instead are for a rate of 9 Sp → S0's per Gyr and 0 Sp → E's per Gyr. Right: The same plot, but with the following transformation rates: 5 Sp → S0's per Gyr and 1.75 Sp → E's per Gyr for the solid lines, and 7 Sp → S0's per Gyr and 1 Sp → E's per Gyr for the dashed lines.
In their comparative analysis of the morphological fractions of clusters at low and high redshift Fasano et al. (2000) already claimed the existence of a general trend in the morphological fractions (%E's, %S0's, %Sp's) and in the S0/E and S0/Sp ratios with redshift, clearly suggesting that the S0 population tends to grow at the expense of Spirals, whereas the frequency of E's remains almost constant.
In Figure 3 the WINGS clusters are represented by one single point marking the average value found for our stacked clusters sample and its variance. There are several things that are worth noting in this figure: (1) the S0/E ratio (bottom panel) is almost constant with redshift with a significant variance; (2) the variance of the WINGS stacked sample is of the same order of the spread observed among clusters at all redshifts in all panels; (3) the S0/Sp ratio (mid panel) slightly increases at lower redshifts (z < 0.3). This fraction follows the S0/E ratio but with a smaller dispersion up to z ~ 0.15, where a strong peak is observed for two clusters A389 and A951; (4) the E/Sp fraction follows the same trend of the S0/Sp ratio, but with a bigger dispersion at all redshifts. Again a peak is observed at z ~ 0.15 for the same clusters; (5) the S0 population dominate at z ≤ 0.1. Depending on the cluster we can have a factor of ~ 3 − 4 more S0's than Spirals; (6) at redshift around 0.1 and below the number of Spirals observed is very small.
The spread observed in the morphological fractions can be explained remembering that: (a) clusters have different structures and are more or less virialized/concentrated (Oemler, 1974); (b) Spirals galaxies, that are the dominant population in the field, continuously enter into clusters from the cosmic-web filaments; (c) there are possible errors in the classification of galaxies.
The general impression coming from these data is that the effects of the morphological transformation become visible at redshift lower than ~ 0.3, where a significant increase of the E/Sp and S0/Sp ratios are observed. Despite the spread, the data seem to suggest an evolution with redshift of the morphological fractions. If we trust in these data (i.e., that no systematic biases are present, e.g., in the morphological classification and in the surveyed area3), we must conclude from Figure 3 that there is an active mechanism transforming Spirals into S0 objects (and possibly into E's). In fact, the ratios S0/Sp and E/Sp seem to increase with approximately the same gradients, although with quite different dispersion.
The lines shown in Figure 3 follow the hypothetical evolution of a cluster containing 26 E's, 15 S0's, and 68 Spirals at redshift 0.9 (these values represent the average observed frequencies of morphological types in EDisCS). They mark the results of a simple calculation in which Spirals are transformed instantaneously into S0's and E's with different rates per interval of redshift. In the left panel the solid lines mark the transformation rates of 6.25 Sp → S0 per Gyr and 0 Sp → E per Gyr, while the dashed lines mark the rates of 9 Sp → S0 per Gyr and 0 Sp → E per Gyr. In the right panel we have instead for the solid lines 5.0 Sp → S0 per Gyr and 1.75 Sp → E per Gyr, while for the dashed lines 7 Sp → S0 per Gyr and 2.5 Sp → E per Gyr. These rates were chosen to fit the general trends observed and to demonstrate that we can in principle follow the evolution of the morphological fraction of any cluster across time. The observed trends demonstrate that an evolution of the morphological classes is necessary to explain the data. Our calculation however does not take into account the infall, i.e., the fact that new Spirals enter the clusters across the cosmic time. Therefore, the rates calculated here should be considered lower limits.
Note that if we do not consider the transformation of Spirals into E's, we could not reproduce the mean trend of the S0/E fraction: both the low (solid line) and high (dashed line) rates of Spiral transformation into S0's chosen in the left panel, in which the number of E's remains constant, are not able to fit the mean WINGS point giving the S0/E fraction. On the other hand, when the transformation into E's is properly taken into account (see the right panel), we can reproduce both the mean trend of all morphological fractions and the peaks in the E/Sp and S0/Sp ratios4 as well as the nearly constant S0/E ratio observed for all clusters. In other word, or new E's enter systematically in the clusters or new E's must be formed through major merging of Spirals.
Figure 4 shows the log of the NS0∕NSp ratio vs. the log of the redshift z. The least square fit is highly significant and demonstrate that the actual data can be interpreted in term of a temporal evolution of the morphological fraction, in the sense that S0 galaxies continuously increase in number with respect to Spirals. Transforming z in age of the Universe with a linear approximation in the redshift range 0 − 1, we see that the fraction NS0∕NSp increases by a factor of ~ 2 every Gyr.
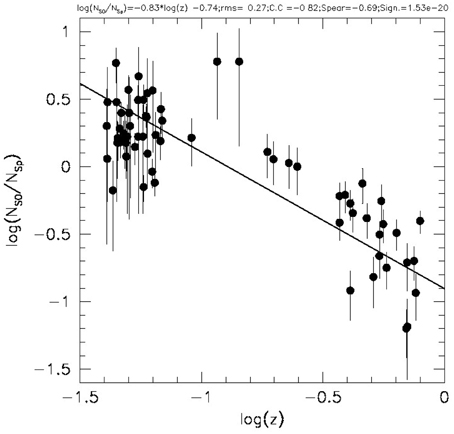
Figure 4. The log of the NS0∕NSp ratio vs. the log of the redshift z. The solid line gives the best fit. Poissonian error bars mark the 1σ uncertainty of the observed counts.
In conclusion, if our interpretation of Figures 3, 4 are correct, Spirals transform into S0's and into E's with a slightly different rate. Vulcani et al. (2011b), working on the same data for both surveys, arrived to the same conclusion with their analysis of the morphological fractions and mass functions.
Figure 5 provides us another hint in favor of the morphological evolution. It shows that S0's and Spirals are not spatially distributed in the same way in clusters at low and high redshifts. The figure clearly demonstrates that in the WINGS clusters S0's dominate the central region of the clusters (DBCG∕R200 < 0.4), while Spirals in EDisCS are more frequent and abundant in the outer regions DBCG∕R200 > 0.4. This fact, which reminds the morphology-density relation, is also consistent with the idea that Spirals transform into S0's during their progressive infall toward the cluster central region.
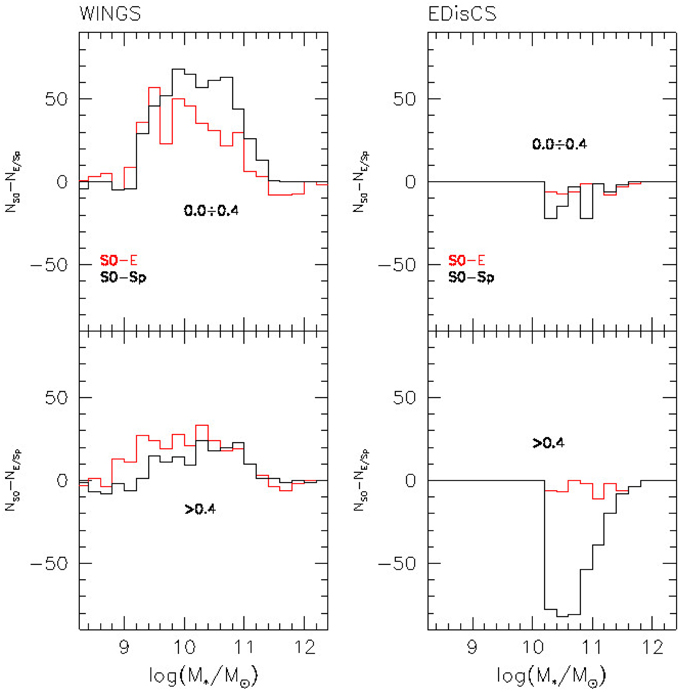
Figure 5. The left panels plot with a black line the difference between the number of S0's and Spirals in the WINGS data sample for DBCG∕R200 < 0.4 (upper panel) and DBCG∕R200 > 0.4 lower panel in each bin of galaxy mass. The right panels show the same difference for the EDisCS data sample. The red lines mark the same distributions for the difference between the number of S0's and E's.
4. Dissecting the Properties of the Stacked Cluster Samples
In this section we analyze in detail the properties of the different morphological types as a function of mass and distance from the cluster center. The idea is that we can deduce from the observed differences of present day objects the mean path of the morphological transformation. In other words we can in principle establish which is the mean variation between two morphological classes.
Figure 6 shows the results of our analysis for the WINGS stacked cluster sample. From top left to bottom right we have plotted here the following quantities derived for the different morphological types T in various bins of DBCG∕R200: the star formation rate (SFR), the log of the circularized effective radius (log(Rce[kpc])), the mean effective surface brightness (), the log Sérsic index (log(n)), the log of the luminosity weighted age (log(wAge[yr])), the log total mass (log(M*∕M⊙)), the B − V color, and the axis ratio (b∕a). Red, black and blue circles mark the mean value of each quantity in each bin of distance, respectively for E's, S0's and Spirals. We decided to plot with colored strips the error of the mean , where σ is the standard deviation in the bin and N is the number of points, instead of the semi-interquartile in order to better highlight the mean differences among the various morphological classes. The width of the semi-interquartile is in fact ~ 3 times larger, so that in some cases the three morphological types share exactly the same parameter. In each diagram E's, S0's and Spirals are largely superposed, but the mean value for each population is clearly distinguishable.
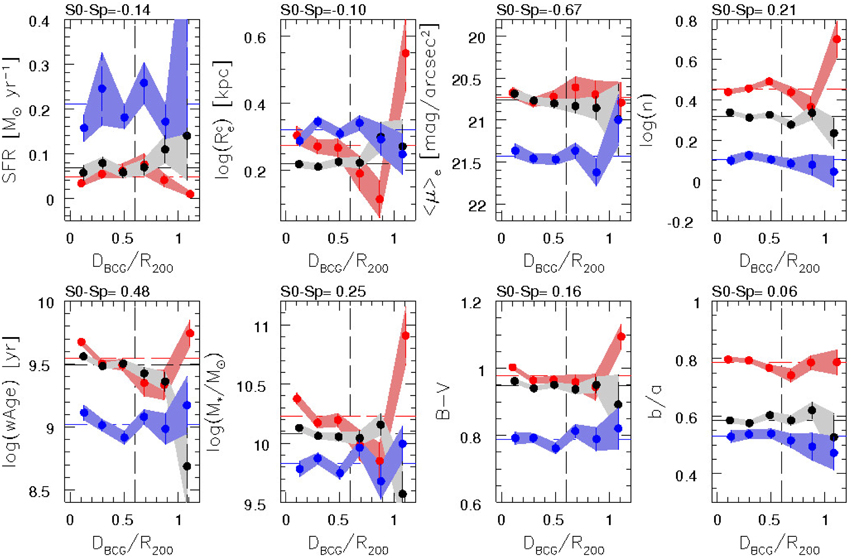
Figure 6. From top left to bottom right we plot here vs. the cluster-centric distance in R200 units the following average quantities derived for the different morphological types in various bins of DBCG∕R200: the star formation rate (SFR), the log of the circularized effective radius (log(Rce[kpc]), the mean effective surface brightness (〈μ〉e), the log Sersic index (log(n)), the log of the luminosity weighted age (log(wAge)), the log total mass (log(M⊙), the B − V color, and the axis ratio (b∕a). Red dots mark the Elliptical galaxies, black dots the S0 galaxies, and blue dots Spirals. The horizontal dashed lines provide the average value of the morphological classes, while the colored strips mark the width of the error of the mean. The vertical dashed lines mark the limits where the stacked sample is ~ 50% complete. On the top of each diagram we report the mean difference between the S0 and Spiral population.
Apart from the clear separation between S0's and Spirals in each plot, and the general similarity of S0's with E's rather than with Spirals (with the notable exception of the Sérsic index n), there are two things that are worth noting in this figure. First, S0's masses are on average almost a factor of ~ 2 larger than Spiral masses up to ~ 0.6R200; second, S0's are ~ 25% smaller in their effective radius than Spirals within the same interval of cluster-centric distance.
Figure 7 shows a different view of the same WINGS data. This time we averaged the same quantities per bin of galaxy mass. The same color code marks again the three families of morphological types. Note that again S0's are very similar to E's in each plot, and that at every galaxy mass E's are systematically closer to the cluster center than S0's and Spirals. This is a manifestation of the morphology-density relation (Dressler, 1980). Furthermore, S0's are at each mass on average ~ 25% smaller than Spirals, as seen before. Note that if we restrict the sample to a given threshold, e.g., in total mass, we observe that the average values shown in each plot slightly vary, but the relative differences among the various morphological classes poorly depend on the adopted cut-off level. This suggests that the result is statistically quite robust and not strongly related to the completeness of the data sample.
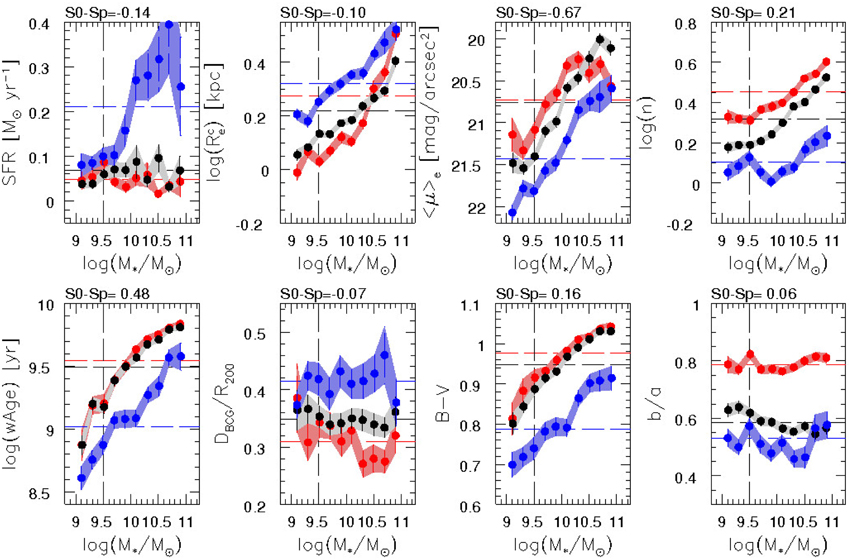
Figure 7. From top left to bottom right we plot here vs. the log mass of the galaxies in solar units the following average quantities derived for the different morphological types in various bins of DBCG∕R200: the star formation rate (SFR), the log of the circularized effective radius (log(Rce[kpc]), the mean effective surface brightness in R200 units (〈μ〉e), the log Sersic index (log(n)), the log of the luminosity weighted age (log(wAge)), the distance from the BCG in (DBCG∕R200), the B − V color, and the axis ratio (b∕a). Color codes as in Figure 1. The horizontal dashed lines provide the average value of the morphological classes, while the colored strips mark the width of the error of the mean. The vertical dashed lines mark the limits where the stacked sample is ~ 50% complete. On the top of each diagram we report the mean difference between the S0 and Spiral population.
To test the statistical robustness of this result we carried out a bootstrap resampling (Efron and Tibshirani, 1993) aiming at measuring the significance of the difference in the mean mass values for galaxies of morphological type S0 and Sp. The bootstrap analysis confirms that the difference between average M* of S0 and Sp is highly significant. Only in ≈ 1% of 104 bootstrapped samples the difference between S0 and Sp M* averages is significant at a confidence level lower than 2σ. The two samples are different also according to a Kolmogorov–Smirov test carried out on each bootstrapped sample: again only ≈ 1% of the bootstrapped samples show Kolmogorov–Smirov's D that implies a significance lower than 2σ. This result is valid even if a restriction to the cluster-centric distance r < 0.2R200 is applied. It is stronger if r < 0.6R200 because of a larger original sample size. It is also valid if the initial mass of the SSP at age zero, or the mass in a nuclear- burning phase of (as defined following Fritz et al., 2011) are considered. An additional confirmation is offered by the mass computed from surface photometry Mph, following Bell and de Jong (2001). In this case there are significant differences with M*, which for the full WINGS S0 sample follow a law δ logM = log M* − logMph ≈ − 4.03 + 0.688 log M* − (0.0296 log M*)2, yielding a δlogM ≈ − 0.25 at logM* ≈ 9. A similar effect is also seen for E and Sp galaxies, and remains present if restrictions to r < 0.2R200 and r < 0.6R200 are applied. Nonetheless, a bootstrap applied to Mph confirms the same difference and the levels of significance as for M*.
The differential distribution of the masses for the three morphological types in the different bins of cluster-centric distance clearly indicate that the higher masses (> 1011M⊙) are almost exclusively S0's and E's in the 0 − 0.2 DBCG∕R200 bin. In the 0 − 0.2 interval of DBCG∕R200 we count 259 E's, 395 S0's and 135 spirals, so the statistics here is quite robust. At larger distances the number of galaxies of different morphologies become approximately equal, but the number of E's rapidly decreases. Then, in the last bin at 0.8 − 1.0 DBCG∕R200, the lack of spatial completeness of the spectroscopic survey starts to be severe, so we cannot trust very much on the observed distribution.
Figures 8, 9 show how the fractions NS0∕NSp and NS0∕NE vary as a function of different variables in various bins of cluster-centric distance. We see that there are ~ 50 times more S0's than Spirals with mass > 1011 M⊙ and up to ~ 20 times more S0's than E's of low masses in the first bin. The ratio NS0∕NE increases at low masses, but this result is more uncertain being our sample less complete below logM*∕M⊙ ≤ 9.5. In Figure 8 the distribution of the effective radii Re looks bimodal for the S0s/Sp ratio, indicating that many of these galaxies are massive, but likely of small dimension, i.e., quite dense objects, as revealed by their higher surface brightness. They are probably bulge-dominated objects. It is interesting to note the distributions of the Sérsic index, of the luminosity weighted age, of the B − V color, and of the mean effective surface brightness. All these structural and photometric parameters indicate that in the 0 − 0.2 interval of DBCG∕R200 there is a well defined population of S0's with n-values larger than those of Spirals and lower than those of E's, preferentially older than Spirals, but younger than E's, redder than Spirals but bluer than E's, with a higher surface brightness with respect to Spirals, but similar to E's in all the bins. We also observe that the S0's with small radii have also low n-values, young ages, blue colors and SFRs similar to Spirals. Going at larger cluster-centric distances we instead see a clear trend toward NS0∕NSp ~ 1 and NS0∕NE ~ 1 in almost all diagrams with the obvious exception of the surface brightness and the axis ratios. The general impression is that all the galaxies closer to the cluster center are systematically different from the others. This fit with the idea of a progressive build up of the cluster, where the most processed objects (red and dead) are the first entered in the cluster core, while those in the outer parts are still in a phase of rapid transformation showing traces of residual activity.
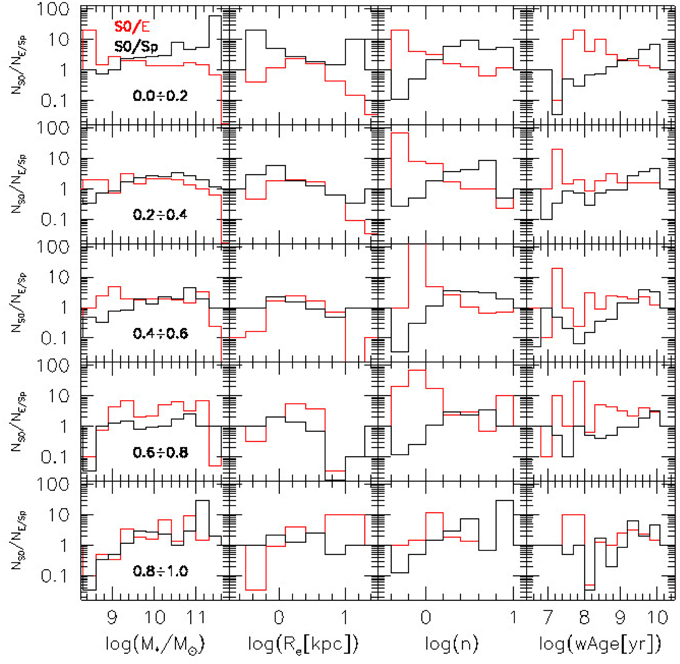
Figure 8. From left to right: the log of the total galaxy mass (log(M⊙), the circularized effective radius (log(Rce[kpc]), the log Sersic index (log(n)), and the log of the luminosity weighted age (log(wAge)). The y-axis shows the ratios between the number of S0's and Spirals (black line) and the number of S0's and E's (red line) in five different ranges of distances DBCG∕R200 (0–0.2, 0.2–0.4, 0.4–0.6, 0.6–0.8, and 0.8–1.0).
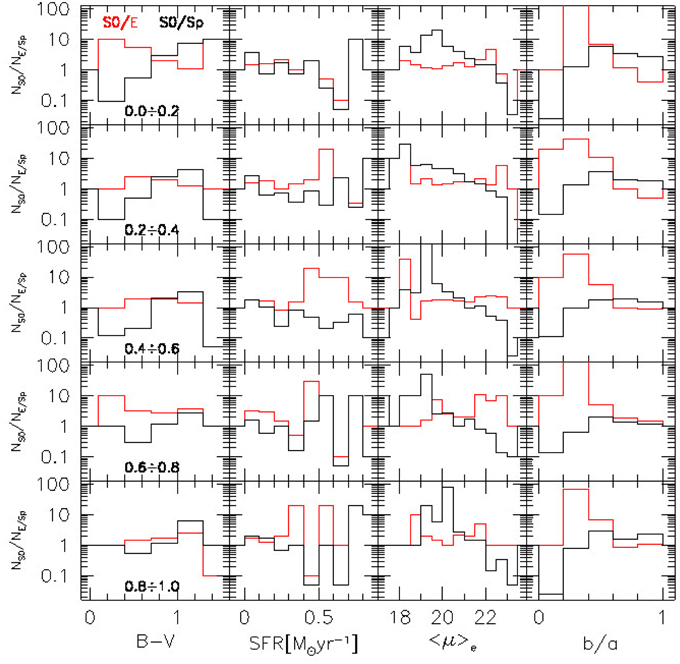
Figure 9. From left to right: the B − V color, the star formation rate (SFR), the mean effective surface brightness (〈μ〉e), and the b∕a ratio. As in the previous figure the y-axis gives the ratio between the number of S0's and Spirals (black line), and S0's and E's (red line).
Looking at the above figures we must conclude that the effects of galaxy transformation should determine the following changes in the past Spirals (now S0's) with respect to present day Spirals: (1) the mean age, mass and color, (2) the concentration of the light profile so that smaller effective radii and larger surface brightness are measured, (3) the shape of the light profile so that the Sérsic index increases, (4) progressive cut-off of the SFR. We will discuss these possibilities in Section 7.
Figures 10, 11 present the behavior of the EDisCS galaxies in various bins of cluster-centric distance and galaxy mass as we did in Figures 6, 7, respectively for the WINGS data. These plots have been obtained in the same way by stacking the EDisCS data as we did for the WINGS sample. Here again the underlying hypothesis is that the properties of the clusters at high redshifts are quite homogeneous and the effects of galaxy evolution not too heavy to change systematically the properties of galaxies in the redshift interval considered. Unfortunately the EDisCS data have not the same degree of accuracy and quality, therefore they are used here only for a qualitative comparison with WINGS.
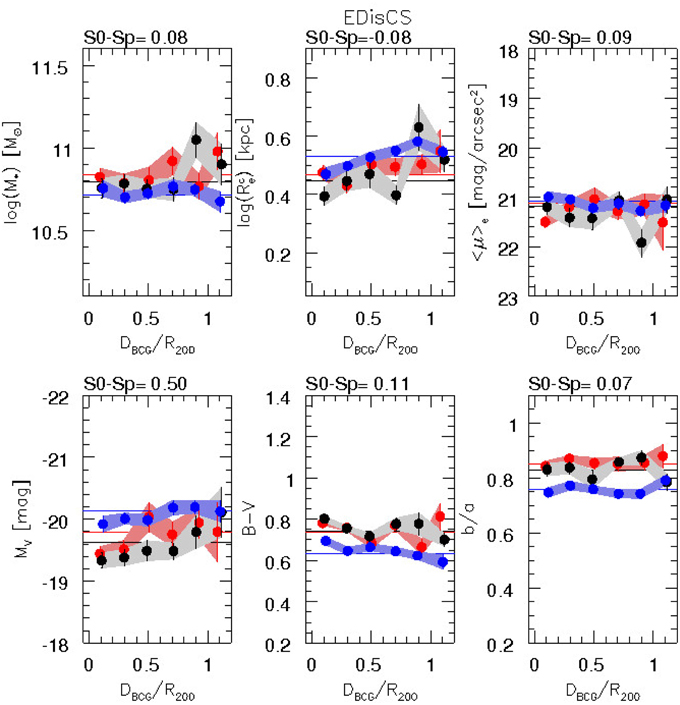
Figure 10. The trend of the measured parameters for the EDisCS sample as a function of the cluster-centric distance.
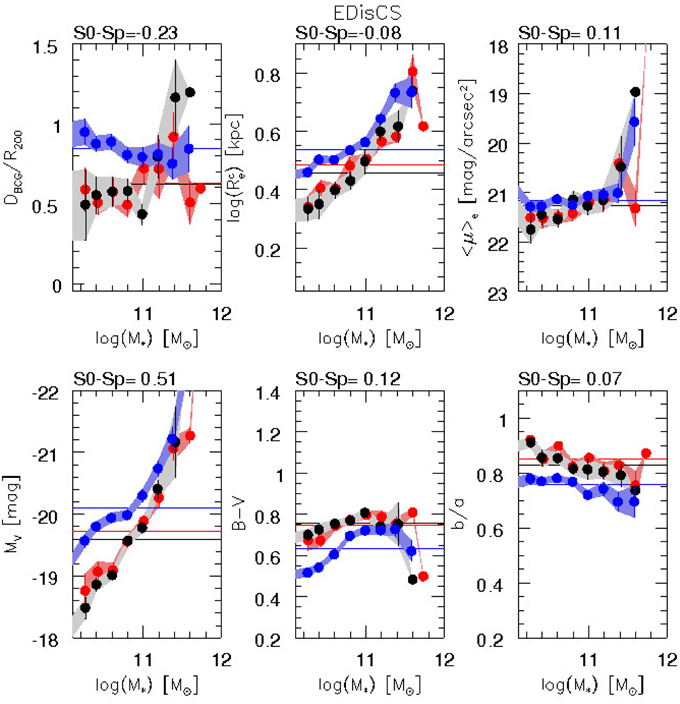
Figure 11. The same trends as a function of galaxy masses.
With respect to WINGS (limited to the same interval of galaxy masses) we note the following behavior at each cluster-centric distance : (1) the masses of S0's and Spirals are nearly equivalent (the mean difference being lower than 0.1 dex for both samples); (2) Spirals are still systematically larger than S0's in both samples (S0 − Sp = − 0.08 in EDisCS and S0 − Sp = − 0.14 in WINGS). This result however is biased by the fact that the EDisCS effective radii are not deconvolved for the seeing point spread function; (3) in WINGS there is a mean systematic difference in the mean surface brightness of S0's and Spirals of ~ 0.58, while it is only ~ 0.1 in EDisCS. Again this result is a direct consequence of the measured effective radii; (4) Spirals are systematically brighter than S0's in EDisCS of ~ 0.5 mag., while the difference decreases to ~ 0.2 in WINGS; (5) the difference in the mean B − V color is nearly equivalent (~ 0.1 mag.), while the EDisCS sample is systematically bluer as expected on the basis of their redshift, (6) there is a substantial difference in the mean flattening of Spirals and S0's that we believe could be connected to the difficulty of detecting and classifying nearly edge-on objects at high redshift.
Notably in each bin of galaxy mass the cluster-centric distance of Spirals with respect to S0's and E's is much higher (S0 − Sp = − 0.23 in EDisCS and S0 − Sp = − 0.07 in WINGS). Spirals are also systematically brighter than S0's up to ~ 1011 M⊙ in EDisCS (S0 − Sp = 0.51 vs 0.16 in WINGS).
The general impression from these figures is that even at high redshifts the population of S0 galaxies is already quite different from that of Spirals. Once the effects of passive evolution are taken into account, we can say that the Spirals and S0's at high redshift are quite similar to those observed today, apart from their relative frequency. This means that, either it exists a population of primordial S0's, or the transformation of Spirals into S0's was active since the first epoch of cluster formation. Furthermore, if a transformation has occurred it should have been quite rapid, probably not longer than ~ 1–3 Gyr, because we are not able to detect a class of objects with mixed properties between Spirals and S0's in both surveys. See discussion in Section 7.
5. Observational Evidences Supporting the Gas Stripping by a Hot Medium
Ram pressure stripping is one of the physical mechanisms invoked to explain the fast transformation of Spirals into red passive galaxies similar to many S0's. Direct evidences that this phenomenon is currently active in the WINGS clusters have been presented by Poggianti et al. (2015). They have identified 241 possible Jellyfish galaxies that exhibit material outside the main body of the galaxies, suggesting a phenomenon of gas stripping.
Another observational fact suggesting that Spirals are affected by hot IGM interaction comes from Figure 12 that shows the relationship between the X-ray luminosities (in log units) of the WINGS clusters and their morphological fractions S0/Sp and E/Sp. Here we have taken into account only those WINGS clusters with a robust number of detected morphological types (38 clusters). We have excluded those clusters with less robust statistics in which the number of Spirals members is ≤ 2. The figure clearly indicates that a significant degree of correlation is observed in particular for the S0/Sp fraction. The most luminous X-ray clusters have preferentially a larger S0/Sp (and possibly E/Sp) fraction. This is a clear hint that in the hotter IGM the stripping of gas and consequently the morphological transformation of Spirals is more efficient. The gas is stripped by the hot IGM when Spirals enter the cluster environment and start orbiting around the cluster center.
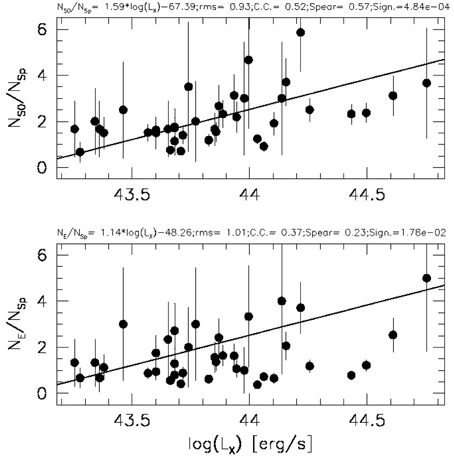
Figure 12. The panel shows the X-ray luminosity of the WINGS clusters plotted against the morphological fractions S0/Sp (upper panel) and E/Sp (lower panel). Poissonian error bars have been assumed.
The dependence of the morphological fractions on the X-ray luminosity of the clusters, and consequently on the temperature of the intra-cluster medium, led us to suspect that the mechanism of evaporation (introduced by Cowie and Songaila, 1977) might play a role as significant as that of ram pressure.
In general, if Spirals transform into S0's via gas stripping and quenching of SF, one might suspect that the mass distribution of present day S0's should not be too different from the mass distribution of early Spirals. Loosing their gas Spirals do not change very much their total mass (< 10% variations are expected). This is indeed observed in Figure 13. This figure plots the mass distribution for the two samples of WINGS and EDisCS for galaxy stellar masses above 1010.2M⊙. Note the strong similarity between the WINGS S0's and EDisCS Spiral population. This similarity is also very clear in Figure 7 of Vulcani et al. (2011) showing the mass function of the two morphological classes in WINGS and EDisCS. Certainly this is not a conclusive argument, but it contributes to the general picture in favor of the galaxy transformation.
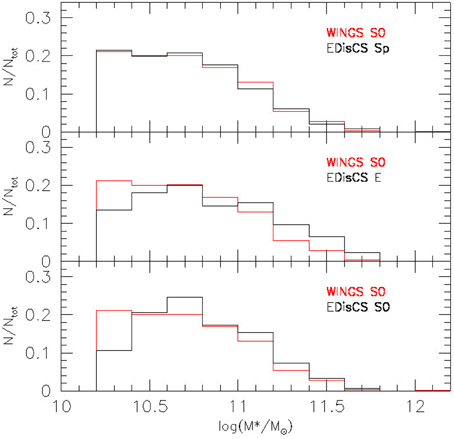
Figure 13. From top to bottom the mass distribution of the WINGS S0 galaxies compared with that of Spirals, E's and S0's from the EDisCS galaxies.
A further evidence that galaxies are stripped of their gas, particularly in the central region of the clusters, comes from Figure 14 that shows the behavior of the Lick index Hβ for the WINGS galaxies measured by Alexander Hannson in his Ph.D. thesis. The figure clearly indicate that the galaxies in the outer region of the clusters still present this line in emission, while the galaxies in the vicinity of the center are systematically deprived of their gas. A more detailed analysis of the spectral emission properties of the WINGS galaxies will be presented by Marziani et al. (in preparation).
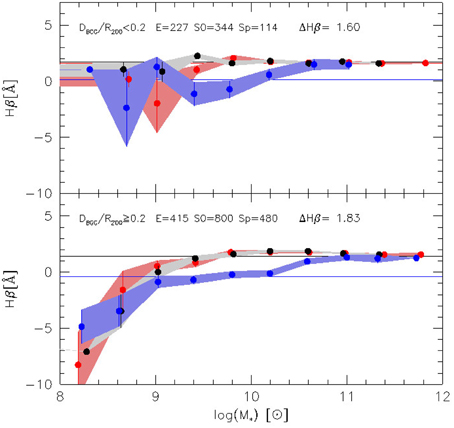
Figure 14. The Lick index Hβ for galaxies closer to the center of the clusters and for more distant objects.
Are these hints sufficient to claim that the gas stripping is the only mechanism producing the transformation of Spirals into S0's? Certainly not. In the next section we will see that do exist several suspects that merging events and gravitational interactions are active somewhere in the clusters and can contribute to the formation of S0 galaxies.
6. Observational Evidences Supporting the Merging Hypothesis
As mentioned in the Introduction, the possibility that S0 galaxies are produced via the merging of two spirals with unequal mass has been discussed since the late 1990s. Bekki (1998) found that simulations of the merging of two bulgeless galaxies (with the gas component modeled) and a mass ratio 0.3 could reproduce the photometric and structural properties of a typical S0 galaxy (red color, absence of a stellar thin disk). Aguerri et al. (2001) discussed a similar scenario for S0 formation, and found a steepening of the photometric profiles toward the early-types due to satellite accretion. After a minor merger, bulges grow and the Sérsic index increases. Eliche-Moral et al. (2013) found that intermediate mergers (i.e., events with mass ratios between 1:4 and 1:7) can produce remnants that photometrically and kinematically resemble S0 galaxies, consistent with the bulge-to-disk coupling observed in real S0's. A significant disk heating is expected from minor mergers (Qu et al., 2011).
These models provide support to the idea that minor/medium mergers lead to an increase of the Sérsic index value, if spheroids or B+D systems are involved. The simulations of Hilz et al. (2013) show that unequal mergers (m2 < 1∕5) produces a steep increase in the Sérsic index in massive spheroid (logM > 11). Repeated minor merging can even lead to the build-up of elliptical galaxies without resorting to major mergers (Bournaud et al., 2005). Querejeta et al. (2015a) computed photometric profiles from the dissipative N-body binary merger simulations from the GalMer database, and found that minor merger remnants can have low Sérsic indices 1 < n < 2, consistent with the presence of pseudo-bulges in observed S0s. In general therefore N-body simulations predict that the Sérsic index of the galaxies evolve, proportionally increasing with the dimension of the new formed bulge component.
From an observational point of view we see evidences of ongoing tidal interactions in the WINGS galaxies (see e.g., Poggianti et al., 2015). This means that gravitational interactions and merging can still be active today in particular in the outskirts of clusters. Unfortunately the analysis of present day S0's does not easily reveal whether they are the end product of past merging events. Direct proof of past accretion events could come from the analysis of the frequency of GCs or PN, or from a detailed analysis of the stellar populations and SFH. This is quite difficult already for very nearby objects, but almost impossible for far S0's that can be studied only in their integrated properties.
The only possible approach with our data is that of statistically distinguish the mean properties of the different morphological classes, and to check whether the observed differences might be explained by theoretical models. Figure 15 compares the B/T ratio and the Sérsic index derived from N-body simulations of major and minor merging events among binary galaxies with the corresponding values measured for the WINGS data set by Sanchez-Jannsen in his Ph.D. thesis. The figure suggests that the formation of cluster S0 galaxies by merging could be one element to consider, at least regarding its brightest representatives. However, it is not clear yet whether smaller cluster S0s can be the end product of merging events.
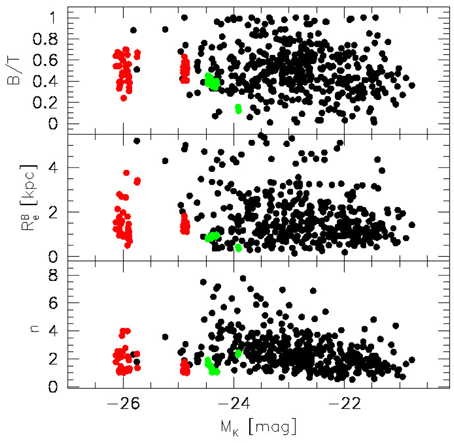
Figure 15. The bulge-to-total luminosity ratio B/T, the effective radius of the bulge, and the Sérsic index of the WINGS S0 galaxies are plotted here vs. the K-band absolute magnitude. The red and green dots mark the bulge-to-disc decomposition of the merging products coming from N-body simulations of Querejeta et al. (2015a) and Tapia et al. (2014), respectively.
The problem is that the high velocity dispersion in clusters does not favor the occurrence of merging. We therefore suspect that most of the merging events happen when galaxies reside in the outskirts of clusters or when they are still members of small groups that are infalling into the clusters. This means that a substantial pre-processing could be experienced by Spirals before being virialized into the cluster environment.
A second hint in favor of the merging hypothesis comes from Figure 3, where we have seen that the fraction S0/E at low redshift cannot be explained without a small increase of the E types, and this might be explained with major/minor merging events.
Therefore, prompted by the idea that merging events are necessary for explaining the actual structure of S0 galaxies and the frequency of the morphological fractions in nearby clusters, we decided to check if the WINGS data in general, and the Sérsic index of S0's and Spirals in particular, are consistent with the merging hypothesis. If such hypothesis is correct, we expect to see an evolution of the Sérsic index, i.e., that n increases as a consequence of multiple merging events experienced by Spirals.
In Figures 6, 7 we have already shown that the Sérsic index5 of the various morphological classes are quite distinct both for various masses and for distances from the cluster center. The two figures showed that for a relatively broad mass range (9.5 < log(M*∕M⊙) < 11) the mean Sérsic index of S0's and today Spirals has a systematic difference of Δlog(n) ~ 0.2. In other words, in the same mass range S0's and Spirals have different light profiles. We can distinguish three broad mass domains: small stellar mass log(M*∕M⊙) ≤ 9.5: the systematic difference between S0's and Spirals is small. In this mass domain, we have the least massive systems with the smallest bulges, and n is consistent with the presence of pseudo bulges, i.e., of structures that might originate from the secular evolution of disks. In the intermediate mass range, we observe instead systematically higher n for S0's and E's with respect to Spirals. For masses log(M*∕M⊙)≳11 the n-value for Spirals becomes not reliable because there are too few objects of this mass. The general trend is that as far as the spheroidal component of the galaxies increases, the value of n increases.
Trusting in N-body simulations we expect that the larger Sérsic index of S0's and E's at each mass could be originated through a series of major/minor merging events experienced by a Spiral galaxy. Ram pressure and evaporation cannot in fact drastically change the Sérsic index of a galaxy. A redistribution or an accretion of new stars is required to produce the observed variations, in particular of the bulge-to-disk ratios. The transforming galaxies should therefore experience such merging events or should produce new stars in their bulges.
Vulcani et al. (2011b) came to a similar conclusion in their analysis of the mass functions and morphological mix of the WINGS and EDisCS data. They stressed that it is impossible to reconcile the mass function observed at low redshift only with the evolution of the morphological fractions. Mass accretion events and new infalling galaxies are required to reproduce the observed evolution. They believe that new SF events should occur in the transforming galaxies.
A robust hint that merging events and gravitational interactions are responsible of the observed n − M* relation would be the detection of a systematic change of n in galaxies that potentially might be subject to several encounters. We have seen before that the center of clusters, where the density of galaxies and the velocity dispersion is high, host the more massive objects (a factor of ~ 2 larger in mass) as well as the smaller in size (~ 25% smaller, with the notable exception of the BCGs). This difference cannot be explained in the context of ram pressure stripping and evaporation by a hot IGM, but fits with the idea that a series of merging events and strong gravitational interactions have produced the big S0's that are now seen in the cluster center.
In order to test such hypothesis, we examined the behavior of the Sérsic index of the three morphological classes in Figure 16. Here for each class we plotted the mean galaxy mass and Sérisc index observed in two intervals of cluster-centric distance DBCG∕R200 ≤ 0.3 (black dots and gray strips) and DBCG∕R200 > 0.3 (red dots and blue strips). The figure shows that there is only a marginal evidence of an increase of n for the S0's in the cluster central region. The probability that the observed means are different by chance is ~ 10% and the observed variation is very small. On the other hand the figure shows that inner and outer E's have significantly different values of n. In particular the inner E's have systematically lower n than outer objects. The statistical significance that the two samples have different averages by chance is now ~ 1%. This means that E's in the central region of the clusters are likely subject to tidal stripping (galaxy harassment), i.e., the most external stars are lost producing less extended envelopes and consequently lower measured n. Spirals on the other hand remain the same at every distance inside the clusters.
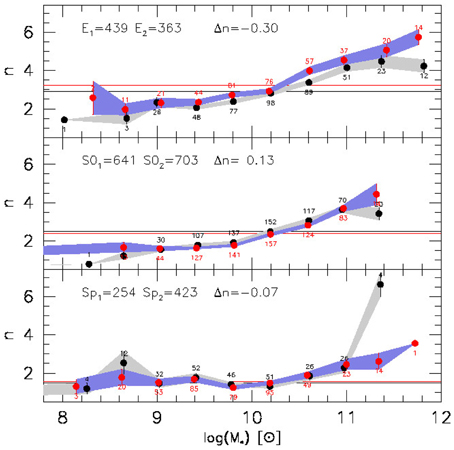
Figure 16. The Sérsic index as a function of galaxy stellar mass for the three morphological types in two different regimes of cluster-centric distances. Black dots mark the values for DBCG∕R200 ≤ 0.3 while red dots those for DBCG∕R200 > 0.3.
One might speculate that the variations of n could not be associated with a real change of the bulge structure since GASPHOT is a software that provides the Sérsic index for the whole galaxy and not for the bulge component. For this reason we used again the subsample of galaxies of Sanchez-Jannsen, which contains the bulge-to-disk decomposition of our galaxies. Figure 17 confirms that: (1) there is a systematic variation between the Sérsic index of the bulges of the various morphological types; (2) the mean difference between the B/T ratios of S0's and Spirals increases in the inner region of the clusters; (3) the mean difference in the Sérsic index also increases.
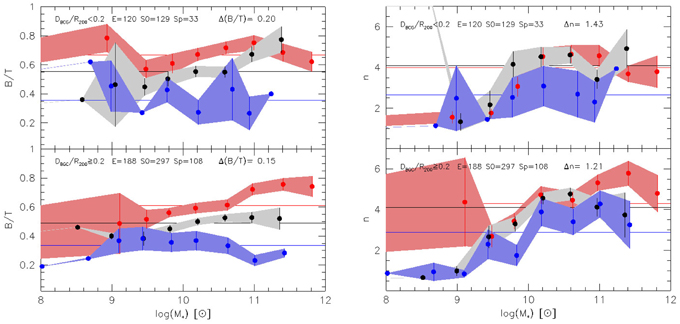
Figure 17. Left: The B/T ratios of the various morphological types in the two bin of cluster-centric distance. Right: The Sérsic index of the bulge components of the galaxies.
In conclusion we can say that we have only a marginal indication that the S0's bulges are systematically bigger in the central region of the clusters as a consequence of major/minor merging events, but in general the data do not support the idea that merging events are more frequent in the inner region of clusters with respect to the outskirts. The question is therefore when and where the transforming Spirals acquire the new stars that complete the transition to the S0 class systematically increasing their bulge structures.
Up to now several works have already claimed that the main quenching and morphological transformation do not occur primarily in the cores of clusters, at least not at z < 1. The decrease in SF is already visible at several virial radii (Lewis et al., 2002; Gómez et al., 2003), and the S0 fraction increases since z ~ 0.5 (Dressler et al., 1997; Fasano et al., 2000) particularly in less-massive clusters (Poggianti et al., 2009; Just et al., 2010). The evolution driven by the environment seems to occur at intermediate densities and outside the cluster virial radius and such effects are observed in simulations out to as many as five virial radii Bahé et al. (2013). This open the possibility that pre-processing mechanisms affect the infalling galaxy population.
The emerging scenario from the above discussion is that Spirals start to quench their SF when they enter in the hot IGM, but at the same time when they are still in the cluster outskirts they progressively accrete/merge new material changing the structure of their bulge and disk (thick disks?). One possibility is that the Spirals which end up in today S0's, were members of small groups infalling the clusters and subsequently merged together.
In other words from the present sample we can only derive indirect hints that merging events have contributed to the formation of today S0's. This is likely due to the fact that the present data cover only the inner virialized part of the WINGS clusters. Probably the ongoing observations of the outskirts of the WINGS clusters will provide soon much solid conclusions about this.
An intriguing fact that is difficult to explain with the ram pressure is that the clusters with a small value of the NS0∕NSp ratio (< 1) seem to contain in their central region systematically more massive S0's than clusters with a higher value of this ratio (see left panel of Figure 18). We have verified that there is not a big difference in the mean luminosity weighted age between these two types of clusters (~ 0.1 dex), so we cannot attribute the effect to a systematic variation in age.
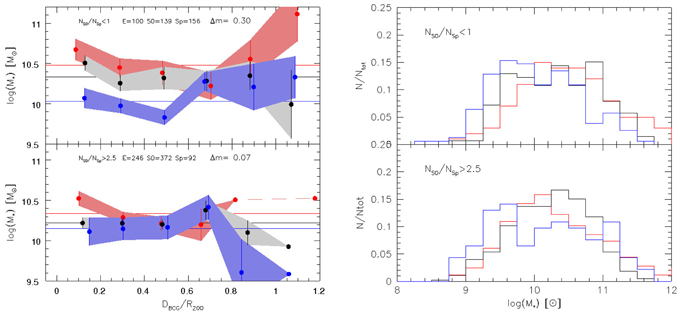
Figure 18. Left: The masses of the three morphological types in clusters with a high and small ratio of S0's to Spirals. Right: The distribution of the masses of the three morphological types in clusters with a different fraction of S0/Sp.
However, Figure 19 suggests a partially significant correlation between the log of the NS0∕NSp ratio and the central velocity dispersion of the clusters. A bisector least square fit gives: log(NS0∕NSp) = 1.64log(σcl) − 4.42 with a rms = 0.2 c.c. = 0.42 and a significance of 1.7910 − 2). A weighted least square fit provides a shallower slope: log(NS0∕NSp) = 0.87log(σcl) − 2.26. On average the fraction NS0∕NSp increase by a factor 2–3 going from σcl ~ 500 to σcl ~ 1100. This implies that the more massive galaxies reside in the clusters with the lowest velocity dispersion, in agreement with the idea that merging events are more frequent because the velocity dispersion in the clusters is low.
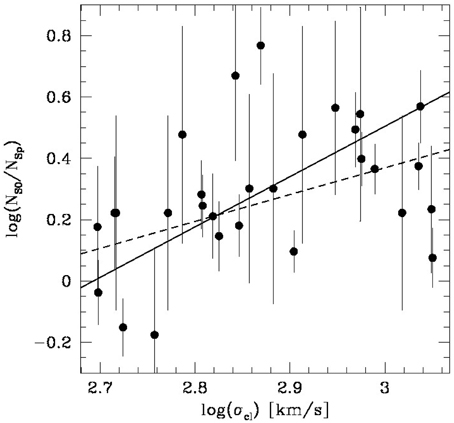
Figure 19. The panel show the log of the NS0∕NSp fraction against the central velocity dispersion of the clusters. The solid line is the bisector least square fit, while the dashed line is the weighted least square fit.
Fasano et al. (2000) noted that the NS0∕NSp ratio is lower in more concentrated clusters where the number of E's is higher. The suspect is then that interactions and merging have played a key role in determining the high mass of these galaxies. Probably in these clusters the merging activity was higher and the NS0∕NSp ratio kept small either by the lower temperature of the X-ray gas (remember that the NS0∕NSp fraction depends also on LX) and by a continuous accretion of new Spirals from the cosmic web.
The right panel of the same figure shows that there are no systematic differences in the mass distributions of the various morphological types in clusters with NS0∕NSp < 1 and NS0∕NSp > 2.5 suggesting that the observed behavior is not the result of a selection bias, but is probably an intrinsic characteristic of galaxies of these two types of clusters.
At the end of this Section we should say that we have accumulated several hints, although none strictly compelling, that merging events and gravitational interactions (harassment?) have had a role in galaxy clusters (in particular in those with low velocity dispersions).
7. Field and Cluster S0's
One of the most relevant things of the previous analysis is that E's in the central region are systematically deprived of their outer stars with respect to more distant objects. This tell us that gravitational stripping and galaxy harassment are playing an active role in the high density regions of clusters. Galaxy harassment may be associated with the origin of a diffuse stellar component that yields the so-called intra-cluster optical light (Zwicky, 1952), if this diffuse component is due to stars tidally stripped from galaxies as they move within the cluster (e.g., Gregg and West, 1998).
To test this effect we compare now the properties of the three morphological classes for objects belonging to the general field and to clusters. We have therefore used the PM2GC data sample described in Section 2.3.
Figure 20 shows the comparison of the Sérsic index and the effective radius of the three morphological types for galaxies in clusters (black dots and gray strips) and in the field (red dots and blue strips). The left panel tells us that Spirals in clusters and in the field have exactly the same n. On the other hand, S0's and E's in clusters appear systematically with lower n-values at each mass. We have checked with a Welch's test that this difference is significative from a statistical point of view and cannot originate from the different wavebands (B and V) of the two datasets. The mean difference that can be attributed to the waveband effect is of the order of ~ − 0.05 for Δlog(Re[V − B]) and ~ − 0.2 for Δn[V − B]. The right panel confirms that the higher Sérsic index of galaxies in the field is associated to a systematic variation of the circularized effective radius. Field galaxies are systematically larger than cluster objects, suggesting that the main visible action of the cluster environment is the stripping of the outer regions of galaxies.
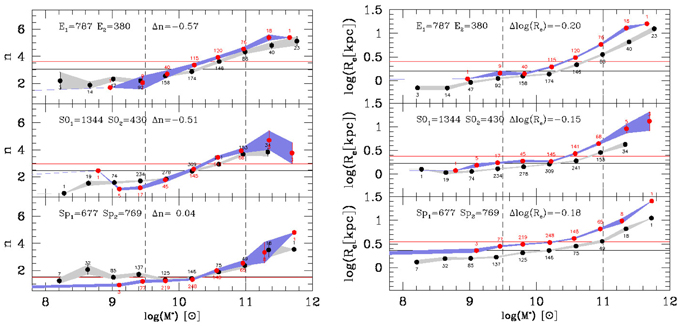
Figure 20. Left: The Sérsic index of E's (upper panel), S0's (middle panel), and Spirals (lower panel) of galaxies in clusters (back dots and gray strips) and in the field (red dots and blue strips). Right: The effective radius in log units. Symbols as in the left panel.
The main indication is that the mean E's and S0's of intermediate mass in the field have larger n (~ 10%) and larger Re (~ 20%). One possibility is that during the infall into the cluster potential, or as a consequence of repeated high speed encounters, galaxies loose their outer regions. This produces systematically smaller radii and also smaller Sérsic indexes for the galaxies in clusters. Moreover, the similarity of the n − M* relation of field and cluster galaxies suggests that the mechanisms that have produced the various morphological classes should be very similar in both environments.
If ram pressure and evaporation were not active in the field, the only possible hypotheses are that field S0's originated from Spirals that were members of small groups that are now dissolved, or in binary associations. Part of these objects could also be byproduct of a secular evolution of the disk. In other words the merging hypothesis is still one the most attractive even for field S0's.
8. Conclusions and Discussion
In this work we have obtained the following results:
1. the fractions S0/Sp and E/Sp derived for clusters at different redshifts smoothly increase from z ~ 0.8 to the present, while the fraction S0/E remains almost constant (or is only slightly increasing) although with a significative variance. In particular the fraction S0/Sp is nearly double every Gyr;
2. starting from the mean number of morphological types observed in EDisCS and ending to those measured in WINGS, we calculated a mean rate of transformation of Spirals into S0's of ~ 5 objects per Gyr (not considering the infall of new Spiral objects in the clusters), while the mean transformation of Spirals into E's is at least ~ 2 objects per Gyr;
3. the S0 population in clusters appears to grow at the expenses of the Spiral one by a factor of ~ 3 − 4 since z ~ 1. At the same time the number of E's could not remain constant;
4. S0's are more frequent in the central region of nearby clusters, while Spirals are preferentially found in the outer regions of high redshift clusters;
5. the S0 family at z ~ 0 is on average quite different from that of present day Spirals: in general at a given distance from the cluster center they are more massive (up to a factor of 2), 25% smaller in size, with an higher Sérsic index and effective surface brightness, and are redder in B − V colors. On the other hand, at a given mass they are closer to the center, systematically smaller in size, with higher surface brightness, age, color and Sérsic index, but lower SFR;
6. the more massive S0's in WINGS are clustered around the center of the clusters;
7. the S0's in EDisCS have the same structural characteristics of present day S0's once a passive luminosity evolution is taken into account. As for the WINGS clusters E's and S0's are more frequent in the central part of the clusters, but the proportion of the morphological types is quite different;
8. the mass distribution of present day S0's and high redshift Spirals is very similar (although in the limited range of galaxy masses M* > 1010.2M⊙);
9. the morphological fractions S0/Sp and E/Sp in the local WINGS sample are mildly correlated with the X-ray luminosity of the clusters and with the cluster velocity dispersion. The objects closer to the cluster center are systematically deprived of their gas. The more massive S0's reside in the clusters with the smaller velocity dispersion;
10. the Sérsic index of Spirals, S0's and E's increase with the mass of the galaxies and in particular with the bulge component. At each mass the value of n is large for E's, intermediate for S0's and small for Spirals;
11. Pairwise merger simulations give some support to the idea that the most massive cluster S0s may arise by merging;
12. there are no clear indications of an increase of the Sérsic index for galaxies closer to the cluster center with respect to more distant objects, with the possible exception of central E's (BCGs excluded) that appear to have systematically lower n of far E's;
13. the comparison between cluster and field galaxies tells us that galaxies in clusters are systematically smaller in effective radius and have lower n-values.
The first four points of this list strongly suggest that Spirals transform into S0's and E's in clusters.
The fifth and seventh points confirm that S0's and Spirals are very different in many observable parameters at all redshifts. If we accept the idea that Spirals transform into S0's, we should recognize that the morphological transformation is radical. The speed of the transformation should be quite fast, since the various surveys at different redshifts have clearly identified the three morphological classes with almost no objects with confused or mixed morphology.
The eighth point suggests that the mass distribution of present day S0's and Spiral is consistent (at least for the large masses) with the hypothesis of transformation through gas stripping and quenching of SF. However, within this scenario it is quite difficult to account for the large observed difference in the Sérsic index among the progenitor Spiral and the final S0 galaxy.
The ninth point tell us that the hot IGM certainly play a key role in the transformation because the clusters having a bright X-ray luminosity contain proportionally more E's and S0's with respect to Spirals. However, the same point tell us that the clusters with the smaller velocity dispersion contains the biggest S0's in agreement with the idea that merger events have produced these galaxies.
The activity of merging and gravitational interactions is suggested by points 3, 10, and 13. The main hints that S0's could originate from merging events (if we accept the idea that Spirals must transform), rest on: (a) the fact that up to DBCG∕R200 ≤ 0.7 at each distance form the cluster center the mean Spirals are systematically less massive than the mean S0's and E's; (b) in the same interval the mean E's are more massive than the mean S0's and the most massive are progressively segregated in the central region; (c) the Sérsic index is predicted to evolve after merging and is observed to increase systematically with the mass of the spheroidal component (and marginally decrease with the distance from the cluster center).
The twelfth point indicates that the merging activity is not confined to the densest regions of the clusters, but can occur in every place and time inside them, in particular in the outer cluster regions, where the velocity dispersion slow down. We can therefore speculate that when small groups fell into the cluster potential they merged together forming the new S0's and E's we see today.
The thirteenth point suggests that the main action of the cluster environment is that of stripping stars from the outer parts of the galaxies. All the morphological types in clusters appear in fact to be systematically smaller in size and with lower Sérsic index with respect to field objects. This effect of harassment is not in contradiction with the idea that merging is the main actor of the Spiral transformation.
The merging hypothesis is currently supported by recent observations of massive S0's located in groups and clusters, usually exhibiting traces of past merger events (Rudick et al., 2009; Janowiecki et al., 2010; Mihos et al., 2013). Furthermore, the high resolution analysis of the Atlas3D group (Cappellari et al., 2011; Emsellem et al., 2011; Cappellari, 2013) has found that 87% of the galaxies classified as S0's or E's at very low redshifts are fast rotating systems, indicating that they have rotationally supported disks. Slow rotators are the most massive galaxies, often with boxy isophotes (70% of them), and depletion of mass in the central galaxy regions (core). Fast rotators are less massive, typically have disky isophotes, and centrally peaked surface brightness profiles (cuspy). Fast rotators are presumably stripped Spirals with some mass added by minor mergers, whereas the slow rotators are formed in more violent processes so that the bulges formed first.
This scenario is also consistent with other well known observations: (1) stellar and gaseous disks, and dust lanes have been frequently found in E's and S0' bulges; (2) shells and ripples are often seen around these galaxies when deep exposures are taken; (3) lenticular galaxies surrounded by polar rings exist; (4) early-type galaxies could evolve in size by multiple minor merging events (see e.g., Lopez-Sanjuan et al., 2012).
All these facts together point toward a strong role of merging in re-structuring the morphology of late-type galaxies. This is supported by modern high resolution simulations of merging events (e.g., Cox et al., 2006; Robertson et al., 2006) between two Spiral galaxies that have produced E's and S0's with some rotational support with the right coupled bulge-disk structures in time scale less than ~ 3 Gyr (Querejeta et al., 2015a). A major merging could completely transform the structure of a Spiral galaxy, varying its bulge-to-disk ratio, its Sérsic index, the mean surface brightness and the effective radius (see e.g., Querejeta et al., 2015a). Minor mergers can also produce S0's with intermediate kinematic properties between fast and slow rotators that are difficult to explain with major mergers (Tapia et al., 2014). In conclusion the bulges of S0's can be formed by means of a major merger of early disks or by a sequence of minor merger events, followed by a later disk rebuilding of the left-over gas and stripped stars (Somerville and Primack, 1999).
The data presented here are consistent with this scenario, although there are only hints that this was the right story for the S0 in clusters. Direct evidences exist that ram pressure stripping and thermal evaporation could rapidly quench the SF in Spiral galaxies, while internal secular evolution can re-distribute the matter within them.
Conflict of Interest Statement
The authors declare that the research was conducted in the absence of any commercial or financial relationships that could be construed as a potential conflict of interest.
Acknowledgments
We thank Benedetta Vulcani for providing us the masses of the EDisCS galaxies in advance of publication. We also thank Alexander Hannson and Ruben Sanchez-Janssen for the permission of using the data of their Ph.D. theses.
Footnotes
1. ^The cluster membership was measured on the basis of the velocity dispersion of the galaxies in the clusters (see Cava et al., 2009).
2. ^R200 is the radius delimiting a sphere with interior mean density 200 times the critical density of the Universe at that redshift (see for details, Cava et al., 2009).
3. ^The cluster area observed is around 1 Mpc2 in almost all clusters.
4. ^These peaks are not difficult to explain with a slightly higher frequency of transformation that can occur in some clusters in which the mechanisms of transformation are particularly efficient.
5. ^The Sérsic index was measured by GASPHOT (see D'Onofrio et al., 2014) on the major and minor growth curves of the galaxies without distinguishing the bulge and disk components.
References
Aguerri, J. A. L., Balcells, M., and Peletier, R. F. (2001). Growth of galactic bulges by mergers. I. Dense satellites. Astron. Astrophys. 367, 428. doi: 10.1051/0004-6361:20000441
Aguerri, J. A. L., Huertas-Company, M., and Tresse, L. (2010). “Galaxies in isolation: exploring nature versus nurture,” in Proceedings of a Conference Held 12 to 15 May 2009 in Granada, Spain, eds L. Verdes-Montenegro, A. del Olmo, and J. Sulentic (San Francisco, CA: Astronomical Society of the Pacific), 209.
Andreon, S. (1998). Is there a deficit of S0 galaxies at intermediate redshift? Astrophys. J. 501, 533–538. doi: 10.1086/305853
Bahé, Y. M., McCarthy, I. G., Balogh, M. L., and Font, A. S. (2013). Why does the environmental influence on group and cluster galaxies extend beyond the virial radius? Mon. Not. R. Astron. Soc. 430, 3017. doi: 10.1093/mnras/stt109
Balogh, M. L., Navarro, J., and Morris, S. (2000). The origin of star formation gradients in rich galaxy clusters. Astrophys. J. 540, 113. doi: 10.1086/309323
Barnes, J. E., and Hernquist, L. (1992). Dynamics of interacting galaxies. Annu. Rev. Astron. Astrophys. 30, 705. doi: 10.1146/annurev.aa.30.090192.003421
Barr, J. M., Bedregal, A. G., Aragon-Salamanca, A., Merrifield, M. R., and Bamford, S. P. (2007). The formation of S0 galaxies: evidence from globular clusters. Astron. Astrophys. 470, 173. doi: 10.1051/0004-6361:20077151
Bell, E. F., and de Jong, R. S. (2001). Stellar mass-to-light ratios and the tully-fisher relation. Astrophys. J. 550, 212. doi: 10.1086/319728
Bekki, K. (1997). Formation of polar-Ring S0 galaxies in dissipative galaxy mergers. Astrophys. J. Lett. 490, L37. doi: 10.1086/311008
Bekki, K. (1998). Unequal-mass galaxy mergers and the creation of cluster S0 galaxies. Astrophys. J. Lett. 502, L33. doi: 10.1086/311508
Bekki, K. (2014). Galactic star formation enhanced and quenched by ram pressure in groups and clusters. Mon. Not. R. Astron. Soc. 438, 444. doi: 10.1093/mnras/stt2216
Bertola, F., Buson, L. M., and Zeilinger, W. W. (1992). The external origin of the gas in S0 galaxies. Astrophys. J. Lett. 401, L79. doi: 10.1086/186675
Book, L. G., and Benson, A. (2010). The role of ram pressure stripping in the quenching of cluster star formation. Astrophys. J. 716, 810. doi: 10.1088/0004-637X/716/1/810
Borlaff, A., Eliche-Moral, M. C., Rodríguez-Pérez, C., Querejeta, M., Tapia, T., Pérez-González, P. G., et al. (2014). Formation of S0 galaxies through mergers. Antitruncated stellar discs resulting from major mergers. Astron. Astrophys. 570, 103. doi: 10.1051/0004-6361/201424299
Boselli, A., and Gavazzi, G. (2006). Environmental ffects on late-type galaxies in nearby clusters. Publ. Astron. Soc. Pac. 118, 517. doi: 10.1086/500691
Bournaud, F., Jog, C. J., and Combes, F. (2005). Galaxy mergers with various mass ratios: properties of remnants. Astron. Astrophys. 437, 69. doi: 10.1051/0004-6361:20042036
Burstein, D. (1979). Structure and origin of S0 galaxies. II - disk-to-bulge ratios. Astrophys. J. 234, 435. doi: 10.1086/157512
Byrd, G., and Valtonen, M. (1990). Tidal generation of active spirals and S0 galaxies by rich clusters. Astrophys. J. 350, 89. doi: 10.1086/168362
Calvi, R., Poggianti, B. M., and Vulcani, B. (2011). The padova-millennium galaxy and group catalogue (PM2GC): the group-finding method and the PM2GC catalogues of group, binary and single field galaxies. Mon. Not. R. Astron. Soc. 416, 727. doi: 10.1111/j.1365-2966.2011.19088.x
Calvi, R., Poggianti, B. M., Fasano, G., and Vulcani, B. (2012). The distribution of galaxy morphological types and the morphology-mass relation in different environments at low redshift. Mon. Not. R. Astron. Soc. 419, L14. doi: 10.1111/j.1745-3933.2011.01168.x
Cappellari, M., Emsellem, E., Krajnović, D., McDermid, R. M., Serra, P., Alatalo, K., et al. (2011). The ATLAS3D project - VII. A new look at the morphology of nearby galaxies: the kinematic morphology-density relation. Mon. Not. R. Astron. Soc. 416, 1680. doi: 10.1111/j.1365-2966.2011.18600.x
Cappellari, M. (2013). Effect of environment on galaxies' mass-size distribution: unveiling the transition from outside-in to inside-out evolution. Astrophys. J. 778, 2. doi: 10.1088/2041-8205/778/1/L2
Cava, A., Bettoni, D., Poggianti, B. M., Couch, W. J., Moles, M., Varela, J., et al. (2009). WINGS-SPE spectroscopy in the WIde-field nearby galaxy-cluster survey. Astron. Astrophys. 495, 707. doi: 10.1051/0004-6361:200810997
Chamberlain, L. C. P., Courteau, S., McDonald, M., and Rose, J. A. (2011). Stellar population trends in S0 galaxies. Mon. Not. R. Astron. Soc. 412, 423. doi: 10.1111/j.1365-2966.2010.17910.x
Christlein, D., and Zabludoff, A. I. (2004). Can early-type galaxies evolve from the fading of the disks of late-type galaxies? Astrophys. J. 616, 192. doi: 10.1086/424909
Chung, A., van Gorkom, J. H., Kenney, J. D. P., and Vollmer, B. (2007). Virgo galaxies with long one-sided HI tails. Astrophys. J. Lett. 659, L115. doi: 10.1086/518034
Cortesi, A., Merrifield, M. R., Arnaboldi, M., Gerhard, O., Martinez-Valpuesta, I., Saha, K., et al. (2011). Unravelling the origins of S0 galaxies using maximum likelihood analysis of planetary nebulae kinematics. Mon. Not. R. Astron. Soc. 414, 642. doi: 10.1111/j.1365-2966.2011.18429.x
Cowie, L. L., and Songaila, A. (1977). Thermal evaporation of gas within galaxies by a hot intergalactic medium. Nature 266, 501. doi: 10.1038/266501a0
Cox, T. J., Dutta, S. N., Di Matteo, T., Hernquist, L., Hopkins, P. F., Robertson, B., et al. (2006). The kinematic structure of merger remnants. Astrophys. J. 650, 791. doi: 10.1086/507474
Crowl, H. H., Kenney, J. D. P., van Gorkom, J. H., and Vollmer, B. (2005). Dense cloud ablation and ram pressure stripping of the virgo spiral NGC 4402. Astron. J. 130, 65. doi: 10.1086/430526
Davies, R. D., and Lewis, B. M. (1973). Neutral hydrogen in virgo cluster galaxies. Mon. Not. R. Astron. Soc. 165:231. doi: 10.1093/mnras/165.2.231
Desai, V., Dalcanton, J. J., Aragón-Salamanca, A., Jablonka, P., Poggianti, B., Gogarten, S. M., et al. (2007). The morphological content of 10 EDisCS clusters at 0.5 < z < 0.8. Astrophys. J. 660, 1151. doi: 10.1086/513310
D'Onofrio, M., Bindoni, D., Fasano, G., Bettoni, D., Cava, A., Fritz, J., et al. (2014). Surface photometry of WINGS galaxies with GASPHOT. Astron. Astrophys. 572, A87. doi: 10.1051/0004-6361/201424307
Dressler, A. (1980). Galaxy morphology in rich clusters - implications for the formation and evolution of galaxies. Astrophys. J. 236, 351. doi: 10.1086/157753
Dressler, A. Oemler, A. Jr., Couch, W. J., Smail, I., Ellis, R. S., Barger, A., et al. (1997). Evolution since z = 0.5 of the morphology-density relation for clusters of galaxies. Astrophys. J. 490, 577. doi: 10.1086/304890
Eliche-Moral, M. C., González-García, A. C., Aguerri, J. A. L., Gallego, J., Zamorano, J., Balcells, M., et al. (2012). Evolution along the sequence of S0 Hubble types induced by dry minor mergers. I. Global bulge-to-disk structural relations. Astron. Astrophys. 547, A48. doi: 10.1051/0004-6361/201118711
Eliche-Moral, M. C., González-Garc'ia, A. C., Aguerri, J. A. L., Gallego, J., Zamorano, J., Balcells, M., et al. (2013). Evolution along the sequence of S0 Hubble types induced by dry minor mergers. II. Bulge-disk coupling in the photometric relations through merger-induced internal secular evolution. Astron. Astrophys. 552, A67. doi: 10.1051/0004-6361/201220841
Efron, B., and Tibshirani, R. J. (1993). An Introduction to the Bootstrap. Monographs on Statistics and Applied Probability, Vol.57. New York, NY: Chapman & Hall.
Emsellem, E., Cappellari, M., Krajnović, D., Alatalo, K., Blitz, L., Bois, M., et al. (2011). The ATLAS3D project - III. A census of the stellar angular momentum within the effective radius of early-type galaxies: unveiling the distribution of fast and slow rotators. Mon. Not. R. Astron. Soc. 414, 888. doi: 10.1111/j.1365-2966.2011.18496.x
Erwin, P., Pohlen, M., Gutiérrez, L., and Beckman, J. E. (2008). “Formation and evolution of galaxy disks ASP conference series,” in Proceedings of the Conference Held 1–5 October, 2007 at the Centro Convegni Matteo Ricci, Rome, Italy, Vol. 396, eds J. G. Funes and E. M. Corsini (San Francisco, CA: Astronomical Society of the Pacific), 207.
Fabello, S., Catinella, B., Giovanelli, R., Kauffmann, G., Haynes, M. P., Heckman, T. M., et al.(2011). ALFALFA H I data stacking - I. Does the bulge quench ongoing star formation in early-type galaxies? Mon. Not. R. Astron. Soc. 411, 993. doi: 10.1111/j.1365-2966.2010.17742.x.
Fasano, G., Poggianti, B. M., Couch, W. J., Bettoni, D., Kjrgaard, P., and Moles, M. (2000). The evolution of the galactic morphological types in clusters. Astrophys. J. 542, 673. doi: 10.1086/317047
Fasano, G., Marmo, C., Varela, J., D'Onofrio, M., Poggianti, B. M., Moles, M., et al. (2006). WINGS: a WIde-field nearby galaxy-cluster survey. I. Optical imaging. Astron. Astrophys. 445, 805. doi: 10.1051/0004-6361:20053816
Fasano, G., Vanzella, E., Dressler, A., Poggianti, B. M., Moles, M., Bettoni, D., et al. (2012). Morphology of galaxies in the WINGS clusters. Mon. Not. R. Astron. Soc. 420, 926. doi: 10.1111/j.1365-2966.2011.19798.x
Fogarty, L. M. R., Bland-Hawthorn, J., Croom, S. M., Green, A. W., Bryant, J. J., Lawrence, J. S., et al. (2012). First science with SAMI: a serendipitously discovered alactic wind in ESO 185-G031. Astrophys. J. 761:169. doi: 10.1088/0004-637X/761/2/169
Fossati, M., Gavazzi, G., Savorgnan, G., Fumagalli, M., Boselli, A., Gutiérrez, L., et al. (2013). Hα3: an Hα imaging survey of HI selected galaxies from ALFALFA. IV. Structure of galaxies in the Local and Coma superclusters. Astron. Astrophys. 553, A91. doi: 10.1051/0004-6361/201220915
Fritz, J., Poggianti, B. M., Bettoni, D., Cava, A., Couch, W. J., D'Onofrio, M., et al. (2007). A spectrophotometric model applied to cluster galaxies: the WINGS dataset. Astron. Astrophys. 470, 137. doi: 10.1051/0004-6361:20077097
Fritz, J., Poggianti, B. M., Cava, A., Moretti, A., Varela, J., Bettoni, D., et al. (2014). WINGS-SPE. III. Equivalent width measurements, spectral properties, and evolution of local cluster galaxies. Astron. Astrophys. 566, 32. doi: 10.1051/0004-6361/201323138
Fritz, J., Poggianti, B. M., Cava, A., Valentinuzzi, T., Moretti, A., Bettoni, D., et al. (2011). WINGS-SPE II: a catalog of stellar ages and star formation histories, stellar masses and dust extinction values for local clusters galaxies. Astron. Astrophys. 526, 45. doi: 10.1051/0004-6361/201015214
Giovanelli, R., and Haynes, M. (1985). Gas deficiency in cluster galaxies - a comparison of nine clusters. Astrophys. J. 292, 404. doi: 10.1086/163170
Gómez, P. L., Nichol, R. C., Miller, C. J., Balogh, M. L., Goto, T., Zabludoff, A. I., et al. (2003). Galaxy star formation as a function of environment in the early data release of the sloan digital sky survey. Astrophys. J. 584, 210. doi: 10.1086/345593
Gonçalves, T. S., Martin, D. C., Menéndez-Delmestre, K., Wyder, T. K., and Koekemoer, A. (2012). Quenching star formation at intermediate redshifts: downsizing of the mass flux density in the green valley. Astrophys. J. 759:67. doi: 10.1088/0004-637X/759/1/67
Graham, A. W. (2013). “Elliptical and disk galaxy structure and modern scaling laws,” in Planets, Stars and Stellar Systems, Vol. 6, eds T. D. Oswalt and W. C. Keel (Dordrecht: Springer Science+Business Media), 91.
Gregg, M. D., and West, M. J. (1998). Galaxy disruption as the origin of intracluster light in the Coma cluster of galaxies. Nature 396, 549. doi: 10.1038/25078
Gullieuszik, M., Poggianti, B., Fasano, G., Zaggia, S., Paccagnella, A., and Moretti, A. (in press). OmegaWINGS: OmegaCAM@VST observations of WINGS galaxy clusters. arXiv:1503.02628. doi: 10.1051/0004-6361/201526061.
Gunn, J. E., and Gott, J. R. (1972). On the infall of matter into clusters of alaxies and some effects on their evolution. Astrophys. J. 176, 1. doi: 10.1086/151605
Gutierrez, L., Erwin, P., Aladro, R., and Beckman, J. E. (2011). The outer disks of early-type galaxies. II. Surface-brightness profiles of unbarred galaxies and trends with hubble type. Astron. J. 142:145. doi: 10.1088/0004-6256/142/5/145
Haynes, M., Giovanelli, R., and Chincarini, G. L. (1984). The influence of envirionment on the H I content of galaxies. Annu. Rev. Astron. Astrophys. 22, 445. doi: 10.1146/annurev.aa.22.090184.002305
Hilz, M., Naab, T., and Ostriker, J. P. (2013). How do minor mergers promote inside-out growth of ellipticals, transforming the size, density profile and dark matter fraction? Mon. Not. R. Astron. Soc. 429, 2924. doi: 10.1093/mnras/sts501
Hirschmann, M., De Lucia, G., Wilman, D., Weinmann, S., Iovino, A. Cucciati, O., et al. (2014). The influence of the environmental history on quenching star formation in a Λ cold dark matter universe. Mon. Not. R. Astron. Soc. 444, 2938. doi: 10.1093/mnras/stu1609
Ho, I.-T., Kewley, L. J., Dopita, M. A., Medling, A. M., Allen, J. T., Bland-Hawthorn, J., et al. (2014). The SAMI galaxy survey: shocks and outflows in a normal star-forming galaxy. Mon. Not. R. Astron. Soc. 3894, 3910. doi: 10.1093/mnras/stu1653
Holden, B. P., Franx, M., Illingworth, G. D., Postman, M., van der Wel, A., Kelson, D. D., et al. (2009). The ellipticities of cluster early-type galaxies from z ~ 1 to z ~ 0: no evolution in the overall distribution of bulge-to-disk ratios. Astrophys. J. 693:617. doi: 10.1088/0004-637X/693/1/617
Janowiecki, S., Mihos, J. C., Harding, P., Feldmeier, J. J., Rudick, C., and Morrison, H. (2010). Diffuse tidal structures in the halos of virgo ellipticals. Astrophys. J. 715:972. doi: 10.1088/0004-637X/715/2/972
Just, D. W., Zaritsky, D., Sand, D. J., Desai, V., and Rudnick, G. (2010). The environmental dependence of the evolving S0 fraction. Astrophys. J. 711:192. doi: 10.1088/0004-637X/711/1/192
Koopmann, R. A., and Kenney, J. D. P. (2004). Hα morphologies and environmental effects in virgo cluster spiral galaxies. Astrophys. J. 613, 866. doi: 10.1086/423191
Kormendy, J., and Bender, R. (2012). A revised parallel-sequence morphological classification of galaxies: structure and formation of S0 and spheroidal galaxies. Astrophys. J. Suppl. 198, 40. doi: 10.1088/0067-0049/198/1/2
Kormendy, J., and Kennicutt, R. C. Jr. (2004). Secular evolution and the formation of pseudobulges in disk galaxies. Annu. Rev. Astron. Astrophys. 42, 603. doi: 10.1146/annurev.astro.42.053102.134024
Kroupa, P. (2001). On the variation of the initial mass function. Mon. Not. R. Astron. Soc. 322, 231. doi: 10.1046/j.1365-8711.2001.04022.x
Larson, R. B., Tinsley, B. M., and Caldwell, C. N. (1980). The evolution of disk galaxies and the origin of S0 galaxies. Astrophys. J. 237, 692. doi: 10.1086/157917
Laurikainen, E., Salo, H., Buta, R., Knapen, J., and Speltincx, T. Block, D. (2006). Morphology of 15 southern arly-type disk galaxies. Astron. J. 132, 2634. doi: 10.1086/508810
Lewis, I., Balogh, M., De Propris, R., Couch, W., Bower, R., Offer, A., et al. (2002). The 2dF galaxy redshift survey: the environmental dependence of galaxy star formation rates near clusters. Mon. Not. R. Astron. Soc. 334, 673. doi: 10.1046/j.1365-8711.2002.05558.x
López-Sanjuan, C., Le Fevre, O., Ilbert, O., Tasca, L. A. M., Bridge, C., Cucciati, O., et al. (2012). The dominant role of mergers in the size evolution of massive early-type galaxies since z ~ 1. Astron. Astrophys. 548, A7. doi: 10.1051/0004-6361/201219085
Maltby, D. T., Aragón-Salamanca, A., Gray, M. E., Hoyos, C., Wolf, C., Jogee, S., et al. (2015). The environmental dependence of the structure of galactic discs in STAGES S0 galaxies: implications for S0 formation. Mon. Not. R. Astron. Soc. 447, 1506. doi: 10.1093/mnras/stu2536
Mapelli, M., Rampazzo, R., and Marino, A. (2015). Building gas rings and rejuvenating S0 galaxies through minor mergers. Astron. Astrophys. 575, 16. doi: 10.1051/0004-6361/201425315
Mazzei, P., Marino, A., and Rampazzo, R. (2014a). The NUV-r versus Mr plane as a tracer of early-type galaxy evolution in the USGC U376 and LGG 225 groups. Astrophys. J. 782:53. doi: 10.1088/0004-637X/782/1/53
Mazzei, P., Marino, A., Rampazzo, R., Galletta, G., and Bettoni, D. (2014b). Catching spiral - S0 transition in groups. Insights from SPH simulations with chemo-photometric implementation. Adv. Space Res. 53, 950. doi: 10.1016/j.asr.2013.06.001
Mendel, J. T., Simard, L., Ellison, S.L., and Patton, D. R. (2013). Towards a physical picture of star formation quenching: the photometric properties of recently quenched galaxies in the sloan digital sky survey. Mon. Not. R. Astron. Soc. 429, 2212. doi: 10.1093/mnras/sts489
Mihos, J. C., Harding, P., Rudick, C. S., and Feldmeier, J. J. (2013). Stellar populations in the outer halo of the massive elliptical M49. Astrophys. J. 764:L20. doi: 10.1088/2041-8205/764/2/L20
Moore, B., Katz, N., Lake, G., Dressler, A., and Oemler, A. (1996). Galaxy harassment and the evolution of clusters of galaxies. Nature 376, 613. doi: 10.1038/379613a0
Moretti, A., Poggianti, B. M., Fasano, G., Bettoni, D., and D'Onofrio, M. (2014). WINGS data release: a database of galaxies in nearby clusters. Astron. Astrophys. 563, 138. doi: 10.1051/0004-6361/201323098
Nulsen, P. E. J. (1982). Transport processes and the stripping of cluster galaxies. Mon. Not. R. Astron. Soc. 198:1007. doi: 10.1093/mnras/198.4.1007
Oemler, A. Jr. (1974). The systematic properties of clusters of galaxies. Photometry of 15 clusters. Astrophys. J. 194, 1–20. doi: 10.1086/153216
Omizzolo, A., Fasano, G., Reverte Paya, D., De Santis, C., Grado, A., Bettoni, D., et al. (2014). U-band photometry of 17 WINGS clusters. Astron. Astrophys. 561, A111. doi: 10.1051/0004-6361/201322924
Pellò, R., Rudnick, G., De Lucia, G., Simard, L., Clowe, D. I., Jablonka, P., et al. (2009). Photometric redshifts and cluster tomography in the ESO distant cluster survey. Astron. Astrophys. 508, 1173. doi: 10.1051/0004-6361/200810644
Pfenniger, D., and Norman, C. (1990). Dissipation in barred galaxies - the growth of bulges and central mass concentrations. Astrophys. J. 363, 391. doi: 10.1086/169352
Pfenniger, D., and Friedli, D. (1993). Computational issues connected with 3D N-body simulations. Astron. Astrophys. 270, 561.
Poggianti, B. M., von der Linden, A., De Lucia, G., Desai, V., Simard, L., Halliday, C., et al. (2006). The evolution of the star formation activity in galaxies and its dependence on environment. Astrophys. J. 642, 188. doi: 10.1086/500666
Poggianti, B. M., Desai, V., Finn, R., Bamford, S., De Lucia, G., Varela, J., et al. (2008). The relation between star formation, morphology, and local density in high-redshift clusters and groups. Astrophys. J. 684, 888. doi: 10.1086/589936
Poggianti, B. M., Fasano, G., Bettoni, D., Cava, A., Dressler, A., Vanzella, E., et al. (2009). The evolution of spiral, S0, and elliptical galaxies in clusters. Astrophys. J. 697:L137. doi: 10.1088/0004-637X/697/2/L137
Poggianti, B. M., Fasano, G., Omizzolo, A., Gullieuszik, M., Bettoni, D., Moretti, A., et al. (2015). Jellyfish galaxy candidates at low redshift. Astron. J. arXiv:1504.07105.
Postman, M., Franx, M., Cross, N. J. G., Holden, B., Ford, H. C., Illingworth, G. D., et al. (2005). The morphology-density relation in z ~ 1 clusters. Astrophys. J. 623, 721. doi: 10.1086/428881
Prieto, M., Eliche-Moral, M. C., Balcells, M., Cristóbal-Hornillos, D., Erwin, P., Abreu, D., et al. (2013). Evolutionary paths among different red galaxy types at 0.3 < z < 1.5 and the late buildup of massive E-S0s through major mergers. Mon. Not. R. Astron. Soc. 428, 999. doi: 10.1093/mnras/sts065
Qu, Y., Di Matteo, P., Lehnert, M. D., van Driel, W., and Jog, C. J. (2011). Minor mergers and their impact on the kinematics of old and young stellar populations in disk galaxies. Astron. Astrophys. 535, A5. doi: 10.1051/0004-6361/201116502
Querejeta, M., Eliche-Moral, M. C., Tapia, T., Borlaff, A., Rodr-guez-Pŕez, C., Zamorano, J., et al. (2015a). Formation of S0 galaxies through mergers. Bulge-disc structural coupling resulting from major mergers. Astron. Astrophys. 573, 78. doi: 10.1051/0004-6361/201424303
Querejeta, M., Eliche-Moral, M. C., Tapia, T., Borlaff, A., van de Ven, G., Lyubenova, M, et al. (2015b). Formation of S0 galaxies through mergers. Explaining angular momentum and concentration change from spirals to S0s. Astron. Astrophys. 579, 2. doi: 10.1051/0004-6361/201526354
Rasmussen, J., Ponman, T. J., Verdes-Montenegro, L., Yun, M. S., and Borthakur, S. (2008). Galaxy evolution in Hickson compact groups: the role of ram-pressure stripping and strangulation. Mon. Not. R. Astron. Soc. 388, 1245. doi: 10.1111/j.1365-2966.2008.13451.x
Robertson, B., Bullock, J. S., Cox, T. J., Di Matteo, T., Hernquist, L., Springel, V., et al. (2006). A merger-driven scenario for cosmological disk galaxy formation. Astrophys. J. 645, 986. doi: 10.1086/504412
Rudick, C. S., Mihos, J. C., Frey, L. H., and McBride, C. K. (2009). Tidal streams of intracluster light. Astrophys. J. 699:1518. doi: 10.1088/0004-637X/699/2/1518
Sandage, A. (1961). The Hubble Atlas of Galaxies. Washington, DC: Carnegie Institution of Washington.
Schweizer, F., Whitmore, B. C., and Rubin, V. C. (1983). Colliding and merging galaxies. II - S0 galaxies with polar rings. Astron. J. 88, 909.
Schweizer, F., and Seitzer, P. (1992). Correlations between UBV colors and fine structure in E and S0 galaxies - a first attempt at dating ancient merger events. Astron. J. 104, 1039. doi: 10.1086/116296
Sil'chenko, O. K., Proshina, I. S., Shulga, A. P., and Koposov, S. E. (2012). Ages and abundances in large-scale stellar discs of nearby S0 galaxies. Mon. Not. R. Astron. Soc. 427, 790. doi: 10.1111/j.1365-2966.2012.21990.x
Sivanandam, S., Rieke, M. J., and Rieke, G. H. (2010). A warm molecular hydrogen tail due to ram-pressure stripping of a cluster galaxy. Astrophys. J. 717:147. doi: 10.1088/0004-637X/717/1/147
Smith, G. P., Treu, T., Ellis, R. S., Moran, S. M., and Dressler, A. (2005). Evolution since z = 1 of the morphology-density relation for galaxies. Astrophys. J. 620, 78. doi: 10.1086/426930
Smith, R. J., Lucey, J. R., Hammer, D., Hornschemeier, A. E., Carter, D., Hudson, M. J., et al. (2010). Ultraviolet tails and trails in cluster galaxies: a sample of candidate gaseous stripping events in Coma. Mon. Not. R. Astron. Soc. 408, 1417. doi: 10.1111/j.1365-2966.2010.17253.x
Solanes, J. M., Manrique, A., Garc-a-Gómez, C., González-Casado, G., Giovanelli, R., and Haynes, M. P. (2001). The HI content of spirals. II. Gas deficiency in cluster galaxies. Astrophys. J. 548, 97. doi: 10.1086/318672
Somerville, R. S., and Primack, J. R. (1999). Semi-analytic modelling of galaxy formation: the local universe. Mon. Not. R. Astron. Soc. 310, 1087. doi: 10.1046/j.1365-8711.1999.03032.x
Spitzer, L., and Baade, W. (1951). Stellar populations and collisions of galaxies. Astrophys. J. 113, 413. doi: 10.1086/145406
Sun, M., Donahue, M., and Voit, G.M. (2007). Hα tail, intracluster HII regions, and star formation: ESO 137-001 in Abell 3627. Astrophys. J. 671, 190. doi: 10.1086/522690
Tapia, T., Eliche-Moral, M. C., Querejeta, M., Balcells, M., César González-García, A., Prieto, M., et al. (2014). Evolution induced by dry minor mergers onto fast-rotator S0 galaxies. Astron. Astrophys. 565, A31. doi: 10.1051/0004-6361/201321386
Treu, T., Ellis, R. S., Kneib, J.-P., Dressler, A., Smail, I., Czoske, O., et al. (2003). A wide-field hubble space telescope study of the cluster Cl 0024+16 at z = 0.4. I. Morphological distributions to 5 Mpc radius. Astrophys. J. 591, 53. doi: 10.1086/375314
Valentinuzzi, T., Woods, D., Fasano, G., Riello, M., D'Onofrio, M., Varela, J., et al. (2009). WINGS: a WIde-field nearby galaxy-cluster survey. III. Deep near-infrared photometry of 28 nearby clusters. Astron. Astrophys. 501, 851. doi: 10.1051/0004-6361/200811051
van den Bergh, S. (1976). A new classification system for galaxies. Astrophys. J. 206, 883. doi: 10.1086/154452
Varela, J., D'Onofrio, M., Marmo, C., Fasano, G., Bettoni, D., Cava, A., et al. (2009). WINGS: a WIde-field nearby galaxy-cluster Survey. II. Deep optical photometry of 77 nearby clusters. Astron. Astrophys. 497, 667. doi: 10.1051/0004-6361/200809876
Veilleux, S., Cecil, G., and Bland-Hawthorn, J. (2005). Galactic winds. Annu. Rev. Astron. Astrophys. 43, 769. doi: 10.1146/annurev.astro.43.072103.150610
Vollmer, B., Soida, M., Chung, A., Chemin, L., Braine, J., Boselli, A., et al. (2009). Ram pressure stripping of the multiphase ISM in the Virgo cluster spiral galaxy NGC 4438. Astron. Astrophys. 496, 669. doi: 10.1051/0004-6361/200811140
Vulcani, B., Poggianti, B. M., Dressler, A., Fasano, G., Valentinuzzi, T., Couch, W., et al. (2011). The evolution of early-type galaxies in clusters from z ~ 0.8 to z ~ 0: the ellipticity distribution and the morphological mix. Mon. Not. R. Astron. Soc. 413, 921. doi: 10.1111/j.1365-2966.2010.18182.x
Vulcani, B., Poggianti, B. M., Aragón-Salamanca, A., Fasano, G., Rudnik, G., Valentinuzzi, T., et al. (2011). Galaxy stellar mass functions of different morphological types in clusters, and their evolution between z = 0.8 and 0. Mon. Not. R. Astron. Soc. 412, 246. doi: 10.1111/j.1365-2966.2010.17904.x
White, S. D. M., Clowe, D. I., Simard, L., Rudnick, G., De Lucia, G., Aragón-Salamanca, A., et al. (2005). EDisCS - the ESO distant cluster survey. Sample definition and optical photometry. Astron. Astrophys. 444, 365. doi: 10.1051/0004-6361:20042068
Worthey, G., Faber, S. M., Jésus Gonzales, J., and Burstein, D. (1994). Old stellar populations. 5: absorption feature indices for the complete LICK/IDS sample of stars. Astrophys. J. Suppl. Ser. 94, 687. doi: 10.1086/192087
Wu, P.-F., Gal, R. R., Lemaux, B. C., Kocevski, D. D., Lubin, L. M., Rumbaugh, N., et al. (2014). Star formation quenching in high-redshift large-scale structure: post-starburst galaxies in the Cl 1604 supercluster at z ~ 0.9. Astrophys. J. 792:16. doi: 10.1088/0004-637X/792/1/16
Yagi, M., Komiyama, Y., Yoshida, M., Furusawa, H., Kashikawa, N., Koyama, Y., et al. (2007). The remarkable 60 × 2 kpc optical filament associated with a poststarburst galaxy in the coma cluster. Astrophys. J. 660, 1209–1214. doi: 10.1086/512359
Yoshida, M., Yagi, M., Komiyama, Y., Furusawa, H., Kashikawa, N., Koyama, Y., et al. (2008). Strange filamentary structures (“Fireballs”) around a merger galaxy in the coma cluster of galaxies. Astrophys. J. 688, 918. doi: 10.1086/592430
Keywords: clusters of galaxies, galaxy formation, galaxy morphology
Citation: D'Onofrio M, Marziani P and Buson L (2015) The transformation of Spirals into S0 galaxies in the cluster environment. Front. Astron. Space Sci. 2:4. doi: 10.3389/fspas.2015.00004
Received: 15 June 2015; Accepted: 13 August 2015;
Published: 31 August 2015.
Edited by:
Edi Bon, Astronomical Observatory, SerbiaReviewed by:
Eija Irene Laurikainen, University of Oulu, FinlandJosé María Solanes, University of Barcelona, Spain
Copyright © 2015 D'Onofrio, Marziani and Buson. This is an open-access article distributed under the terms of the Creative Commons Attribution License (CC BY). The use, distribution or reproduction in other forums is permitted, provided the original author(s) or licensor are credited and that the original publication in this journal is cited, in accordance with accepted academic practice. No use, distribution or reproduction is permitted which does not comply with these terms.
*Correspondence: Mauro D'Onofrio, Department of Physics and Astronomy, University of Padova, Vicolo Osservatorio 3, 35122 Padova, Italy, mauro.donofrio@unipd.it