HE0359-3959: An Extremely Radiating Quasar
 M. L. Martínez-Aldama1*
  A. Del Olmo1
  P. Marziani2
  C. A. Negrete3
  D. Dultzin4
  M. A. Martínez-Carballo1
- 1Instituto de Astrofísica de Andalucía, IAA-CSIC, Granada, Spain
- 2INAF, Osservatorio Astronomico di Padova, Padua, Italy
- 3CONACYT Research Fellow, Instituto de Astronomía, Universidad Nacional Autonoma de Mexico, Mexico City, Mexico
- 4Instituto de Astronomía, Universidad Nacional Autonoma de Mexico, Mexico City, Mexico
We present a multiwavelength spectral study of the quasar HE0359-3959, which has been identified as an extreme radiating source at intermediate redshift (z = 1.5209). Along the spectral range, the different ionic species give information about the substructures in the broad line region. The presence of a powerful outflow with an extreme blueshifted velocity of ~–6,000 ± 500 km s−1 is shown in the Civλ1549 emission line. A prominent blueshifted component is also associated with the 1900Å blend, resembling the one observed in Civλ1549. We detect a strong contribution of very the low–ionization lines, FeII and Near-Infrared Ca II triplet. We find that the physical conditions for the low, intermediate, and high–ionization emission lines are different, which indicate that the emission lines are emitted in different zones of the broad line region. The asymmetries shown by the profiles reveal different forces over emitter zones. The high–ionization region is strongly dominated by radiation forces, which also affect the low and intermediate–ionization emitter region, commonly governed by virial motions. These results support the idea that highly radiating sources host a slim disk.
1. Extreme Population a Sources Along the 4DE1 Main Sequence
The 4D Eigenvector 1 (4DE1) parameter space offers a formalism to distinguish and classify type 1 Active Galactic Nuclei (AGN) considering their spectral properties (Sulentic et al., 2000a,b). The Full Width at Half Maximum (FWHM) of Hβ broad component (HβBC), the strength of optical FeII blend at 4,570Å described by the ratio RFeII = I(FeII)/I(HβBC), the velocity shift of the CIVλ1549 profile, and soft X-ray photon index (Γsoft), provide four observationally independent dimensions of the Eigenvector 1. In the 4DE1 optical plane, the type 1 AGN occupy a well-defined sequence, driven mainly by the Eddington ratio, L/LEdd. Along this sequence we observe a variation of the physical parameters and orientation. Then, 4DE1 could be revealing an evolution sequence for type 1 AGN (Sulentic et al., 2000a; Marziani et al., 2010; Zamfir et al., 2010). For more information about the 4DE1 and update of results, see Marziani et al. in this volume.
Using the 4DE1 we identify two populations with different spectral features: A and B. Population A has a FWHM (HβBC) ≤4,000 km s−1. It shows large blue asymmetries in the high-ionization lines like CIVλ1549, and it is majority populated by radio quiet sources. In contrast, population B shows a FWHM (HβBC)>4,000 km s−1 and it is mostly composed of radio-loud sources (Sulentic et al., 2002; Zamfir et al., 2010). Each population can be divided into small bins with ΔFWHM (HβBC) = 4,000 km s−1 and ΔRFeII = 0.5, defining subpopulations shown in the Figure 1. In this paper we focus in the subpopulation A3 and A4 (RFeII > 1), which have been identified as highly radiating sources (xA, Marziani and Sulentic, 2014). These kind of sources show high Eddington ratios (L/LEdd > 0.2) probably produced by a slim disk, which is geometrically and optically thick and it could be formed in an advection-dominated accretion flow (Abramowicz et al., 1988; Abramowicz and Straub, 2014).
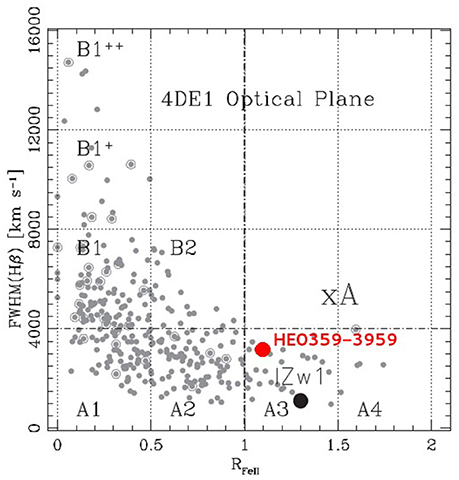
Figure 1. 4DE1 Optical Plane reproduced from Marziani and Sulentic (2014). Gray points correspond to the sample of 470 bright low-z QSOs from Zamfir et al. (2010). The plane is divided in bins according to Sulentic et al. (2002). Extreme accretor population A sources (xA) are located in A3 and A4 bins. The black dot indicates the position of 1 Zw 1, the prototype of low-z xA sources. And, the red dot marks the location of HE0359-3959, an extreme xA source with high-z.
We have found selection criteria to identify the xA sources based on the 4DE1 formalism. In the optical region they show a RFeII > 1 (high intensity of FeII) and in the UV range AlIIIλ1860/SiIII]λ1892 ≥ 0.5 and CIII]λ1909/SiIII]λ1892 ≤ 1.0 (Marziani and Sulentic, 2014). Also, they show strong blueshifted components associated with the high ionization lines, for example in CIVλ1549 emission line, indicating the presence of outflows. More details about the xA sources behavior can be found in Martínez-Aldama et al. of this volume.
1.1. HE0359-3959: An Extreme xA Source
In our extreme luminosity Hamburg-ESO sample (Marziani et al., 2009; Sulentic et al., 2017), we have identified four cases of highly radiating quasars that show an extreme behavior, i.e., a high Eddington ratio and a strong blue asymmetry [c(1/2) <–4,000 km s−1; centroid at half intensity] in the CIVλ1549 profile (Sulentic et al., 2017). The most extreme case corresponds to the quasars HE0359-3959, with z = 1.5209, log(Lbol) = 47.6 erg s−1 and a RFeII = 1.12. It is cataloged as an A3 source (see Figure 1).
The aim of this paper is to analyze the spectral behavior of an extreme xA source, the quasar HE0359–3959. We performed multicomponent fits in a wide spectral range: UV, optical and Near–Infrared (Section 2); which gives us information about the dynamics and the physical conditions of the broad line region (BLR) (Section 3). In Section 4, we summarize the main results of our work.
2. Observations, Data Reduction, and Multicomponent Fitting
2.1. Observations and Data Reduction
Ultraviolet (UV), optical, and Near–Infrared spectra were observed with the Very Large Telescope (VLT-ESO). Optical and Near–Infrared spectra were obtained with the Infrared Spectrometer And Array Camera (ISAAC; decommissioned in 2013) using a slit of 0.6″. The near–infrared spectrum was observed in 2010 in the K band with a total exposure time of 1,120 s. The optical spectrum was observed in 2004 in the J band with a total exposure time of 3,600 s. For the ultraviolet spectrum we used the Focal Reducer and low dispersion Spectrograph (FORS1) and a slit of 1.0″ with a total exposure time of 1,440 s. It was observed in 2008. The data reduction was done using the IRAF package. The procedures followed are explained in Marziani et al. (2009), Martínez-Aldama et al. (2015), and Sulentic et al. (2017).
2.2. Multicomponent Fits
We perform multicomponent fits using SPECFIT, an IRAF routine (Kriss, 1994) to get the information of the most important emission lines. In each spectral range we fit a local continuum. The FWHM of all the broad components (BC) for Hβ, AlIIIλ1860, SiIII]λ1892, CIVλ1549, and SiIVλ1397 was taken equal. In the Figure 2, we present the multicomponents fits after continuum subtraction, for the CIVλ1549 and Ca II triplet range. The rest of the fits will be shown in an upcoming paper.
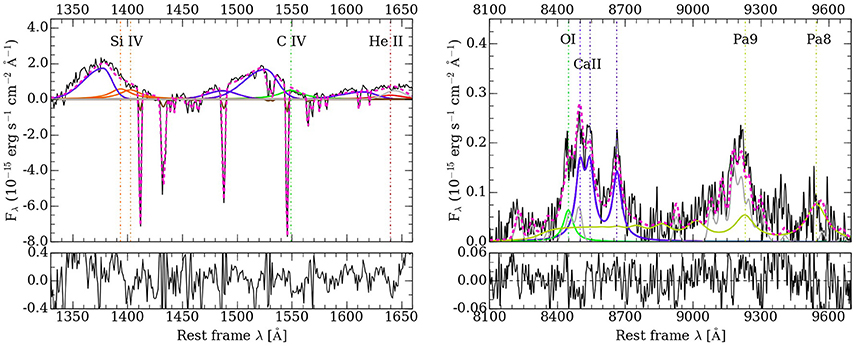
Figure 2. Multicomponent analysis on the UV, optical and NIR spectra of HE0359-3959 after continuum subtraction. (Top panels): In the left side is shown the UV spectrum, while in the right one is shown the near–infrared spectrum. The different components [broad (BC), BLUE, and narrow (NC)] in the line fitting are specified in each panel. Vertical lines indicate the rest-frame obtained through HβNC. The gray line marks the FeII contribution. The vertical scale represents the relative flux in units of 10−15 erg s−1 cm−2 Å−1. (Bottom panel): Residuals of the fittings. The horizontal scale is the radial velocity shift in km s−1. In all the panels the horizontal scale represents the rest–frame wavelength in Å.
3. Results
3.1. Multiwavelength Analysis
Low–ionization lines (LIL) have an ionization potential (IP) ≲20 eV. The Hβ line is the prototype of LIL. In population A3 and A4 sources Hβ has associated a blueshifted component (Bachev et al., 2004). In the case of HE0359-3959, the blueshifted component has a contribution to the total flux of ~9%, and shows a centroid a half intensity of c(1/2)≈−500 ± 70 km s−1.
The FeII (IP~16 eV) has an important contribution in the optical and near–infrared regions. To reproduce it we used the templates modeled by Marziani et al. (2009) and Garcia-Rissmann et al. (2012) for the optical and near–infrared ranges, respectively. Several works have found (Persson, 1988; Ferland and Persson, 1989; Joly, 1989; Dultzin-Hacyan et al., 1999; Martínez-Aldama et al., 2015) a close relationship between the FeII and the NIR Ca II λ8498, λ 8542, and λ8662 Å triplet. This relation is very well appreciable in this object: as well as the optical FeII is strong, the NIR Ca II triplet also is. It is the first time where we observe the Ca II triplet lines isolated at high redshift. Strong intensities of both ions imply an extremely low-ionization degree (U < 10 −2; U: ionization parameter) and a high density (nH ~ 1011–13 cm−3) (Baldwin et al., 2004; Matsuoka et al., 2007; Martínez-Aldama et al., 2015).
In the UV region, the 1900Å blend is formed by two intermediate–ionization lines (IIL; IP ~ 20–40 eV), AlIIIλ1860 and SiIII]λ1892, which are accompanied by CIII]λ1909 and some FeIII transitions. In this blend we appreciate a blueshifted component. This component should be most likely associated with AlIIIλ1860. Respect to AlIIIλ1860, the blueshifted component has a contribution of the total profile of 60%. The centroid a half intensity is c(1/2)≈−3,200 ± 250 km s−1, which indicates the presence of an outflow generated by radiation forces presented in the intermediate–ionization lines (Marziani et al., 2017). On the other hand, considering the high intensity of AlIIIλ1860, SiIII]λ1892, Ca II and FeII, it could suggest a possible chemical enrichment of the BLR (Juarez et al., 2009).
High ionization lines (HIL; IP > 40 eV), CIVλ1549, HeIIλ1640, and SiIVλ1397, show a prominent blueshifted component. We find that the blue component has a contribution of 76, 62, and 57% to the total flux of CIVλ1549, HeIIλ1640, and SiIVλ1397, respectively. The CIVλ1549 reaches c(1/2) ~−6,000 ± 500 km s−1, while HeIIλ1640 and SiIVλ1397 c(1/2) ~−4,000 ± 550 km s−1. The velocities reached are ones of the highest found in the literature (Richards et al., 2011; Coatman et al., 2016; Sulentic et al., 2017). Then, it indicates that the full profile is dominated by an outflow and suggests the disk plus wind scenario (Gaskell, 1982; Richards et al., 2002, 2011).
3.2. Physical Properties of HE0359-3959
In order to study the physical properties of the quasar HE0359-3959, we built a grid of photoionization simulations using the CLOUDY code (Ferland et al., 1998, 2013). For our simulations we considerer a Mattews and Ferland continuum (Mathews and Ferland, 1987), a plane-parallel geometry, a metallicity 5Z⊙ with an overabundance of Al and Si with respect to carbon (by a factor of three), and a column density of Nc = 1023 cm−2. See Negrete et al. (2012) for more details. Our simulations span the density range 7.00 ≤ log (nH) ≤ 14.00 and −4.5 ≤ log (U) ≤ 0.00 for the ionization parameter, in intervals of 0.25 dex. More details about the CLOUDY simulations can be found in Negrete et al. (2014). Using the UV lines, we define three groups of diagnostic ratios::
• The flux ratio AlIIIλ1860/SiIII]λ1892 is a useful density diagnostic.
• The flux ratio SiIVλ1397/SiIII]λ1892 for the ionization parameter.
• The flux ratio CIVλ1549/SiIVλ1397 is mainly sensitive to the relatives abundances of C and Si.
In Figure 3 is shown the result of the simulations. We obtained that the flux ratios are intersected in log(nH) = 12.32 cm−3 and log(U) = −2.95. Compared to not highly radiating AGNs (Negrete et al., 2013), this source shows a high density and a low ionization parameter, which marks a different behavior in the BLR, probably causing by the slim disk hosted in these kind of sources. Taking into account the high intensity of AlIIIλ1860, FeII, and Ca II we conclude that effectively the low–ionization emitter zone has a high density and low–ionization parameter.
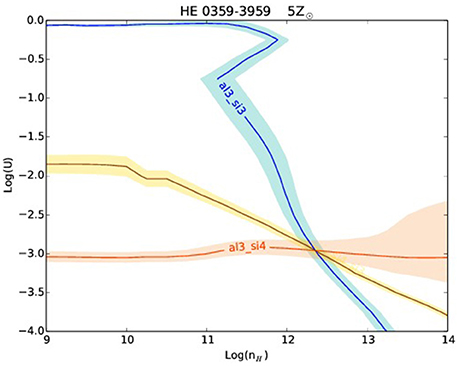
Figure 3. Isocontors for HE0359-3959 with 5Z⊙ and an overabundance of Al and Si. The blue line indicates the flux ratio AlIIIλ1860/SiIII]λ1892, the yellow one indicates the ratio SiIVλ1397/SiIII]λ1892, and the orange corresponds to the AlIIIλ1860/SiIVλ1397. Shadows associated with each line indicate the error. The flux ratios are intersected in nH·U = 9.27 ± 0.39.
Negrete et al. (2012) proposed a new method to determine the size of the BLR (rBLR) and the black hole mass (MBH) based on the product nH·U and independently of redshift. This method gives similar results to the obtained from the classical methods such as reverberation mapping at low–z (Negrete et al., 2014). Knowing the product of nH·U obtained from the CLOUDY simulations, we compute the size of the BLR (rBLR) and considering the FWHM of the broad components as the velocity dispersion, we can get the black hole mass (MBH) and the Eddington ratio. The size of the BLR is log(rBLR) = 18.37 ± 0.04 cm and the black hole mass is log(MBH) = 9.52 ± 0.41 M⊙. These values are in agreement with the ones found for a large xA sample at high-redshift (Martínez-Aldama et al., in preparation).
The Eddington ratio for this source is L/LEdd = 0.74 ± 0.11. Considering that it shows a c(1/2)~−6,000 ± 500 km s−1 for CIVλ1549, we confirm the directly proportional relation between c(1/2) and L/LEdd. Indicating that L/LEdd could be the driver of the outflows (Sulentic et al., 2017).
4. Conclusions
The information given by the multiwavelength analysis indicates that in HE0359–3959 there is coexistence of substructures in the broad line region. Low and intermediate–ionization regions, where Hβ, AlIIIλ1860 and SiIII]λ1892 are emitted, are dense (nH~1011–12 cm−3) and optically thick (U ~10−2.5). They are mainly governed by virial motions and the presence of a blueshifted component indicates the influence of radiation forces. On the other hand, according to Marziani et al. (2010) the high–ionization region is less dense (nH~1010 cm−3, U ~10−1), pointing out a difference with the physical conditions shown by the low and intermediate–ionization lines.
High ionization lines are dominated by strong radiation forces, producing outflows in high–ionization lines like CIVλ1549, HeIIλ1640, and SiIVλ1397. The high Eddington ratio value suggests the presence of a slim optically thick disk which could be related to the extreme outflow properties observed in HE0359-3959. The presence of strong outflows has been related with the co–evolution of the active galactic nuclei and the host galaxy.
Author Contributions
MLM-A and PM: Data reduction, multicomponents fits, analysis, writing, revision. AD: Analysis, reduction, writing, revision. CN: Analysis, photoionization models, revision. DD: Analysis, revision. MAM-C: Data reduction, multicomponents fits.
Conflict of Interest Statement
The authors declare that the research was conducted in the absence of any commercial or financial relationships that could be construed as a potential conflict of interest.
Acknowledgments
MLM-A acknowledge the postdoctoral grant from the CONACyT. MLM-A, AD, and MAM-C acknowledge financial support from Spanish Ministry for Economy and Competitiveness through grants AYA2013-42227-P and AYA2016-76682-C3-3-1-P.
References
Abramowicz, M. A., Czerny, B., Lasota, J. P., and Szuszkiewicz, E. (1988). Slim accretion disks. Astrophys. J. 332, 646–658.
Abramowicz, M. A., and Straub, O. (2014). Accretion discs. Scholarpedia 9:2408. doi: 10.4249/scholarpedia.2408
Bachev, R., Marziani, P., Sulentic, J. W., Zamanov, R., Calvani, M., and Dultzin-Hacyan, D. (2004). Average ultraviolet quasar spectra in the context of eigenvector 1: a baldwin effect governed by the eddington ratio? Astrophys. J. 617, 171–183. doi: 10.1086/425210
Baldwin, J. A., Ferland, G. J., Korista, K. T., Hamann, F., and LaCluyzé, A. (2004). The origin of Fe II emission in active galactic nuclei. Astrophys. J. 615, 610–624. doi: 10.1086/424683
Coatman, L., Hewett, P. C., Banerji, M., and Richards, G. T. (2016). C IV emission-line properties and systematic trends in quasar black hole mass estimates. Mon. Not. R. Astron. Soc. 461, 647–665. doi: 10.1093/mnras/stw1360
Dultzin-Hacyan, D., Taniguchi, Y., and Uranga, L. (1999). “Where is the Ca II triplet emitting region in AGN?,” in Structure and Kinematics of Quasar Broad Line Regions, Vol. 175, Astronomical Society of the Pacific Conference Series, eds C. M. Gaskell, W. N. Brandt, M. Dietrich, D. Dultzin-Hacyan, and M. Eracleous (San Francisco, CA: Astronomical Society of the Pacific), 303.
Ferland, G. J., Korista, K. T., Verner, D. A., Ferguson, J. W., Kingdon, J. B., and Verner, E. M. (1998). CLOUDY 90: numerical simulation of plasmas and their spectra. Publ. Astron. Soc. Pac. 110, 761–778.
Ferland, G. J., and Persson, S. E. (1989). Implications of CA II emission for physical conditions in the broad-line region of active galactic nuclei. Astrophys. J. 347, 656–673.
Ferland, G. J., Porter, R. L., van Hoof, P. A. M., Williams, R. J. R., Abel, N. P., Lykins, M. L., et al. (2013). The 2013 release of cloudy. RMxAA 49, 137–163.
Garcia-Rissmann, A., Rodríguez-Ardila, A., Sigut, T. A. A., and Pradhan, A. K. (2012). A near-infrared template derived from I Zw 1 for the Fe II emission in active galaxies. Astrophys. J. 751:7. doi: 10.1088/0004-637X/751/1/7
Gaskell, C. M. (1982). A redshift difference between high and low ionization emission-line regions in QSOs - Evidence for radial motions. Astrophys. J. 263, 79–86.
Juarez, Y., Maiolino, R., Mujica, R., Pedani, M., Marinoni, S., Nagao, T., et al. (2009). The metallicity of the most distant quasars. Astron. Astrophys. 494, L25–L28.
Kriss, G. (1994). “Fitting models to UV and optical spectral data,” in Astronomical Data Analysis Software and Systems III, Vol. 61 Astronomical Society of the Pacific Conference Series, eds D. R. Crabtree, R. J. Hanisch, and J. Barnes (San Francisco, CA: Astronomical Society of the Pacific), 437.
Martínez-Aldama, M. L., Dultzin, D., Marziani, P., Sulentic, J. W., Bressan, A., Chen, Y., et al. (2015). O I and Ca II observations in intermediate redshift quasars. Astrophys. J. 217:3. doi: 10.1088/0067-0049/217/1/3
Marziani, P., Del Olmo, A., Martínez-Aldama, M. L., Dultzin, D., Negrete, C., Bon, E., et al. (2017). Quasar black hole mass estimates from high-ionization lines: breaking a taboo? Atoms 5, 33–47. doi: 10.3390/atoms5030033
Marziani, P., and Sulentic, J. W. (2014). Highly accreting quasars: sample definition and possible cosmological implications. Mon. Not. R. Astron. Soc. 442, 1211–1229. doi: 10.1093/mnras/stu951
Marziani, P., Sulentic, J. W., Negrete, C. A., Dultzin, D., Zamfir, S., and Bachev, R. (2010). Broad-line region physical conditions along the quasar eigenvector 1 sequence. Mon. Not. R. Astron. Soc. 409, 1033–1048. doi: 10.1111/j.1365-2966.2010.17357.x
Marziani, P., Sulentic, J. W., Stirpe, G. M., Zamfir, S., and Calvani, M. (2009). VLT/ISAAC spectra of the Hβ region in intermediate-redshift quasars. III. Hβ broad-line profile analysis and inferences about BLR structure. Astron. Astrophys. 495, 83–112. doi: 10.1051/0004-6361:200810764
Mathews, W. G., and Ferland, G. J. (1987). What heats the hot phase in active nuclei? Astrophys. J. 323, 456–467.
Matsuoka, Y., Oyabu, S., Tsuzuki, Y., and Kawara, K. (2007). Observations of O I and Ca II emission lines in Quasars: implications for the site of Fe II line emission. Astrophys. J. 663, 781–798. doi: 10.1086/518399
Negrete, C. A., Dultzin, D., Marziani, P., and Sulentic, J. W. (2012). Broad-line region physical conditions in extreme population a Quasars: a method to estimate central black hole mass at high redshift. Astrophys. J. 757:62. doi: 10.1088/0004-637X/757/1/62
Negrete, C. A., Dultzin, D., Marziani, P., and Sulentic, J. W. (2013). Reverberation and photoionization estimates of the broad-line region radius in low-z Quasars. Astrophys. J. 771:31. doi: 10.1088/0004-637X/771/1/31
Negrete, C. A., Dultzin, D., Marziani, P., and Sulentic, J. W. (2014). A new method to obtain the broad line region size of high redshift Quasars. Astrophys. J. 794:95. doi: 10.1088/0004-637X/794/1/95
Persson, S. E. (1988). Calcium infrared triplet emission in active galactic nuclei. Astrophys. J. 330, 751–765.
Richards, G. T., Kruczek, N. E., Gallagher, S. C., Hall, P. B., Hewett, P. C., Leighly, K. M., et al. (2011). Unification of luminous type 1 Quasars through C IV emission. Astrophys. J. 141, 167–183. doi: 10.1088/0004-6256/141/5/167
Richards, G. T., Vanden Berk, D. E., Reichard, T. A., Hall, P. B., Schneider, D. P., SubbaRao, M., et al. (2002). Broad emission-line shifts in Quasars: an orientation measure for radio-quiet quasars? Astrophys. J. 124, 1–17. doi: 10.1086/341167
Sulentic, J. W., Del Olmo, A., Marziani, P., Martínez-Carballo, M. A., D'Onofrio, M., Oyabu, S., et al. (2017). What does CIV1549 tell us about the physical driver of the Eigenvector Quasar Sequence? Astron. Astrophys. arXiv:1708.03187
Sulentic, J. W., Marziani, P., and Dultzin-Hacyan, D. (2000a). Phenomenology of broad emission lines in active galactic nuclei. Annu. Rev. Astron. Astrophys. 38, 521–571. doi: 10.1146/annurev.astro.38.1.521
Sulentic, J. W., Marziani, P., Zamanov, R., Bachev, R., Calvani, M., and Dultzin-Hacyan, D. (2002). Average quasar spectra in the context of eigenvector 1. Astrophys. J. 566, L71–L75. doi: 10.1086/339594
Sulentic, J. W., Zwitter, T., Marziani, P., and Dultzin-Hacyan, D. (2000b). Eigenvector 1: an optimal correlation space for active galactic nuclei. Astrophys. J. 536, L5–L9.
Keywords: quasars: emission lines, quasars: outflows, quasars: individuals HE0359-3959, quasars: supermassive black holes, galaxy evolution: feedback
Citation: Martínez-Aldama ML, Del Olmo A, Marziani P, Negrete CA, Dultzin D and Martínez-Carballo MA (2017) HE0359-3959: An Extremely Radiating Quasar. Front. Astron. Space Sci. 4:29. doi: 10.3389/fspas.2017.00029
Received: 31 August 2017; Accepted: 09 October 2017;
Published: 28 November 2017.
Edited by:
Jirong Mao, Yunnan Observatories, National Astronomical Observatories (CAS), ChinaReviewed by:
Andrea Marinucci, Roma Tre University, ItalyMilan S. Dimitrijevic, Astronomical Observatory, Serbia
Copyright © 2017 Martínez-Aldama, Del Olmo, Marziani, Negrete, Dultzin and Martínez-Carballo. This is an open-access article distributed under the terms of the Creative Commons Attribution License (CC BY). The use, distribution or reproduction in other forums is permitted, provided the original author(s) or licensor are credited and that the original publication in this journal is cited, in accordance with accepted academic practice. No use, distribution or reproduction is permitted which does not comply with these terms.
*Correspondence: M. L. Martínez-Aldama, maryloli@iaa.es