Reverberation Mapping of High-Luminosity Quasars
 Shai Kaspi
 William N. Brandt2,3,4
 - 1Raymond and Beverly Sackler Faculty of Exact Sciences, School of Physics and Astronomy, Tel-Aviv University, Tel-Aviv, Israel
- 2Department of Astronomy and Astrophysics, Pennsylvania State University, University Park, PA, United States
- 3Institute for Gravitation and the Cosmos, Pennsylvania State University, University Park, PA, United States
- 4Department of Physics, Pennsylvania State University, University Park, PA, United States
- 5Department of Physics, University of North Texas, Denton, TX, United States
Over the past three decades reverberation mapping (RM) has been applied to about 100 AGNs. Their broad line region (BLR) sizes were measured and yielded mass estimates of the black holes in their center. However, very few attempts were carried out for high-luminosity quasars, at luminosities higher than 1046 erg/sec in the optical. Most of these attempts failed since RM of such quasars is difficult due to a number of reasons, mostly due to the long time needed to monitor these objects. During the past two decades we carried out a RM campaign on six high-luminosity quasars. This contribution presents some of the final light curves of that RM campaign in which we measured the BLR size in C IV of three of the objects (S5 0836+71, SBS 1116+603, and SBS 1425+606). We present the C IV BLR size and luminosity relation over eight orders of magnitude in luminosity, pushing the luminosity limit to its highest point so far.
1. Introduction
Reverberation Mapping (RM) is a technique to estimate the size of the Broad Line Region (BLR) in Active Galactic Nuclei (AGNs). The technique relies on using the variability of the central AGN power source and the response of the gas in the BLR to measure a time delay which is used as a measure for the BLR distance from the central source (see e.g., Peterson, 1993; Netzer and Peterson, 1997). Over the past three decades RM has been carried out successfully for almost 100 AGNs (e.g., (Kaspi et al., 2000; Bentz et al., 2006; Bentz and Katz, 2015; Du et al., 2015; Shen et al., 2016); and references therein) and a relation between the BLR size and the luminosity of AGNs was found. Using the assumption that the BLR gas has virialized motions around the central black hole of the AGN and that the velocity of the gas can be inferred from the width of the broad emission lines we can estimate the mass of the central black hole.
The first discussions about the time dependence of emission-line intensities from nebulea that are photoionized by a central source with variable continuum flux was done by Bahcall et al. (1972). Only a decade later Blandford and McKee (1982) put the idea into mathematical formulation and coined the term “Reverberation Mapping.” According to this formulation the response of the nebula depends on its geometry and velocity field, and is given by the “transfer function,” Ψ(ν, τ). The relationship between the continuum light-curve C(t) and the emission-line light-curve L(ν, t) can be described by
which is known as the “transfer equation.” The aim is to use the observables C(t) and L(ν, t) to solve this integral equation for Ψ(ν, τ), and thus infer the geometry and kinematics of the BLR. However, usually the observed light curves do not have the high quality, sampling, and length, that are needed to solve this equation by Fourier methods using the convolution theorem. Thus, the more common use is to solve the one-dimensional transfer function (which is the same equations as above but without the dependence in ν) by means of cross correlation of the line light curve with the continuum light curve. The peak of this cross correlation gives the time lag between the two light curves, and this time lag multiplied by the speed of light, c, is considered as a measure for the size of the BLR, RBLR.
Using the assumption that the BLR is in a Keplerian motion around the continuum central source, and equaling the centripetal force of the clouds with the gravity force on them toward the central source, one can find the mass of the central source to be , where G is the Gravitational constant, v is a measure of the BLR velocity, and f is a constant which represent the geometry of the BLR (e.g., Onken et al., 2004). The BLR velocity, ν is measured from the line width, either as the Full Width Half Maximum of the line, or the the line dispersion (i.e., the second moment of as defined by Peterson et al., 2004). The choice of method to define the velocity also changes the f factor that is used, as well as the assumed geometry, but overall f is of order of unity.
All objects studied thus far using RM have optical luminosities of up to 1046 erg/sec. Only a few attempts of RM for higher luminosity AGNs were carried out thus far and with very limited success (e.g., Welsh et al., 2000; Trevese et al., 2014). Such attempts are difficult to carry out due to several reasons: higher luminosity AGNs have larger BLR distances from the central source and longer variability time scales. Thus, monitoring periods of order a decade are needed for such projects and observations cadence needs to be of order a month. Telescope time allocation committees are usually reluctant to commit telescope time for such long periods. Also, the variability amplitude of high-luminosity AGNs are smaller than low-luminosity AGNs and the BLR size is larger, thus causing the line response to be smeared making line variations harder to detect. Yet another difficulty is that the light curves are stretched by the cosmic time dilation, further extending the monitoring period, thus the response of the BLR gas is harder to detect.
Most of the AGNs which were measured with reverberation mapping thus far were observed using the Hβ emission line and this is the most commonly used line for these studies of low-redshift, low-luminosity AGNs. High-luminosity AGNs are also generally at high redshift (order of z ~ 2–4), thus observations with optical telescopes are monitoring the UV lines (e.g., Lyα, C IV, C III], and Mg II). Since different emission lines are emitted from different parts of the BLR it is hard to compare between objects which were measured in different emission lines and this adds to the difficulties of such studies.
In spite of the above difficulties we initiated two decades ago a reverberation mapping campaign on several high-luminosity quasars. A detailed description of this observing campaign and some initial results from the first 5 years were presented in Kaspi et al. (2007). In this contribution we present some of the final light curves from the campaign and some of the tentative final results. In section 2 we briefly describe the project, how the sample was selected, the observations of the sample, and some final light curves of the sample. In section 3 we present an analysis of the light curve and present the C IV BLR size for three of the objects in our sample (S5 0836+71, SBS 1116+603, and SBS 1425+606) and its relation with the UV luminosity of the AGN.
We note the contribution of Lira et al. to these proceedings which describes another reverberation mapping campaign on high-luminosity quasars and which yields similar results to the results we describe in this contribution.
2. The Project, Sample Selection, and Observations
In 1995 we started photometric monitoring of 11 quasars at the Wise Observatory, and in 2000 we started spectroscopic monitoring of 6 of them with the Hobby-Eberly Telescope (HET; Ramsey et al., 1998). The objects in our sample are in the optical luminosity range of erg/sec, redshift range of 2 ≲ z ≲ 3.4, observed magnitudes of V ≲ 18, and have high declination in order to maximize the monitoring period during the year from northern hemisphere telescopes.
The objects were observed photometrically each month in the B and R filters for about 8 months each year. Spectroscopic observations were obtained ~3 times each year, evenly spaced over a period of about 6 months. In order to achieve quality cross calibration between the individual observations we used a comparison star aligned with the quasar in the spectrograph's slit (e.g., Kaspi et al., 2000).
Light curves for two of the objects, SBS 1116+603 and SBS 1233+594 are shown in Figures 1, 2. All objects in our sample show continuum variations of about 20 to 60% measured relative to the minimum flux of the light curve. Line variations are detected only in some of the lines we monitored. This could be a result of the low amplitude of the line variations that our measurements could not detect, or that the continuum signal processed trough the large BLR is smeared in such a way that there are no variations in the line light curve.
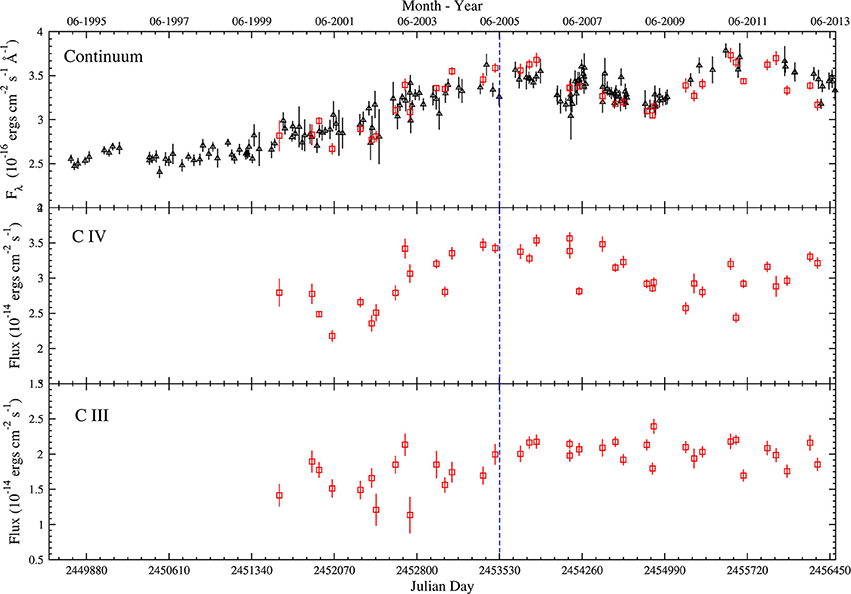
Figure 1. Light curves for SBS 1116+603. Red squares are points measured from the spectroscopic data and black triangles are points measured from the photometric data. The top panel is the continuum light curve (spectroscopic points measured on the red side of the C III] line). The middle panel and lower panel are line light curves for C IV and C III], respectively. Data up to the blue vertical dashed line were published in Kaspi et al. (2007).
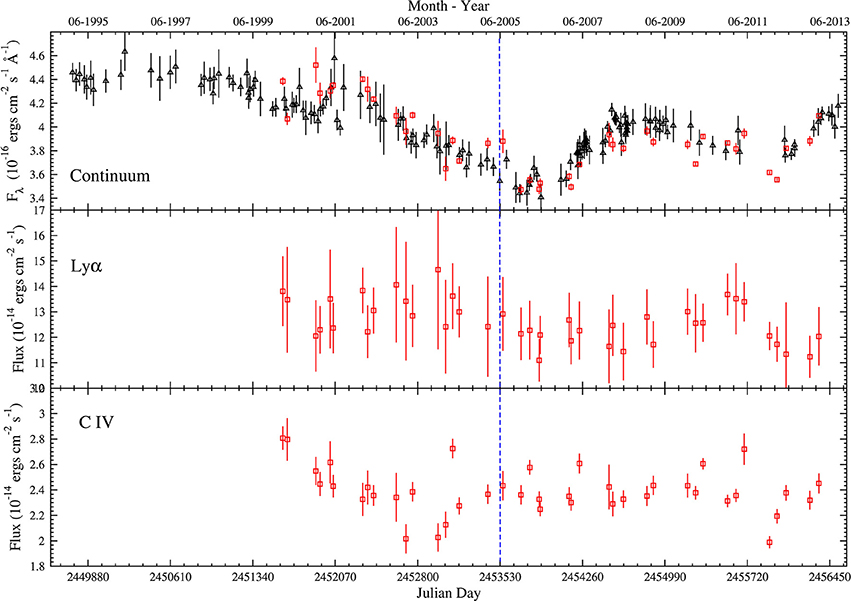
Figure 2. Light curves for SBS 1233+594. Red squares are points measured from the spectroscopic data and black triangles are points measured from the photometric data. The top panel is the continuum light curve (spectroscopic points measured on the red side of the C IV line). The middle panel and lower panel are line light curves for Lyα and C IV, respectively. Data up to the blue vertical dashed line were published in Kaspi et al. (2007).
3. Analysis and Results
In order to estimate the BLR size we use two methods which are commonly used for that purpose. One method is the interpolated cross-correlation function (ICCF: White and Peterson, 1994). In this method one light curve is cross correlated with a linear interpolation of the second light curve, then the second light curve is cross correlated with a linear interpolation of the first light curve, and then the final cross correlation is the average of these two cross correlation functions. The second method is the z-transformed discrete correlation function (ZDCF: Alexander, 1997) which is an improvement of the Discrete Correlation Function (DCF) method suggested by Edelson and Krolik (1988). The ZDCF applies Fisher's z transformation to the correlation coefficients, and uses equal population bins instead of the equal time bins that are used in the DCF. The two methods yield similar results and in the following we use the ICCF method and estimate the uncertainties on the time lags using the model-independent Monte Carlo method called Flux Randomization/Random Subset Selection (FR/RSS) of Peterson (1993). We find significant time lags for C IV in three of our six objects, for the C III] line in one of the objects, and a possible time lag of Lyα in one of the objects. The cross correlation functions (CCFs) for the light curves from Figures 1, 2 are shown in Figure 3.
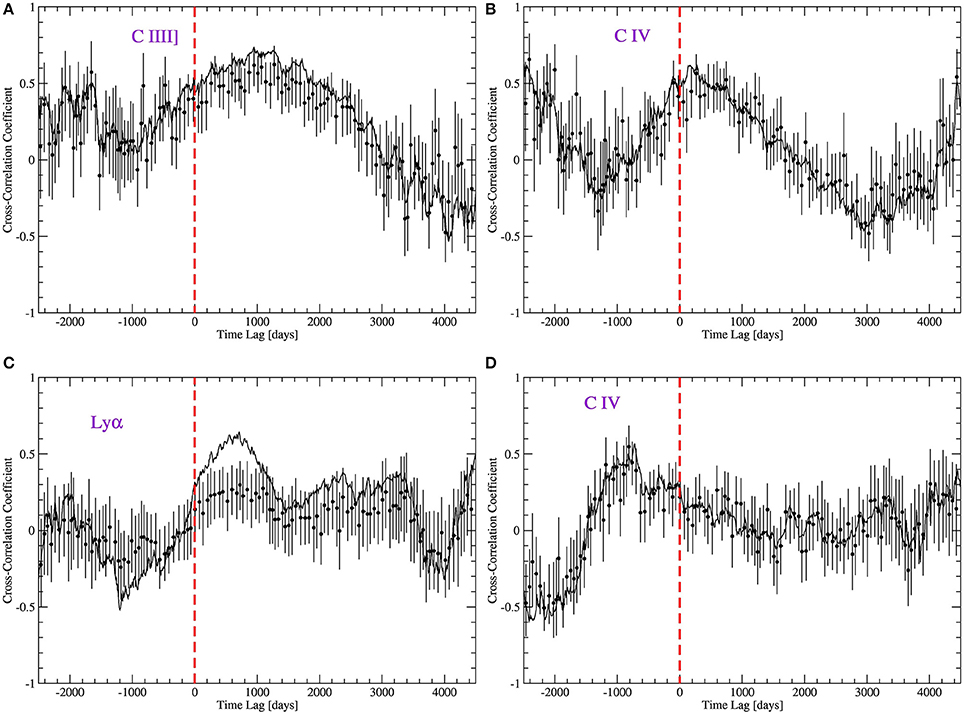
Figure 3. CCFs for the light curves shown in Figures 1, 2. (A,B) are the CCFs of Lyα and C IV vs. the continuum of SBS 1233+594. (C,D) are the CCFs of Lyα and C IV vs. the continuum of SBS 1233+594. The ICCF method is shown as a solid line and the ZDCF method is shown as filled circles with uncertainties. Time lags are given in the observed frame.
As can be seen in Figure 3C for the Lyα line of SBS 1233+594, the ICCF gives a peak which is at days in the rest frame. The formal negative 1σ uncertainty includes the possibility that no time lag is detected, i.e., the result is not significant. This is also hinted at from the fact that the ZDCF in Figure 3C shows no significant peak. Looking at the light curve of this Lyα line in Figure 2 it is clear that the peak in the ICCF comes from the two peaks in the line light curve around JDs of 2452900 and 2455700 which follow the peaks in the continuum light curve at JDs 2452300 and 2455100. However, the uncertainties on the line-flux measurements are very large and this causes the uncertainty in the time lag determination to be large. The main reason that the uncertainty on the line measurements are large is because in this object the optical spectrum includes only part of the Lyα line, and thus our measurements include only the red half of the line.
Figures 3A,B show the CCFs for the C III] and C IV lines of SBS 1116+603. We find significant time lags of days for the C III] line and days for the C IV line (both measured in the rest frame). The lower ionization line is emitted further away from the central continuum source than the higher ionization line, in accordance with the known stratification of the BLR. For S5 0836+71 and SBS 1425+606 we find a C IV time lags of and days, respectively.
We note that half of the quasars in our sample are radio loud and the light curves and time lags interpretation in these objects may be complicated by the additional jet contribution to the continuum driving the line emission. This may also be the reason why we did not detect a time lag in some of our radio loud objects. However, with respect to the objects presented here, SBS 1233+594 is a radio quiet quasar and we did not find a significant time lag for its lines, while SBS 1116+603 is a radio loud quasar and we find time lags for the two lines measured.
Using the three time lags of C IV lines which we find in this work we can reconstruct the BLR size—UV luminosity relation for that line. In Figure 4 we show this relation from Kaspi et al. (2007) with the three new points added in red. One point, for S5 0836+71, was reported in Kaspi et al. (2007) as a tentative result and after adding 8 more years of monitoring to the initial reported 5 years the time lag is confirmed. The black points shown in Figure 4 are from Peterson et al. (2005) as well as the BLR size—UV luminosity relation with a slope of 0.61 ± 0.05. Adding the one point of S5 0836+71 in Kaspi et al. (2007) changed the slope to 0.52 ± 0.05. In this work we updated the result for S5 0836+71 and added two more points. The updated slope, as seen in Figure 4, is 0.44 ± 0.02. We note that we did not include in this analysis the few additional time-lag measurements for C IV of high-luminosity quasars that are presented in these proceedings by Lira et al. (submitted). This will be done in a future publication (Kaspi et al., in preparation) and will probably further update the slope of that relation.
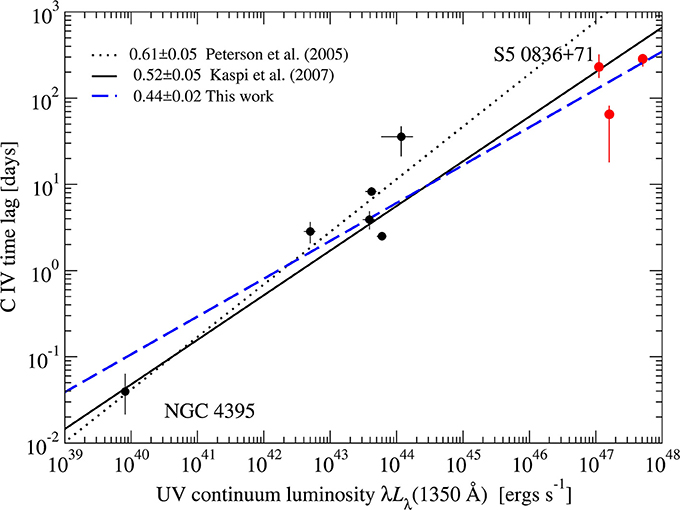
Figure 4. BLR size vs. UV luminosity relation based on the work of Kaspi et al. (2007) together with the three objects reported in this work. See text for details.
In summary, reverberation mapping of high-luminosity, high-redshift quasars is difficult to carry out and requires long monitoring periods of order of at least a decade and probably more. Our reverberation mapping project of a sample of such objects resulted in time lags for the C IV line of order a hundred to a few hundred days in the rest frame for objects with optical luminosity of order 1047 erg/sec. The measured black hole masses for these objects are of order which are the highest black hole masses measured thus far with reverberation mapping.
Author Contributions
SK, WB, DM, HN, DS, and OS comply with the requirements for authorship of this article.
Conflict of Interest Statement
The authors declare that the research was conducted in the absence of any commercial or financial relationships that could be construed as a potential conflict of interest.
References
Alexander, T. (1997). “Is AGN variability correlated with other AGN properties? - ZDCF analysis of small samples of aparse light curves,” in Astronomical Time Series, eds D. Maoz, A. Sternberg, and E. M. Leibowitz (Dordrecht: Kluwer Academic Publishers), 163–166.
Bahcall, J. N., Kozlovsky, B.-Z., and Salpeter, E. E. (1972). On the time dependence of emission-Line strengths from a photoionized nebula. Astrophys. J. 171, 467–482. doi: 10.1086/151300
Bentz, M. C., Peterson, B. M., Pogge, R. W., Vestergaard, M., and Onken, C. A. (2006). The radius-luminosity relationship for active galactic nuclei: the effect of host-galaxy starlight on luminosity measurements. Astrophys. J. 644, 133–142. doi: 10.1086/503537
Bentz, M. C., and Katz, S. (2015). The AGN black hole mass database. Publ. Astronom. Soc. Pacific 127, 67–73. doi: 10.1086/679601
Blandford, R. D., and McKee, C. F. (1982). Reverberation mapping of the emission line regions of Seyfert galaxies and quasars. Astrophys. J. 255, 419–439. doi: 10.1086/159843
Du, P., Hu, C., Lu, K.-X., Huang, Y.-K., Cheng, C., Qiu, J., et al. (2015). Supermassive black holes with high accretion rates in active galactic nuclei. IV. Hβ time lags and implications for super-eddington accretion. Astrophys. J. 806:22. doi: 10.1088/0004-637X/806/1/22
Edelson, R. A., and Krolik, J. H. (1988). The discrete correlation function - a new method for analyzing unevenly sampled variability data. Astrophys. J. 333, 646–659. doi: 10.1086/166773
Kaspi, S., Smith, P. S., Netzer, H., Maoz, D., Jannuzi, B. T., and Giveon, U. (2000). Reverberation measurements for 17 quasars and the size-mass-luminosity relations in active galactic nuclei. Astrophys. J. 533, 631–649. doi: 10.1086/308704
Kaspi, S., Brandt, W. N., Maoz, D., Netzer, H., Schneider, D. P., and Shemmer, O. (2007). Reverberation mapping of high-luminosity Quasars: first results. Astrophys. J. 659, 997–1007. doi: 10.1086/512094
Netzer, H., and Peterson, B. M. (1997). “Reverberation mapping and the physics of active galactic nuclei,” in Astronomical Time Series, eds D. Maoz, A. Sternberg, and E. Leibowitz (Dordrecht: Kluwer Academic Publishers), 85–108.
Onken, C. A., Ferrarese, L., Merritt, D., Peterson, B. M., Pogge, R. W., Vestergaard, M., et al. (2004). Supermassive black holes in active galactic nuclei. II. Calibration of the black hole mass-velocity dispersion relationship for active galactic nuclei. Astrophys. J. 615, 645–651. doi: 10.1086/424655
Peterson, B. M. (1993). Reverberation mapping of active galactic nuclei. Publ. Astronom. Soc. Pacific 105, 247–268. doi: 10.1086/133140
Peterson, B. M., Ferrarese, L., Gilbert, K. M., Kaspi, S., Malkan, M. A., Maoz, D., et al. (2004). Central masses and broad-line region sizes of active galactic nuclei. II. A homogeneous analysis of a large reverberation-mapping database. Astrophys. J. 613, 682–699. doi: 10.1086/423269
Peterson, B. M., Bentz, M. C., Desroches, L.-B., Filippenko, A. V., Ho, L. C., Kaspi, S., et al. (2005). Multiwavelength monitoring of the dwarf seyfert 1 galaxy NGC 4395. I. A reverberation-based measurement of the black hole mass. Astrophys. J. 632, 799–808. [10.1086/444494]10.1086/444494; Erratum: 2006, Astrophys. J. 641:638. doi: 10.1086/500409
Ramsey, L. W., Adams, M. T., Barnes, T. G., Booth, J. A., Cornell, M. E., Fowler, J. R., et al. (1998). “Early performance and present status of the Hobby-Eberly Telescope,” in Proceedings of the SPIE Advanced Technology Optical/IR Telescopes VI, ed L. M. Stepp, 34–42.
Shen, Y., Horne, K., Grier, C. J., Peterson, B. M., Denney, K. D., Trump, J. R., et al. (2016). The sloan digital sky survey reverberation mapping project: first broad-line Hβ and Mg ii lags at z > 0.3 from six-month spectroscopy. Astrophys. J. 818:30. doi: 10.3847/0004-637X/818/1/30
White, R. J., and Peterson, B. M. (1994). Comments on cross-correlation methodology in variability studies of active galactic nuclei. Publ. Astronom. Soc. Pacific 106, 879–889. doi: 10.1086/133456
Trevese, D., Perna, M., Vagnetti, F., Saturni, F. G., and Dadina, M. (2014). C IV and C III] reverberation mapping of the luminous quasar PG 1247+267. Astrophys. J. 795:164. doi: 10.1088/0004-637X/795/2/164
Keywords: quasars, black holes, reverberation mapping, broad line region, AGN
Citation: Kaspi S, Brandt WN, Maoz D, Netzer H, Schneider DP and Shemmer O (2017) Reverberation Mapping of High-Luminosity Quasars. Front. Astron. Space Sci. 4:31. doi: 10.3389/fspas.2017.00031
Received: 31 August 2017; Accepted: 12 October 2017;
Published: 30 October 2017.
Edited by:
Mauro D'Onofrio, Università degli Studi di Padova, ItalyReviewed by:
Milan S. Dimitrijevic, Belgrade Astronomical Observatory, SerbiaSiamak Akhshabi, Golestan University, Iran
Copyright © 2017 Kaspi, Brandt, Maoz, Netzer, Schneider and Shemmer. This is an open-access article distributed under the terms of the Creative Commons Attribution License (CC BY). The use, distribution or reproduction in other forums is permitted, provided the original author(s) or licensor are credited and that the original publication in this journal is cited, in accordance with accepted academic practice. No use, distribution or reproduction is permitted which does not comply with these terms.
*Correspondence: Shai Kaspi, shai@wise.tau.ac.il