Ultraviolet/Optical Emission of the Ionized Gas in AGN: Diagnostics of the Ionizing Source and Gas Properties
 Anna Feltre1,2*
  Stephane Charlot2 Marco Mignoli3
  Angela Bongiorno4 Francesco Calura3 Jacopo Chevallard5 Emma Curtis-Lake2 Roberto Gilli3 Adele Plat2
- 1Univ Lyon, Univ Lyon1, Ens de Lyon, Centre National de la Recherche Scientifique, Centre de Recherche Astrophysique de Lyon UMR5574, Saint-Genis-Laval, France
- 2Sorbonne Universités, UPMC-Centre National de la Recherche Scientifique, UMR7095, Institut d'Astrophysique de Paris, Paris, France
- 3INAF-Osservatorio Astronomico di Bologna, Bologna, Italy
- 4INAF-Osservatorio Astronomico di Roma, Monteporzio Catone, Italy
- 5Scientific Support Office, Directorate of Science and Robotic Exploration, European Space Research and Technology Centre (ESTEC), European Space Agency (ESA), Noordwijk, Netherlands
Spectroscopic studies of active galactic nuclei (AGN) are powerful means of probing the physical properties of the ionized gas within them. In particular, near future observational facilities, such as the James Webb Space Telescope (JWST), will allow detailed statistical studies of rest-frame ultraviolet and optical spectral features of the very distant AGN with unprecedented accuracy. In this proceedings, we discuss the various ways of exploiting new dedicated photoionization models of the narrow-line emitting regions (NLR) of AGN for the interpretation of forthcoming revolutionary datasets.
1. Introduction
Nebular emission lines observed in galaxy spectra contain valuable information about the nature of the ionizing source and physical conditions of the ionized gas within these same galaxies. Current (e.g., VLT-KMOS/MUSE, Keck-MOSFIRE) and future (e.g., the Near Infrared Spectrograph, NIRSpec, on-board JWST) near infrared spectrographs will provide ultraviolet, in addition to optical, rest-frame spectra of galaxies out to the epoch of Reionization. In this context, it is extremely important to develop physically motivated spectral models, along with analysis tools based on advanced statistical techniques, for the interpretation of the rest-frame optical/ultraviolet spectra of both active and inactive galaxies at all cosmic epochs. In section 2 we describe photoionization models of the AGN NLR. In the following Sections we show how (i) new ultraviolet, in addition to standard optical, spectral diagnostic diagrams allow one to distinguish between nuclear activity and star formation, (ii) these new models can be best used to understand the physical properties of the gas in the AGN NLR and (iii) the implementation of these AGN photoionization calculations in an innovative bayesian fitting code can help us best interpret current, and future, spectro-photometric data on active galaxies.
2. Spectral Models
The nebular emission of the AGN NLR is computed combining the AGN ionizing spectrum, described as a series of broken power laws (Equation 5 of Feltre et al., 2016), with the photoionization code CLOUDY (version c13.03, latest described in Ferland et al., 2013). The gas in the NLR is modeled with clouds of single type using the approach described in Feltre et al. (2016)1. The models are parametrized in terms of (i) the ultraviolet spectral index, α, of the incident radiation field, (ii) the ionization parameter, (iii) the hydrogen gas density of the clouds, (iv) the gas metallicity, and (v) the dust-to-heavy element mass ratio. A more detailed explanation of the physical parameters is provided in Feltre et al. (2016). Note that we have improved the original model grid by adding two new adjustable parameters, namely the inner radius of the NLR and the internal microturbulence velocity of the gas cloud. The addition of these two parameters have been found to be critical for reproducing high ionization emission-lines, such as N V λ1240 and C IV λ1550 (Mignoli et al., in prep., Feltre et al., in prep.). We also consider new generation photoionization calculations of the nebular emission from stars (Gutkin et al., 2016), parametrized in analogous way to the AGN NLR models. We remind the reader to the papers of Charlot and Longhetti (2001), Gutkin et al. (2016) for a detailed description of these spectral models.
3. Diagnostic Diagrams in the Ultraviolet
Standard diagnostic diagrams, based on ratios of optical emission-lines (such as [O III]λ5007, [N II]λ6584, [S II]λ6724, Hα and Hβ) are commonly used to distinguish between stellar and nuclear activity (e.g., Baldwin et al., 1981; Veilleux and Osterbrock, 1987). In addition to optical, we explored new diagnostics at ultraviolet wavelengths for three reasons: (i) future facilities will provide high quality rest-ultraviolet spectra of the most distant sources, (ii) models are usually calibrated on optical observations of the local Universe and this might not always be appropriated to study the emission from star-formation and interstellar gas at high redshift, and (iii) standard optical diagnostic diagrams might fail to distinguish between stellar and AGN activity at higher redshift (e.g., in the case of low metallicity Groves et al., 2006; Coil et al., 2015; Feltre et al., 2016; Hirschmann et al., 2017). Diagrams involving combinations of a collisionally excited metal line or line multiplet, such as C IV λλ1548, 1551, O III]λλ1661, 1666, N III]λ1750, [Si III]λ1883+Si III]λ1892 and [C III]λ1907+C III]λ1909, with the He II λ1640 recombination line have been found to allow a good distinction of the nature of the ionizing source as well as valuable constraints on interstellar gas parameters and the shape of the ionizing radiation (Feltre et al., 2016). Figure 1 shows the predictions from photoionization models of both AGN and star-forming galaxies, for different values of metallicity and ionization parameter in two diagnostic diagrams, namely C III]λ1909/He II λ1640 vs. C IV λ1550/He II λ1640 (left panel) and C IV λ1550/C III]λ1909 vs. C IV λ1550/He II λ1640 (right panel). Note that model predictions agree well with data measurements of AGN (Dors et al., 2014) and star-forming galaxies (Stark et al., 2014) currently available in the literature.
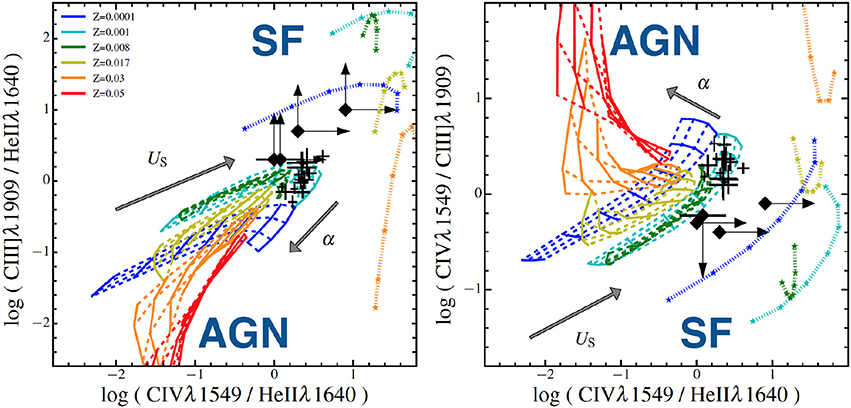
Figure 1. Predictions of the AGN NLR and star-forming galaxy models described in section 2 in the diagnostic diagrams C IV λ1550/He II λ1640 vs. C III]λ1909/He II λ1640 and C IV λ1550/C III]λ1909 (left and right, respectively). Dashed and continuous lines are AGN models corresponding to wide ranges in power-law index, α, and ionization parameter, −4.0 < log(U) < −1.0. Stars connected by dotted lines are star-forming galaxy models. All the models are shown for different metallicity Z (color coded as indicated on the left panel). Also shown in each panel are the observations of AGN (crosses with error bars) and star-forming galaxies (large diamonds with upper and lower limits) described in section 3.
4. Gas Metallicity in the NLR of z~2 Type 2 AGN
As case study, to illustrate a potential application of photoionization models described above (section 2), we compare the model predictions with the emission line measurements of a sample of C IV λ1550-selected Type 2 AGN (see section 4.1). The ionized gas in the NLR of AGN surrounds the black hole at the galaxy centre and it is likely connected to the nuclear star formation. By measuring the metal abundance of the ionized gas in the AGN NLR, we can obtain indirect information about the star formation history of the host galaxy.
4.1. Sample Description
To pursue our goals we appeal to VIMOS observations from the z-COSMOS Deep Survey (Lilly et al., 2007). We limited our study to the redshift range 1.45 < z < 3.05 to assure that the C IV λ1550 emission line is well covered by the observed spectral range. The presence of this feature in a galaxy spectrum is indicative of nuclear activity. We identified 192 C IV λ1550-selected objects, i.e., sources with a C IV λ1550 line intensity 5 times larger than the significance level. Out of these 192, we classified 90 sources as Type 2, i.e., narrow line, AGN (i.e., full width half maximum, FWHM, of the C IV λ1550 line lower than 2,000 km/s). From the rest-frame ultraviolet spectra of our sample of Type 2 AGN we measured fluxes, velocity dispersions and equivalent widths of the emission lines. Note that the AGN-selection effectiveness has been also confirmed by the ultraviolet diagnostic diagrams. The spectral observations, sample selection and data measurements will be presented in further details in Mignoli et al., in prep.
4.2. Gas Metallicity from Ultraviolet Emission-Lines
The C IV λ1550selected Type 2 AGN sample, described in section 4.1, is ideal to estimate the metal content of the ionized gas in the AGN NLR thanks to the simultaneous presence of two or more emission lines of Oxygen, Nitrogen and/or Carbon ions in the same spectra, along with the plethora of the other ultraviolet emission lines. In particular, we consider ratios of any possibile combination of the N V λ1240, N IV]λ1485, C IV λ1550, He II λ1640, C III]λ1909, C II]λ2326 and [Ne IV]λ2424 emission lines. We perform a spectral fitting by applying a simple least square minimization2 to infer the total Oxygen (both gas and dust phase) abundance, expressed as 12 + log(O/H)3. Note that, further improvements will include the exploitation of a new generation fitting tool, BEAGLE (Chevallard and Charlot, 2016, Chevallard et al., in prep.), based on sophisticated bayesian statistic techniques (see section 5).
We also compute the stellar masses of the host galaxy by appealing to a multi-band spectral energy distribution (SED) fitting technique (Bongiorno et al., 2012). A combination of AGN and host-galaxy templates is used to fit the large set of optical and near-infrared photometry from the Cosmic Evolution Survey (COSMOS; Scoville et al., 2007) available for our sources. The left panel of Figure 2 shows the NLR gas metallicity, 12+log(O/H), vs. the stellar mass. The first thing to note is that the fit favors models with solar (black dashed lines) or slightly subsolar metal content. This is in contrast with previous findings, where the N V λ1240/He II λ1640 ratio has been often found to be stronger than model predictions. Among the solutions, proposed in the literature, to explain this high N V λ1240/He II λ1640 ratio, there are very high metallicities (up to 5–10 time solar metallicity) and “selectively” enhanced Nitrogen (e.g., Hamann and Ferland, 1992, 1993; Shemmer and Netzer, 2002; Nagao et al., 2006). Solving this problem was one of the main reason for the update of the AGN NRL models of Feltre et al. (2016) with additional physical parameters (i.e., NLR inner radius and internally microturbulent clouds). We also do not observed any correlation between the metallicity and the stellar mass of the host galaxy. One can interpret this as a missing link between the gas in the NLR and the interstellar gas in the galaxy. Nevertheless, our analysis is based on a restricted range of stellar masses and the stellar mass host estimates depends both on the templates and fitting technique used for the analysis. To have a more comprehensive analysis, we plan to derive both metallicity and stellar masses from the same fitting technique, based on advanced statistical methods (see section 5).
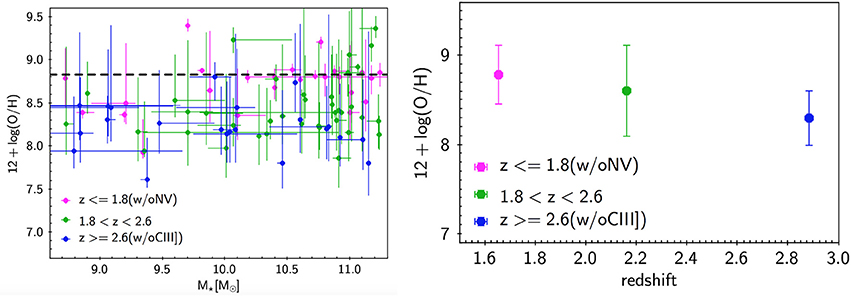
Figure 2. Left: AGN NLR gas metallicity, in terms of Oxygen abundance 12 + log(O/H), for the C IV λ1550-selected Type 2 AGN described in section 4.1 vs. stellar masses of the host galaxies The measurements are color coded for different redshift bins as shown in the legend. The black dashed line indicates the value of the solar metallicity, Z⊙ = 0.01524, used in the models described in section 2. Right: Oxygen abundance, 12 + log(O/H), of the AGN NLR averaged for three redshift bins as labeled in the legend.
The right panel of Figure 2 suggests a decrease of metallicity with increasing redshift. Despite previous findings in the literature, where no evidence for a redshift evolution of the metallicity in AGN was found (Nagao et al., 2006), a lower metal content moving in more distant sources is what one would expect from models of cosmic chemical evolution. Note also, that the observed trend in Figure 2 is opposite to the trend, commonly observed in the literature, introduced by the presence of the N V λ1240 line which was favoring very high metallicities, as discussed above.
5. SED Fitting Tool
Future plans include the implementation of the AGN NLR models in a fitting tool based on sophisticated fitting technique, i.e., BEAGLE (Chevallard and Charlot, 2016, Chevallard et al., in prep.). Briefly, BEAGLE combines in a coherent way emission from different components (stars, gas, dust, AGN), adopts Bayesian approach to obtain posterior probability distribution functions of every model parameter and includes predictions from galaxy formation models. BEAGLE allows to chose between different options based on the user's aims: (i) to fit spectro-photometric data at ultaviolet to infrared wavelengths, (ii) to create synthetic catalogs of galaxy SEDs and (iii) to the study retrievability of galaxy physical parameters for different type of observations. BEAGLE can handle data from broad-band photometry and/or spectroscopic information (e.g., full spectra, emission line intensities or equivalent widths). With the implementation of the AGN NRL photoionization models, BEAGLE will be an ideal tool to (i) fit ultraviolet/optical spectra of obscured AGN at any redshift, (ii) study the effects of the presence of AGN with different accretion luminosities on the ultraviolet/optical spectral features of a galaxy spectrum and (iii) to produce mock catalogs of ultraviolet/optical spectra of Type 2 AGN.
6. Conclusions
In the previous Sections we have described new photoinization calculations for the NLR of AGN. We showed how ratios of emission-lines at ultraviolet wavelengths are good diagnostics of the ionizing source (nuclear vs. stellar activity). Moreover, photoionization models are useful tools for the study of the physical properties of the ionized gas (e.g., metallicity, density) of AGN and they can be easily implemented in fitting tools to interpret current spectroscopic observations of high redshift sources. The exploitation of these spectral models and analysis tools will be particularly useful to interpret observations of high-redshift galaxies with future facilities, such as the James Webb Space Telescope and extremely large ground-based telescopes, which will push previous studies up to the epoch of reionization (z>7).
Author Contributions
AF and SC developed the spectral models and the diagnostic diagrams. MM assembled the sample, performed the spectral measurements and coordinated the analysis, in collaboration with AF, AB, FC, and RG. AF, AP, EC, JC, and SC all contributed at the implementation of the AGN module within the fitting code BEAGLE.
Conflict of Interest Statement
The handling Editor declared a shared affiliation, though no other collaboration, with one of the authors, AB.
The authors declare that the research was conducted in the absence of any commercial or financial relationships that could be construed as a potential conflict of interest.
Acknowledgments
AF, AP, EC, and SC acknowledge support from the ERC via an Advanced Grant under grant agreement no. 321323-NEOGAL. AF acknowledges support from the ERC via an Advanced Grant under grant agreement no. 339659-MUSICOS. Part of this study is based on observations made with ESO Telescopes at the La Silla or Paranal Observatories under programme ID 175.A-0839 (zCOSMOS redshits survey). Part of the analysis presented in this work was done with TOPCAT (http://www.star.bris.ac.uk/~mbt/topcat/), developed by M. Taylor.
Footnotes
1. ^Predictions of the intensities of the main optical and ultraviolet emission-lines are available through http://www.iap.fr/neogal/models.html
2. ^Note that we consider a galactic attenuation curve (Cardelli et al., 1989), for consistency with the fitting procedure used to derive the host galaxy stellar masses.
3. ^For a direct translation between metallicity, Z, and Oxygen abundance we remind to Table 2 of Gutkin et al. (2016), where solar metallicity Z⊙ = 0.01524 correspond to 12 + log(O/H) = 8.83
References
Baldwin, J. A., Phillips, M. M., and Terlevich, R. (1981). Classification parameters for the emission-line spectra of extragalactic objects. Publ. Astron. Soc. Pac. 93, 5–19. doi: 10.1086/130766
Bongiorno, A., Merloni, A., Brusa, M., Magnelli, B., Salvato, M., Mignoli, M., et al. (2012). Accreting supermassive black holes in the COSMOS field and the connection to their host galaxies. Mon. Not. R. Astron. Soc. 427, 3103–3133. doi: 10.1111/j.1365-2966.2012.22089.x
Cardelli, J. A., Clayton, G. C., and Mathis, J. S. (1989). The relationship between infrared, optical, and ultraviolet extinction. Astrophys. J. 345, 245–256. doi: 10.1086/167900
Charlot, S., and Longhetti, M. (2001). Nebular emission from star-forming galaxies. Mon. Not. R. Astron. Soc., 323, 887–903. doi: 10.1046/j.1365-8711.2001.04260.x
Chevallard, J., and Charlot, S. (2016). Modelling and interpreting spectral energy distributions of galaxies with BEAGLE. Mon. Not. R. Astron. Soc. 462, 1415–1443. doi: 10.1093/mnras/stw1756
Coil, A. L., Aird, J., Reddy, N., Shapley, A. E., Kriek, M., Siana, B., et al. (2015). The MOSDEF Survey: optical Active Galactic Nucleus Diagnostics at z~2.3. Astrophys. J. 801:35. doi: 10.1088/0004-637X/801/1/35
Dors, O. L., Cardaci, M. V., Hägele, G. F., and Krabbe, Â. C. (2014). Metallicity evolution of AGNs from UV emission lines based on a new index. Mon. Not. R. Astron. Soc. 443, 1291–1300. doi: 10.1093/mnras/stu1218
Feltre, A., Charlot, S., and Gutkin, J. (2016). Nuclear activity versus star formation: emission-line diagnostics at ultraviolet and optical wavelengths. Mon. Not. R. Astron. Soc. 456, 3354–3374. doi: 10.1093/mnras/stv2794
Ferland, G. J., Porter, R. L., van Hoof, P. A. M., Williams, R. J. R., Abel, N. P., Lykins, M. L., et al. (2013). The 2013 release of cloudy. Rev. Mex. Astron. Astrofis 49, 137–163.
Groves, B. A., Heckman, T. M., and Kauffmann, G. (2006). Emission-line diagnostics of low-metallicity active galactic nuclei. Mon. Not. R. Astron. Soc. 371, 1559–1569. doi: 10.1111/j.1365-2966.2006.10812.x.
Gutkin, J., Charlot, S., and Bruzual, G. (2016). Modelling the nebular emission from primeval to present-day star-forming galaxies. Mon. Not. R. Astron. Soc. 462, 1757–1774. doi: 10.1093/mnras/stw1716
Hamann, F. and Ferland, G. (1992). The age and chemical evolution of high-redshift QSOs. Astrophys. J. 391, L53–L57.
Hamann, F., and Ferland, G. (1993). The chemical evolution of QSOs and the implications for cosmology and galaxy formation. Astrophys. J. 418:11.
Hirschmann, M., Charlot, S., Feltre, A., Naab, T., Choi, E., Ostriker, J. P., et al. (2017). Synthetic nebular emission from massive galaxies I: origin of the cosmic evolution of optical emission-line ratios. ArXiv e-prints. doi: 10.1093/mnras/stx2180
Lilly, S. J., Le Fèvre, O., Renzini, A., Zamorani, G., Scodeggio, M., Contini, T., et al. (2007). zCOSMOS: a large VLT/VIMOS redshift survey covering 0 < z < 3 in the COSMOS field. Astrophys. J. 172, 70–85. doi: 10.1086/516589
Nagao, T., Maiolino, R., and Marconi, A. (2006). Gas metallicity diagnostics in star-forming galaxies. Astron. Astrophys. 459, 85–101. doi: 10.1051/0004-6361:20065216
Scoville, N., Aussel, H., Brusa, M., Capak, P., Carollo, C. M., Elvis, M., et al. (2007). The cosmic evolution survey (COSMOS): overview. Astrophys. J. Suppl. Ser. 172, 1–8. doi: 10.1086/516585
Shemmer, O., and Netzer, H. (2002). Is there a metallicity-luminosity relationship in active galactic nuclei? The case of narrow-line seyfert 1 galaxies. Astrophys. J. 567, L19–L22. doi: 10.1086/339797
Stark, D. P., Richard, J., Siana, B., Charlot, S., Freeman, W. R., Gutkin, J., et al. (2014). Ultraviolet emission lines in young low-mass galaxies at z≃2: physical properties and implications for studies at z>7. Mon. Not. R. Astron. Soc. 445, 3200–3220. doi: 10.1093/mnras/stu1618
Keywords: active galaxies, emission lines, ultraviolet, spectral models, spectroscopy
Citation: Feltre A, Charlot S, Mignoli M, Bongiorno A, Calura F, Chevallard J, Curtis-Lake E, Gilli R and Plat A (2017) Ultraviolet/Optical Emission of the Ionized Gas in AGN: Diagnostics of the Ionizing Source and Gas Properties. Front. Astron. Space Sci. 4:32. doi: 10.3389/fspas.2017.00032
Received: 30 August 2017; Accepted: 19 October 2017;
Published: 02 November 2017.
Edited by:
Paola Marziani, Osservatorio Astronomico di Padova (INAF), ItalyReviewed by:
José María Solanes, University of Barcelona, SpainMilan S. Dimitrijevic, Astronomical Observatory, Serbia
Copyright © 2017 Feltre, Charlot, Mignoli, Bongiorno, Calura, Chevallard, Curtis-Lake, Gilli and Plat. This is an open-access article distributed under the terms of the Creative Commons Attribution License (CC BY). The use, distribution or reproduction in other forums is permitted, provided the original author(s) or licensor are credited and that the original publication in this journal is cited, in accordance with accepted academic practice. No use, distribution or reproduction is permitted which does not comply with these terms.
*Correspondence: Anna Feltre, anna.feltre@univ-lyon1.fr