Rapid BAL Variability: Re-Emerging Absorption
 Damla Erakuman
 Nurten Filiz Ak
- 1Department of Astronomy and Space Sciences, Faculty of Science, Erciyes University, Kayseri, Turkey
- 2Astronomy and Space Sciences Observatory and Research Center, Erciyes University, Kayseri, Turkey
We study BAL variations of SDSS J141955.28+522741.4 utilizing 32 epochs of spectroscopic observations from SDSS. We identify three individual BAL troughs for C iv and one BAL trough for Si iv. The deepest C iv BAL trough shows significant EW variations in timescales of a few 10 h. The fast component of the deepest C iv BAL presents disappearance and re-emergence preserving its initial velocity range and profile. All identified BAL troughs show coordinated variations supporting that the possible mechanism behind variations are the ionization level changes of the absorbing gas.
1. Introduction
Quasar winds are the fastest outflows in the universe and they are observed as blue-shifted Broad Absorption Lines (BALs) in quasar spectra. Quasar winds are substantial part of the nuclear environment; fast outflows play a key role on galaxy feedback by evacuating gas and heat to the host galaxy (Di Matteo et al., 2005; Springel et al., 2005; King, 2010). Therefore, understanding the mechanisms behind these outflows would shed light on dynamics and evolution of super-massive black holes.
BAL troughs observed in quasar spectra present characteristic variations in their equivalent widths (EW), line profiles, and velocities (Barlow et al., 1992; Lundgren et al., 2007; Filiz Ak et al., 2012, 2013, 2014). The timescales of significant variations ranges between a few years to a few tens of hours (Capellupo et al., 2012; Filiz Ak et al., 2012, 2013, 2014; Grier et al., 2015).
In this study, we investigate BAL variations in multi-epoch spectroscopic observations of SDSS J141955.28+522741.4 (hereafter J1419). The Sloan Digital Sky Survey (SDSS) DR 12 Quasar Catalog lists MJD-PLATE-FiberID key parameters for 32 spectroscopic observations of J1419 and the catalog categorizes J1419 as a BAL quasar with z = 2.14 (Pâris et al., 2017). Frequent observations allow us to investigate significant rapid BAL variations and correlated variations of multiple BAL troughs.
The main driving mechanisms behind the BAL variations is largely debated in the literature. One scenario involves transverse motion of absorbing gas across the observer's line of sight producing changes in the coverage fraction (e.g., Rogerson et al., 2016). A second scenario considers ionization level changes of the outflowing gas (e.g., Filiz Ak et al., 2013, 2014). Other scenarios (e.g., intrinsic instabilities of an absorbing gas driving BAL variations) are usually found potential but problematic (Capellupo et al., 2012).
2. Observations and Data Preparation
SDSS BOSS carried out spectroscopic observations of 297301 quasars using a 2.5 m dedicated telescope at Apache Point Observatory (Gunn et al., 2006) between 2009 and 2014 (Eisenstein et al., 2011; Dawson et al., 2013). The main aim of BOSS is to map the spatial distribution of luminous red galaxies and quasars to detect the characteristic scale imprinted by baryon acoustic oscillations in the early universe. Spectral wavelength coverage of BOSS is between 3,600 and 10,400 Å with a spectral resolution varying between 1,300 and 3,000 (Smee et al., 2013).
SDSS obtained 32 spectroscopic observations of J1419 between MJD 56397 and MJD 56837 with a time spread of 140 days in the quasar rest frame. We follow some simple steps to prepare the spectra: We correct the Galactic extinction using a Milky Way extinction model (Cardelli et al., 1989) for Rv = 3.1 and AV values from Schlafly and Finkbeiner (2011). We fit the continuum with a power-law model that is intrinsically reddened using SMC-like reddening model from Pei (1992). We transform all the available spectra to the quasars rest frame using visually inspected redshift value of z = 2.14 (Pâris et al., 2017).
To detect BAL troughs, we follow classical BAL definition that requires absorption lines to have velocity widths > 2,000 km s−1, and reach at least 10% under the continuum level (Weymann et al., 1991). Considering the variable nature of BAL troughs, we follow Filiz Ak et al. (2013) to determine BAL complexes using multiple-epoch observations.
We identify three individual C IV BAL troughs that are denoted as CA, CB, and CC. Their minimum and maximum velocity limits (vmin and vmax, respectively) are as follows: −2,000 and −7,800 km s−1 for CA, −8,200 and −10,200 km s−1 for CB and −11,200 and −15,600 km s−1 for CC. We also find a Si IV BAL trough that have vmin and vmax velocities similar to that of CA. Multi-epoch observations show that CA is a BAL trough complex, rather than a single trough with at least two constituent absorption features (see Figure 1). Similarly, the detected Si IV BAL trough is likely to be a BAL complex.
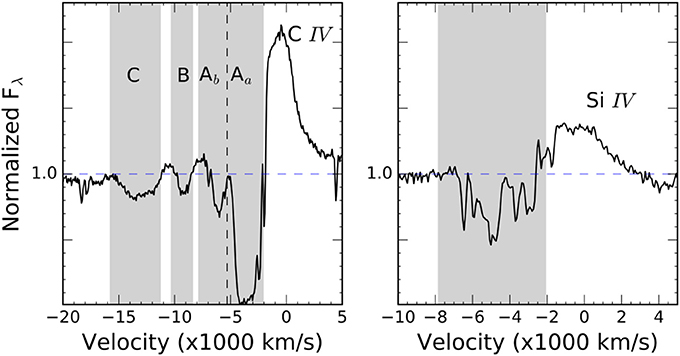
Figure 1. C IV and Si IV emission lines and their BAL regions in the mean spectrum calculated from 32 continuum normalized observations of J1419. The three identified C IV BALs (A, B, and C) and one Si IV BAL are shown in gray areas. The dashed vertical line on CA separates two main components of the BAL complex. The dashed horizontal line indicates normalized flux density of 1.0.
Figure 1 shows emission lines and absorption regions for C IV and Si IV transitions in mean spectrum. The mean spectrum is calculated by averaging the 32 spectra for a given wavelength. Figure 1 shows the identified C IV BAL troughs CA, CB, and CC, and Si IV BAL trough.
3. Analysis and Results
Traditionally, BAL variability has been assessed considering the time-dependent variations of EWs measured for the identified absorption features. Thus, we measure EW and uncertainties on EW using Equations 1 and 2 of Kaspi et al. (2002). In order to study time dependent variations on EW, we calculate ΔEW = EW2−EW1 where EW2 is BAL trough EW measured in a latter epoch of the two consecutive spectra. The uncertainties on EW1 and EW2 are propagated to calculate uncertainty on ΔEW.
3.1. Rapid BAL Variations
In order to identify significant rapid variations, we require EW to be larger than 5σ for two consecutive observations. The ΔEW measurements fulfill this criterion three times with timescales of 1.3 days (5.1σ), 3.8 days (5.03σ), and 4.1 days (6.5σ). These results show that the most rapid significant variation occurs in timescales as short as ~ 31 h.
Grier et al. (2015) shows that the shortest timescale variation of SDSS J141007.74+541203.3. occurred in ~1.2 rest frame days at 4.67σ. Our finding for J1419 agrees with the results of Grier et al. (2015) indicating that BAL variability on timescales of a few 10 h is likely to be a common behavior.
3.2. Disappearance and Emergence Events
Trough A of C IV is the most significant BAL complex in these spectra and appears to have at least two constituents. The deepest constituent (CAa) lies in low velocity ranges. The high velocity constituent of CA (CAb) presents the strongest variations in multi-epoch observations. We note that CAb fulfills the traditional BAL criteria only a few times in these available 32 spectra. Definition of a BAL trough complex by Filiz Ak et al. (2012) considers multi-epoch observations rather than a single spectrum. According to this definition, absorption trough is considered as a BAL complex when multiple individual BAL troughs merged in at least one of the available observations (for details, see Filiz Ak et al., 2012). Given that CAa and CAb appears merged in more than one available spectra, we consider CA to be a BAL complex with multiple constituents.
Figure 2 shows spectra for CA at five different epochs where BAL strength variations, disappearance, and re-emergence events can be seen. The top panel of the figure shows the first spectrum of J1419 obtained by SDSS and thus t = 0 days. The spectrum on the second panel is observed at t ~ 118 days where CAb weakens. The third panel shows disappearance event at t ~ 126 days. Only ~ 2 days after the disappearance CAb starts regaining its strength. The bottom panel shows that CAb is almost fully recovered its strength while conserving initial velocity range and profile. These observations show that re-emergence of CAb occurred in ~ 4 days.
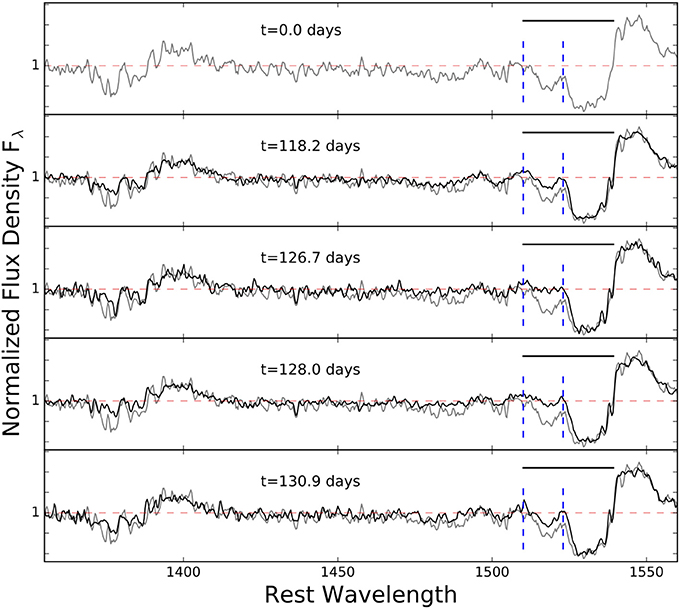
Figure 2. Five epoch observations of J1419 illustrating BAL strength variations. The first epoch spectrum on the top panel is also shown other panels for guidance. The dashed red line indicates the continuum level and the horizontal black line shows CA BAL region. The high velocity component of the trough (CAb) is marked with dashed blue lines. Middle panel spectrum at t = 126.7 days presents the disappearance event.
3.3. Coordinated Variations
We measure EW values for all the identified BAL troughs in 32 epochs of strength spectrum for J1419. Figure 3 shows time-dependent EW variations for CA, CB, CC, and Si IV BAL troughs. Strengthening and weakening of these four individual BAL troughs appears to be synchronized.
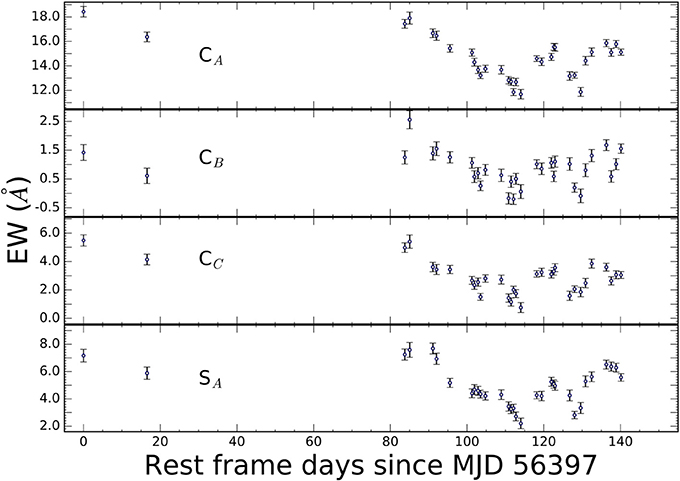
Figure 3. Time dependent EW variations, respectively from top to bottom, for C IV troughs A, B, and C and Si IV trough. BAL EW variations of individual troughs have strong significant correlation.
In order to search for possible correlation between EW variations of individual BAL troughs, we use Spearman rank correlation test. BAL trough complexes of C IV (i.e., CA) and Si IV are both present in the corresponding velocity ranges thus suggesting that both of them are created by the same absorbing material. Therefore, coordinated variations of these BAL complexes is expected (e.g., Filiz Ak et al., 2013). Indeed, we found that these two BAL complexes show 92% correlation (p = 10−14) of the time-dependent EW variations.
Trough CA and CB have a velocity separation of 4, 300 km s−1 from center to center indicating that the absorbing material responsible of these lines is not the same. The time-dependent EW variations of these two BAL have a Spearman rank correlation coefficient of 80% with p = 10−8. Similar to that troughs CA and CC have a velocity separation of 8,300 km s−1 and their EW light curves show 92% correlated with p = 10−14.
4. Discussion
We investigate 32 epochs of spectrum for J1419 to assess characteristics of its BAL variations. We identify three individual C IV BAL troughs that one of them appear to have at least two constituent absorption features. In addition, we identify a Si IV BAL trough that lies in similar velocity ranges of the slowest C IV BAL trough. Studying time-dependent EW variations for these BAL troughs, we highlighted three main findings: (1) The strongest BAL trough of J1419 (i.e., CA) show a rapid significant variation at timescales of ~31 h where EW variations are as strong as 5.1σ. (2) The faster component of CA disappears and re-emerges in a short timescale. The BAL component starts weakening compared to the first epoch spectra and disappears at t = 126.7 days. Following observations show that the component regains its strength within 4 days. (3) The time-dependent EW variations of four BAL troughs identified in J1419 spectra show strong and significant correlations where Spearman rank correlation coefficients are larger than 80%.
The shortest timescale BAL variation is presented by Grier et al. (2015) showing that a significant (4.67σ) EW variation is detected for C IV BAL trough of SDSS J141007.74+541203.3 at timescales as short as 1.2 days. Given that our findings is consistent with that of Grier et al. (2015), BAL EW variations over timescales of a few 10 h is likely to be a common behavior. In order to assess this suggestion, a larger number of quasars with frequent spectroscopic observations should be investigated.
Time dependent EW variability of BAL troughs is largely investigated at the timescales of years (e.g., Barlow et al., 1992; Lundgren et al., 2007; Capellupo et al., 2012; Filiz Ak et al., 2012, 2013, 2014). So far, however, only a small number of disappearance events are recorded (Filiz Ak et al., 2012; McGraw et al., 2017). The number of quasars presenting BAL re-emergence is only a few (e.g., Lundgren et al., 2007; Filiz Ak et al., 2012; Rogerson et al., 2016). Our findings show that J1419 is the first example of BAL disappearance and re-emergence at timescales as short as ~4 days.
All the other BAL troughs present in J1419 spectra show weakening and strengthening while CAb disappears and re-emerges suggesting that the BAL variability is not due to bulk motion of the absorbers. Furthermore, event of re-emergence in less than 14 days support that bulk motion is not the likely scenario to explain BAL variations for J1419.
Coordinated EW variations of BAL troughs that have a large velocity separations in between suggest that cause of BAL variability should effect a large portion of the BAL region for a quasar. Therefore, we conclude that BAL variations is not due to intrinsic instabilities of an absorbing gas. Our finding favor a scenario in which a change in ionization state of the absorbing gas is likely to be dominant mechanism to drive the BAL variability.
For further analysis, we assess emission line variations and photometric variations in coordination with BAL variations. Therefore, physical constraints will be discussed on the light of current models.
Author Contributions
All authors listed have made a substantial, direct and intellectual contribution to the work, and approved it for publication.
Conflict of Interest Statement
The authors declare that the research was conducted in the absence of any commercial or financial relationships that could be construed as a potential conflict of interest.
Acknowledgments
We would like to thank referees for their comments. Thanks to TUBITAK (115F037) and ERU BAP (FYL 2016-6938) for financial support.
Funding for SDSS-III has been provided by Alfred P. Sloan Foundation, the Participating Institutions, The National Science Foundation, and the U. S. Department of Energy Office of Science. The SDSS-III web site is http://www.sdss3.org/.
SDSS-III is managed by the Astrophysical Research Consortium for the Participating Institutions of the SDSS-III Collaboration including the University of Arizona, the Brazilian Participation Group, Brookhaven National Laboratory, Carnegie Mellon University, University of Florida, the French Participation Group, the German Participation Group, Harvard University, the Instituto de Astrofisica de Canarias, the Michigan State/Notre Dame/JINA Participation Group, Johns Hopkins University, Lawrence Berkeley National Laboratory, Max Planck Institute for Astrophysics, Max Planck Institute for Extraterrestrial Physics, New Mexico State University, New York University, Ohio State University, Pennsylvania University, University of Portsmouth, Princeton University, the Spanish Participation Group, University of Tokyo, University of Utah, Vanderbilt University, University of Virginia, University of Washington, and Yale University.
References
Barlow, T. A., Junkkarinen, V. T., and Burbidge, E. M. (1992). “Variable broad absorption-lines in the QSO H 0846+1540,” in American Astronomical Society Meeting Abstracts, Vol. 24 of Bulletin of the American Astronomical Society (Phoenix, AZ; Tempe, AZ), 1135.
Capellupo, D. M., Hamann, F., Shields, J. C., Rodríguez Hidalgo, P., and Barlow, T. A. (2012). Variability in quasar broad absorption line outflows - II. Multi-epoch monitoring of Si IV and C IV broad absorption line variability. Mon. Not. R. Astron. Soc. 422, 3249–3267. doi: 10.1111/j.1365-2966.2012.20846.x
Cardelli, J. A., Clayton, G. C., and Mathis, J. S. (1989). The relationship between infrared, optical, and ultraviolet extinction. Astrophys. J. 345, 245–256. doi: 10.1086/167900
Dawson, K. S., Schlegel, D. J., Ahn, C. P., Anderson, S. F., Aubourg, É., Bailey, S., et al. (2013). The Baryon Oscillation Spectroscopic Survey of SDSS-III. Astron. J. 145:10. doi: 10.1088/0004-6256/145/1/10
Di Matteo, T., Springel, V., and Hernquist, L. (2005). Energy input from quasars regulates the growth and activity of black holes and their host galaxies. Nature 433, 604–607. doi: 10.1038/nature03335
Eisenstein, D. J., Weinberg, D. H., Agol, E., Aihara, H., Allende Prieto, C., Anderson, S. F., et al. (2011). SDSS-III: massive spectroscopic surveys of the distant universe, the milky way, and extra-solar planetary systems. Astron. J. 142:72. doi: 10.1088/0004-6256/142/3/72
Filiz Ak, N., Brandt, W. N., Hall, P. B., Schneider, D. P., Anderson, S. F., Gibson, R. R., et al. (2012). Broad absorption line disappearance on multi-year timescales in a large quasar sample. Astrophys. J. 757:114. doi: 10.1088/0004-637X/757/2/114
Filiz Ak, N., Brandt, W. N., Hall, P. B., Schneider, D. P., Anderson, S. F., Hamann, F., et al. (2013). Broad Absorption Line Variability on Multi-year Timescales in a Large Quasar Sample. Astrophys. J. 777:168. doi: 10.1088/0004-637X/777/2/168
Filiz Ak, N., Brandt, W. N., Hall, P. B., Schneider, D. P., Trump, J. R., Anderson, S. F., et al. (2014). The dependence of C IV broad absorption line properties on accompanying Si IV and Al III absorption: relating quasar-wind ionization levels, kinematics, and column densities. Astrophys. J. 791:88. doi: 10.1088/0004-637X/791/2/88
Grier, C. J., Hall, P. B., Brandt, W. N., Trump, J. R., Shen, Y., Vivek, M., et al. (2015). The sloan digital sky survey reverberation mapping project: rapid CIV broad absorption line variability. Astrophys. J. 806:111. doi: 10.1088/0004-637X/806/1/111
Gunn, J. E., Siegmund, W. A., Mannery, E. J., Owen, R. E., Hull, C. L., Leger, R. F., et al. (2006). The 2.5 m Telescope of the sloan digital sky survey. Astron. J. 131, 2332–2359. doi: 10.1086/500975
Kaspi, S., Brandt, W. N., George, I. M., Netzer, H., Crenshaw, D. M., Gabel, J. R., et al. (2002). The ionized gas and nuclear environment in NGC 3783. I. Time-averaged 900 kilosecond chandra grating spectroscopy. Astrophys. J. 574, 643–662. doi: 10.1086/341113
King, A. R. (2010). Black hole outflows. Mon. Not. R. Astron. Soc. 402, 1516–1522. doi: 10.1111/j.1365-2966.2009.16013.x
Lundgren, B. F., Wilhite, B. C., Brunner, R. J., Hall, P. B., Schneider, D. P., York, D. G., et al. (2007). Broad absorption line variability in repeat quasar observations from the sloan digital sky survey. Astrophys. J. 656, 73–83. doi: 10.1086/510202
McGraw, S. M., Brandt, W. N., Grier, C. J., Filiz Ak, N., Hall, P. B., Schneider, D. P., et al. (2017). Broad absorption line disappearance and emergence using multiple-epoch spectroscopy from the Sloan Digital Sky Survey. Mon. Not. R. Astron. Soc. 469, 3163–3184. doi: 10.1093/mnras/stx1063
Pâris, I., Petitjean, P., Ross, N. P., Myers, A. D., Aubourg, É., Streblyanska, A., et al. (2017). The sloan digital sky survey quasar catalog: twelfth data release. Astron. Astrophys. 597:A79. doi: 10.1051/0004-6361/201527999
Pei, Y. C. (1992). Interstellar dust from the Milky Way to the Magellanic Clouds. Astrophys. J. 395, 130–139. doi: 10.1086/171637
Rogerson, J. A., Hall, P. B., Rodríguez Hidalgo, P., Pirkola, P., Brandt, W. N., and Filiz Ak, N. (2016). Multi-epoch observations of extremely high-velocity emergent broad absorption. Mon. Not. R. Astron. Soc. 457, 405–420. doi: 10.1093/mnras/stv3010
Schlafly, E. F., and Finkbeiner, D. P. (2011). Measuring reddening with sloan digital sky survey stellar spectra and recalibrating SFD. Astrophys. J. 737:103. doi: 10.1088/0004-637X/737/2/103
Smee, S. A., Gunn, J. E., Uomoto, A., Roe, N., Schlegel, D., Rockosi, C. M., et al. (2013). The Multi-object, fiber-fed spectrographs for the sloan digital sky survey and the baryon oscillation spectroscopic survey. Astron. J. 146:32. doi: 10.1088/0004-6256/146/2/32
Springel, V., Di Matteo, T., and Hernquist, L. (2005). Modelling feedback from stars and black holes in galaxy mergers. Mon. Not. R. Astron. Soc. 361, 776–794. doi: 10.1111/j.1365-2966.2005.09238.x
Keywords: galaxies, active galaxies, kinematics and dynamics, galaxies, nuclei, quasars, absorption lines
Citation: Erakuman D and Filiz Ak N (2017) Rapid BAL Variability: Re-Emerging Absorption. Front. Astron. Space Sci. 4:36. doi: 10.3389/fspas.2017.00036
Received: 23 August 2017; Accepted: 24 October 2017;
Published: 08 November 2017.
Edited by:
Mauro D'Onofrio, Università degli Studi di Padova, ItalyReviewed by:
Fabio La Franca, Università degli Studi Roma Tre, ItalyDaniela Bettoni, Osservatorio Astronomico di Padova (INAF), Italy
Copyright © 2017 Erakuman and Filiz Ak. This is an open-access article distributed under the terms of the Creative Commons Attribution License (CC BY). The use, distribution or reproduction in other forums is permitted, provided the original author(s) or licensor are credited and that the original publication in this journal is cited, in accordance with accepted academic practice. No use, distribution or reproduction is permitted which does not comply with these terms.
*Correspondence: Damla Erakuman, damla.erakuman@gmail.com
Nurten Filiz Ak, nfak@erciyes.edu.tr